
Effects of Deposition Strategy and Preheating Temperature on Thermo-Mechanical Characteristics of Inconel 718 Super-Alloy Deposited on AISI 1045 Substrate Using a DED Process


Abstract
:1. Introduction
2. Finite Element Analysis (FEA) and Experiments
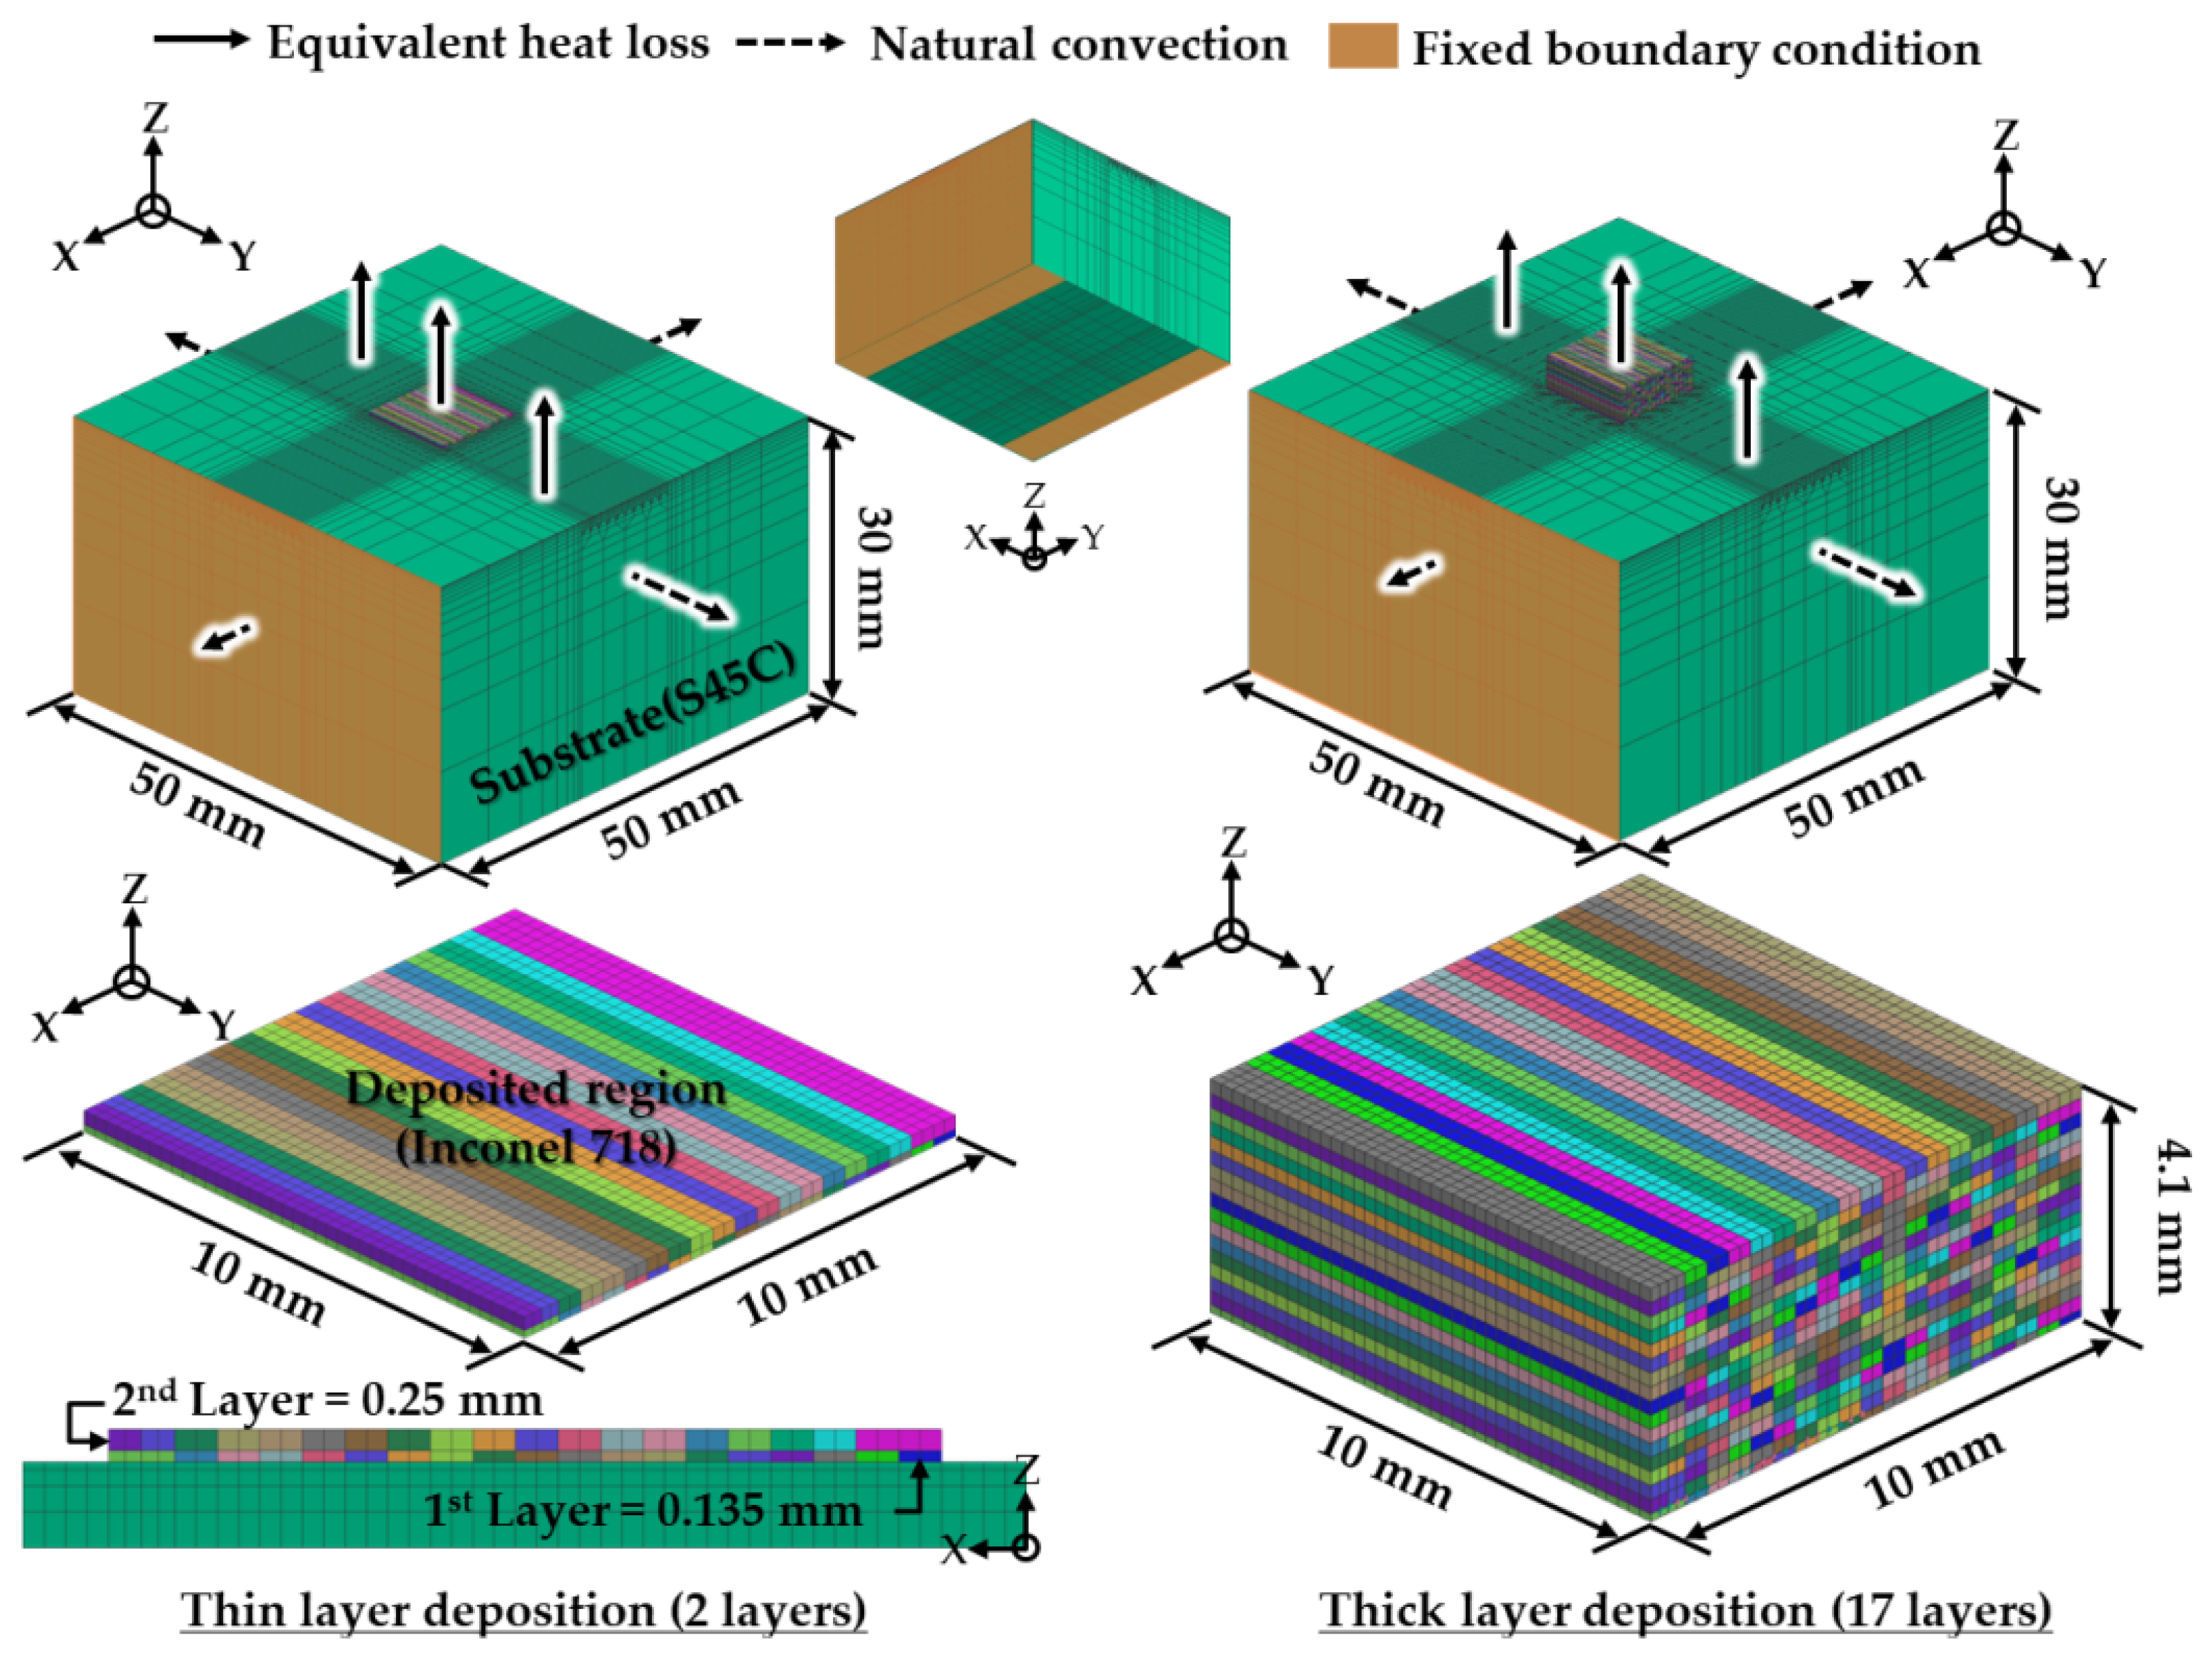
2.1. FEAs
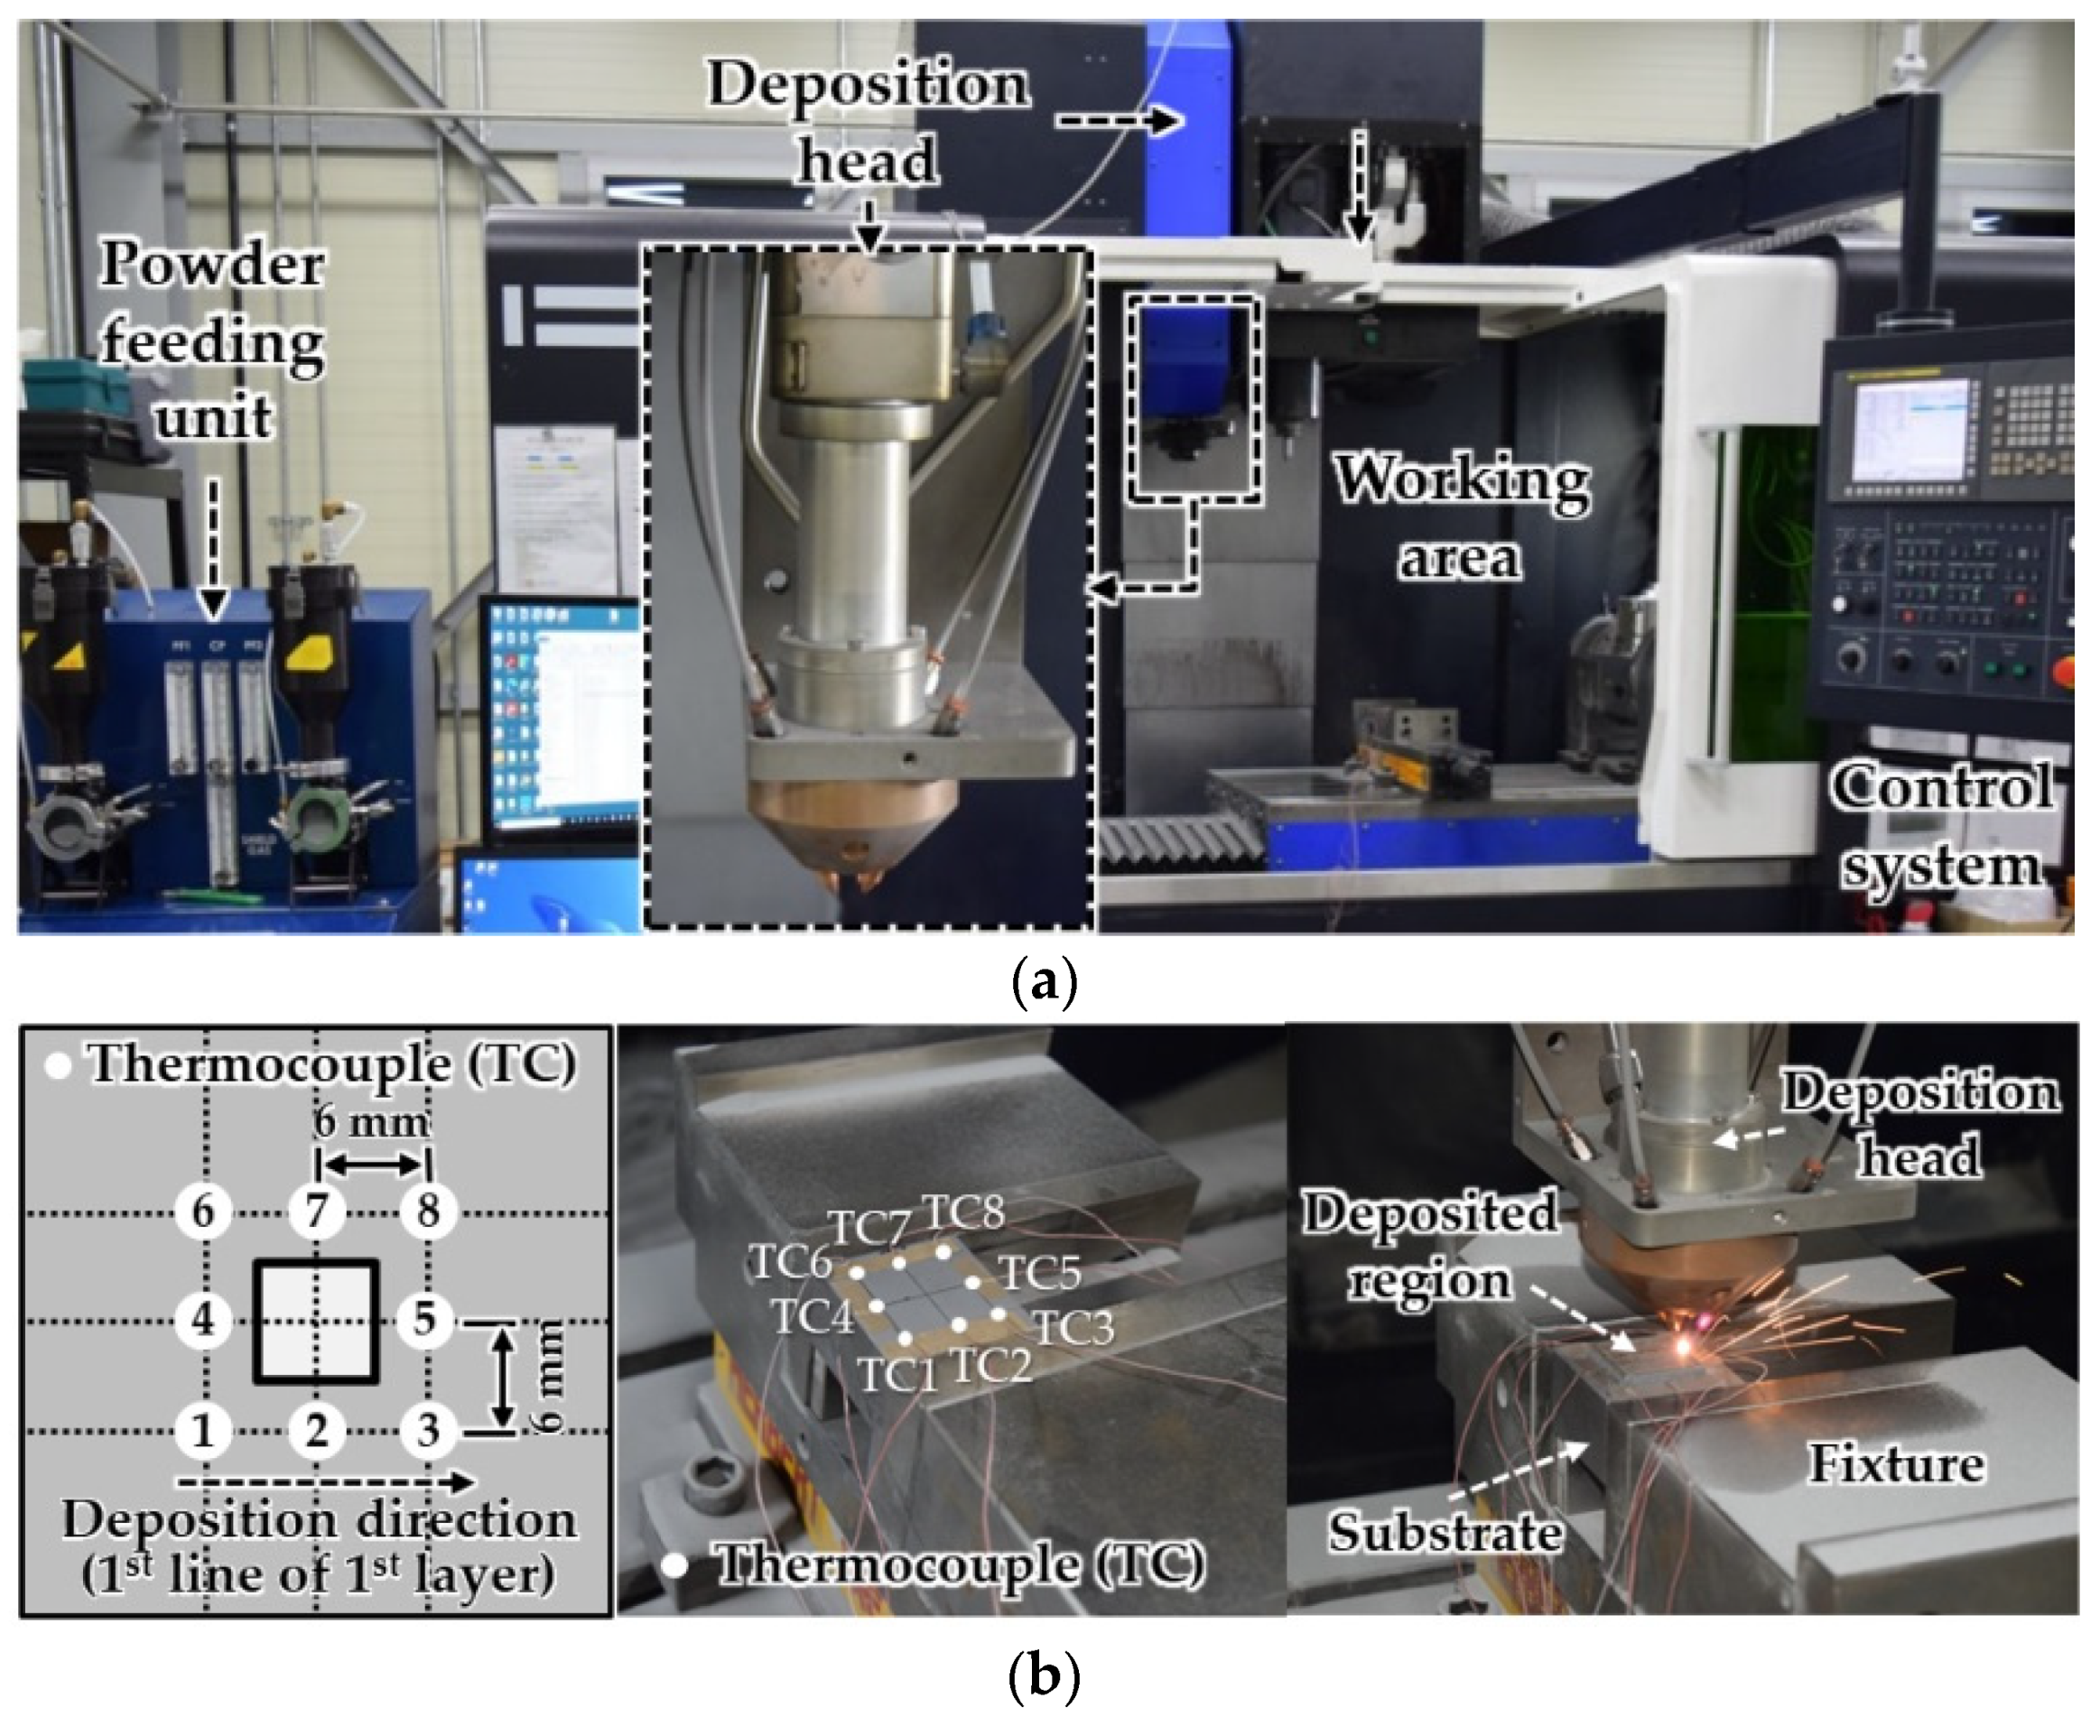
2.2. Experiments
3. Results and Discussion
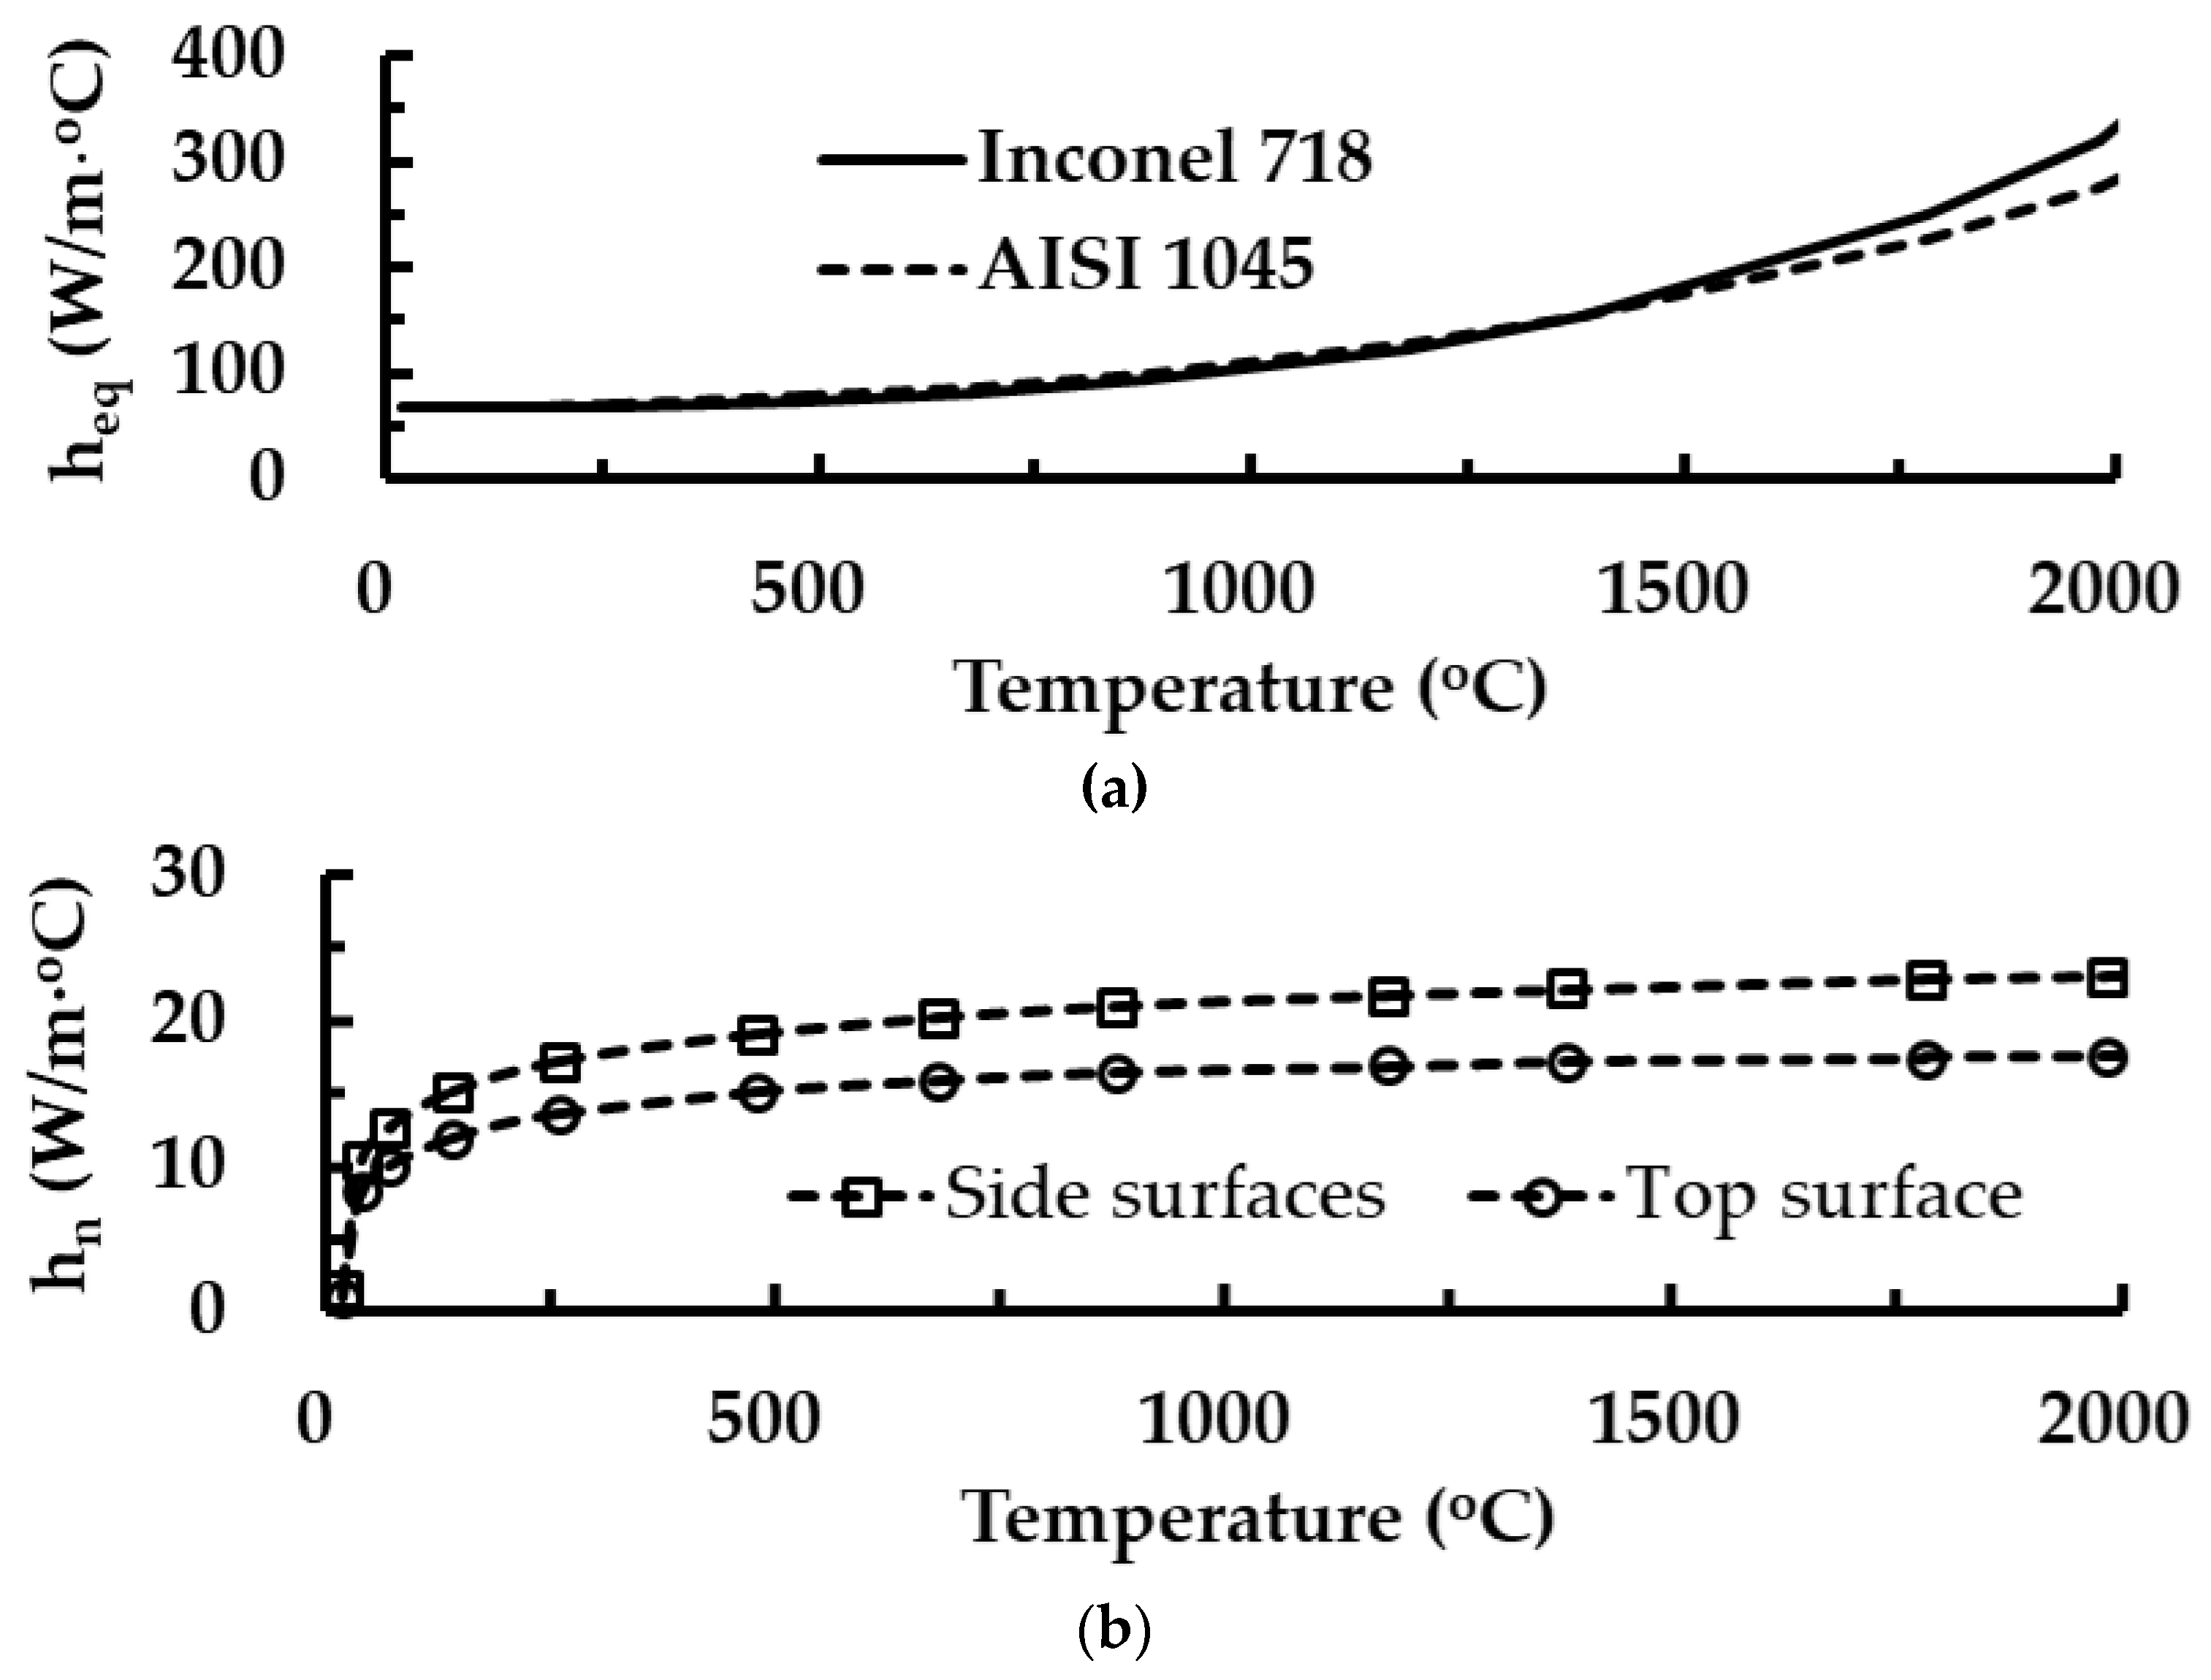
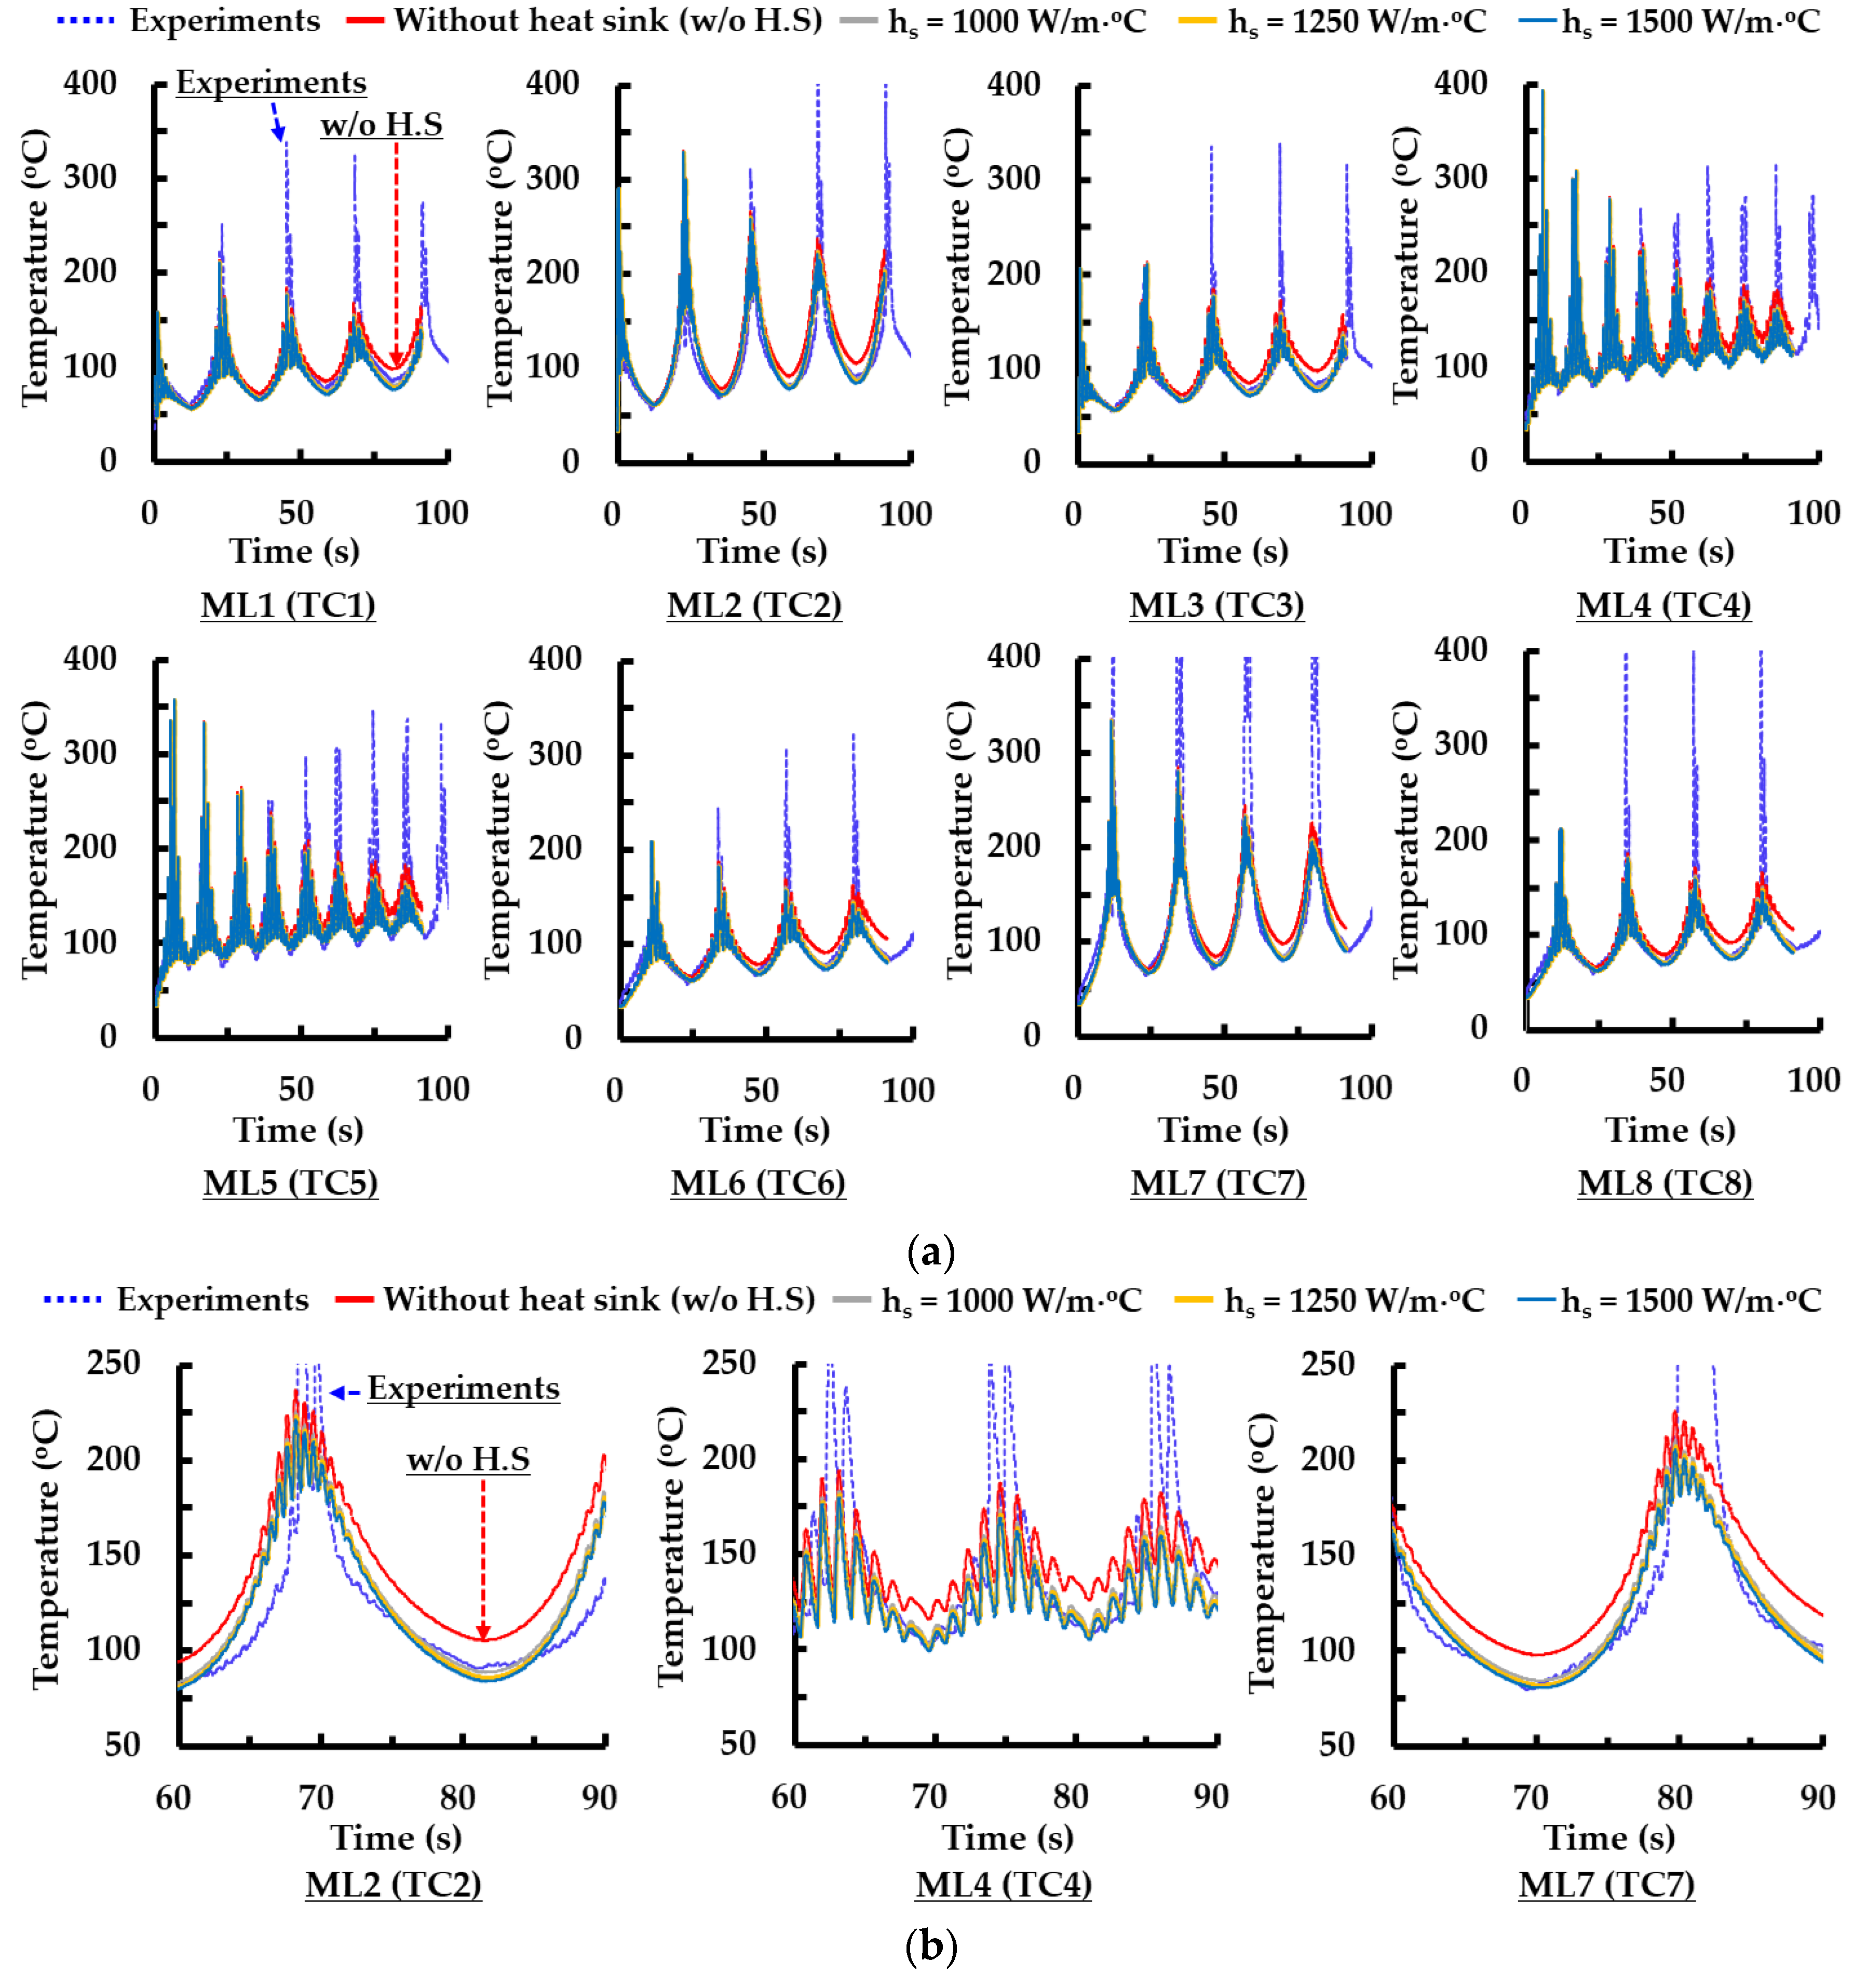
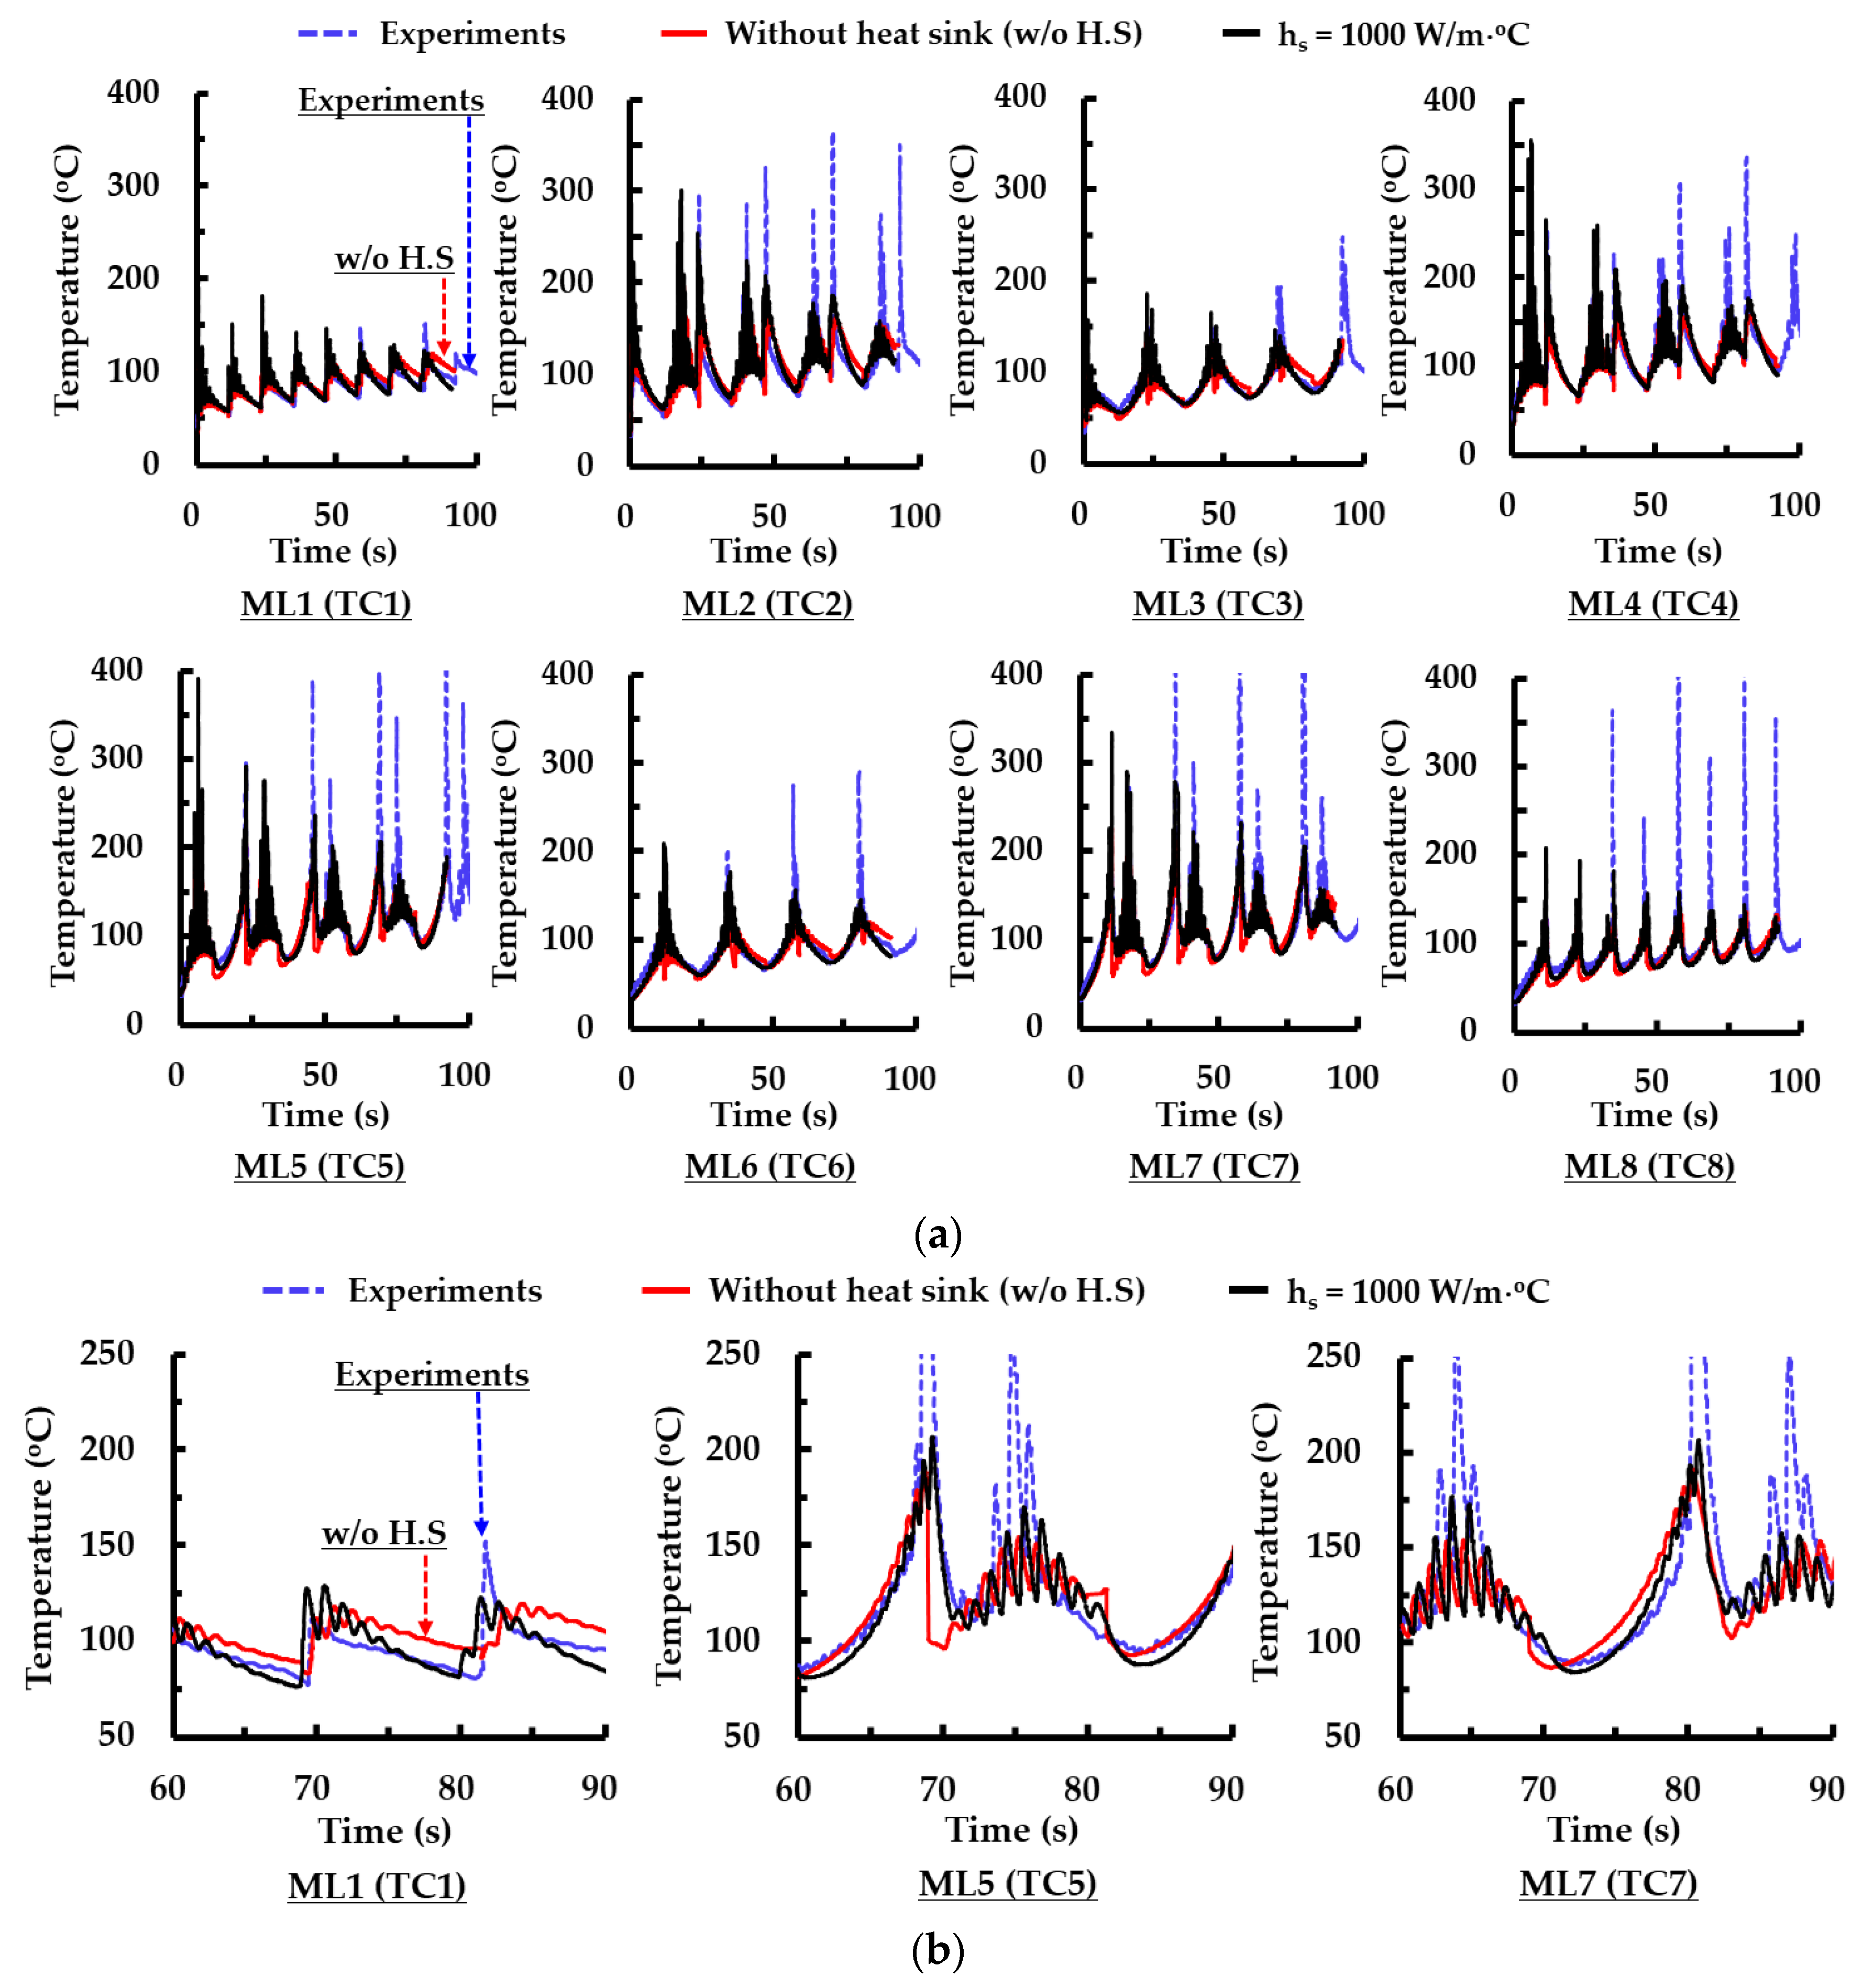
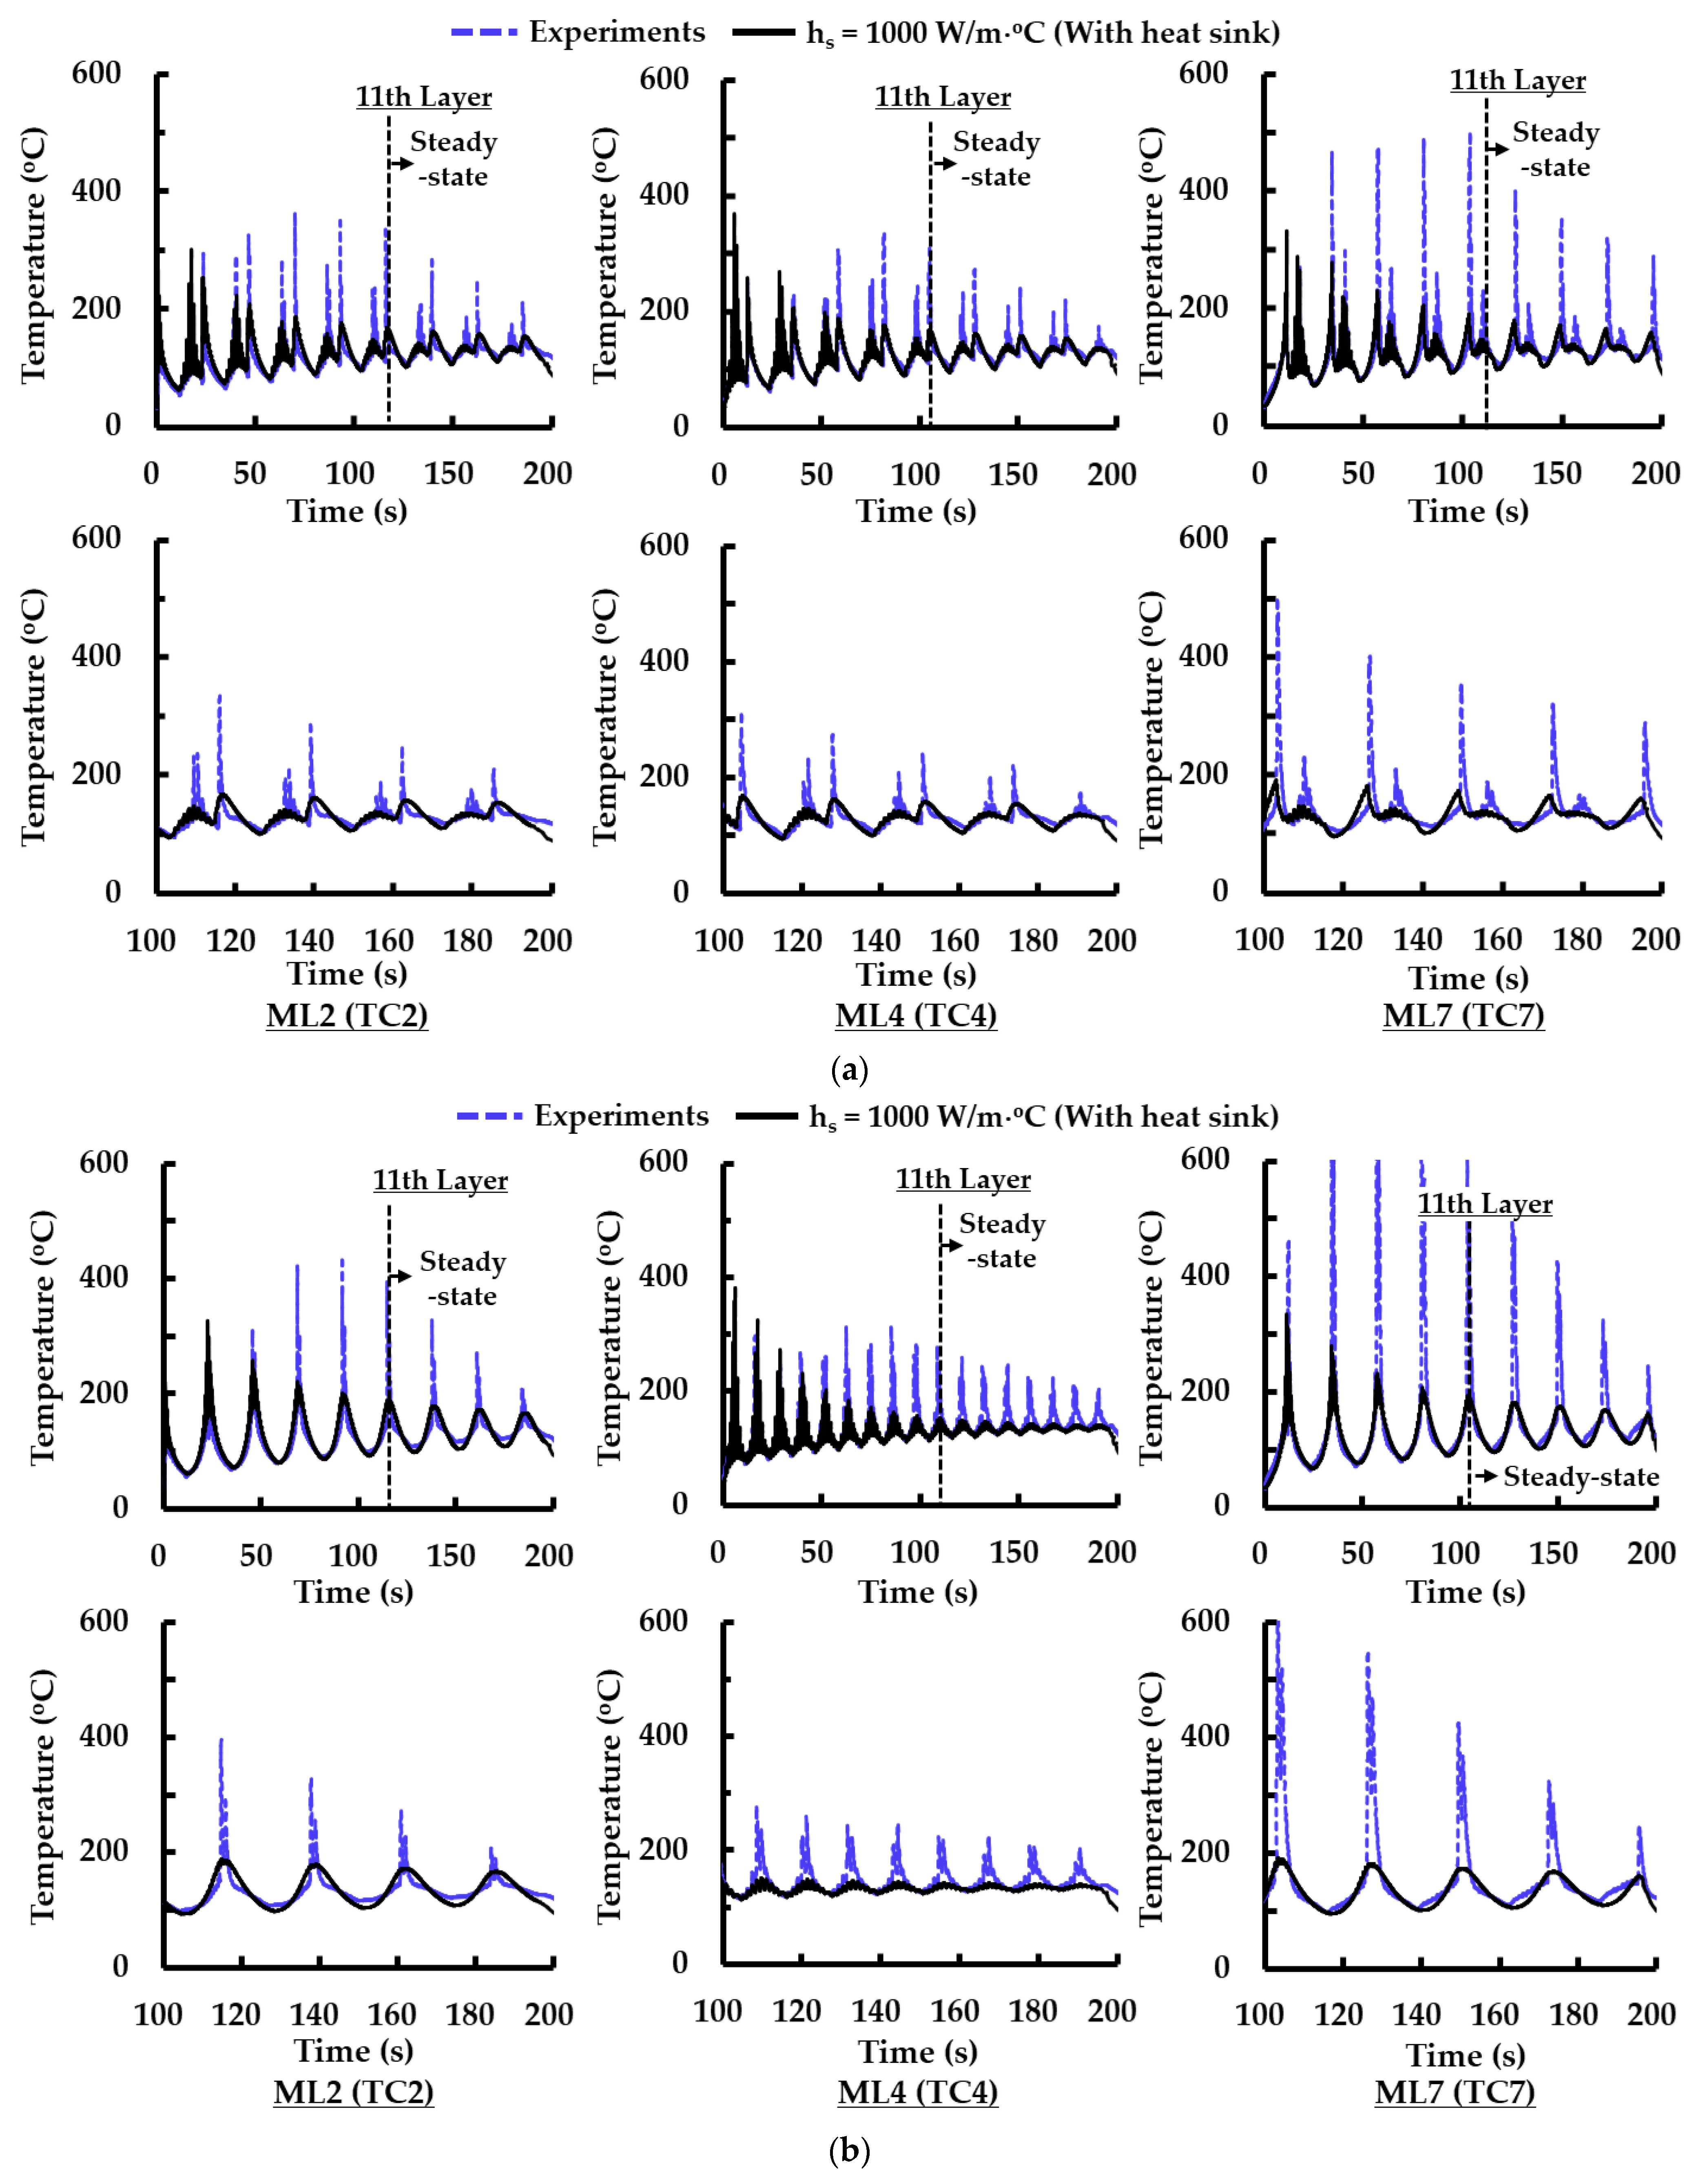
3.1. Coefficient of Heat Sink
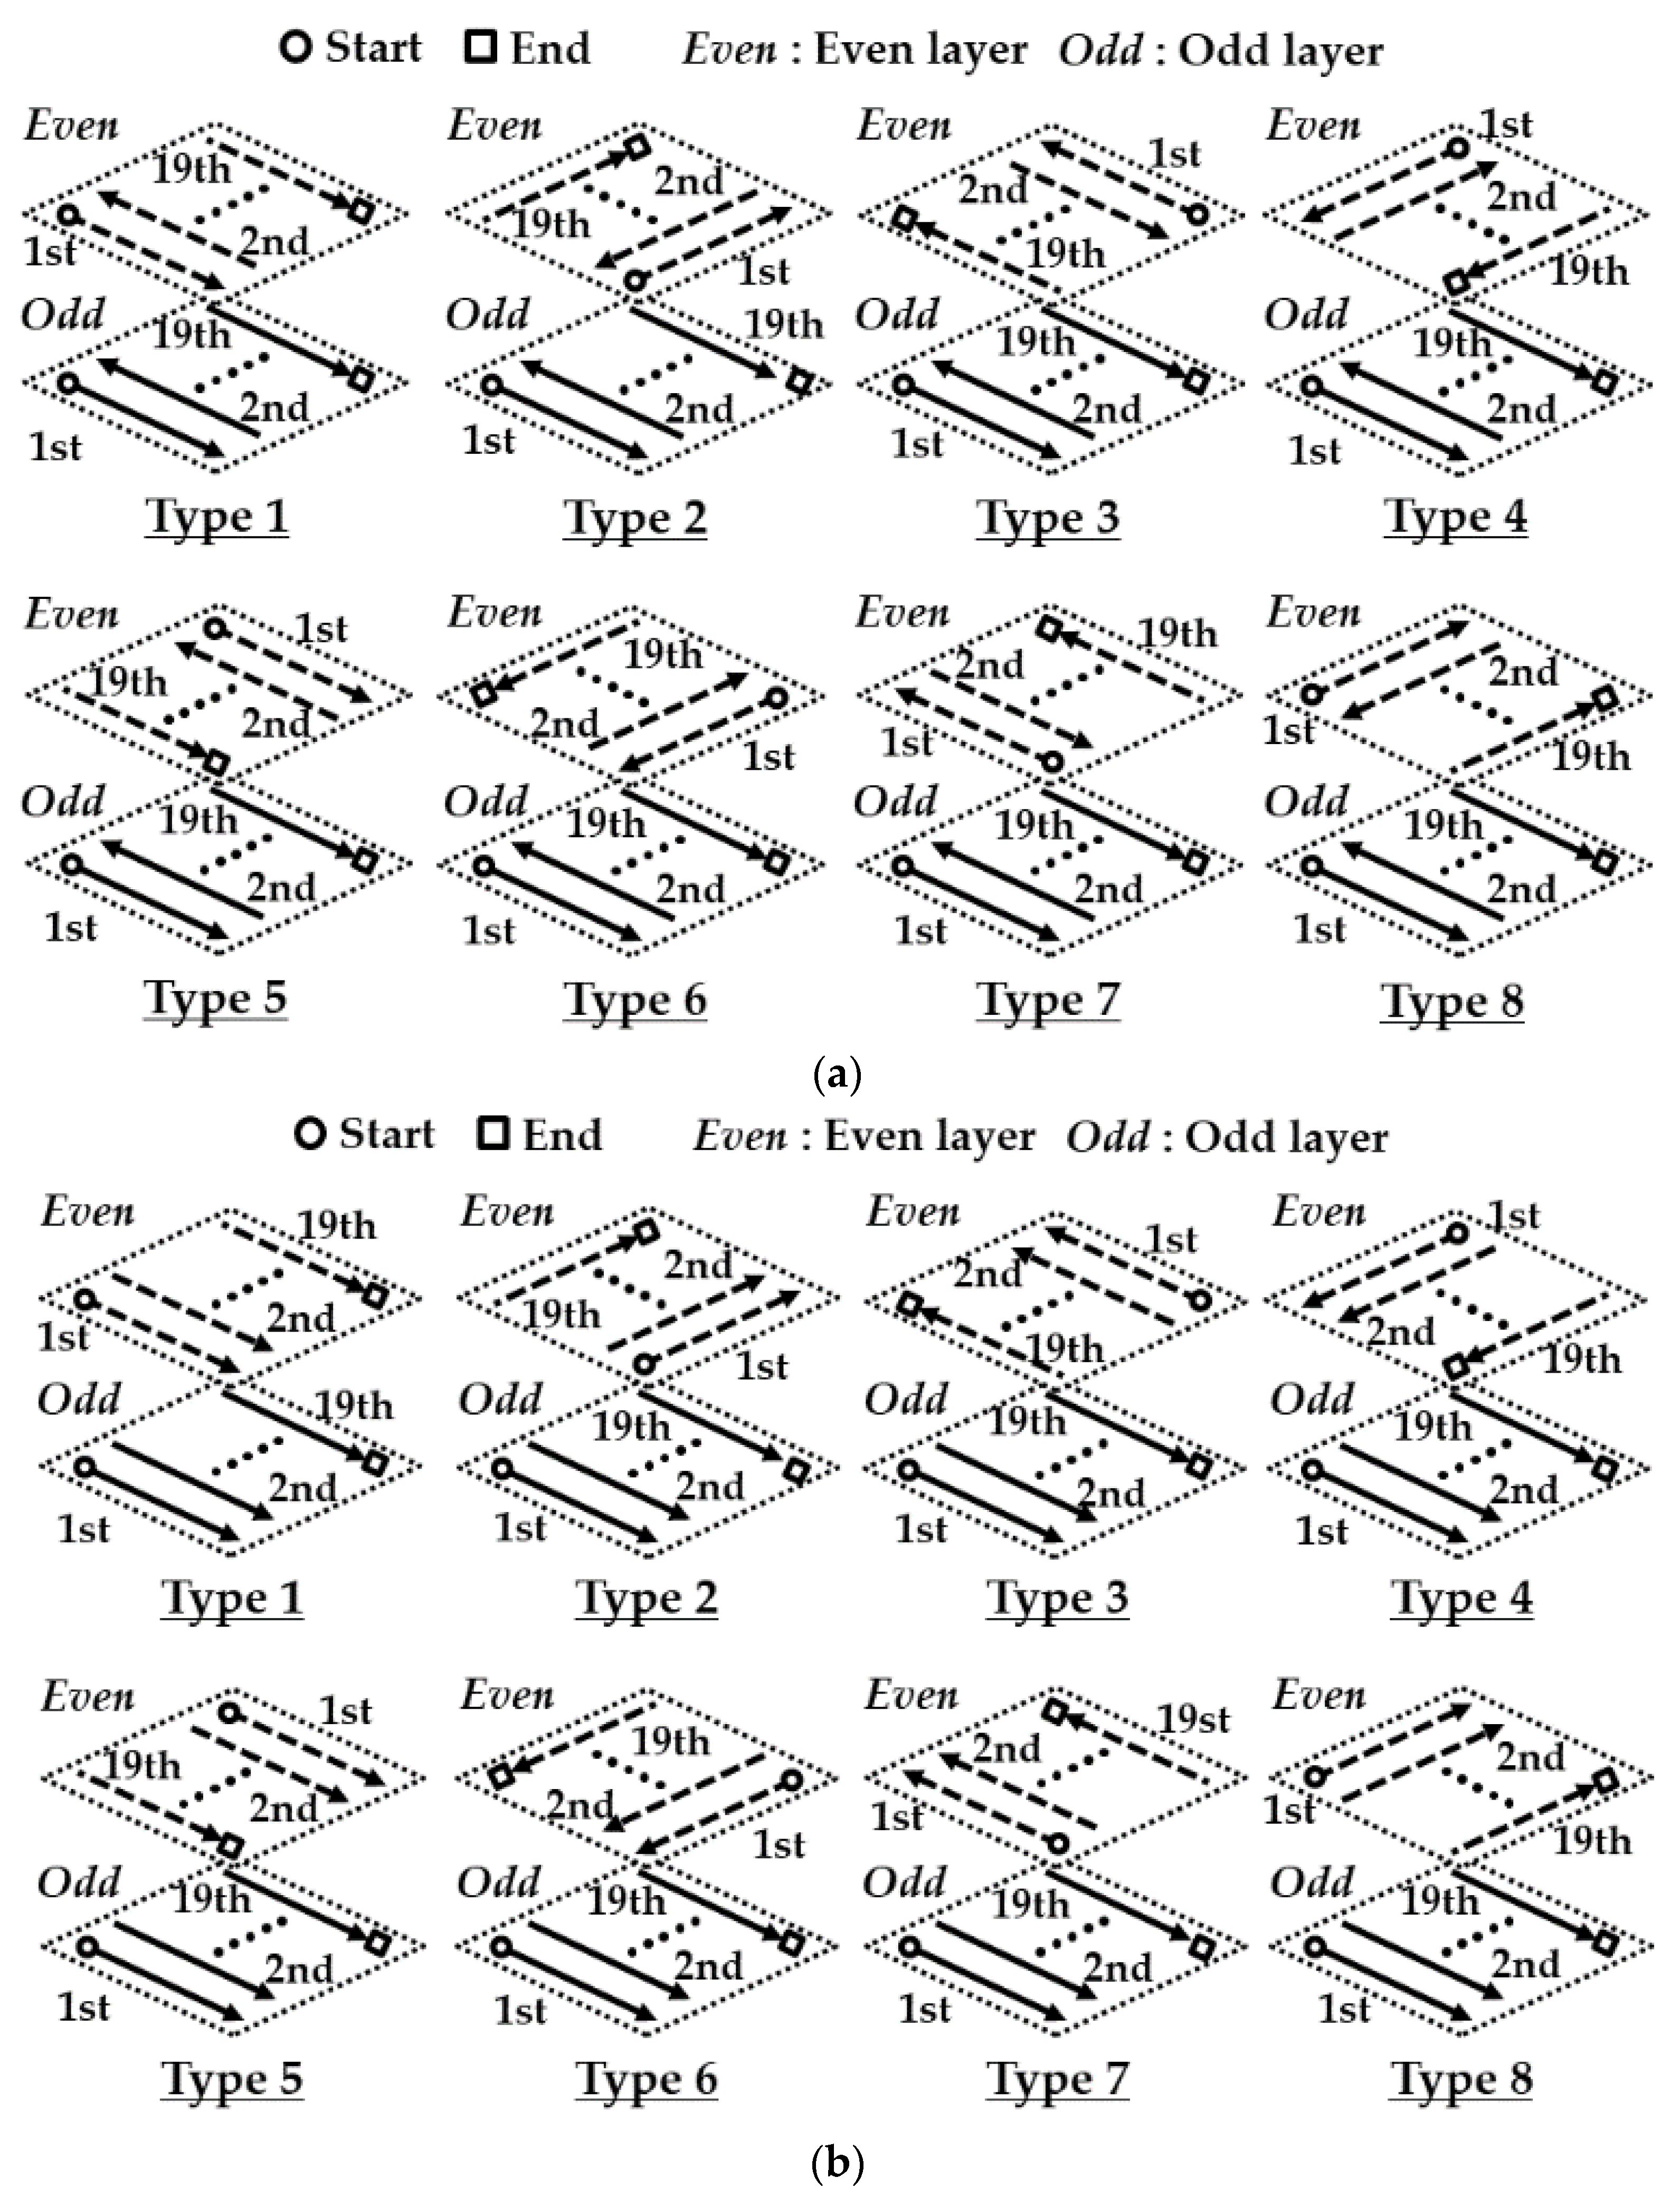
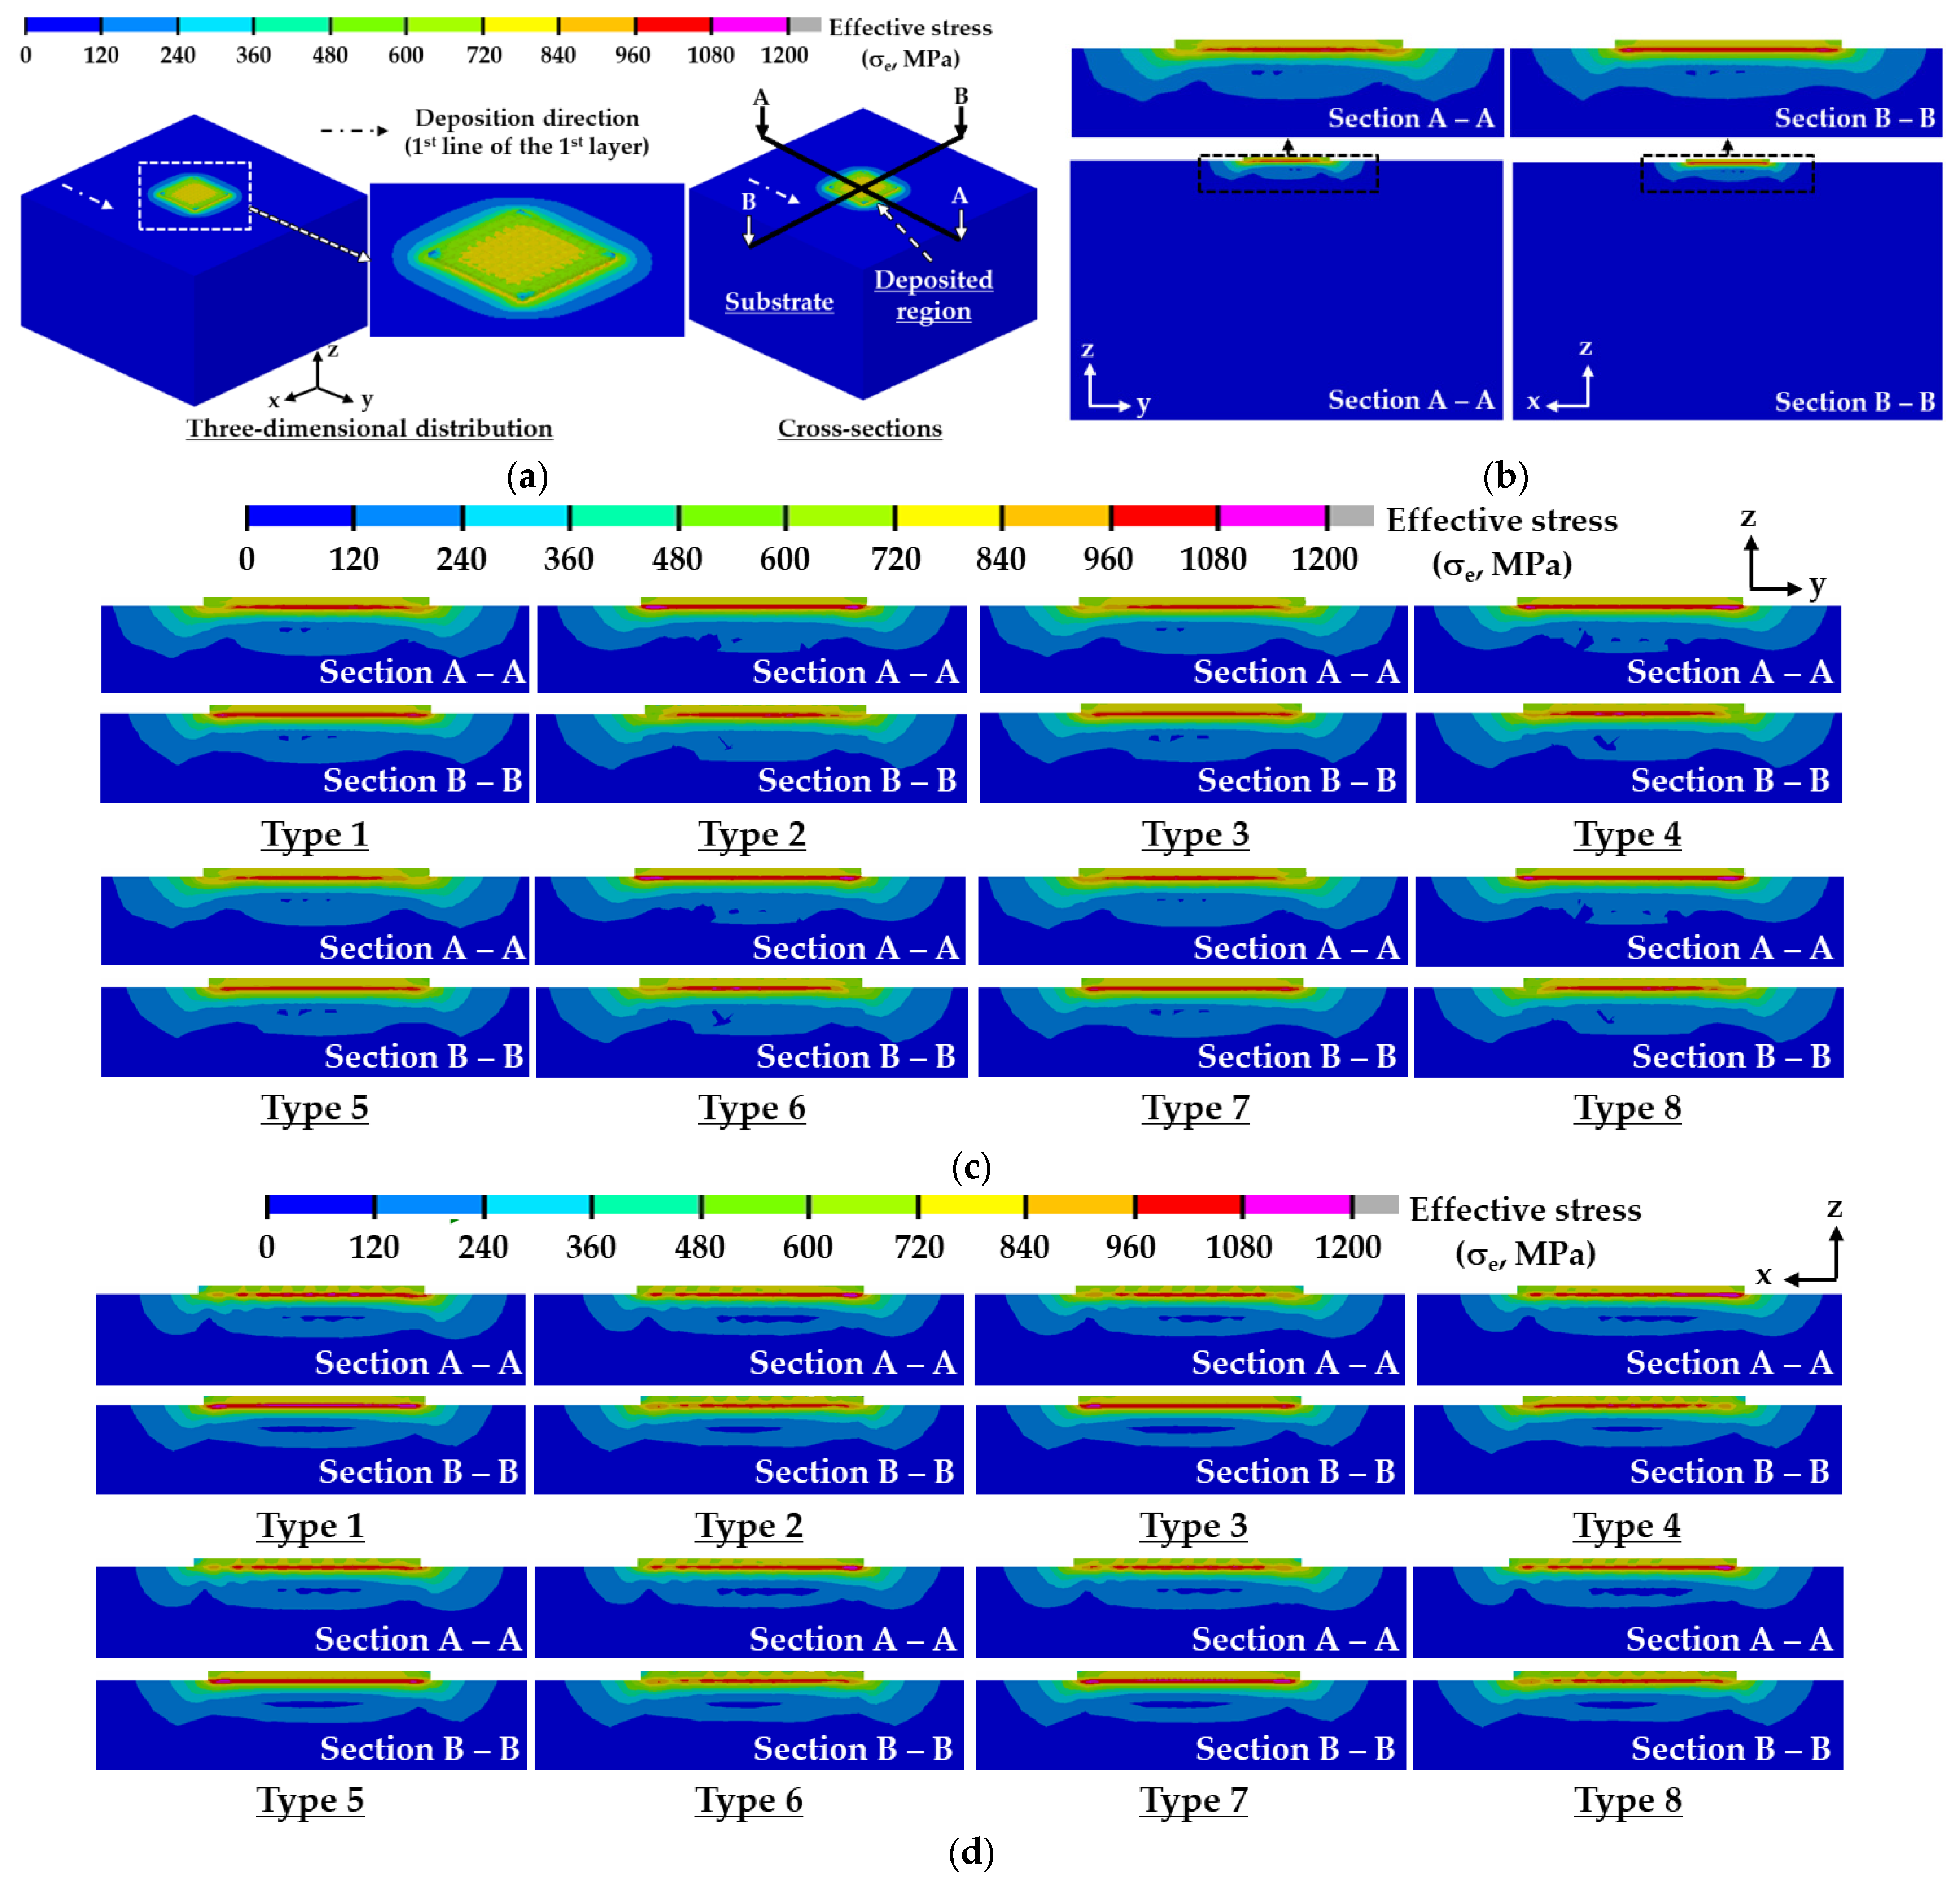
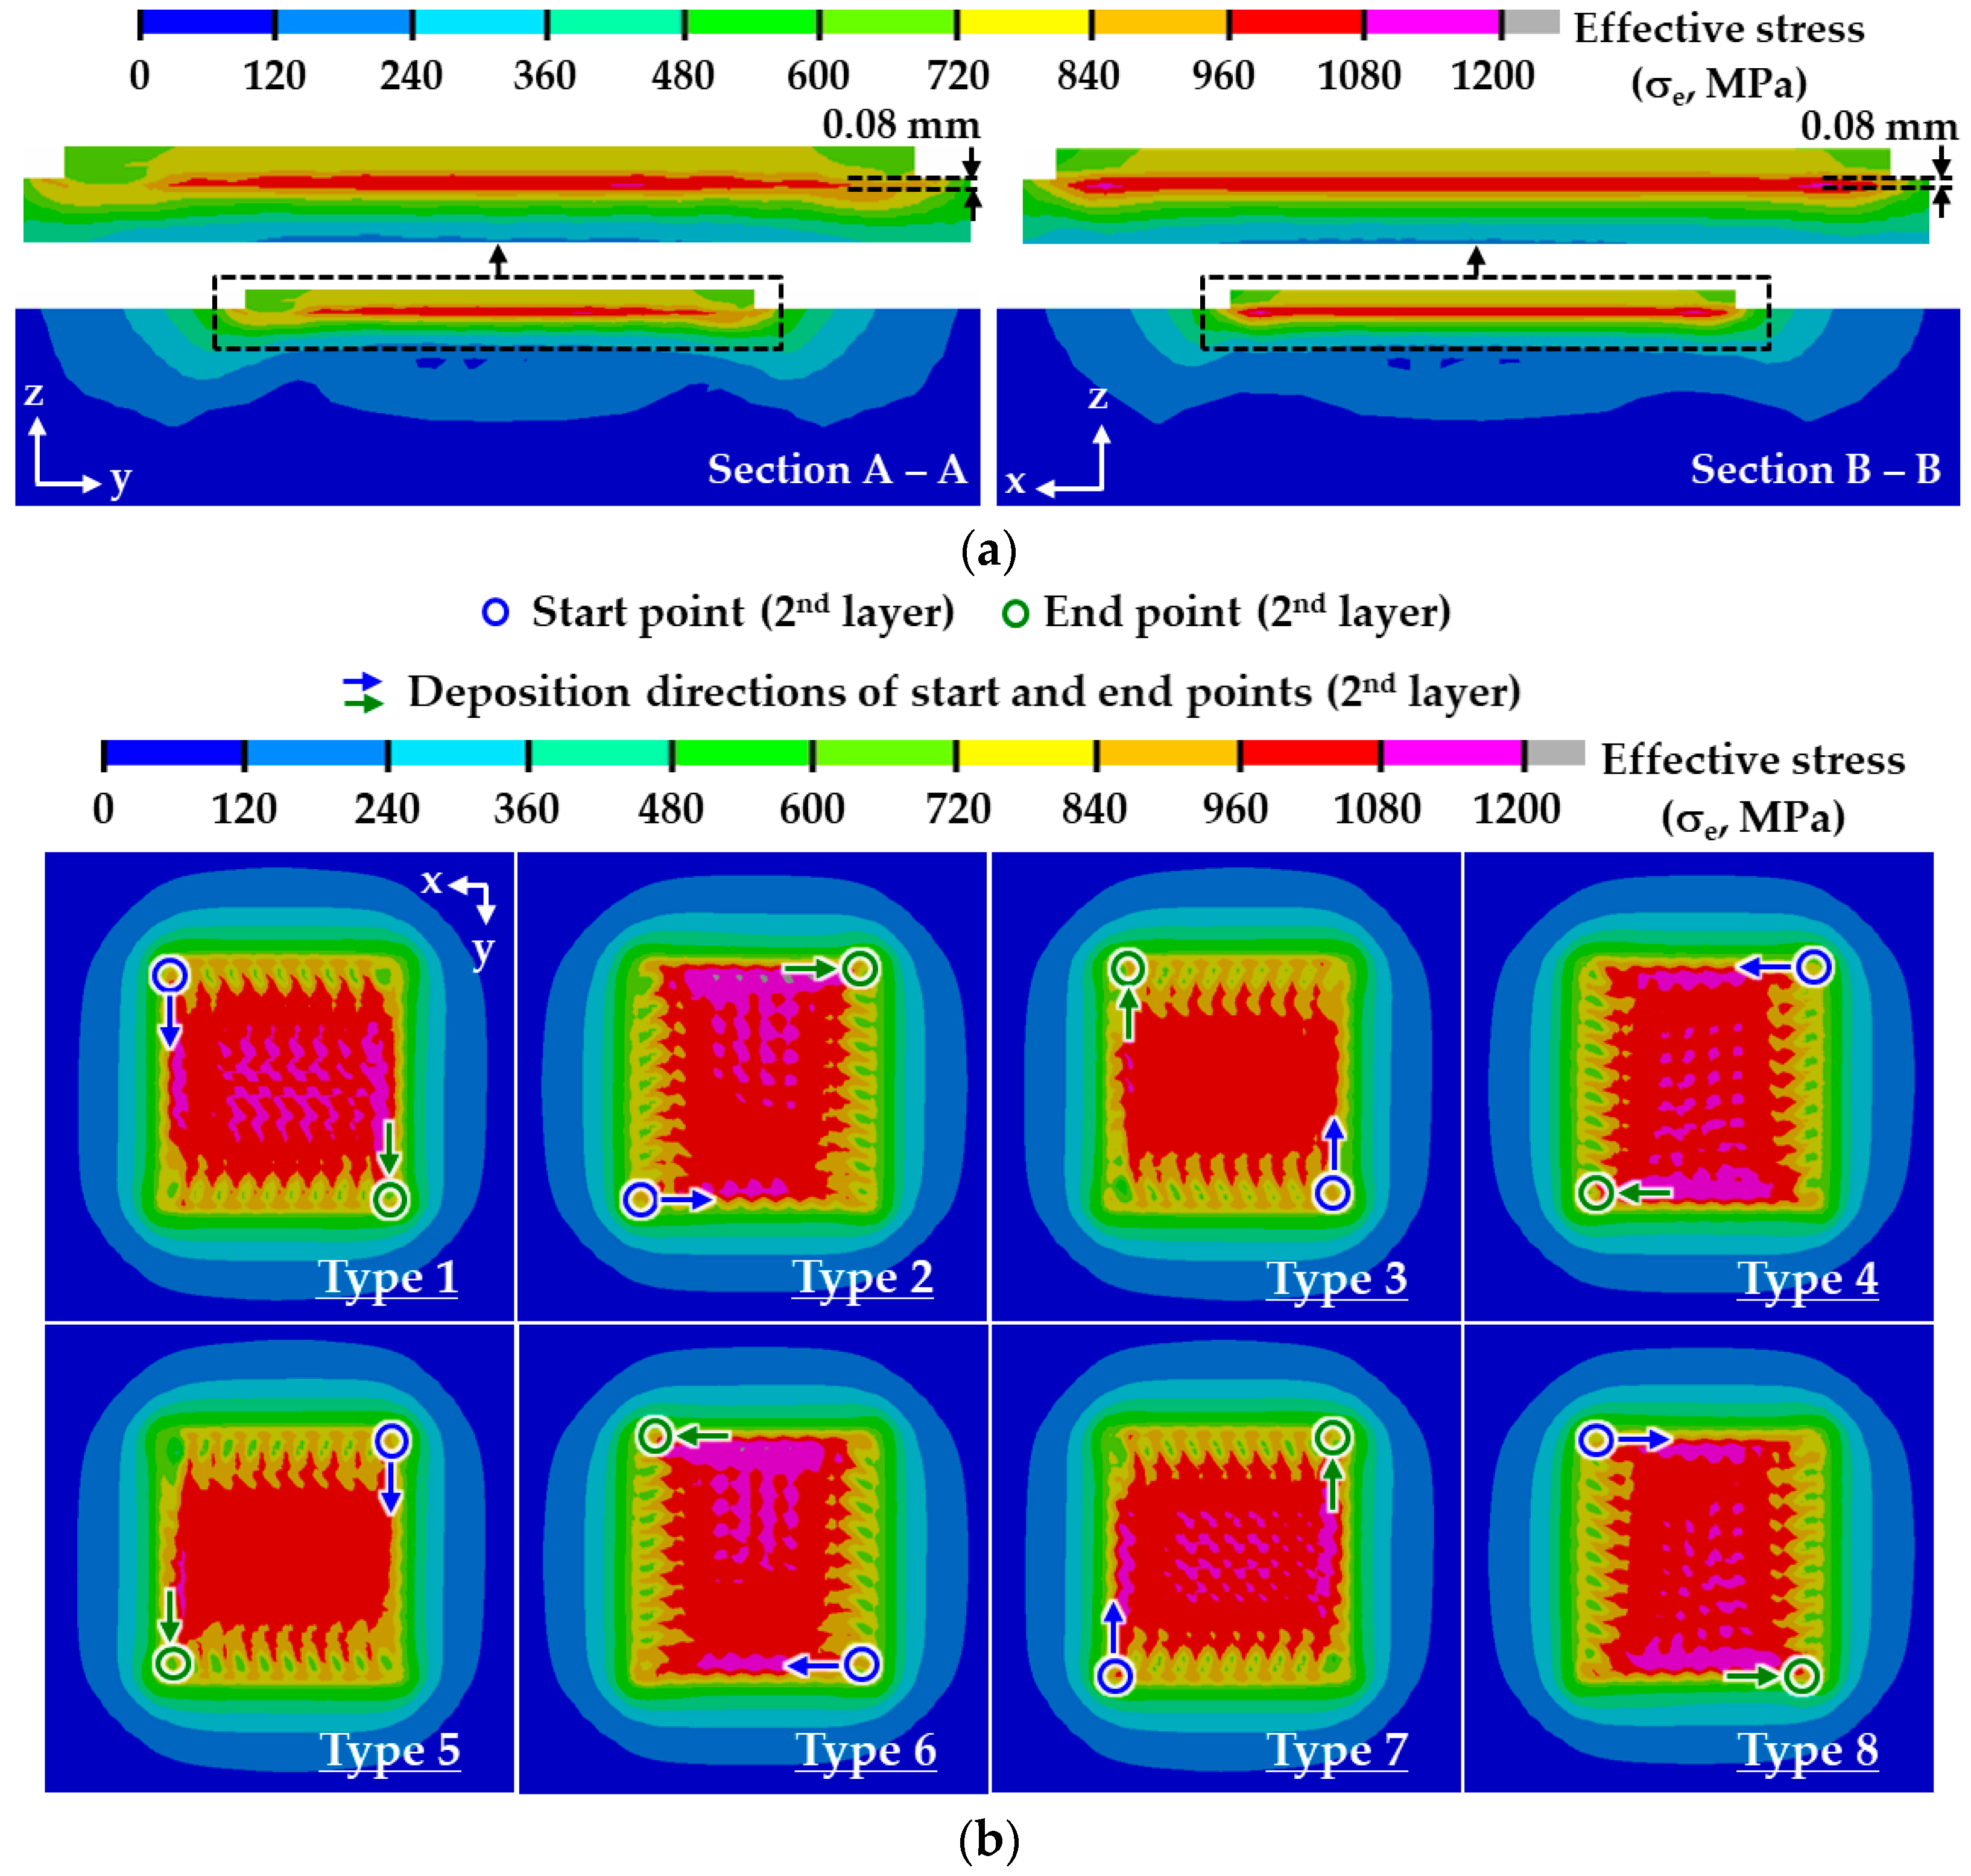
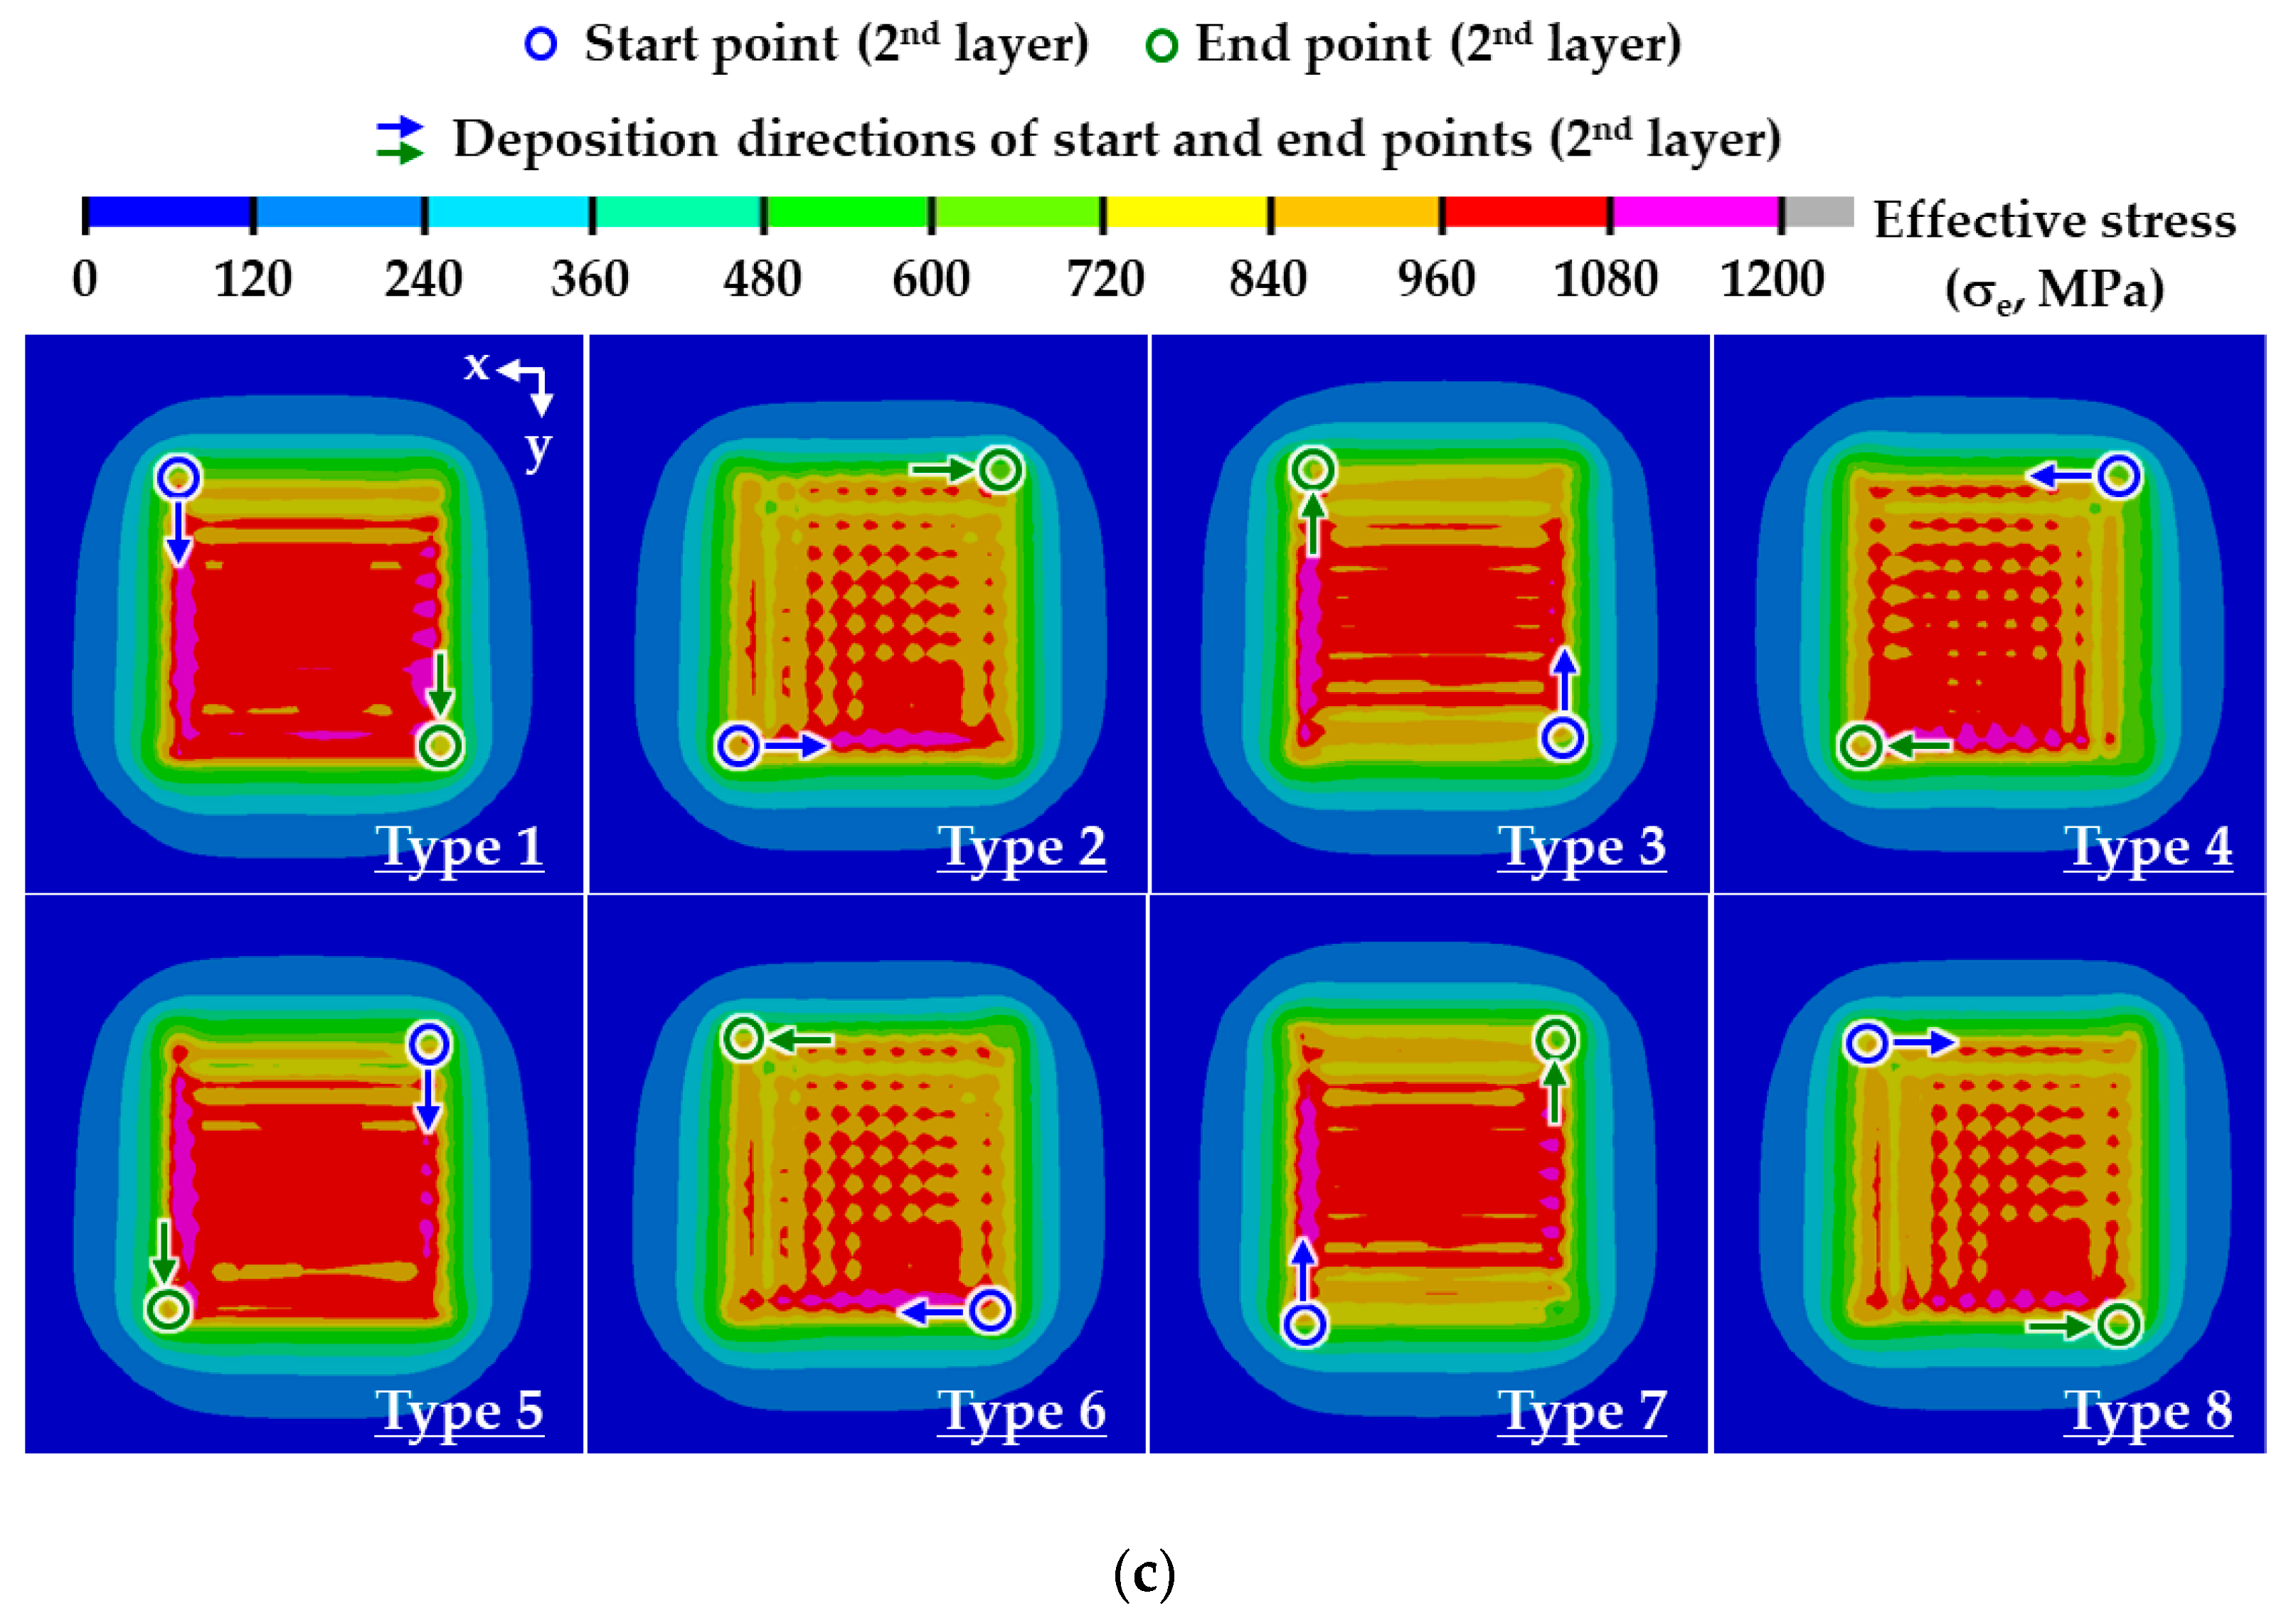
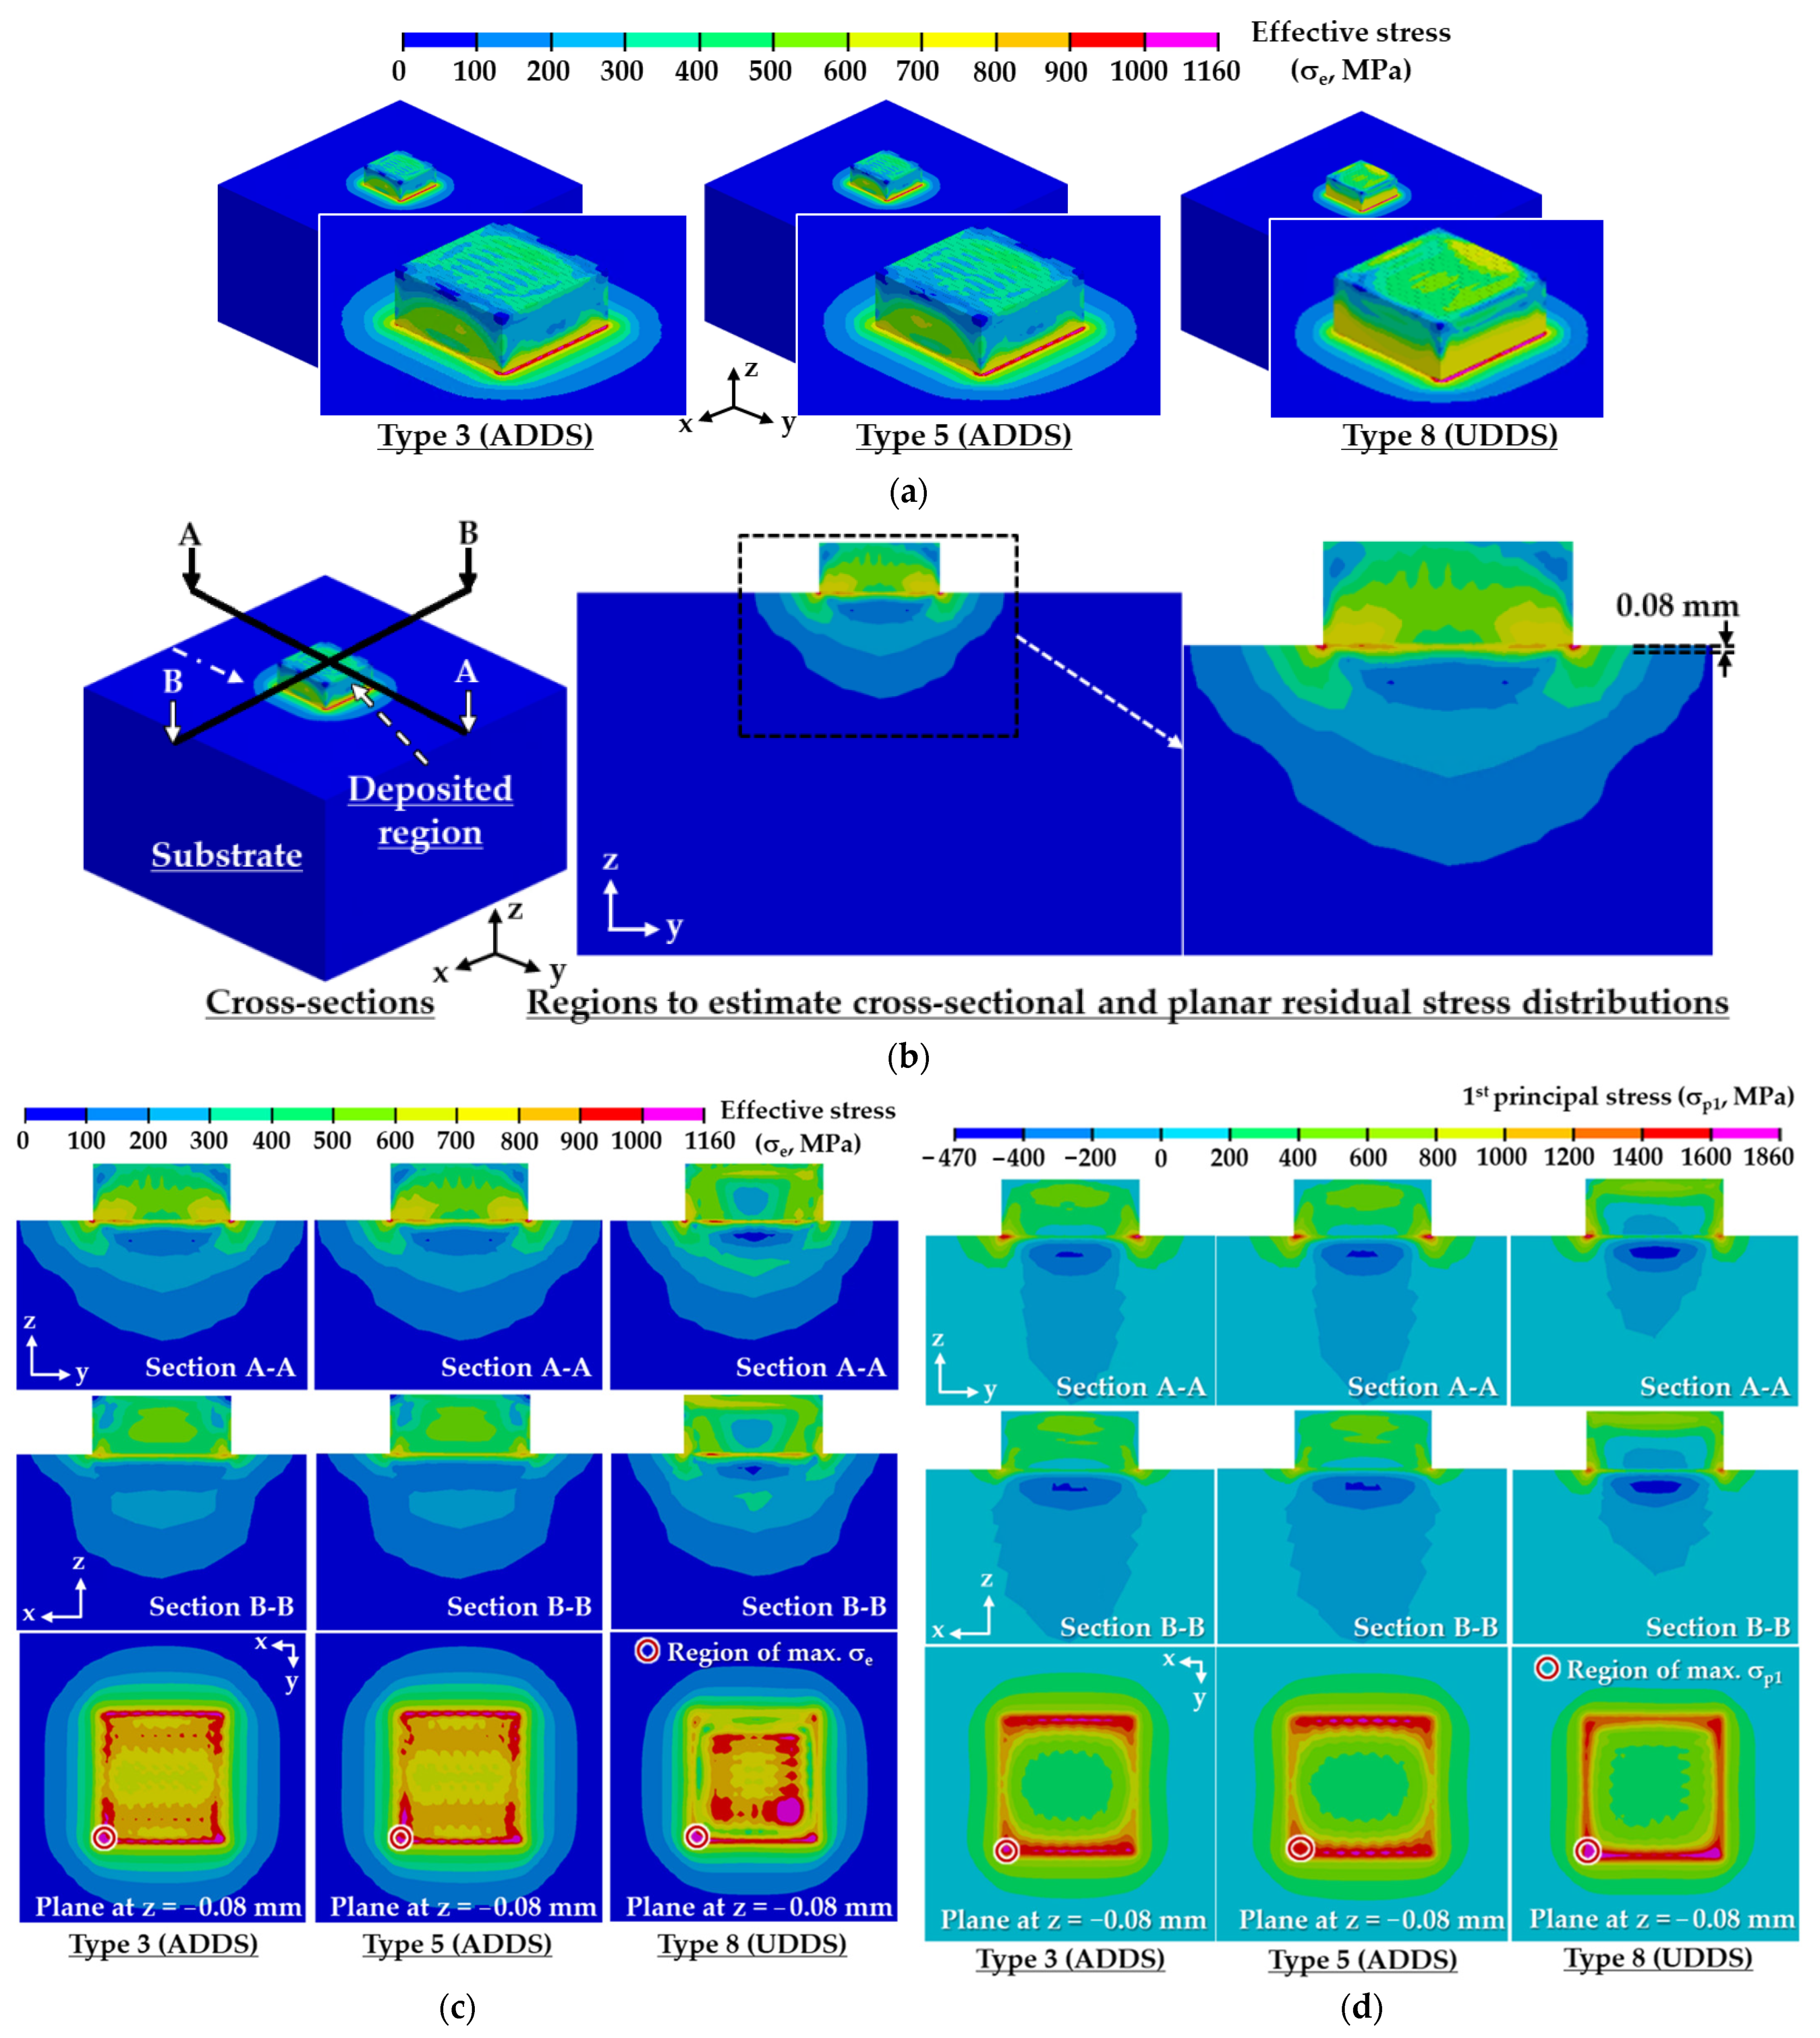
3.2. Residual Stress Distributions and Feasible Deposition Strategies (FDSs)
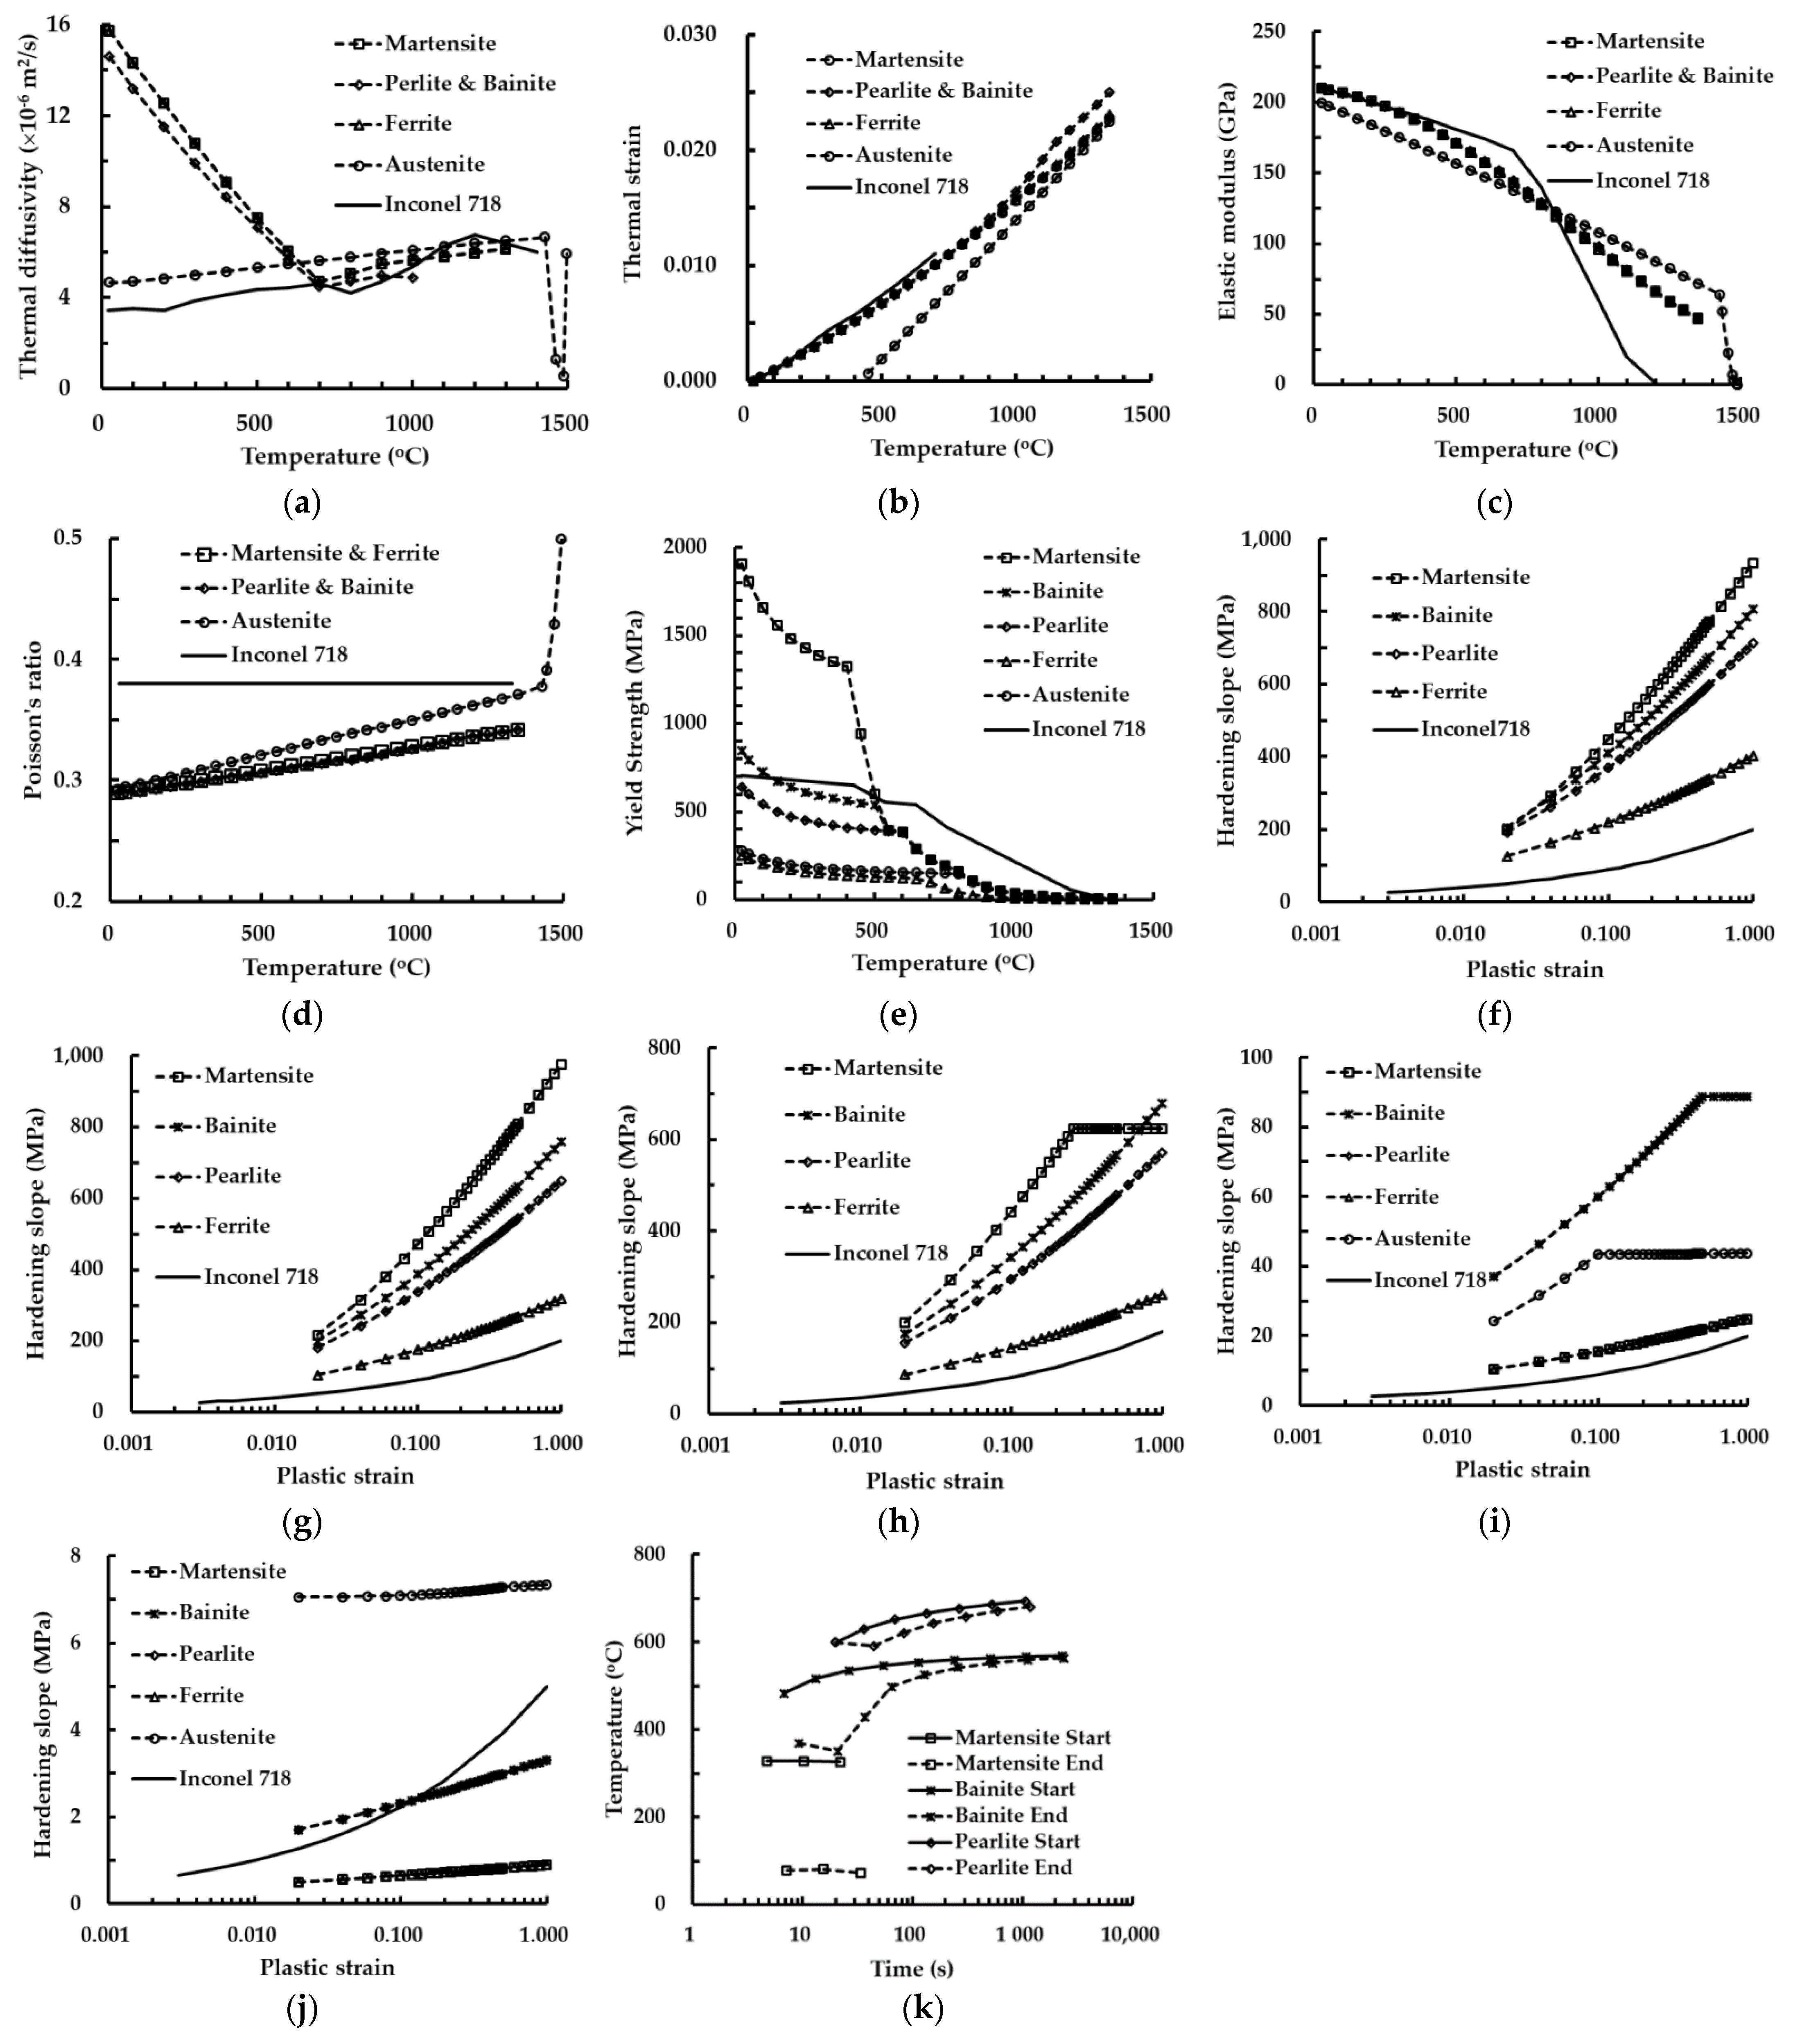
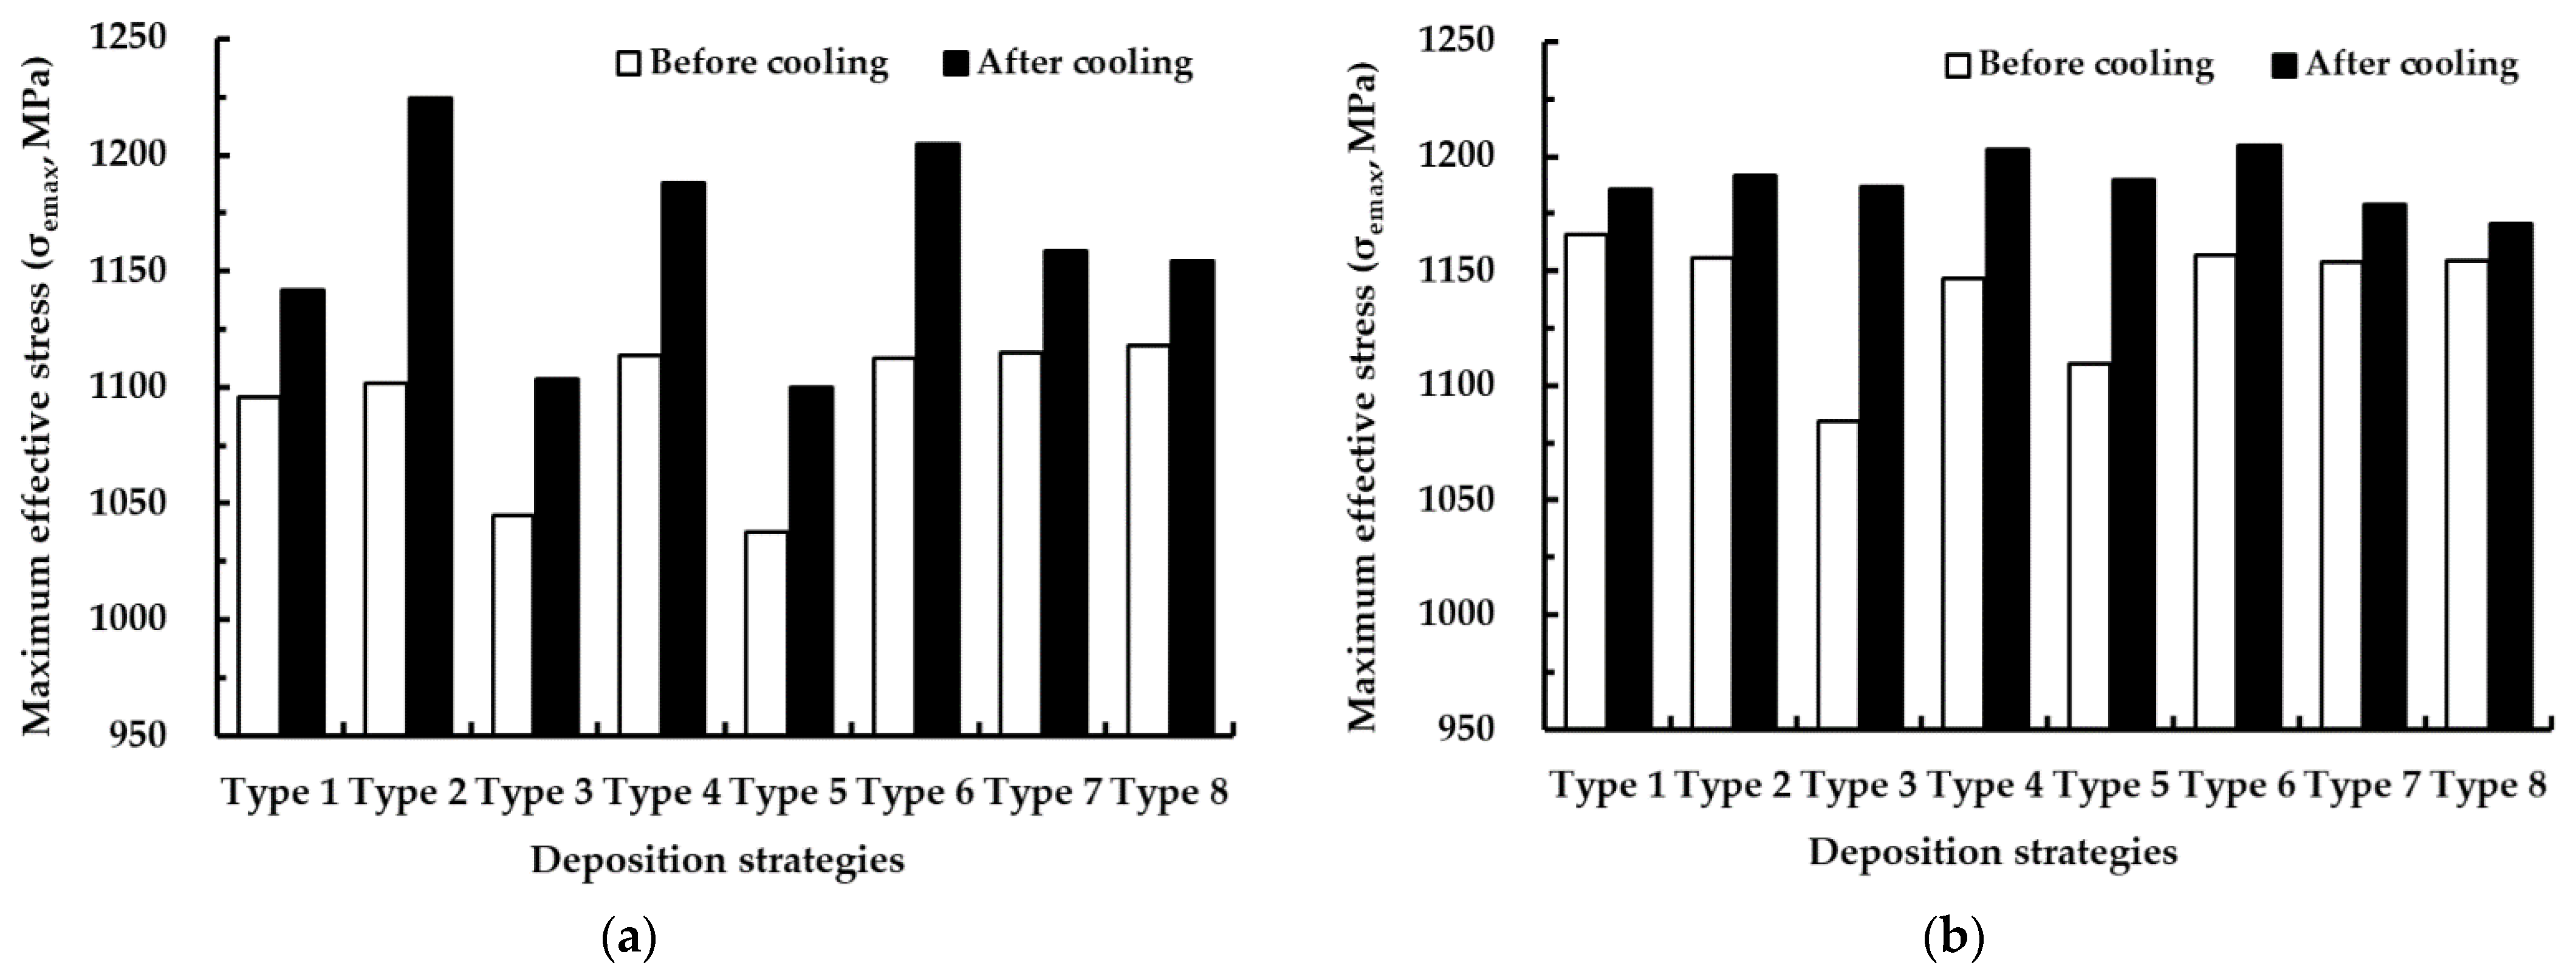
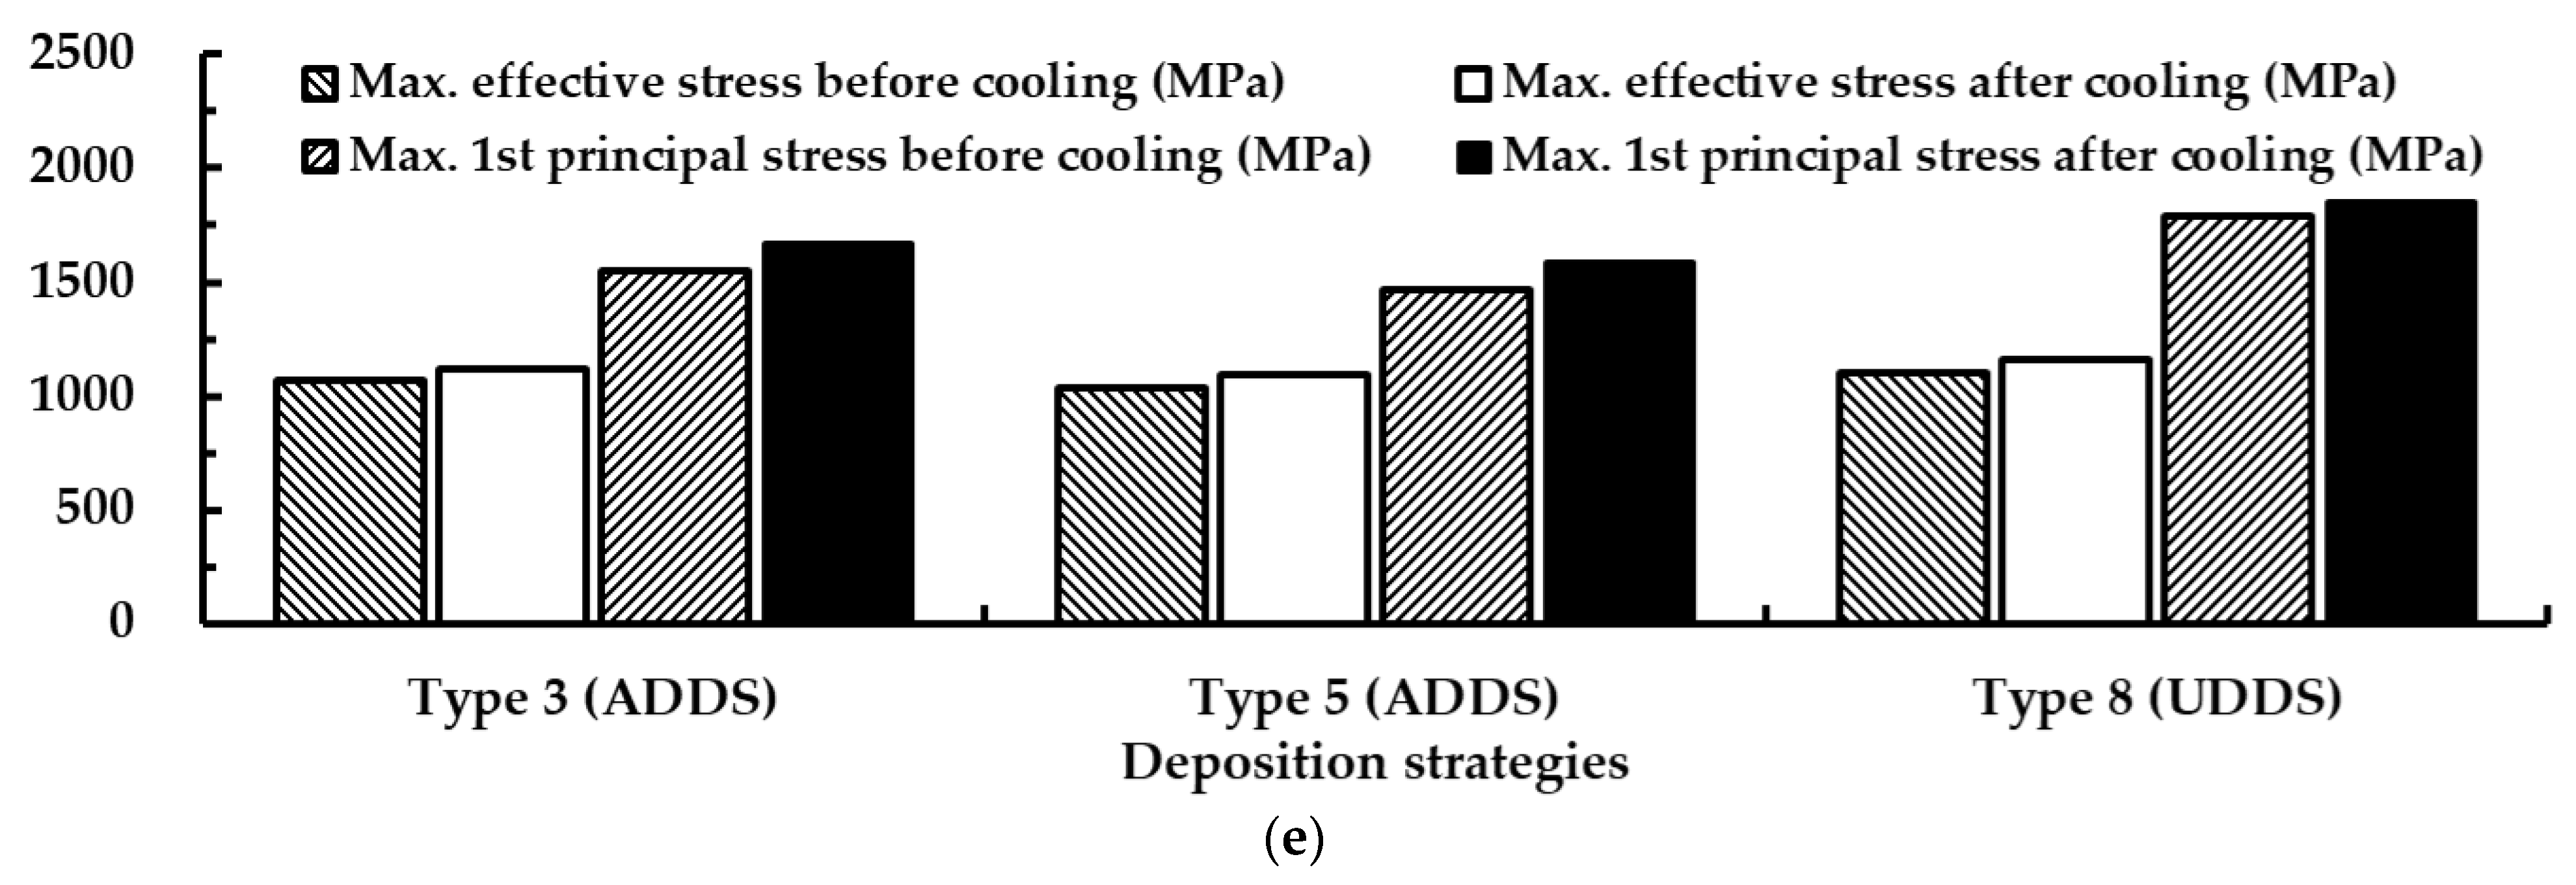
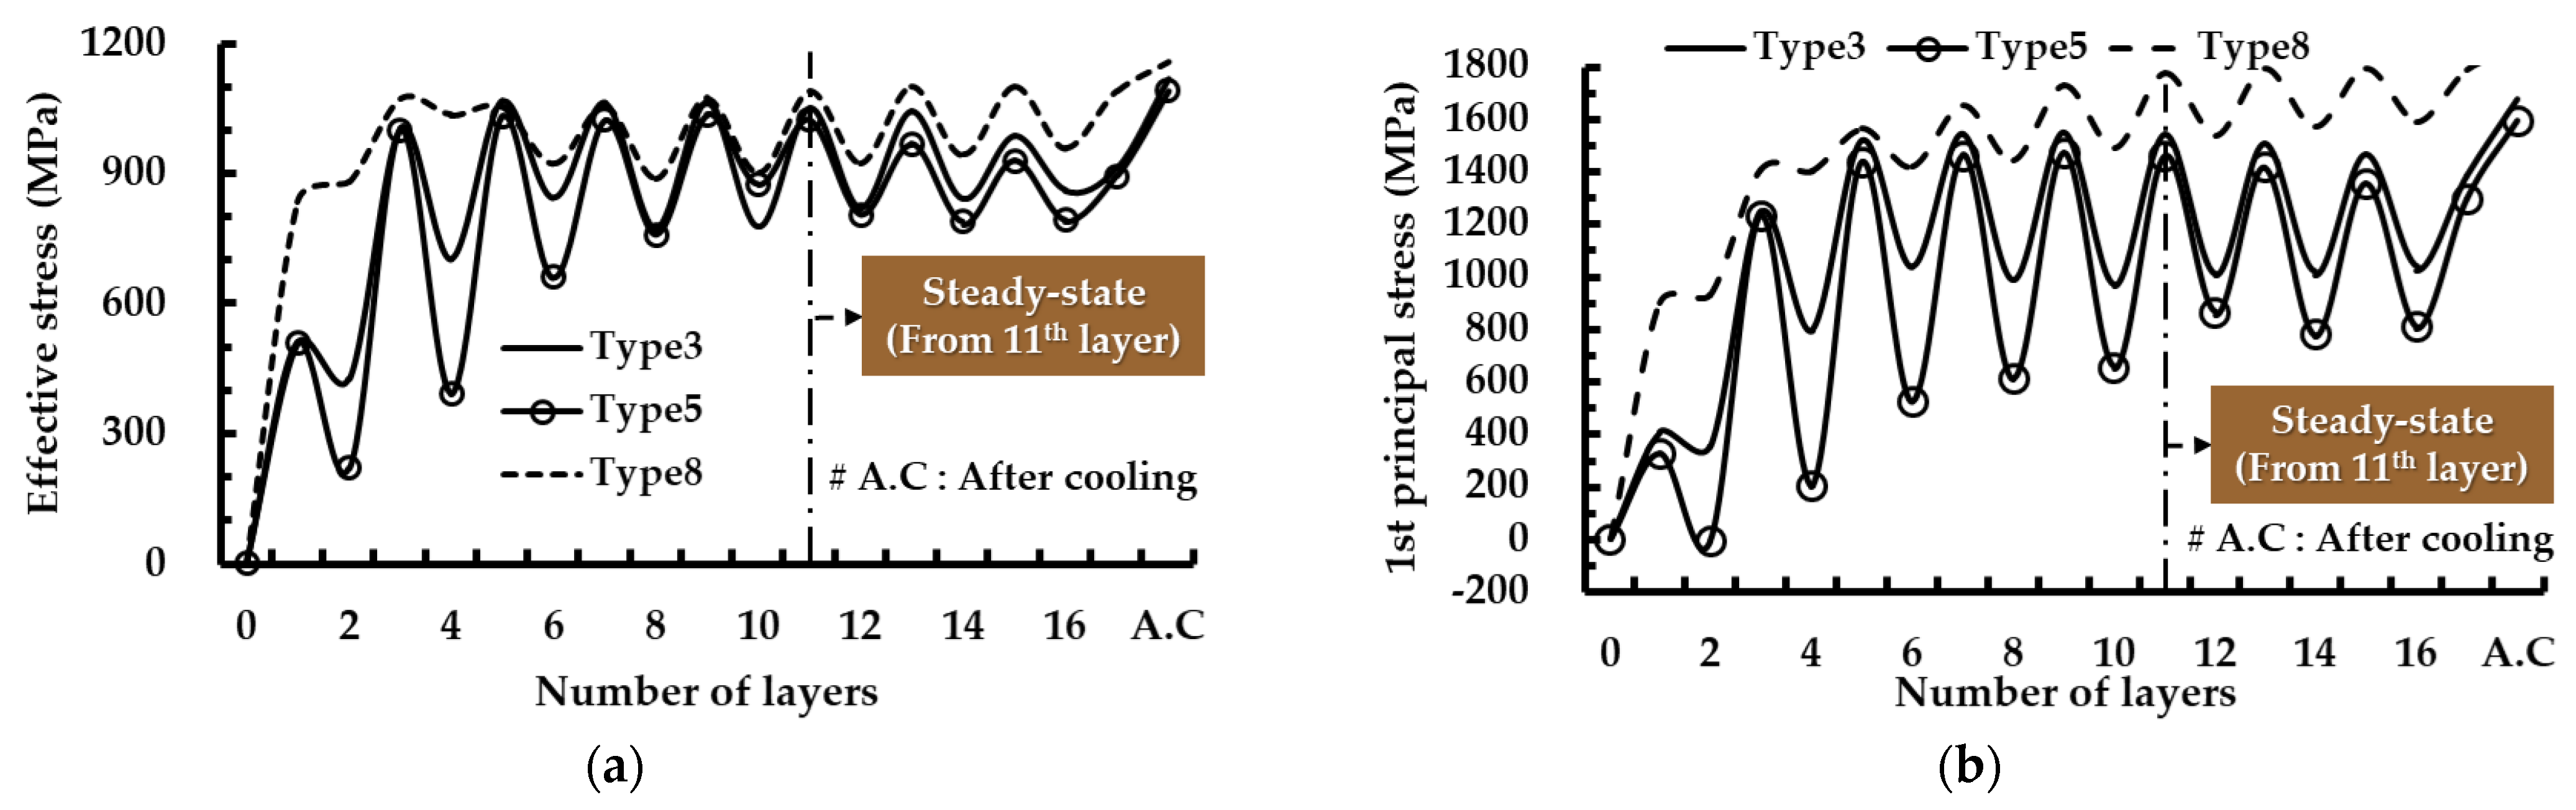
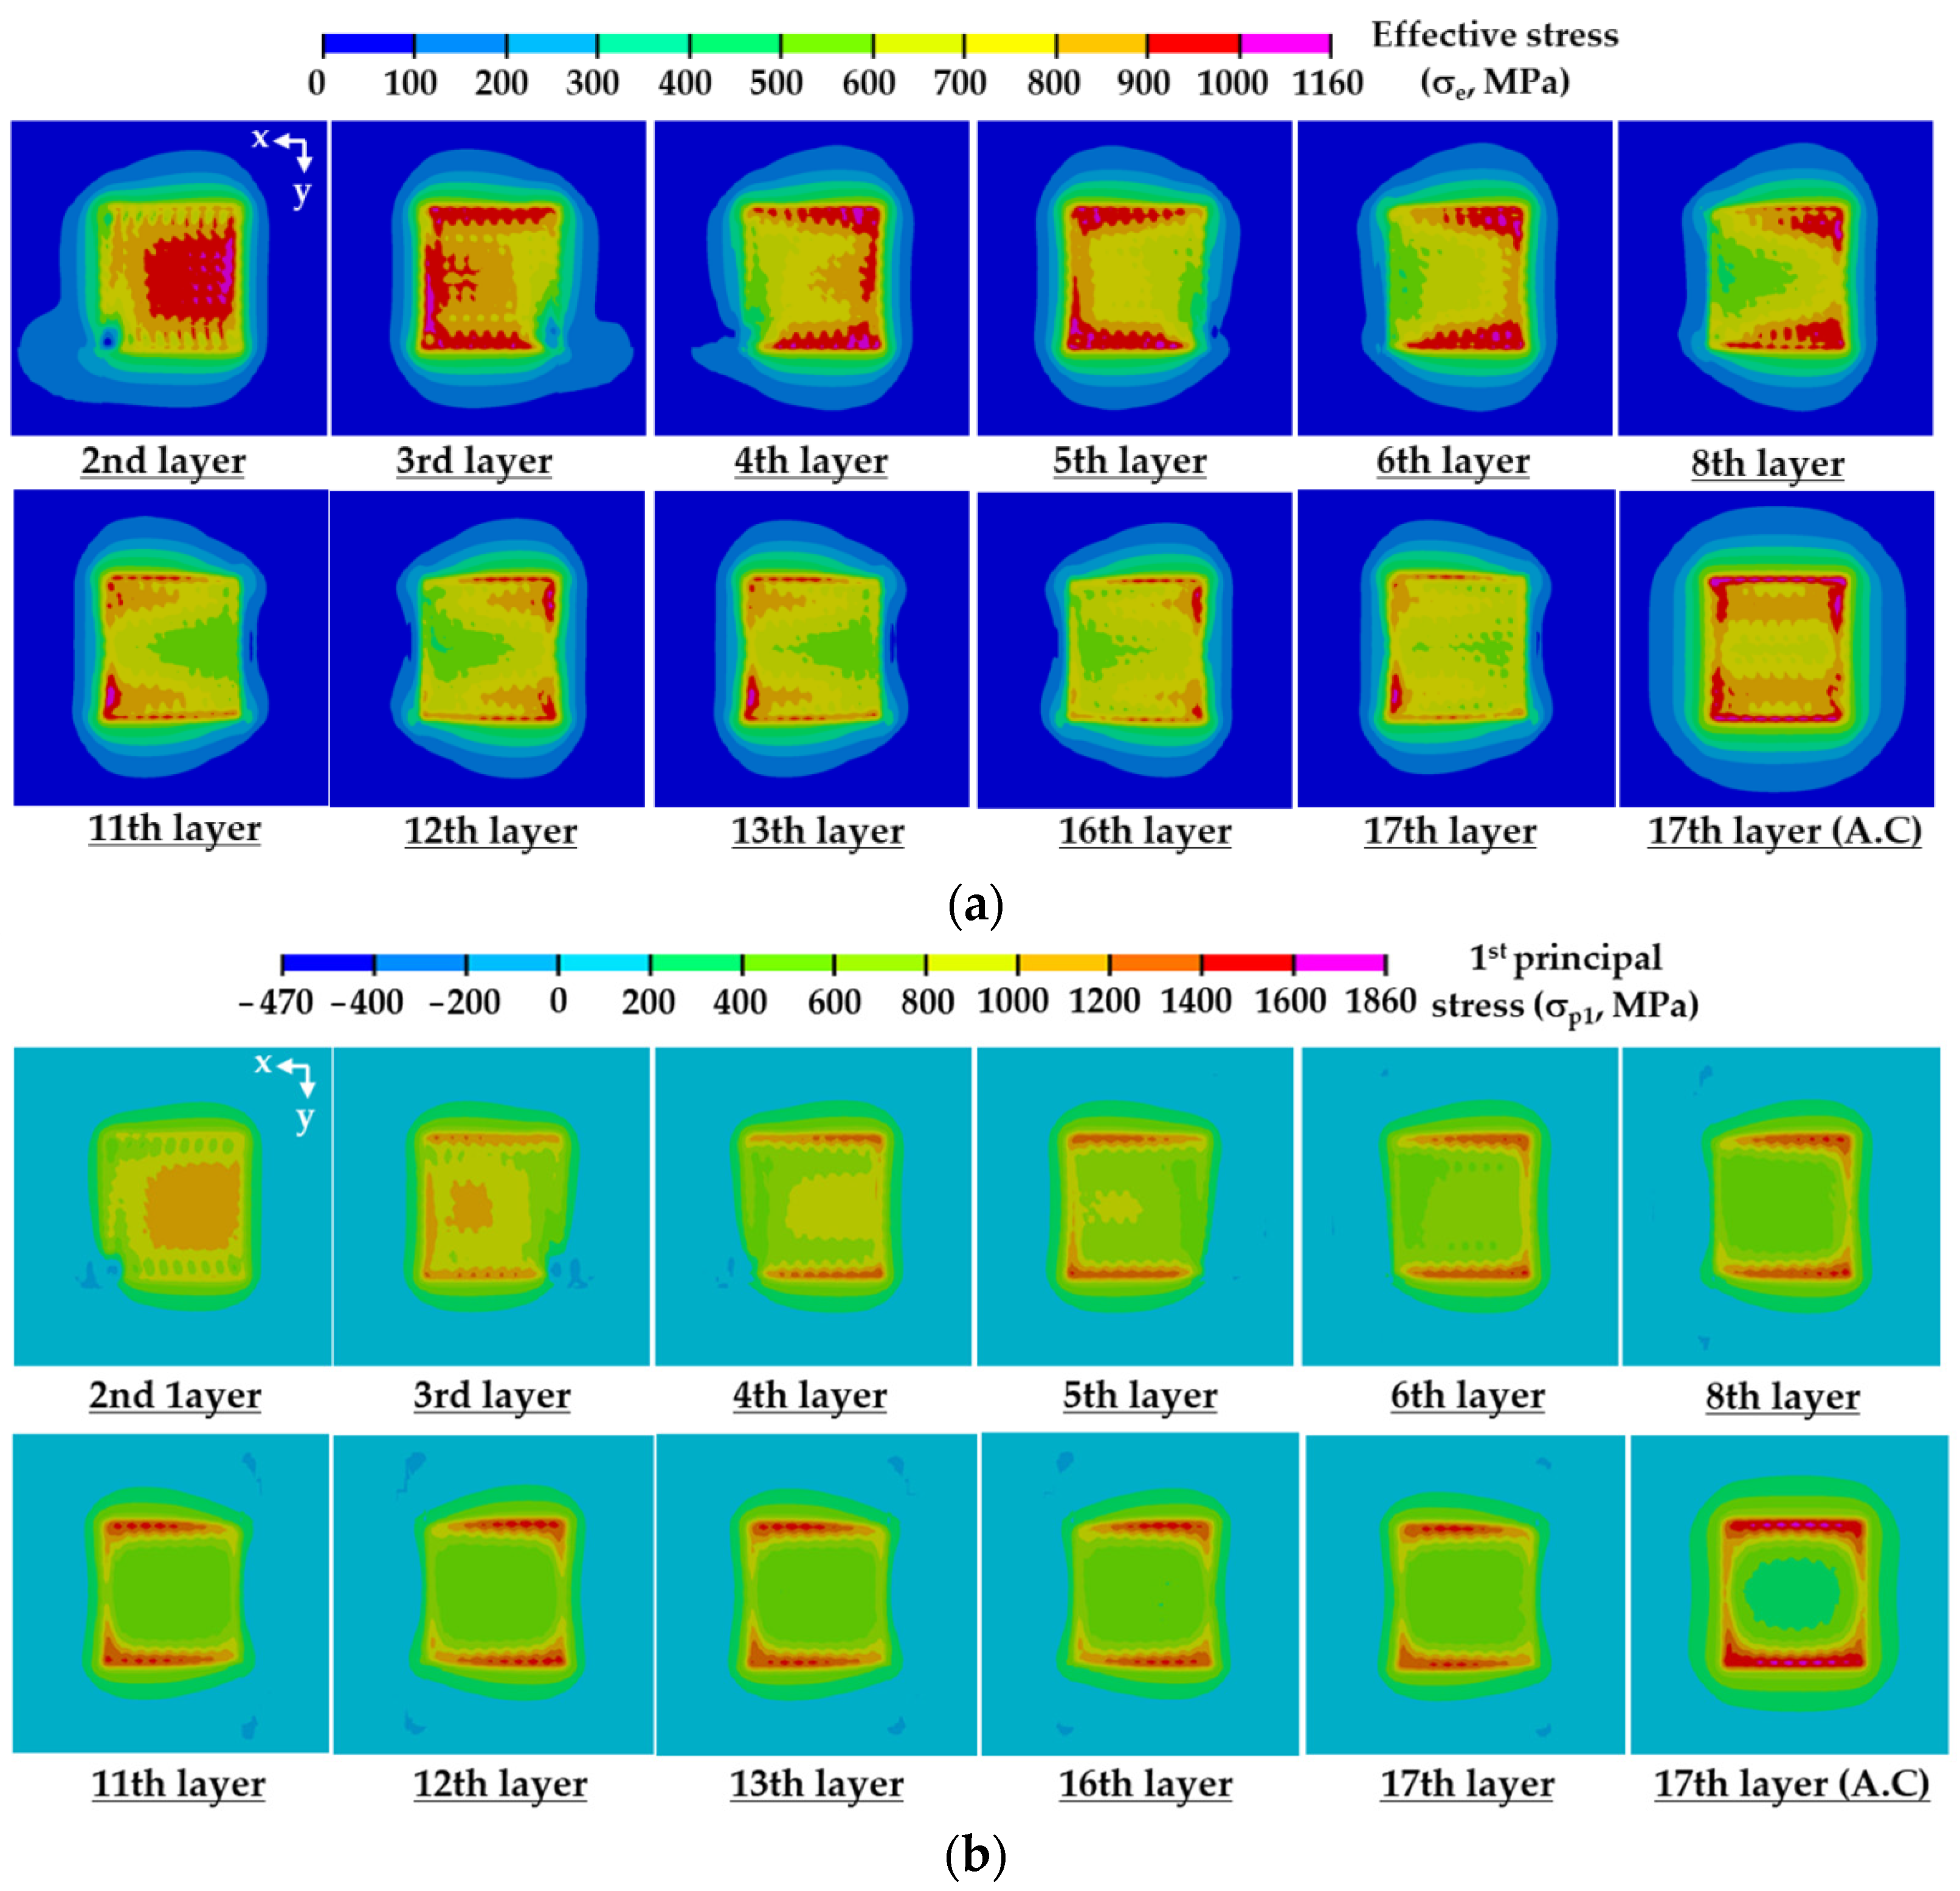
3.3. Thermo-Mechanical Characteristics and Suitable Deposition Strategy
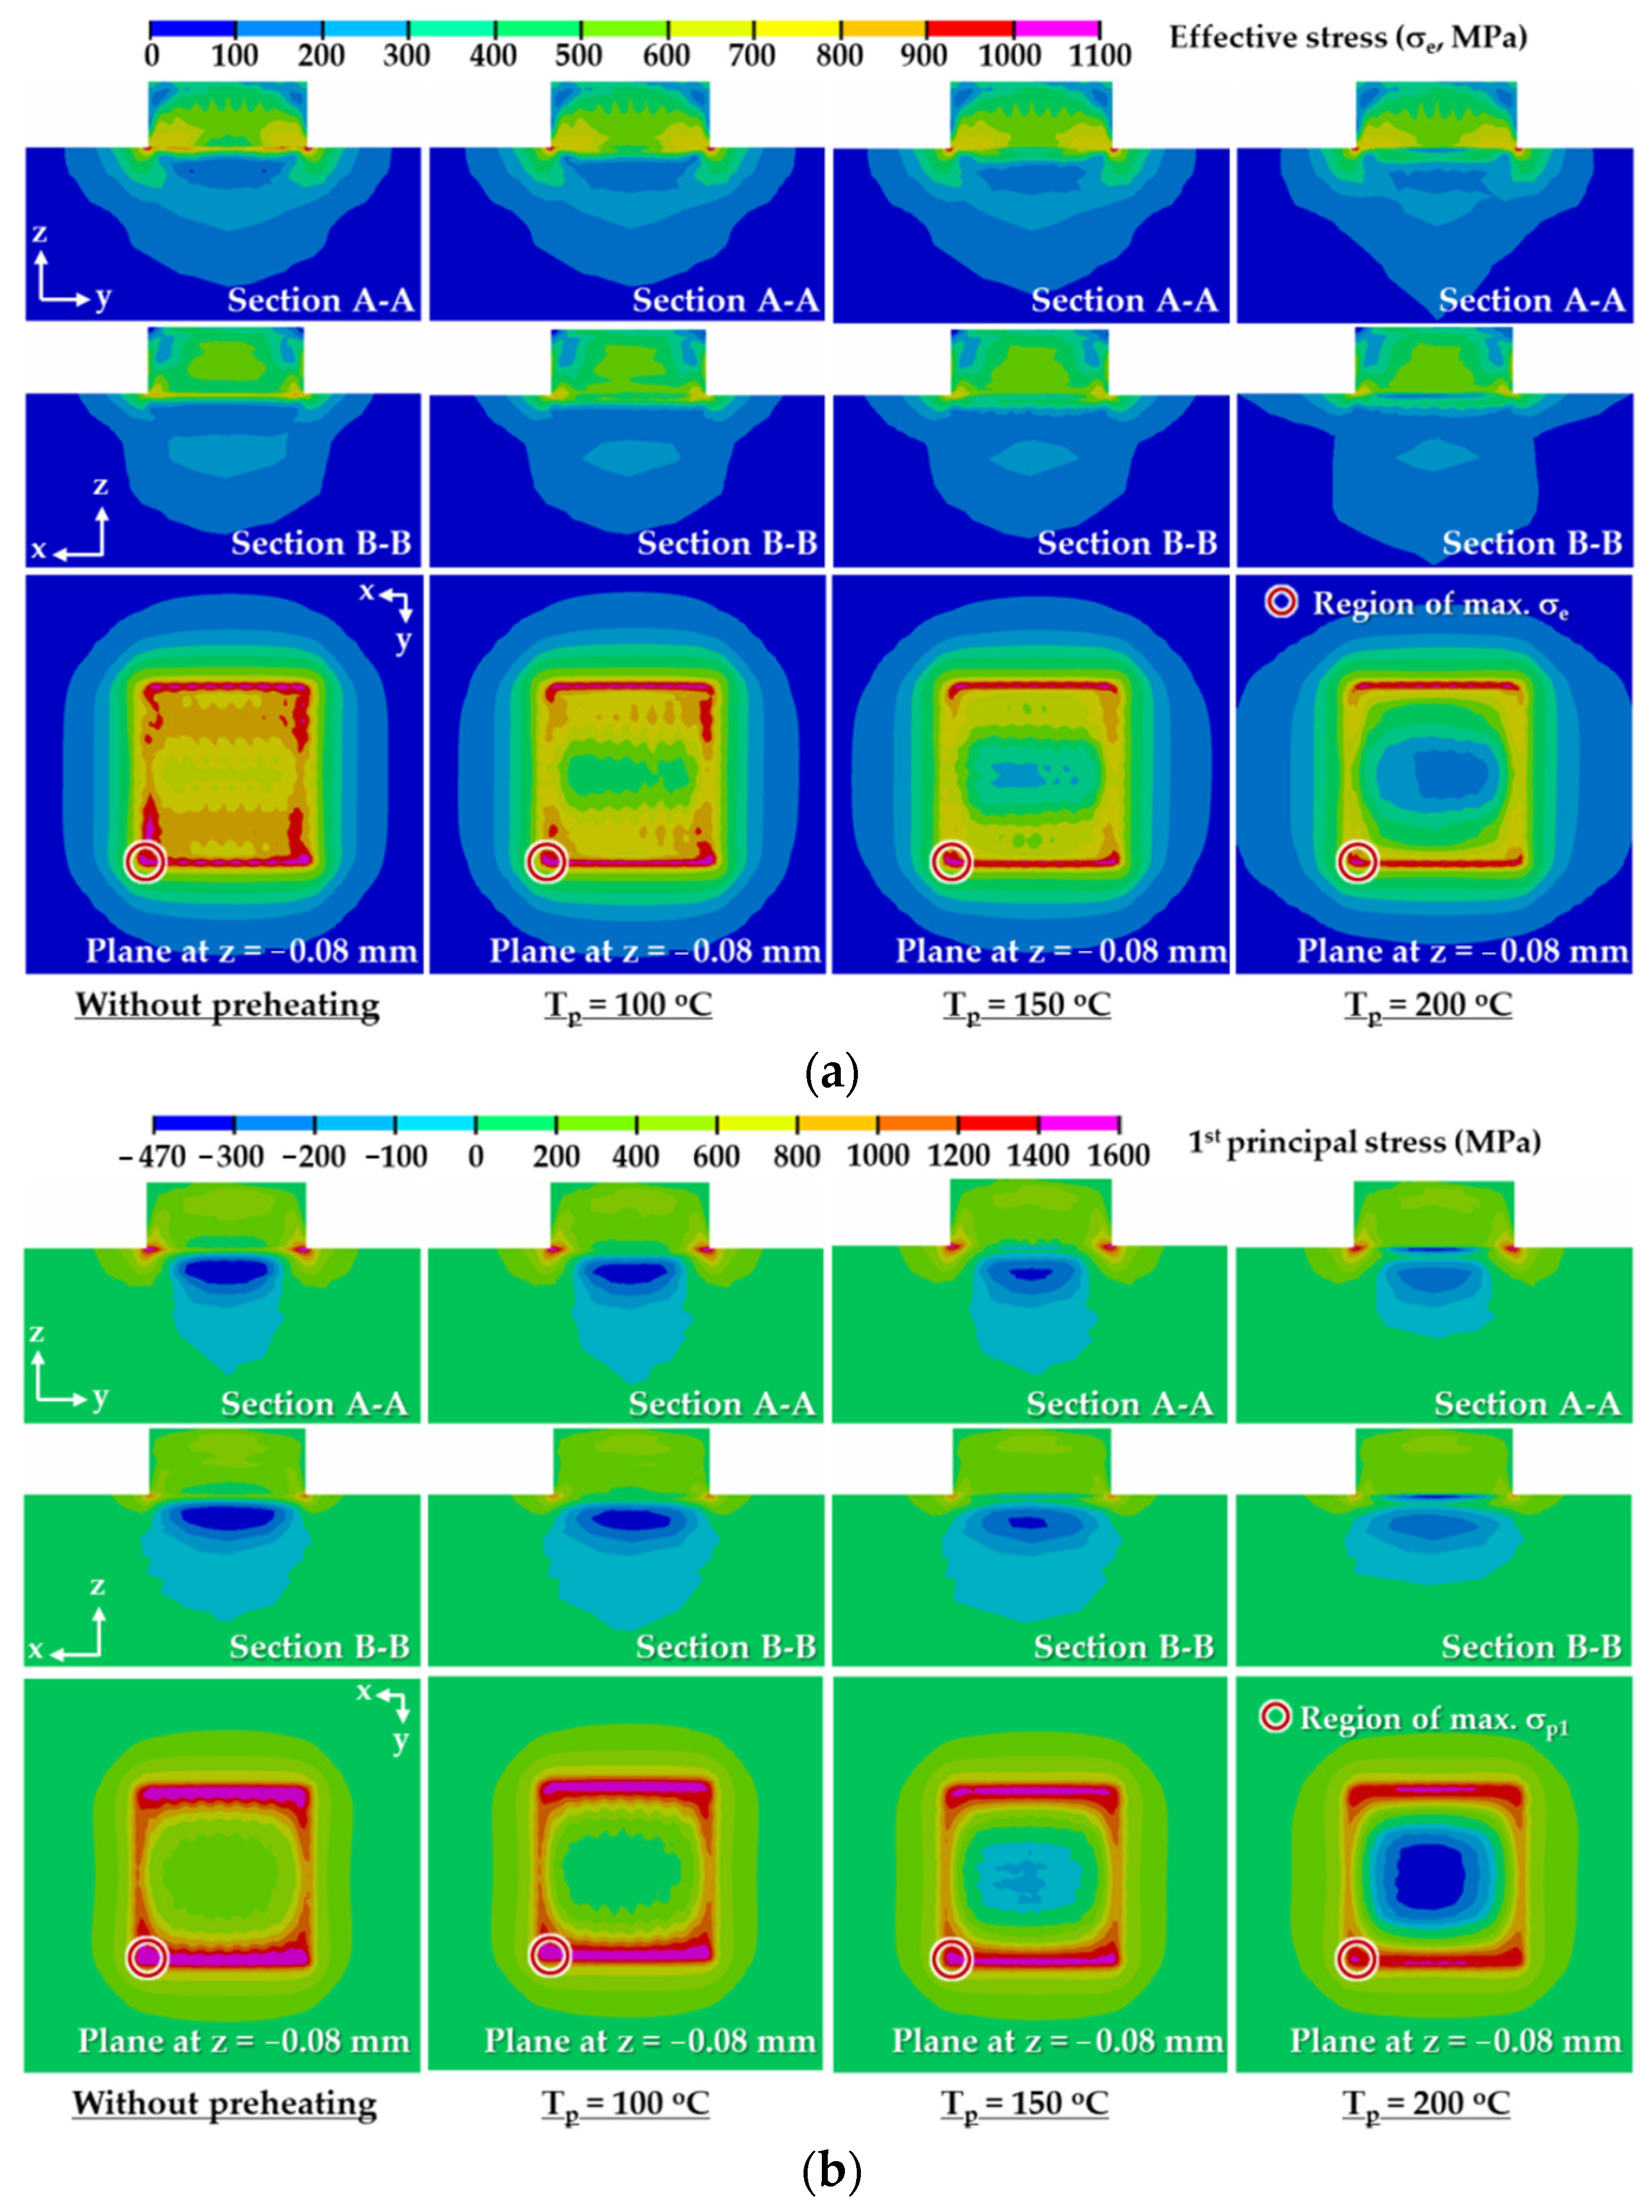
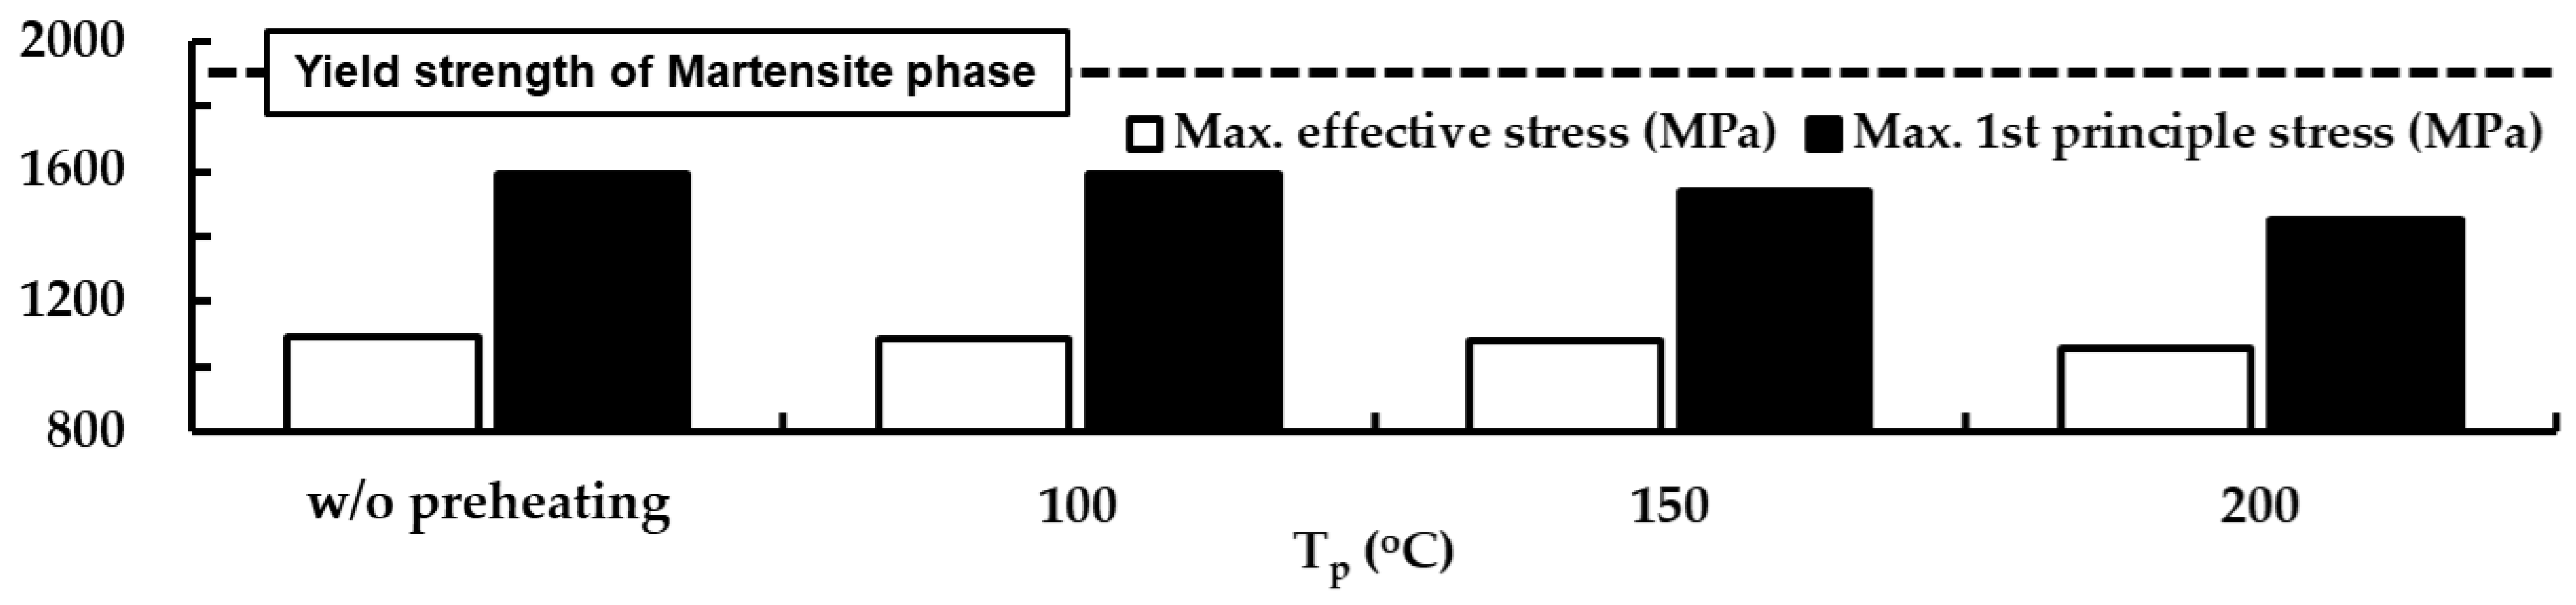
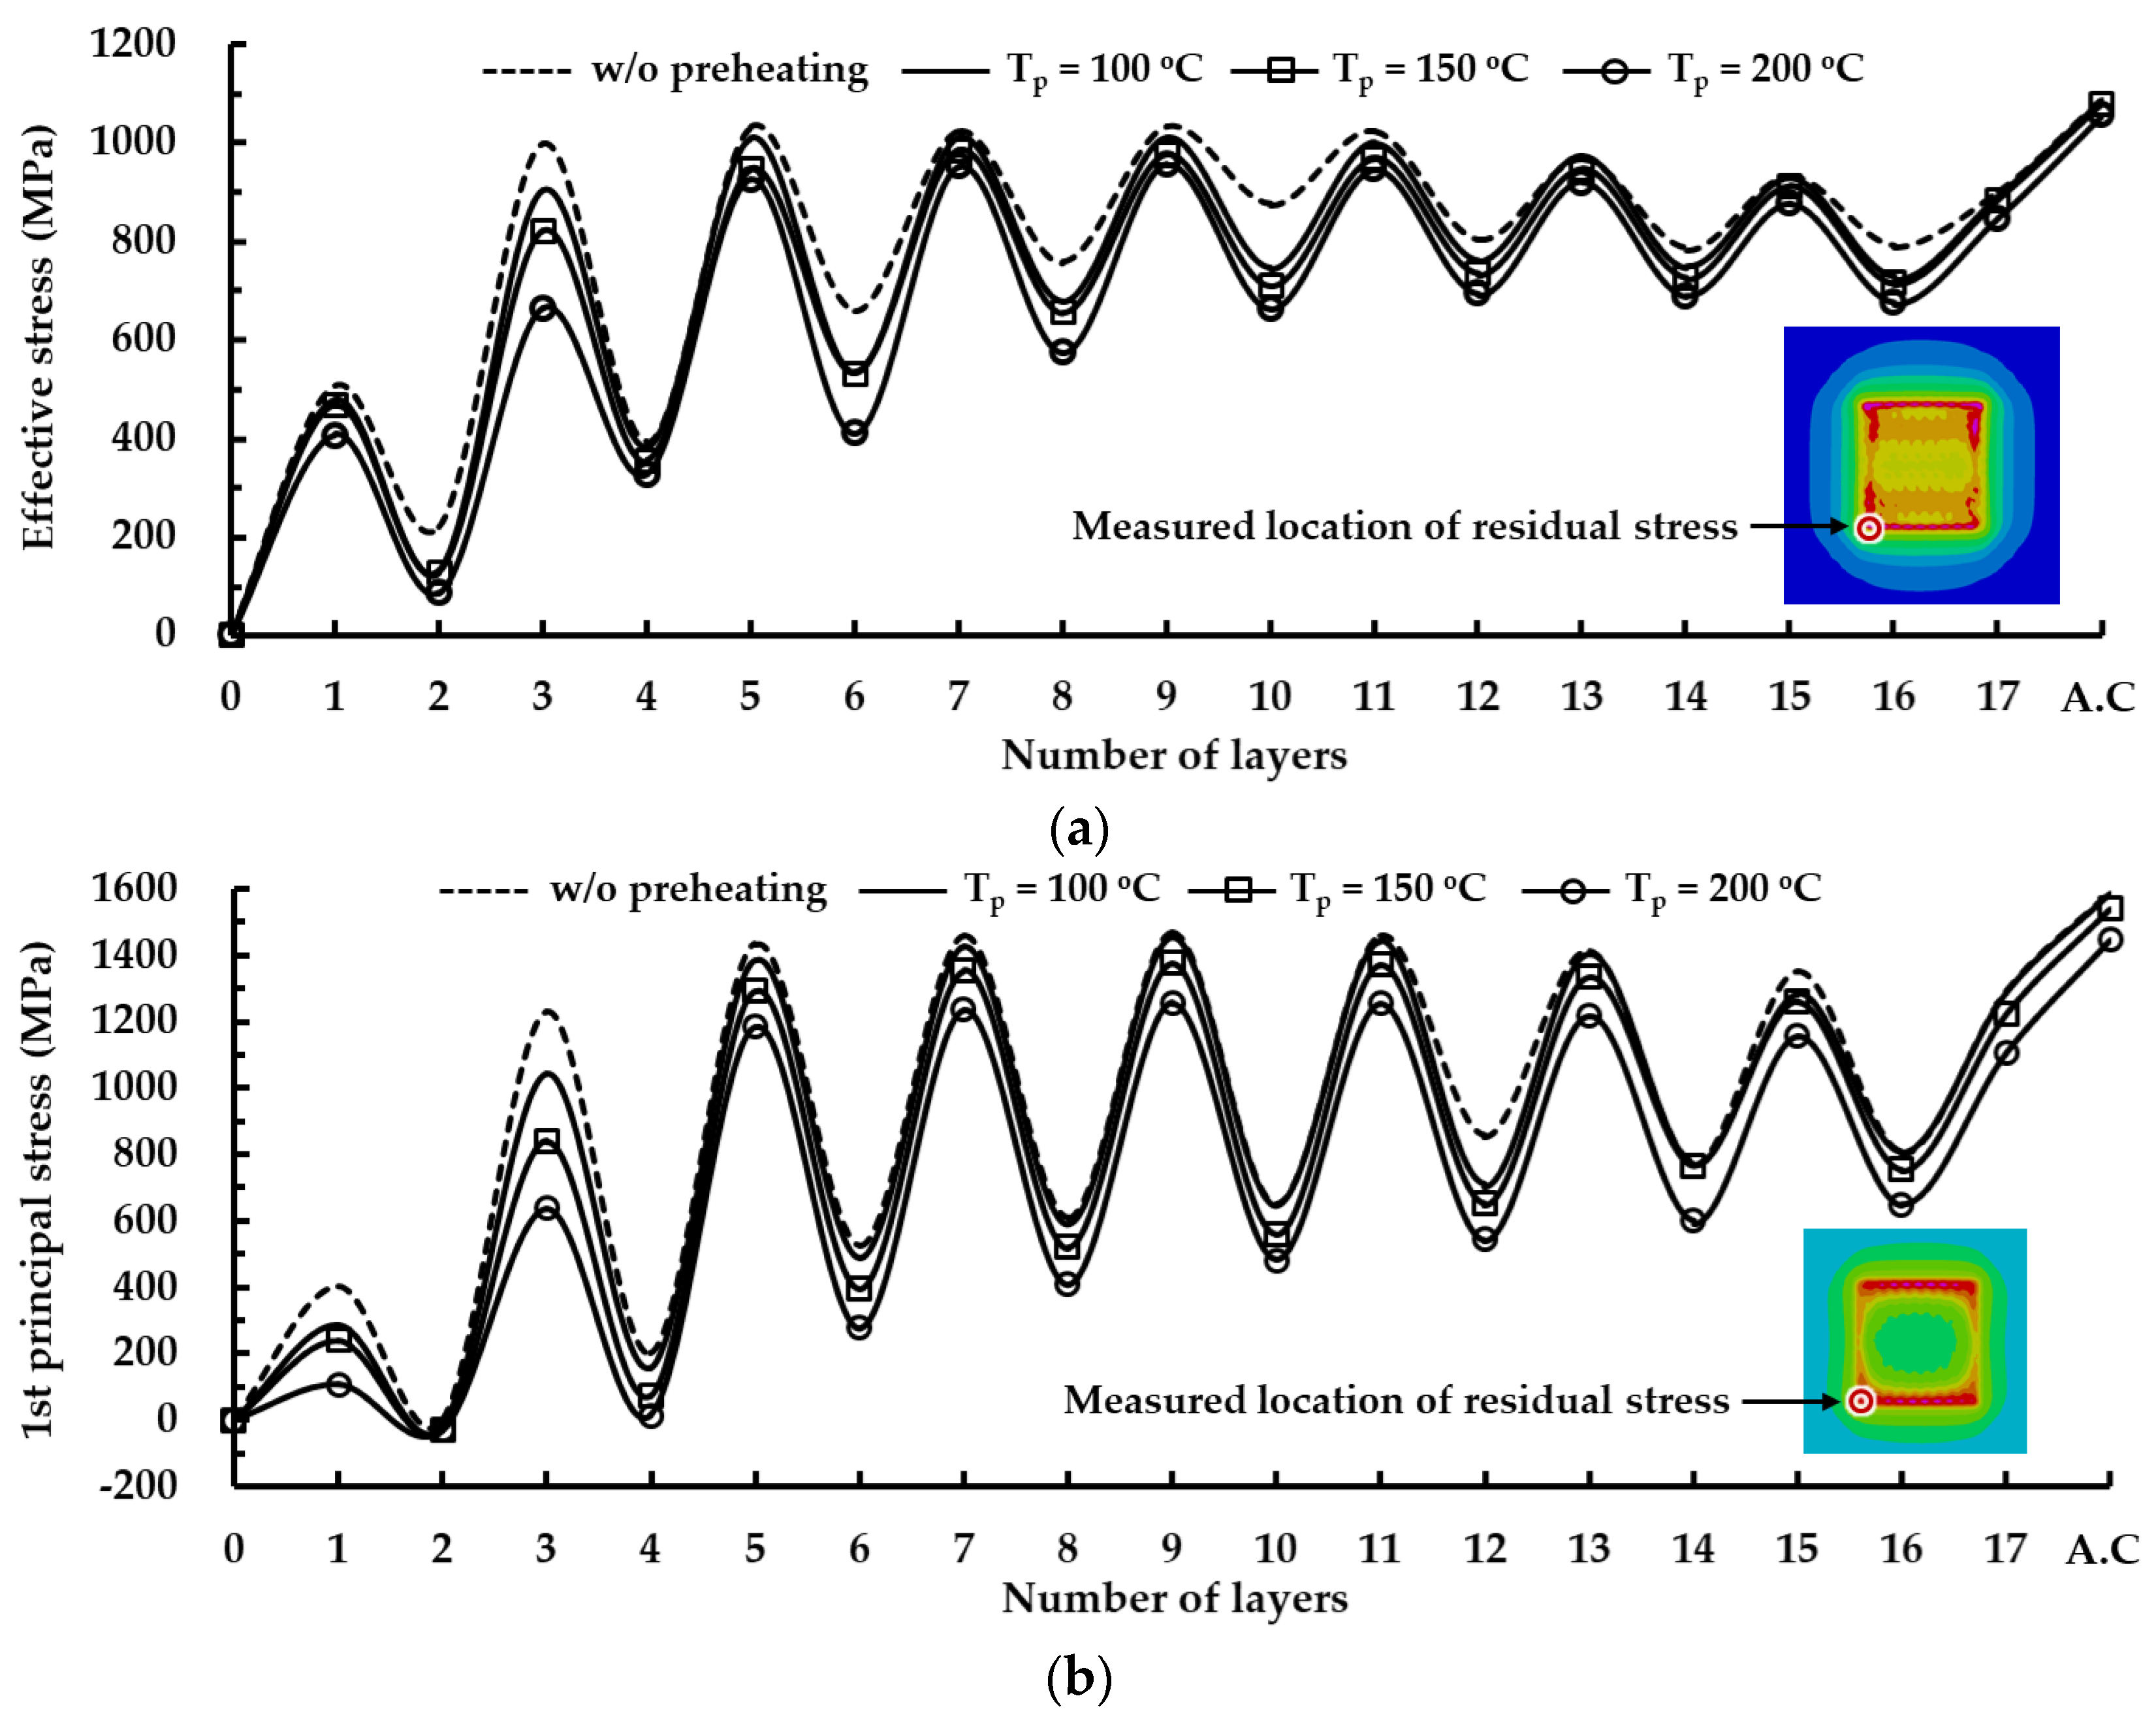
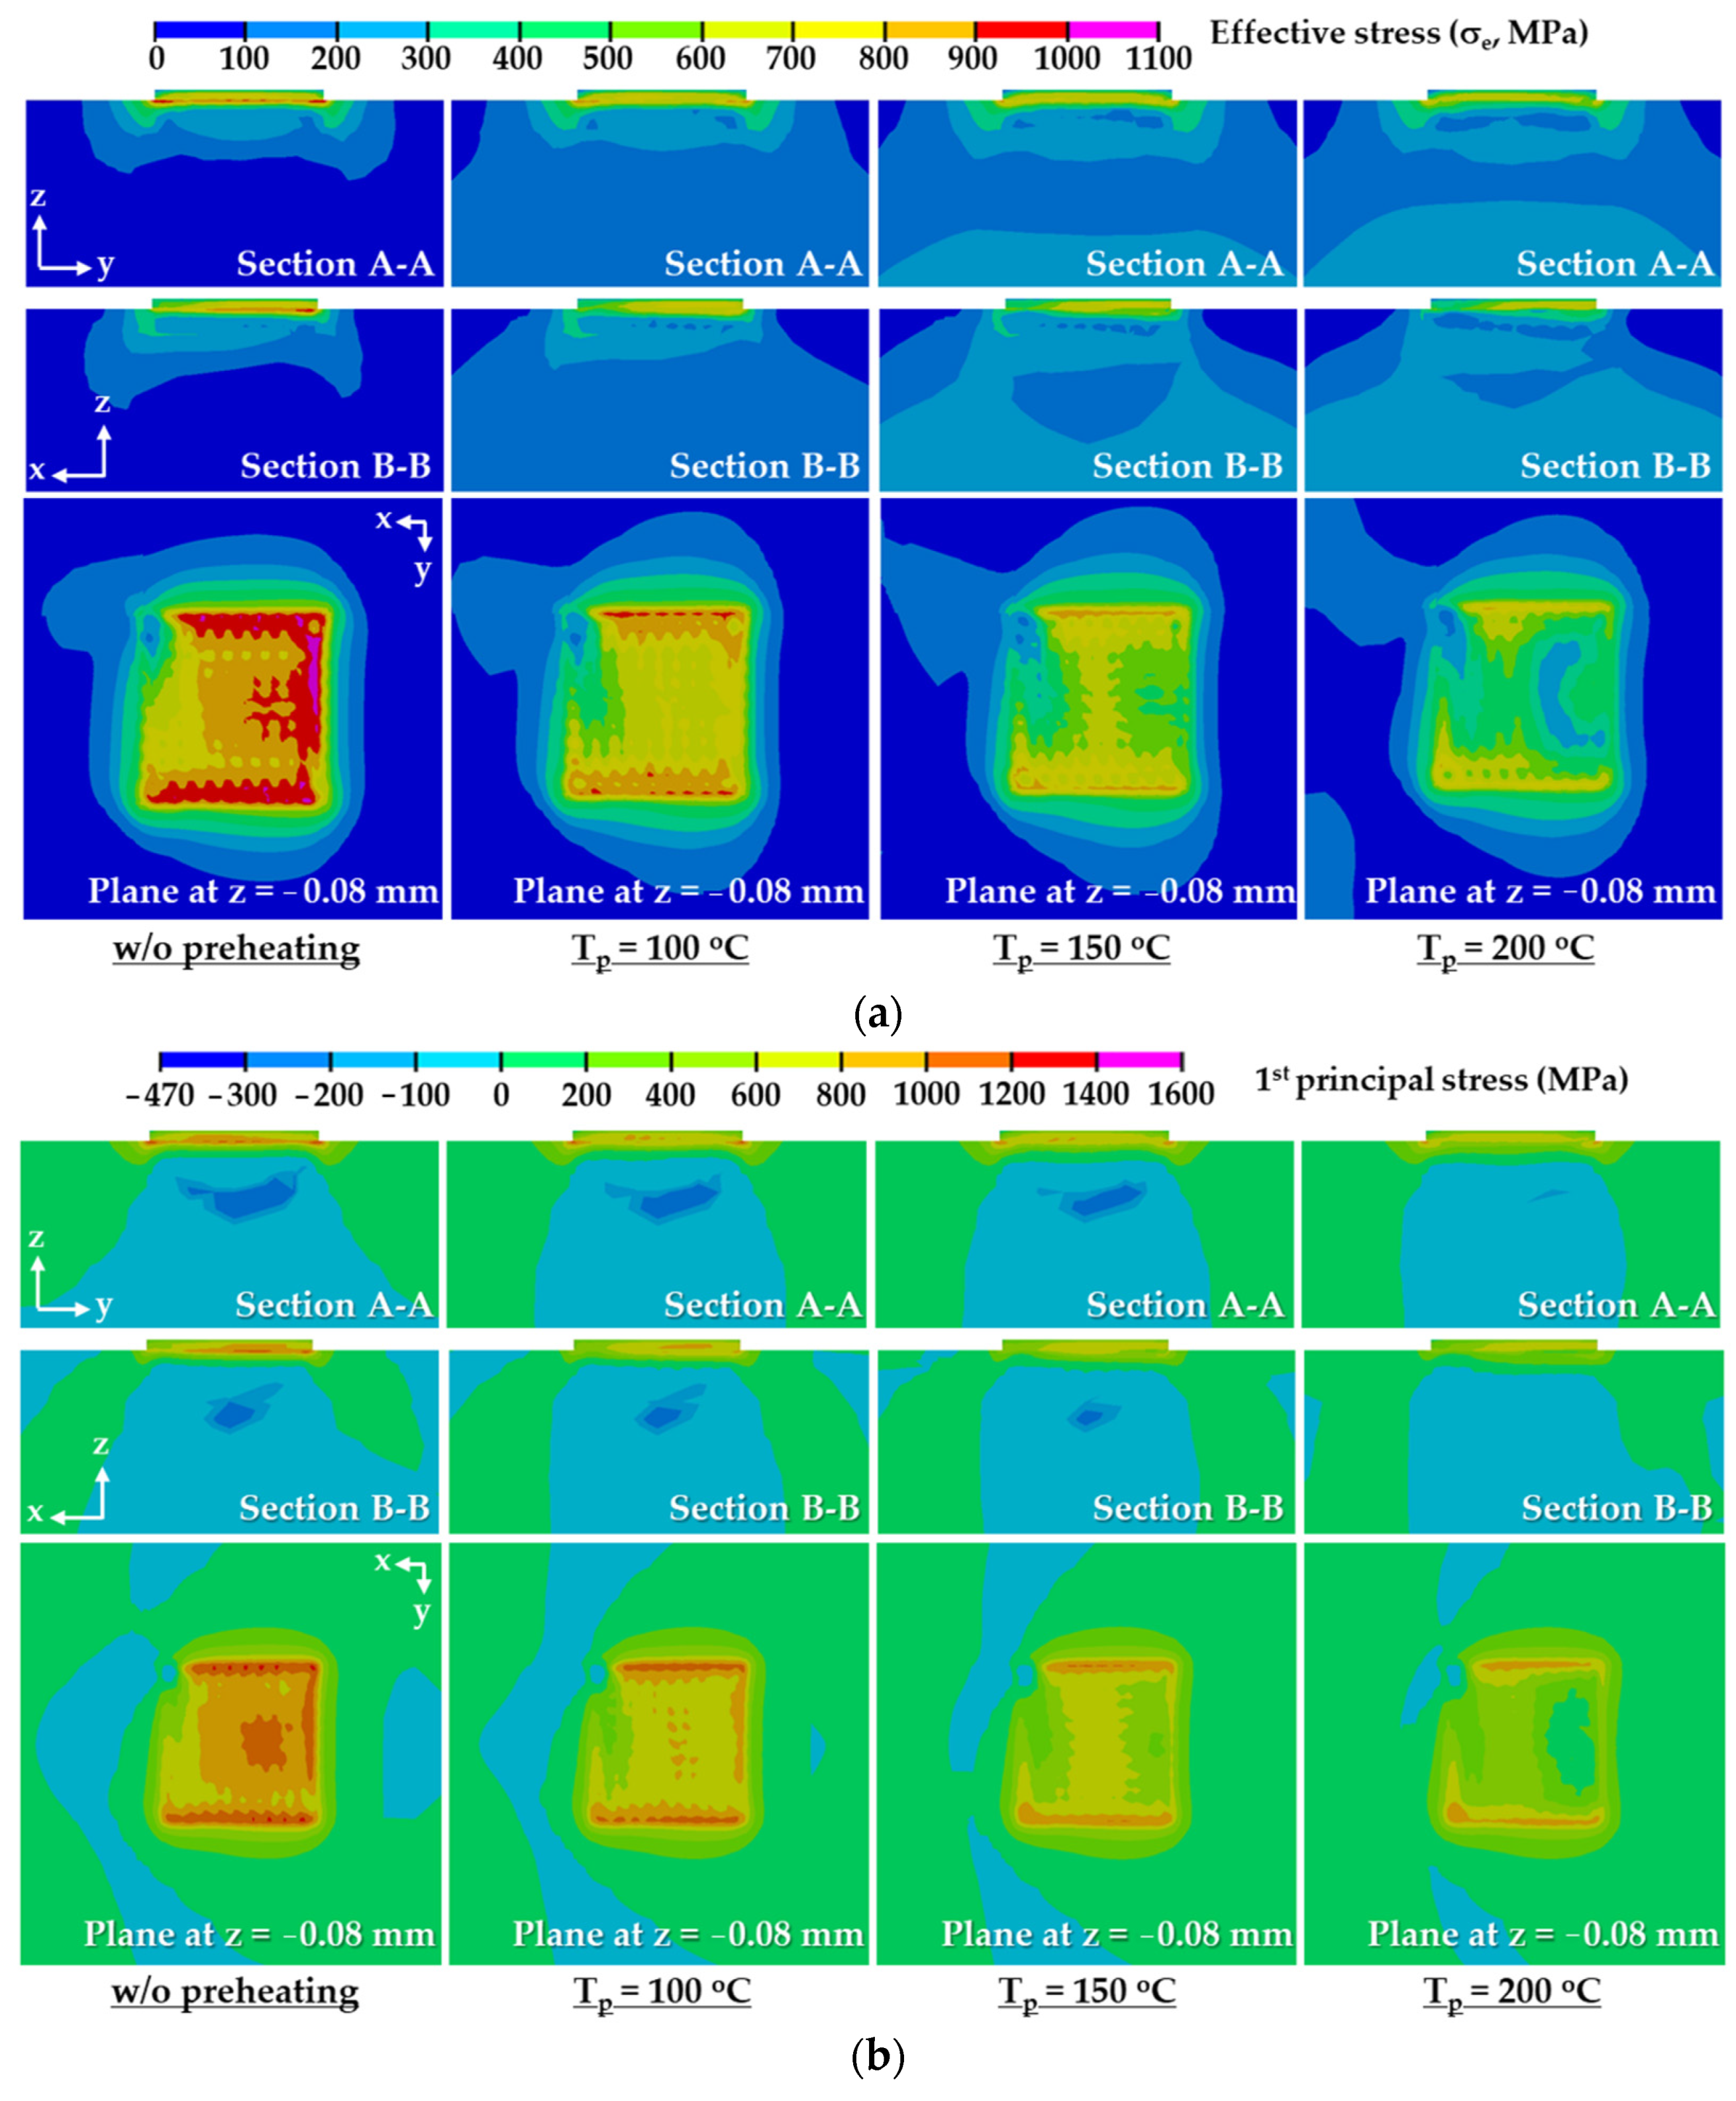
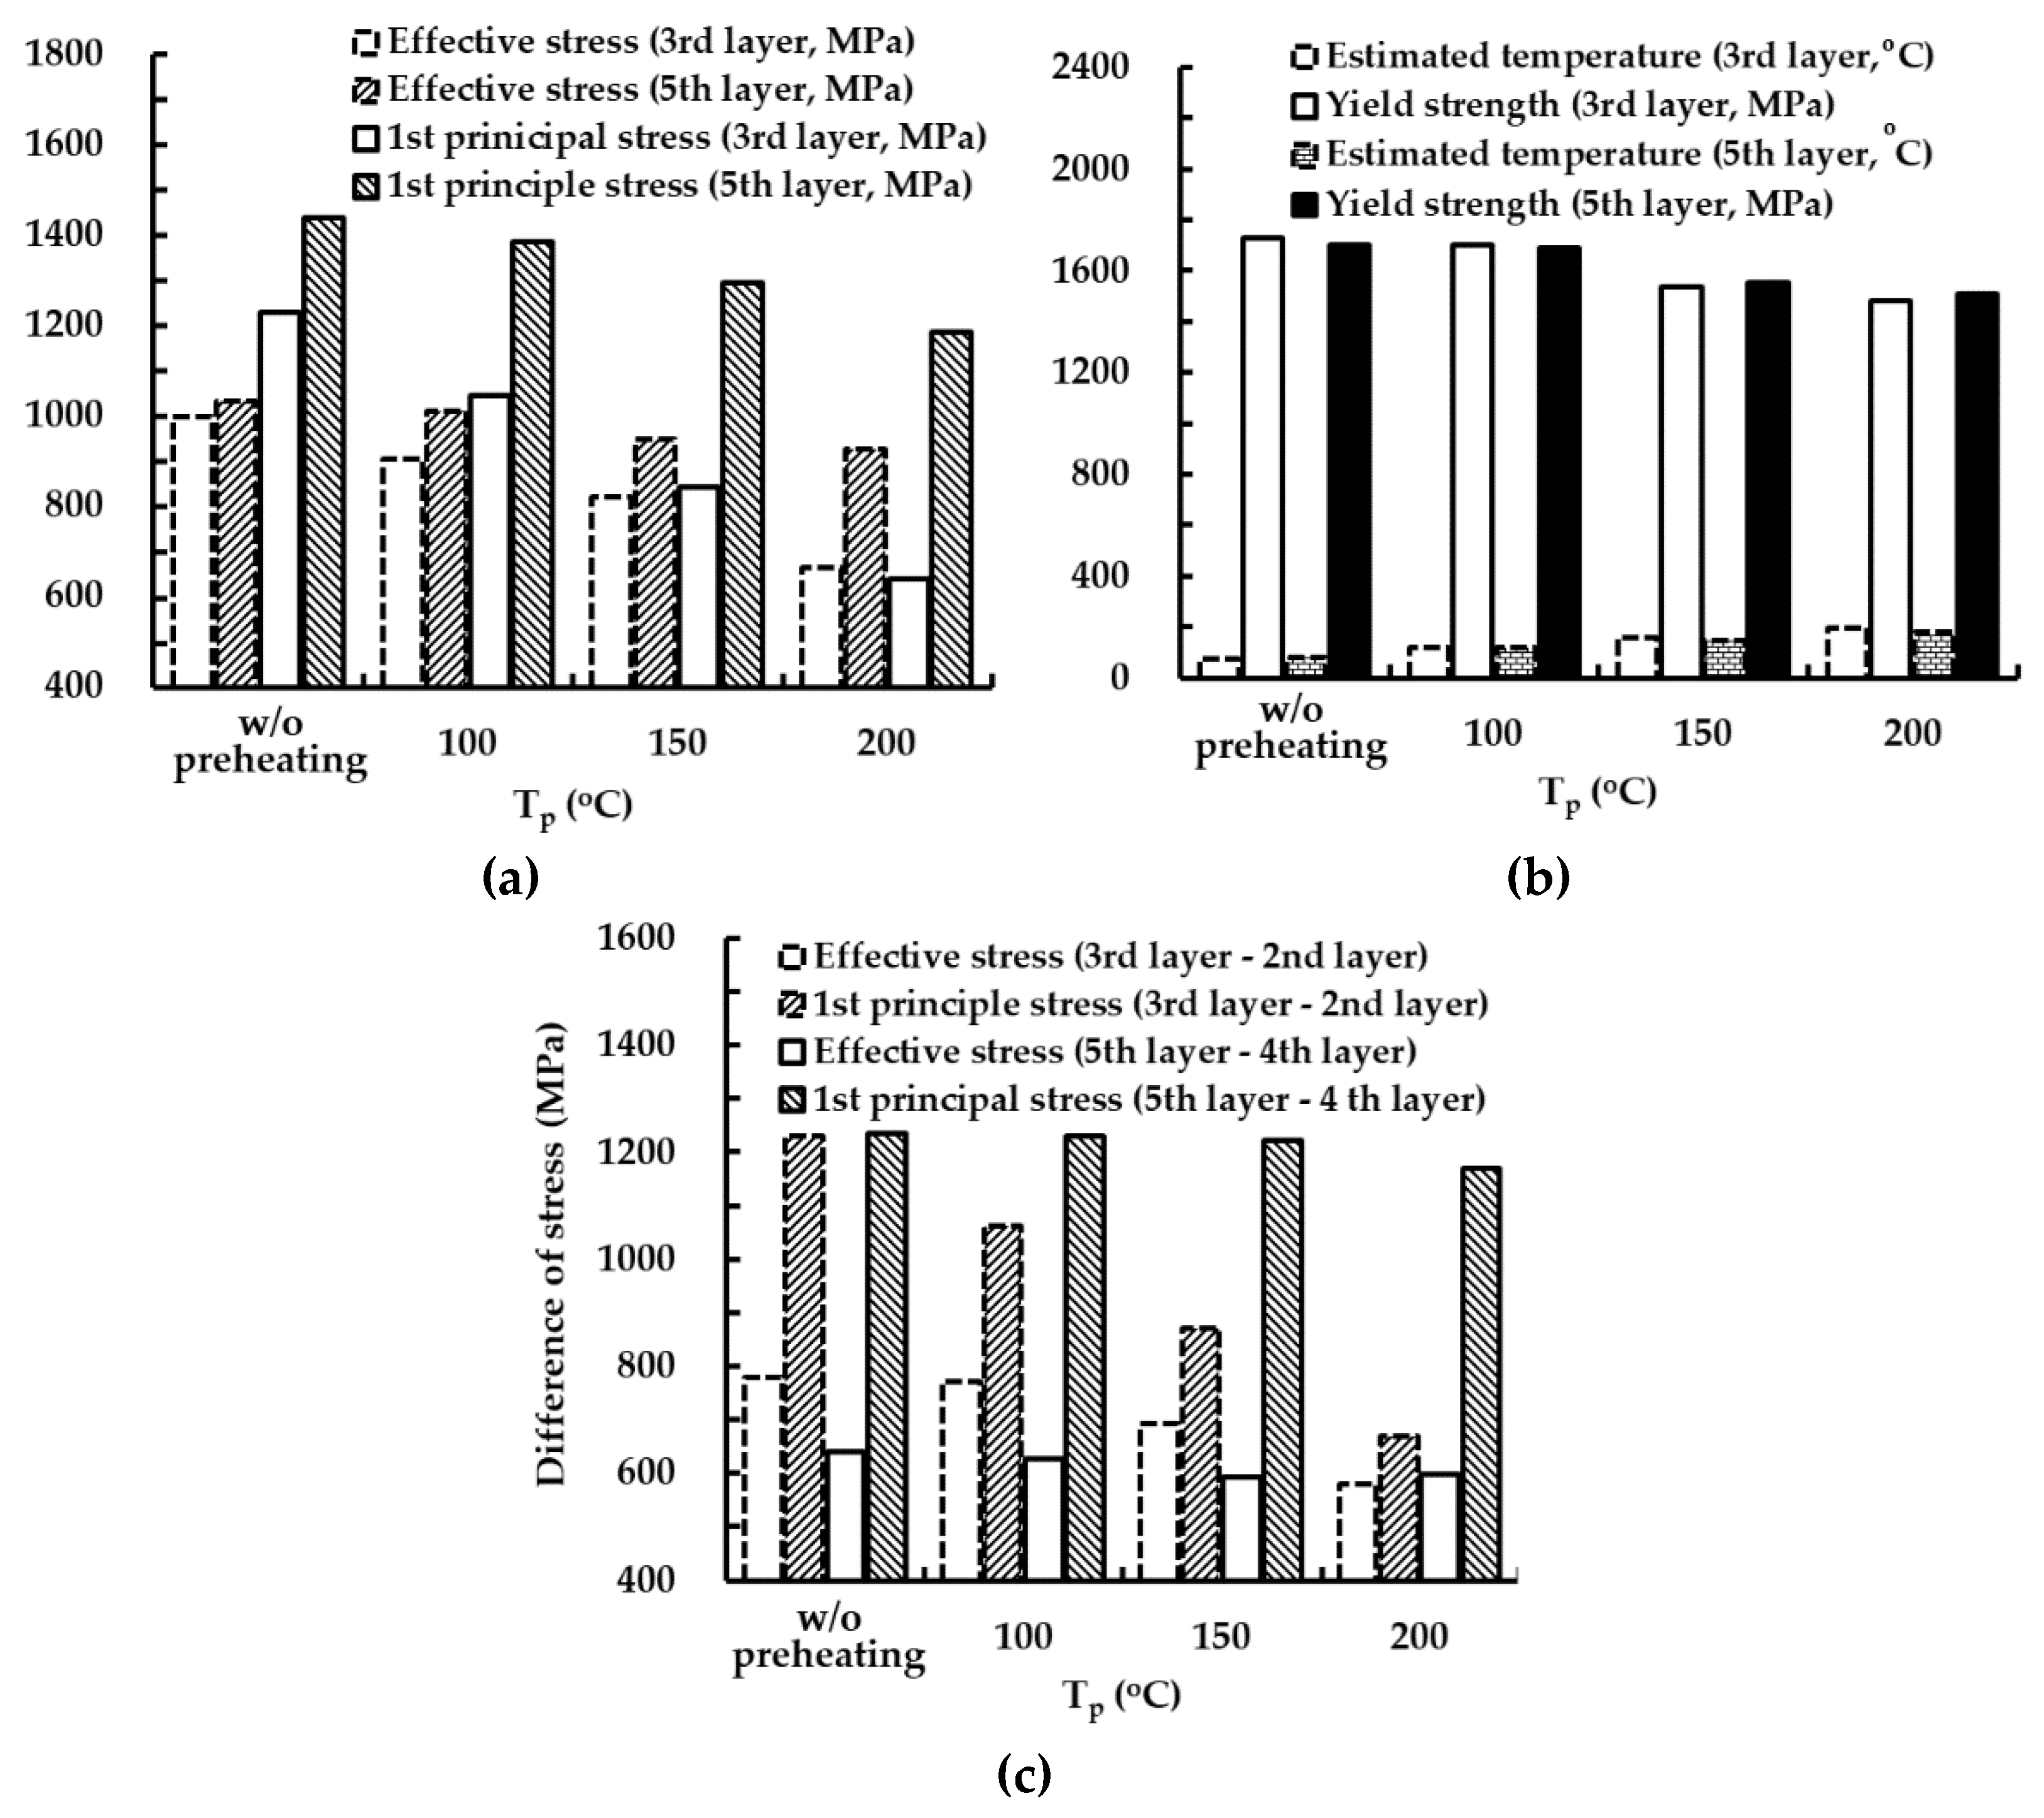
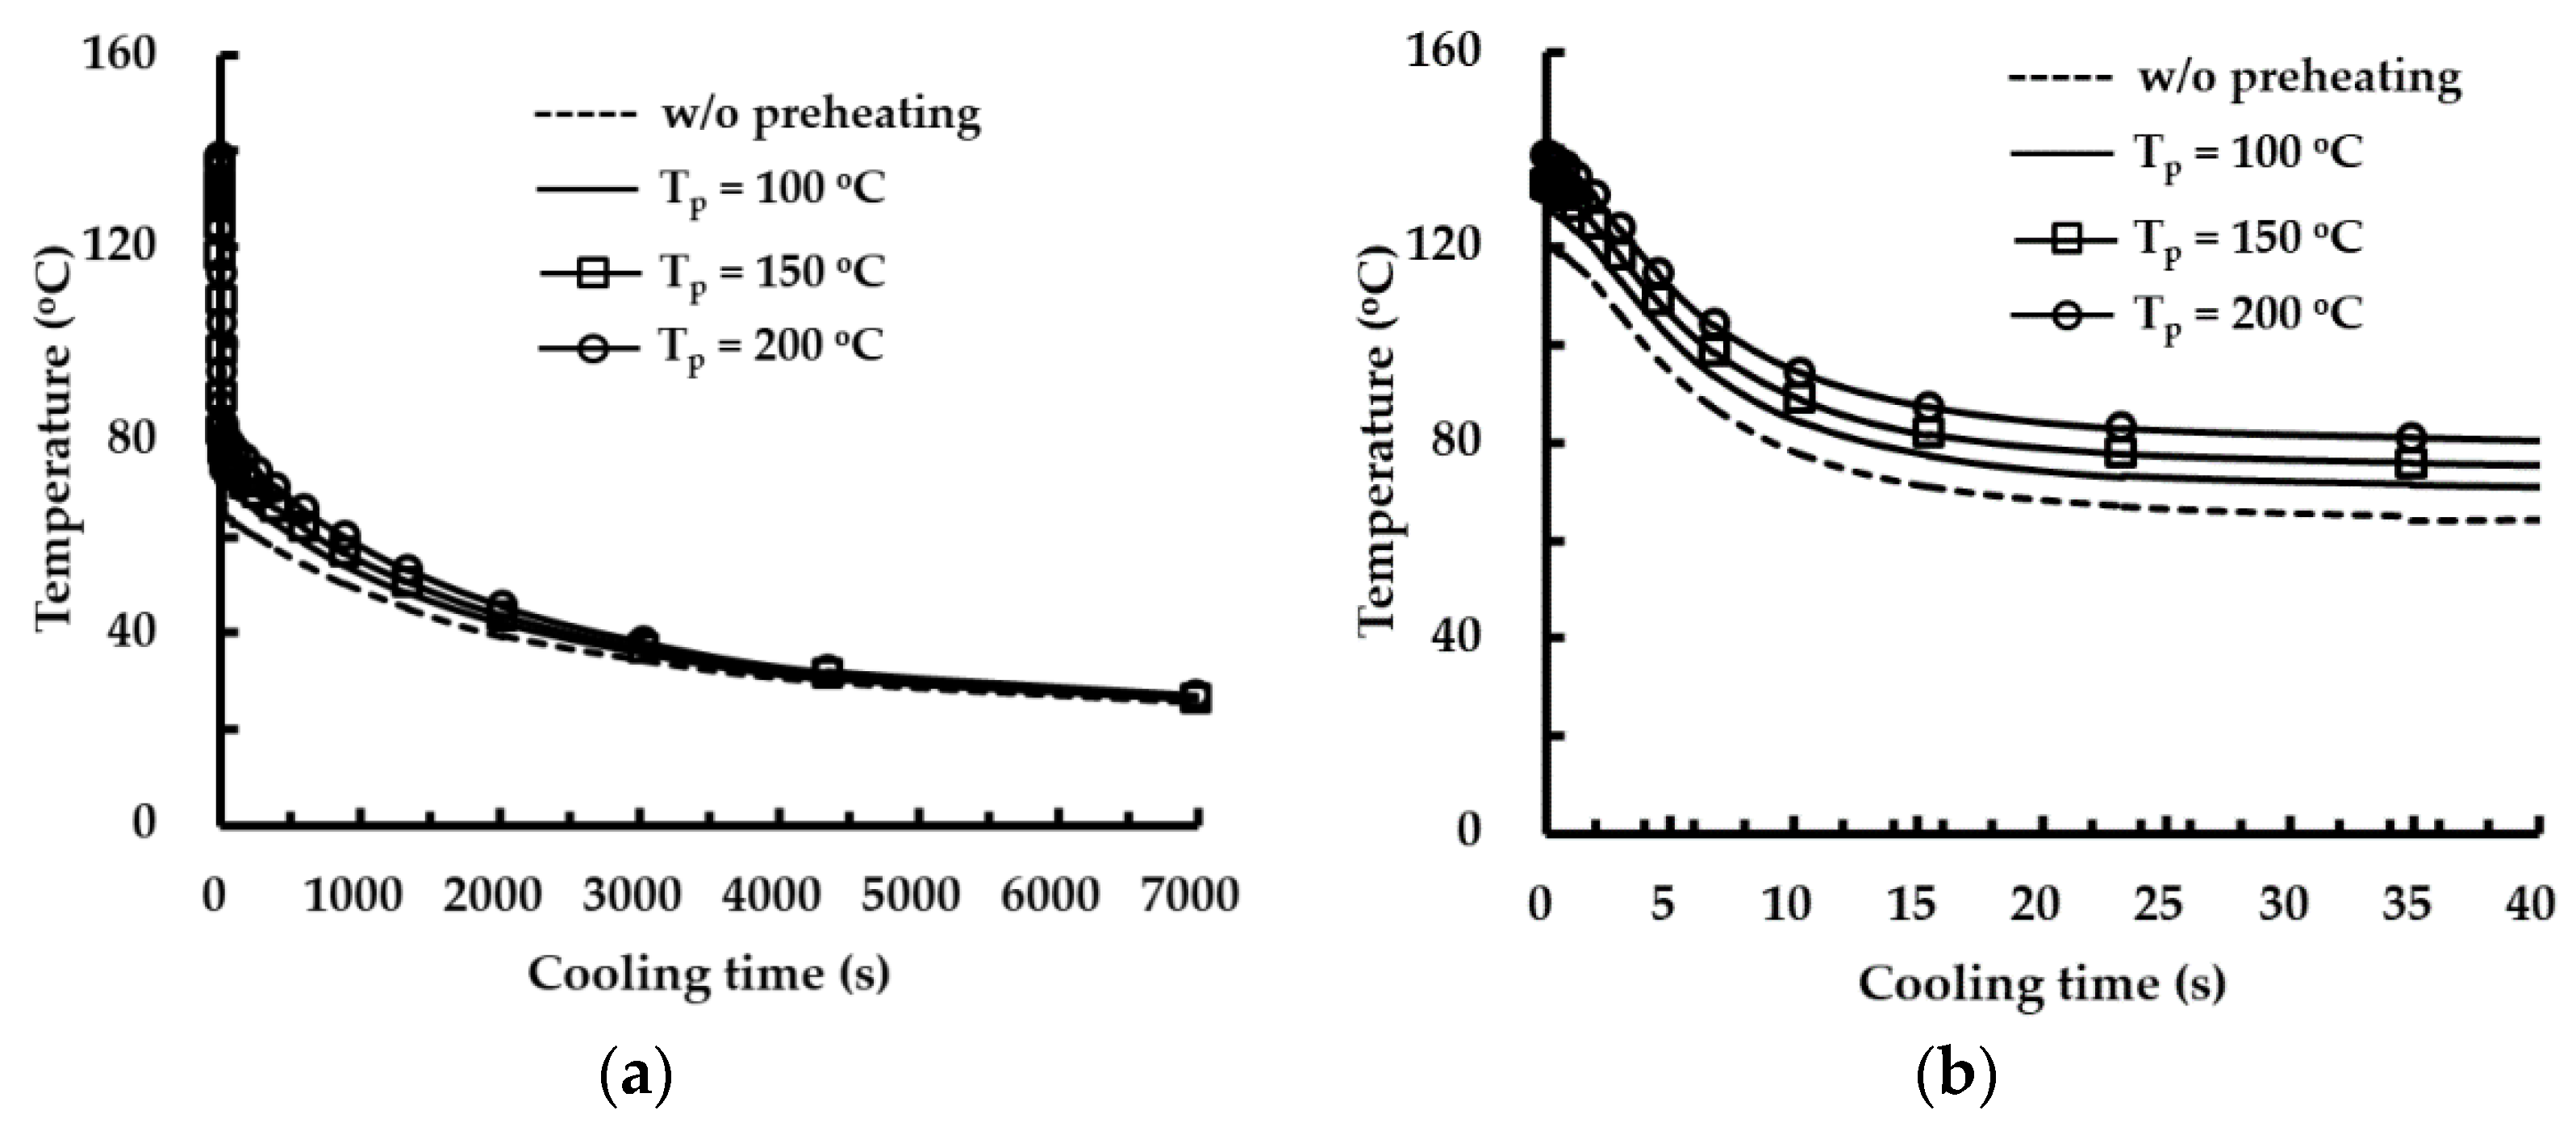
3.4. Preheating Temperature
4. Conclusions
Author Contributions
Funding
Institutional Review Board Statement
Informed Consent Statement
Data Availability Statement
Conflicts of Interest
Abbreviations
| DED | Directed energy deposition |
| LENS | Laser engineered net shaping |
| FE | Finite element |
| FEA | Finite element analysis |
| TC | Thermocouple |
| ML | Measured location |
| TD | Thickness direction |
| ESR | Excessively stressed region |
| ADDS | Alternative directional deposition strategy |
| UDDS | Unidirectional deposition strategy |
| FDS | Feasible deposition strategy |
| A.C | After cooling |
References
- Dass, A.; Moridi, A. State of the Art in Direct Energy Deposition: From Additive Manufacturing to Materials Design. Coatings 2019, 9, 418. [Google Scholar] [CrossRef] [Green Version]
- Chua, B.-L.; Ahn, D.-G. Estimation Method of Interpass Time for the Control of Temperature during a Directed Energy Deposition Process of a Ti-6Al-4V Planar Layer. Materials 2020, 13, 4935. [Google Scholar] [CrossRef]
- Thompson, S.M.; Bian, L.; Shamsaei, N.; Yadollahi, A. An Overview of Direct Laser Deposition for Additive Manufacturing; Part I: Transport Phenomena, Modeling and Diagnostics. Addit. Manuf. 2015, 8, 36–62. [Google Scholar] [CrossRef]
- Li, J.; Zhou, X.; Brochu, M.; Provatas, N.; Zhao, Y.F. Solidification Microstructure Simulation of Ti-6Al-4V in Metal Additive Manufacturing: A Review. Addit. Manuf. 2020, 31, 100898. [Google Scholar] [CrossRef]
- Sing, S.L.; Yeong, W.Y. Laser Powder Bed Fusion for Metal Additive Manufacturing: Perspectives on Recent Developments. Virtual Phys. Prototyp. 2020, 15, 359–370. [Google Scholar] [CrossRef]
- Sames, W.J.; List, F.A.; Pannala, S.; Dehoff, R.R.; Babu, S.S. The Metallurgy and Processing Science of Metal Additive Manufacturing. Int. Mater. Rev. 2016, 61, 315–360. [Google Scholar] [CrossRef]
- Ahn, D.-G. Direct Metal Additive Manufacturing Processes and Their Sustainable Applications for Green Technology: A Review. Int. J. Precis. Eng. Manuf. Green Technol. 2016, 3, 381–395. [Google Scholar] [CrossRef]
- Ahn, D.-G. Directed Energy Deposition (DED) Process: State of the Art. Int. J. Precis. Eng. Manuf. Green Technol. 2021, 8, 703–742. [Google Scholar] [CrossRef]
- Singh, A.; Kapil, S.; Das, M. A Comprehensive Review of the Methods and Mechanisms for Powder Feedstock Handling in Directed Energy Deposition. Addit. Manuf. 2020, 35, 101388. [Google Scholar] [CrossRef]
- Saboori, A.; Aversa, A.; Marchese, G.; Biamino, S.; Lombardi, M.; Fino, P. Application of Directed Energy Deposition-Based Additive Manufacturing in Repair. Appl. Sci. 2019, 9, 3316. [Google Scholar] [CrossRef] [Green Version]
- Leino, M.; Pekkarinen, J.; Soukka, R. The Role of Laser Additive Manufacturing Methods of Metals in Repair, Refurbishment and Remanufacturing—Enabling Circular Economy. Phys. Proc. 2016, 83, 752–760. [Google Scholar] [CrossRef] [Green Version]
- Carroll, B.E.; Otis, R.A.; Borgonia, J.P.; Suh, J.; Dillon, R.P.; Shapiro, A.A.; Hoffman, D.C.; Liu, Z.-K.; Beese, A.M. Functionally Graded Material of 304L Stainless Steel and Inconel 625 Fabricated by Directed Energy Deposition: Characterization and Thermodynamic Modeling. Acta Mater. 2016, 108, 46–54. [Google Scholar] [CrossRef] [Green Version]
- Ji, S.; Sun, Z.; Zhang, W.; Chen, X.; Xie, G.; Chang, H. Microstructural Evolution and High Temperature Resistance of Functionally Graded Material Ti-6Al-4V/Inconel 718 Coated by Directed Energy Deposition-Laser. J. Alloy Compd. 2020, 848, 156255. [Google Scholar] [CrossRef]
- Dávila, J.L.; Neto, P.I.; Noritomi, P.Y.; Coelho, R.T.; da Silva, J.V.L. Hybrid Manufacturing: A Review of the Synergy between Directed Energy Deposition and Subtractive Processes. Int. J. Adv. Manuf. Technol. 2020, 110, 3377–3390. [Google Scholar] [CrossRef]
- Woo, W.-S.; Kim, E.-J.; Jeong, H.-I.; Lee, C.-H. Laser-Assisted Machining of Ti-6Al-4V Fabricated by DED Additive Manufacturing. Int. J. Precis. Eng. Manuf. Green Technol. 2020, 7, 559–572. [Google Scholar] [CrossRef]
- Liu, J.; Zheng, Y.; Ma, Y.; Qureshi, A.; Ahmad, R. A Topology Optimization Method for Hybrid Subtractive–Additive Remanufacturing. Int. J. Precis. Eng. Manuf. Green Technol. 2020, 7, 939–953. [Google Scholar] [CrossRef]
- Denlinger, E.R.; Heigel, J.C.; Michaleris, P.; Palmer, T.A. Effect of inter-layer dwell time on distortion and residual stress in additive manufacturing of titanium and nickel alloys. J. Mater. Process. Technol. 2015, 215, 123–131. [Google Scholar] [CrossRef]
- Heigel, J.C.; Michaleris, P.; Reutzel, E.W. Thermo-mechanical Model Development and Validation of Directed Energy Deposition Additive Manufacturing of Ti–6Al–4V. Addit. Manuf. 2015, 5, 9–19. [Google Scholar] [CrossRef]
- Lu, X.; Lin, X.; Chiumenti, M.; Cervera, M.; Li, J.; Ma, L.; Wei, L.; Hu, Y.; Huang, W. Finite Element Analysis and Experimental Validation of the Thermomechanical Behavior in Laser Solid Forming of Ti-6Al-4V. Addit. Manuf. 2018, 21, 30–40. [Google Scholar] [CrossRef]
- Stender, M.E.; Beghini, L.L.; Sugar, J.D.; Veilleux, M.G.; Subia, S.R.; Smith, T.R.; San Marchi, C.W.; Brown, A.A.; Dagel, D.J. A Thermal-Mechanical Finite Element Workflow for Directed Energy Deposition Additive Manufacturing Process Modeling. Addit. Manuf. 2018, 21, 556–566. [Google Scholar] [CrossRef] [Green Version]
- Kiran, A.; Hodek, J.; Vavřík, J.; Urbánek, M.; Džugan, J. Numerical Simulation Development and Computational Optimization for Directed Energy Deposition Additive Manufacturing Process. Materials 2020, 13, 2666. [Google Scholar] [CrossRef]
- Zhang, D.; Sun, S.; Qiu, D.; Gibson, M.A.; Dargusch, M.S.; Brandt, M.; Qian, M.; Easton, M. Metal Alloys for Fusion-Based Additive Manufacturing. Adv. Eng. Mater. 2018, 20, 1700952. [Google Scholar] [CrossRef]
- Chua, B.L.; Ahn, D.-G.; Kim, J.-G. Influences of Deposition Strategies on Thermo-mechanical Characteristics of a Multilayer Part Deposited by a Wire Feeding Type DED process. J. Mech. Sci. Technol. 2019, 33, 5615–5622. [Google Scholar] [CrossRef]
- Ren, K.; Chew, Y.; Fuh, J.Y.H.; Zhang, Y.F.; Bi, G.J. Thermo-mechanical Analyses for Optimized Path Planning in Laser Aided Additive Manufacturing Processes. Mater. Des. 2019, 162, 80–93. [Google Scholar] [CrossRef]
- Lu, X.; Cervera, M.; Chiumenti, M.; Li, J.; Ji, X.; Zhang, G.; Lin, X. Modeling of the Effect of the Building Strategy on the Thermomechancial Response of Ti-6Al-4V Rectangular Parts Manufactured by Laser Directed Energy Deposition. Metals 2020, 10, 1643. [Google Scholar] [CrossRef]
- Li, W.; Soshi, M. Modeling Analysis of Grain Morphologies in Directed Energy Deposition (DED) Coating with Different Laser Scanning Patterns. Mater. Lett. 2019, 215, 8–12. [Google Scholar] [CrossRef]
- Saboori, A.; Piscopo, G.; Lai, M.; Salmi, A.; Biamino, S. An investigation on the Effect of Deposition Pattern on the MicroStructure, Mechanical Properties and Residual Stress of 316L Produced by Directed Energy Deposition. Mater. Sci. Eng. A 2020, 780, 139179. [Google Scholar] [CrossRef]
- Ribeiro, K.S.B.; Mariani, F.E.; Coelho, R.T. A Study of Different Deposition Strategies in Direct Energy Deposition (DED) Processes. Procedia Manuf. 2020, 48, 663–670. [Google Scholar] [CrossRef]
- Baek, G.Y.; Lee, K.Y.; Park, S.H.; Shim, D.S. Effects of Substrate Preheating during Direct Energy Deposition on Microstructure, Hardness, Tensile Strength, and Notch Toughness. Met. Mater. Int. 2017, 23, 1204–1215. [Google Scholar] [CrossRef]
- Corbin, D.J.; Nassar, A.R.; Reutzel, E.W.; Beese, A.M.; Michaleris, P. Effect of Substrate Thickness and Preheating on the Distortion of Laser Deposited Ti–6Al–4V. J. Manuf. Sci. Eng. 2018, 140, 061009. [Google Scholar] [CrossRef] [Green Version]
- Lu, X.; Lin, X.; Chiumenti, M.; Cervera, M.; Hu, Y.; Ji, X.; Ma, L.; Yang, H.; Huang, W. Residual Stress and Distortion of Rectangular and S-shaped Ti-6Al-4V Parts by Directed Energy Deposition: Modelling and Experimental Calibration. Addit. Manuf. 2019, 26, 166–179. [Google Scholar] [CrossRef]
- Soshi, M.; Odum, K.; Li, G. Investigation of Novel Trochoidal Toolpath Strategies for Productive and Efficient Directed Energy Deposition Processes. CIRP Ann. 2019, 58, 241–244. [Google Scholar] [CrossRef]
- Zhao, Y.; Wang, Z.; Zhao, J.; He, Z.; Zhang, H. Comparison of Substrate Preheating on Mechanical and Microstructural Properties of Hybrid Specimens Fabricated by Laser Metal Deposition 316L with Different Wrought Steel Substrate. Crystals 2020, 10, 891. [Google Scholar] [CrossRef]
- SYSWELD. 2020. Available online: https://myesi.esi-group.com/downloads/software-documentation/sysweld-2020.0-complete-analyses-french-online (accessed on 4 March 2021).
- Lee, K.K.; Lee, H.J.; Kim, H.S.; Ahn, D.G.; Son, Y. Investigation of Influence of Laser Parameters and Powder Porosity on Thermal Characteristics in the Powder Bed of a SLM Process. J. Korean Soc. Precis. Eng. 2019, 36, 761–769. [Google Scholar] [CrossRef]
- ESI Group. SYSWORLD 2016 Technical Description of Capability; ESI Group: Paris, France, 2016; pp. 27–49. [Google Scholar]
- Jinoop, A.N.; Paul, C.P.; Mishra, S.K.; Bindra, K.S. Laser Additive Manufacturing Using Directed Energy Deposition of Inconel-718 Wall Structures with Tailored Characteristics. Vacuum 2019, 166, 270–278. [Google Scholar] [CrossRef]
- JMatPro. Available online: https://www.sentesoftware.co.uk/jmatpro (accessed on 4 March 2021).
- VDM Metal. Available online: https://www.vdm-metals.com/en/products-and-services/alloys-and-semi-finished-products/nickel-and-nickel-alloys-from-vdm-metals/ (accessed on 4 March 2021).


| Initial Bead Width (mm) | Bead Thickness (tb, mm) | Hatching Distance (mm) | Height of Deposited Region (mm) | ||
|---|---|---|---|---|---|
| 1st Layer | 2nd–17th Layer | 2 Layers | 17 Layers | ||
| 0.78 | 0.135 | 0.25 | 0.50 | 0.385 | 4.135 |
| Radius of Laser Beam (re, mm) | Power of Laser (PL, mm) | Scan Speed of Laser (V, mm/min) | Feed Rate of Powders (F, g/min) | Flow Rate of Shield Gas (L/min) | Penetration Depth (δ, mm) | Radius at z Coordinate (r(z)) | Preheating Temperature (Tp, °C) |
|---|---|---|---|---|---|---|---|
| 0.5 | 350 | 1000 | ≈10.3 | ≈7.0 | =tb | ≈re | 100–200 |
| Ni | Cr | Fe | Mo | Si | Mn | C | Co | Cu | Others |
|---|---|---|---|---|---|---|---|---|---|
| 55 | 21 | Balance | 3.3 | 0.35 | 0.35 | 0.08 | 1.0 | 0.3 | <5.0 |
| Fe | Ni | Cr | Si | Mn | C | Cu | Others |
|---|---|---|---|---|---|---|---|
| Balance | 0.005 | 0.015 | 0.247 | 0.757 | 0.444 | 0.01 | <0.1 |
Publisher’s Note: MDPI stays neutral with regard to jurisdictional claims in published maps and institutional affiliations. |
© 2021 by the authors. Licensee MDPI, Basel, Switzerland. This article is an open access article distributed under the terms and conditions of the Creative Commons Attribution (CC BY) license (https://creativecommons.org/licenses/by/4.0/).
Share and Cite
Kim, H.; Lee, K.-K.; Ahn, D.-G.; Lee, H. Effects of Deposition Strategy and Preheating Temperature on Thermo-Mechanical Characteristics of Inconel 718 Super-Alloy Deposited on AISI 1045 Substrate Using a DED Process. Materials 2021, 14, 1794. https://0-doi-org.brum.beds.ac.uk/10.3390/ma14071794
Kim H, Lee K-K, Ahn D-G, Lee H. Effects of Deposition Strategy and Preheating Temperature on Thermo-Mechanical Characteristics of Inconel 718 Super-Alloy Deposited on AISI 1045 Substrate Using a DED Process. Materials. 2021; 14(7):1794. https://0-doi-org.brum.beds.ac.uk/10.3390/ma14071794
Chicago/Turabian StyleKim, Ho, Kwang-Kyu Lee, Dong-Gyu Ahn, and Hyub Lee. 2021. "Effects of Deposition Strategy and Preheating Temperature on Thermo-Mechanical Characteristics of Inconel 718 Super-Alloy Deposited on AISI 1045 Substrate Using a DED Process" Materials 14, no. 7: 1794. https://0-doi-org.brum.beds.ac.uk/10.3390/ma14071794