1. Introduction
Noncontact metrology plays an important role in many industrial processes, not only in the field of part inspection but also in the application of reverse engineering, particularly in areas such as the automotive or aerospace. Among the four types of methods that have been developed in the noncontact metrology (optical, ultrasonic, pneumatic, and electrical), the first two have continuously evolved in accuracy and resolution (mainly profilometers and laser triangulation sensors) and are nowadays extremely popular, either in automated inter-process inspection [
1], or in-process [
2].
In this sense, it is essential to find solutions that minimise the impact on the industry of the introduction of noncontact verification methods with the aim of providing traceability of the corresponding measurement results [
3], regardless of the field of the application being manual, semiautomated, or completely automated, as occurs with laser sensors mounted on CMMs [
4]. Particularly, the setup and calibration of optical sensors [
5] are critical to ensure the traceability of measurement results, and therefore, the availability of reference artefacts that can be used effectively in those phases is essential.
Focusing on the metrological aspects of a laser scanner sensor, several factors affect the accuracy of the measurements: the intrinsic characteristics of the sensor [
6], the laser beam orientation, the scanning path [
7], and the physical and geometric properties of the part [
8,
9,
10]. Specifically, it is also known that laser scanner measurements are highly affected by the optical properties of the part surfaces [
11,
12] or even by the ambient lighting [
13].
Previous research works have revealed that one of the main weaknesses of these sensors is the impossibility of measuring parts with very bright surfaces with high accuracy. The reflectivity of the surface is the source of important randomness in results since it prevents the optical sensor from capturing a sufficient number of points and, furthermore, generates false or spurious points (not belonging to the surface) in the captured point clouds.
Other works [
14,
15] make it clear that the addition of antireflective coatings with (removable) powders or (fixed) paints is not a sufficiently accurate solution for reference elements, although these investigations on “anti reflective” coatings suggest a beneficial impact on accuracy. Therefore, the solution proposed in this article is to directly modify the surface condition of the reference element without adding any coating.
Therefore, objects used as reference artefacts for the setup and calibration should possess suitable optical properties while maintaining enough dimensional and geometrical accuracy. Within the wide range of calibration artefact geometries, spheres stand out as they allow for implementing several metrological entities, such as diameters, form deviations, and length dimensions by means of the distance between the centres of two of them. This is the main reason that reference spheres are commonly used in interim checking and performance procedures, which are applied for qualifying probes in a multitude of coordinate measuring machines, as well as being used in the calibration of conventional metrology instruments. In fact, spheres are used in many calibration procedures, even establishing the best capturing parameters and determining the conditions for maximum accuracy in measurements performed by machines where laser sensors are mounted [
16].
The current spheres used in metrological applications as reference elements are basically spheres of ceramic materials, such as alumina, ruby or zirconia, among others, as well as mixtures between them (e.g., zirconia and alumina). These spheres are manufactured by sintering from powder, machining of preforms and subsequent polishing. This process achieves precision grades G3, G5 and G10 (according to ISO 3290/DIN 5401 [
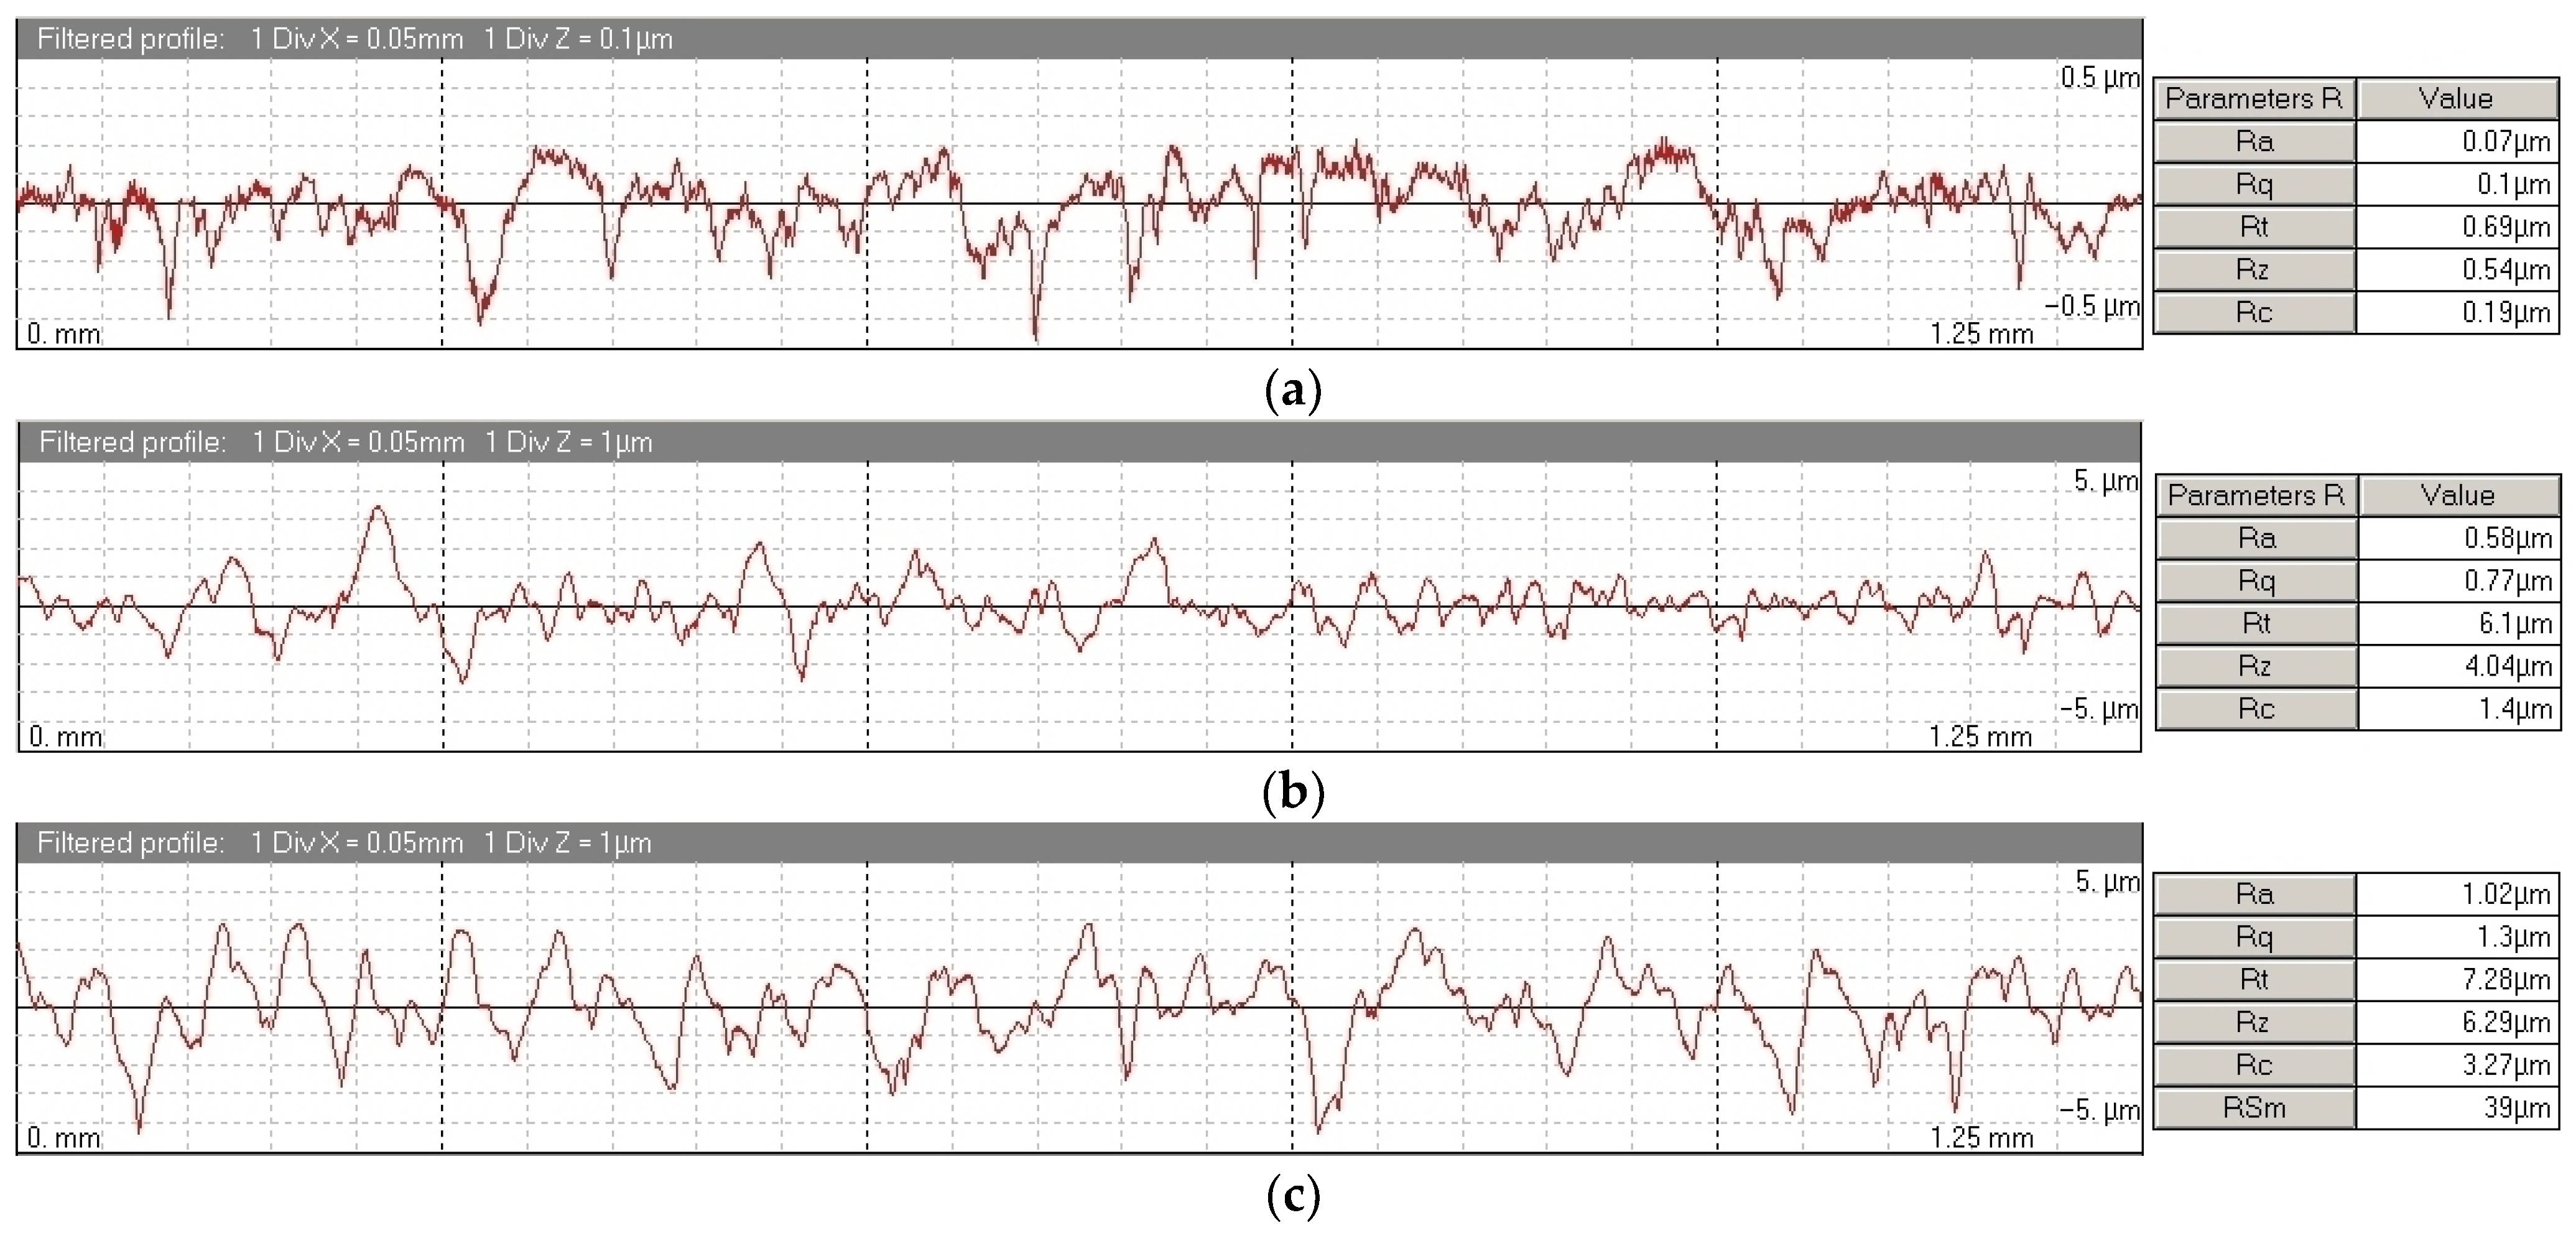
17]), which means achieving a sphericity < 0.25 µm, and
Ra < 0.020 µm. This high precision means a very shiny and specular surface. However, this finish is not suitable for optical metrology equipment, due to the high reflectivity that makes it impossible to capture enough points and even more so of high quality.
In this experimentation, a low-cost precision stainless steel balls has been chosen due to they are standard balls in the bearing industry. By default, these balls also have good qualities (G50 or G100, according to ISO 3290/DIN 5401) with sphericity < 2.5 µm and Ra < 0.1 µm. However, they still have shiny and reflective surfaces, which are not suitable for optical equipment. The surface finish of these spheres is intended to modify in this work, checking that this modification does not affect the quality and precision (dimensional and geometrical) significantly, which would prevent it from being a metrological reference element. The aim of this work is to check whether the chemical attack process using an acid bath modifies the surface, eliminating the shine without losing the grade of quality. Furthermore, the aim is also to quantify the possible improvement in the quality of the point cloud before the acid bath (original state, with gloss) and after the chemical treatment (without gloss).
In previous experimentation [
18], it was proved that sandblasted spheres can be employed as reference artefacts for calibrating noncontact sensors, as their form deviation was in the order of 0.004–0.005 mm. Sandblasting generates minimal changes both in the diameter and in the form deviation. On the other hand, the sandblasted texture allows for improving the point cloud capturing, thus providing a better surface coverage which results in a more accurate reconstruction of the sphere.
Precisely, this work is intended to analyse and compare the influence of two different surface treatments, the sandblasting (mechanical) and etching, by immersion in acid (chemical), onto the surface of low-cost precision spheres made of stainless steel. The first objective is to prove that the etching treatment is able to reduce the reflectivity of the sphere surface without significantly altering the geometrical characteristics of the sphere in order to use it in the setup and calibration procedures of optical sensors and other noncontact metrological and reverse engineering equipment. It must be noted that both finishing processes studied here will change the form error and also the dimensions of the original ones. However, the key for a sphere to become “standard” is overall a low form error and low standard deviation to the best fitting sphere. The diameter value is not as relevant for their use as a reference element since, once calibrated, this size value will be known with high accuracy.
To achieve this goal, the experimentation performed in this work encompasses a series of tasks, from the manufacturing of the spheres to the evaluation of such spheres after etching treatment. The equipment that has been used to validate the experimentation is a laser triangulation sensor mounted on the ram of a coordinate measuring machine (CMM). However, higher accurate measurement was also needed to obtain the reference values for the subsequent comparison between the two surface treatments, so a contact probe mounted on the same CMM was also employed. Then, for each sphere and each state (pre and post treatment), two measurements were performed, first by contact probing and second by laser scanning.
Therefore, our study is intended to determine the level of influence of the chemical treatment applied to the spheres for obtaining a less reflective surface, more suitable for capturing point clouds by laser scanning. The collected data will allow for establishing the feasibility and degree of suitability of the treatment.
On the other hand, a second objective is to compare the data resulting from both surface treatments (mechanical and chemical) in order to establish the best conditions of the parameters to analyse. The parameters that have been studied in this work are the number of points in the capture point cloud, the sphere diameter, the sphere form deviation, and the standard deviation of the point cloud regarding the best fit reconstructed sphere. Finally, this research is also aimed at quantifying the improvement in the quality of the point clouds captured by laser scanning after reducing the reflectivity of the surface.
It is important to highlight that the experimentation involved replicating the procedure carried out for the sets of spheres that had been treated mechanically by sandblasting [
18], that is, repeating the same steps but applied to a new set of spheres subjected to chemical treatment. The results collected have been used for the comparative analysis of both finishing processes.
2. Materials and Methods
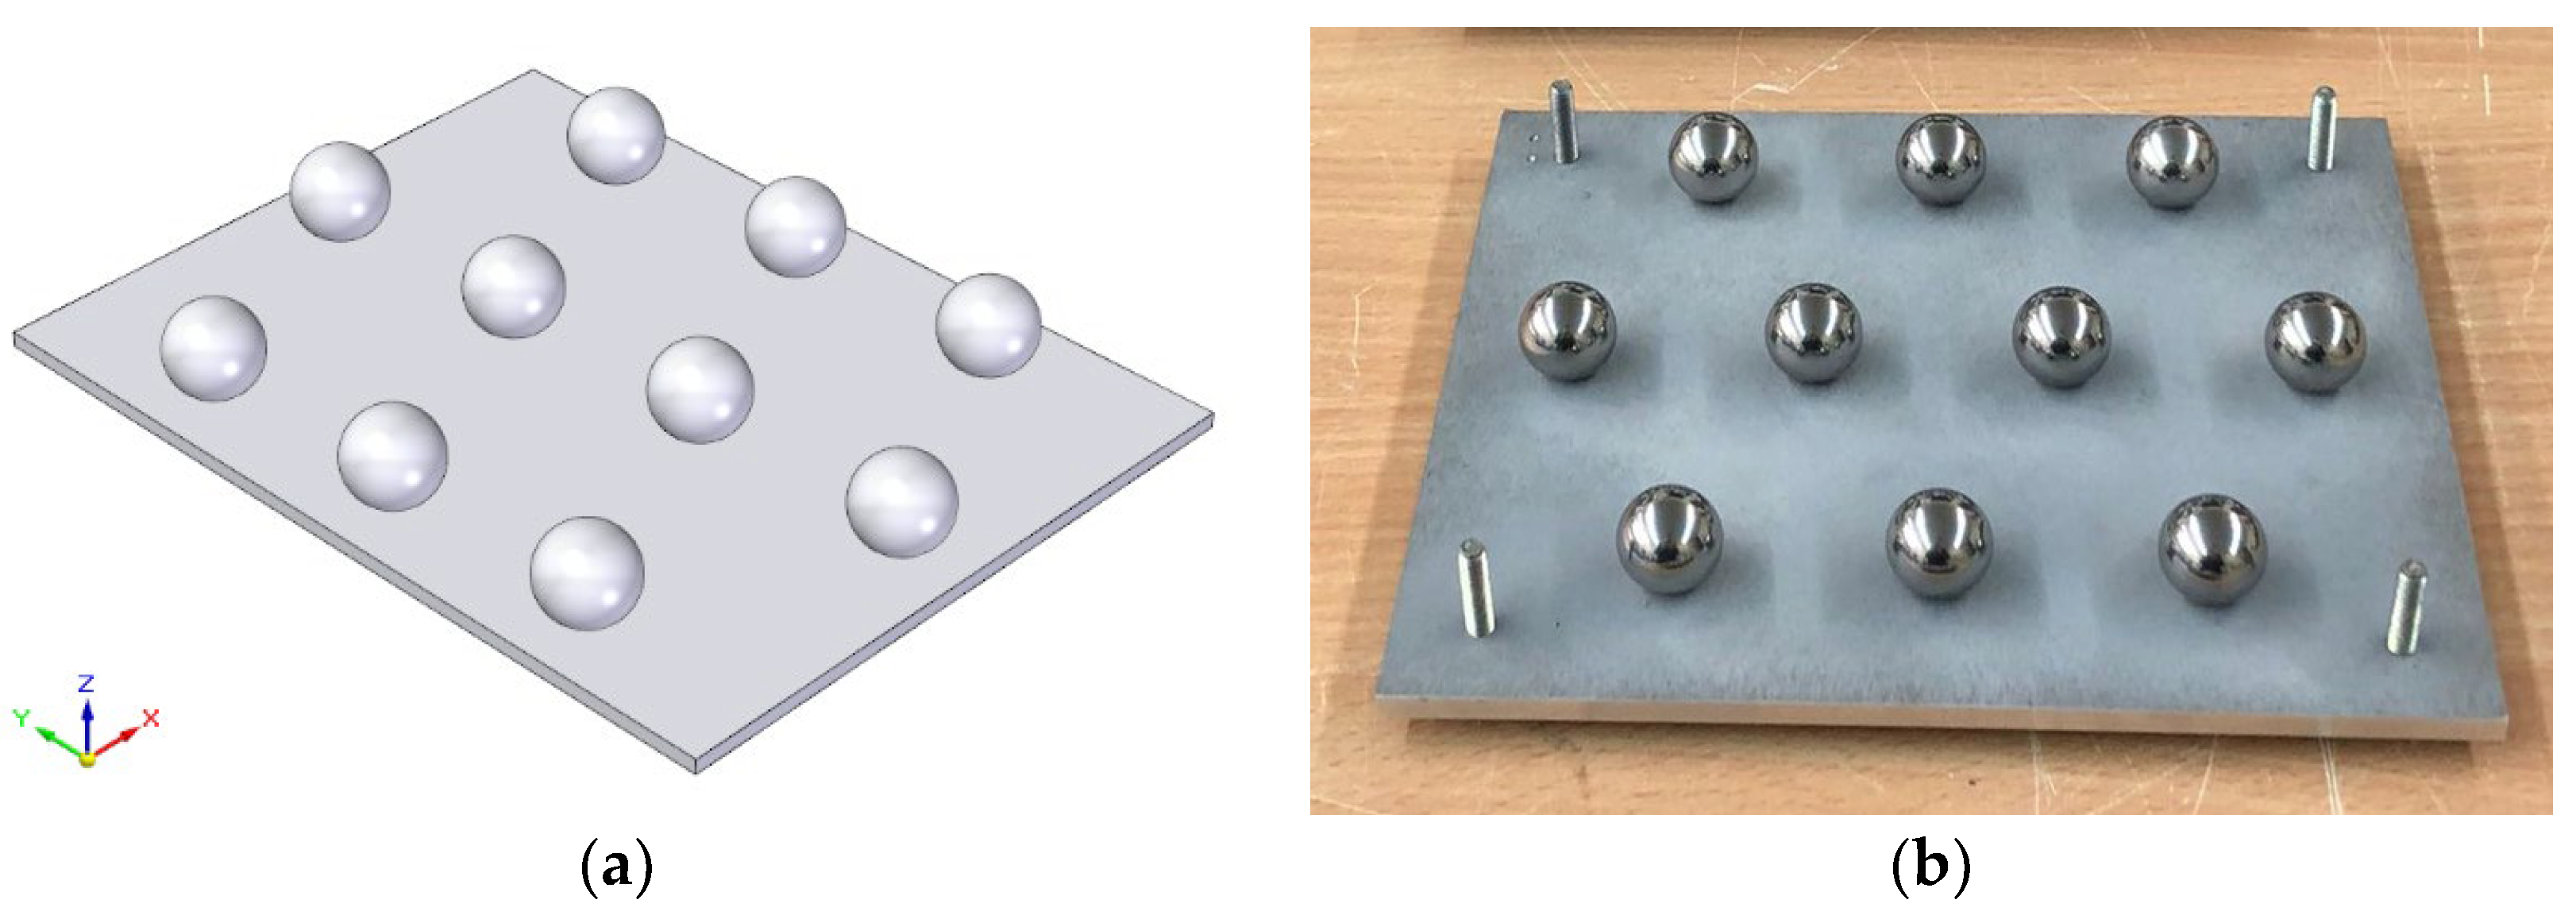
Three plates have been designed and manufactured to serve as supports for a sufficient number of identical spheres (10 units per plate) to statistically evaluate the influence of the surface treatments (
Figure 1a). Based on the designs of the standard samples and after defining the criteria to fulfil in the measurements, both in contact and in noncontact types, all the parameters, elements, and procedures are established and registered.
Each plate platform was manufactured in stainless steel AISI 316L and previously sandblasted to avoid reflections. This platform supports 10 spheres of identical size, identical material, AISI 316L with quality grade G100, sphericity below 2.5 µm, and arithmetic mean roughness Ra < 0.1 µm. The system chosen to join the spheres to the plates was the threaded joints. In each precision sphere, a hole was drilled and then tapped. Special care was taken in the design of the fixture (a vise with hemispherical jaws) for clamping the spheres in order to prevent marking or deforming the sphere surface. The precision spheres were drilled using two hemispherical jaws manufactured ad hoc for each diameter in such a way that no permanent marking or deformation occurred. Subsequently, each sphere hole was threaded, which allowed the 10 spheres to be mounted (screwed) on each plate. All the spheres used in the experimentation are precision made of AISI 316 stainless steel, grade G100, with a sphericity of less than 2.5 µm and a roughness Ra < 0.1 µm.
In total, considering the mechanical and chemical treatments, the experimentation has been carried out on over 60 spheres of different sizes (20 units of Ø10 mm size, 20 units of Ø20 mm, and 20 units of Ø25 mm). Each sphere has been measured 10 times by contact probing and 10 times by laser scanning before and after the respective surface treatment, which accounts for 40 measurement routines. Therefore, a collection of 2400 sets of measurement results, clustered in three groups of 800 measurements per sphere size, has been collected for the statistical analysis of the defined parameters.
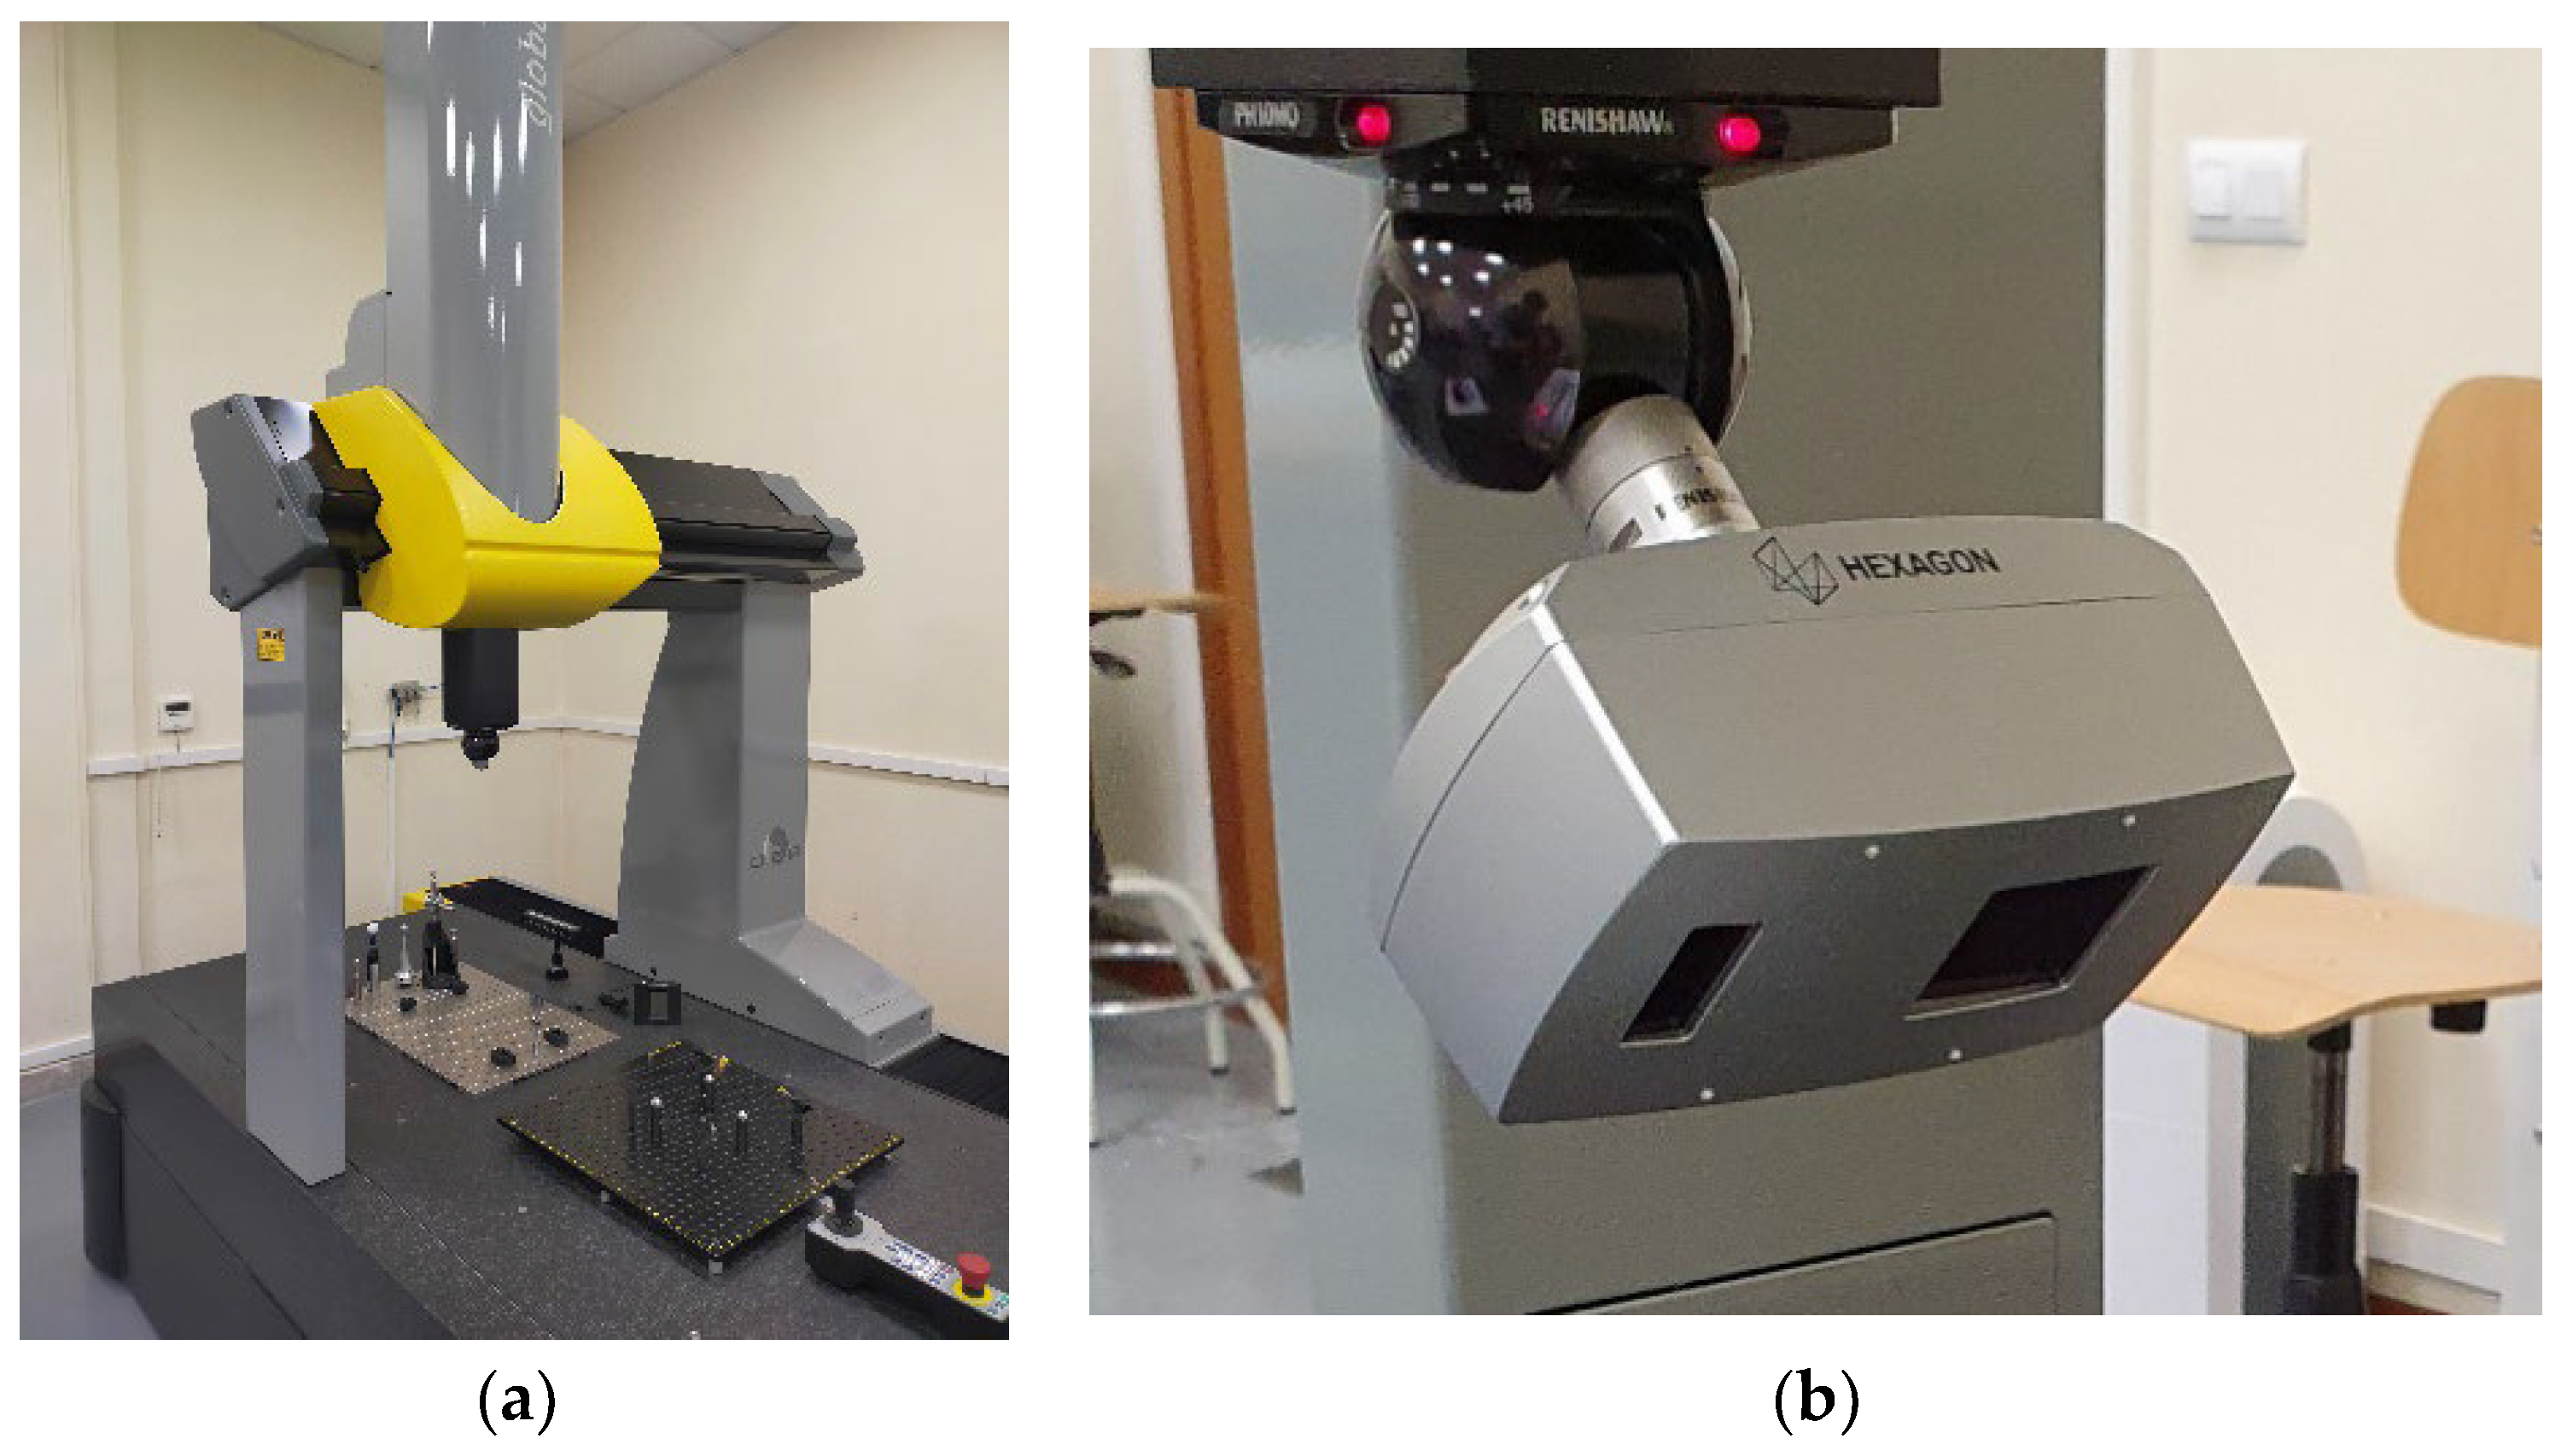
The contact probing measurement was performed in a CMM model DEA Global Image 091508 (
Figure 2a) with a Maximum Permissible Error in Length Indication MPE
L = 2.2 + 3·L/1000 (µm, L in mm) and a Maximum Permissible Error in Repeatability MPE
E = 2.2 µm calibrated according to ISO 10360-2. This CMM mounts a Renishaw SP25 sensor on an indexable head Renishaw PH10MQ. The probe tip selected was a 1.5 mm diameter ball of synthetic ruby. The choice of this tip, conditioned by the stem size and the ball diameter, is considered suitable for measuring the three sizes of spheres without probe changes, thus ensuring a greater uniformity in the results of different batches and trying to minimise the possible influence of external factors in the measurements.
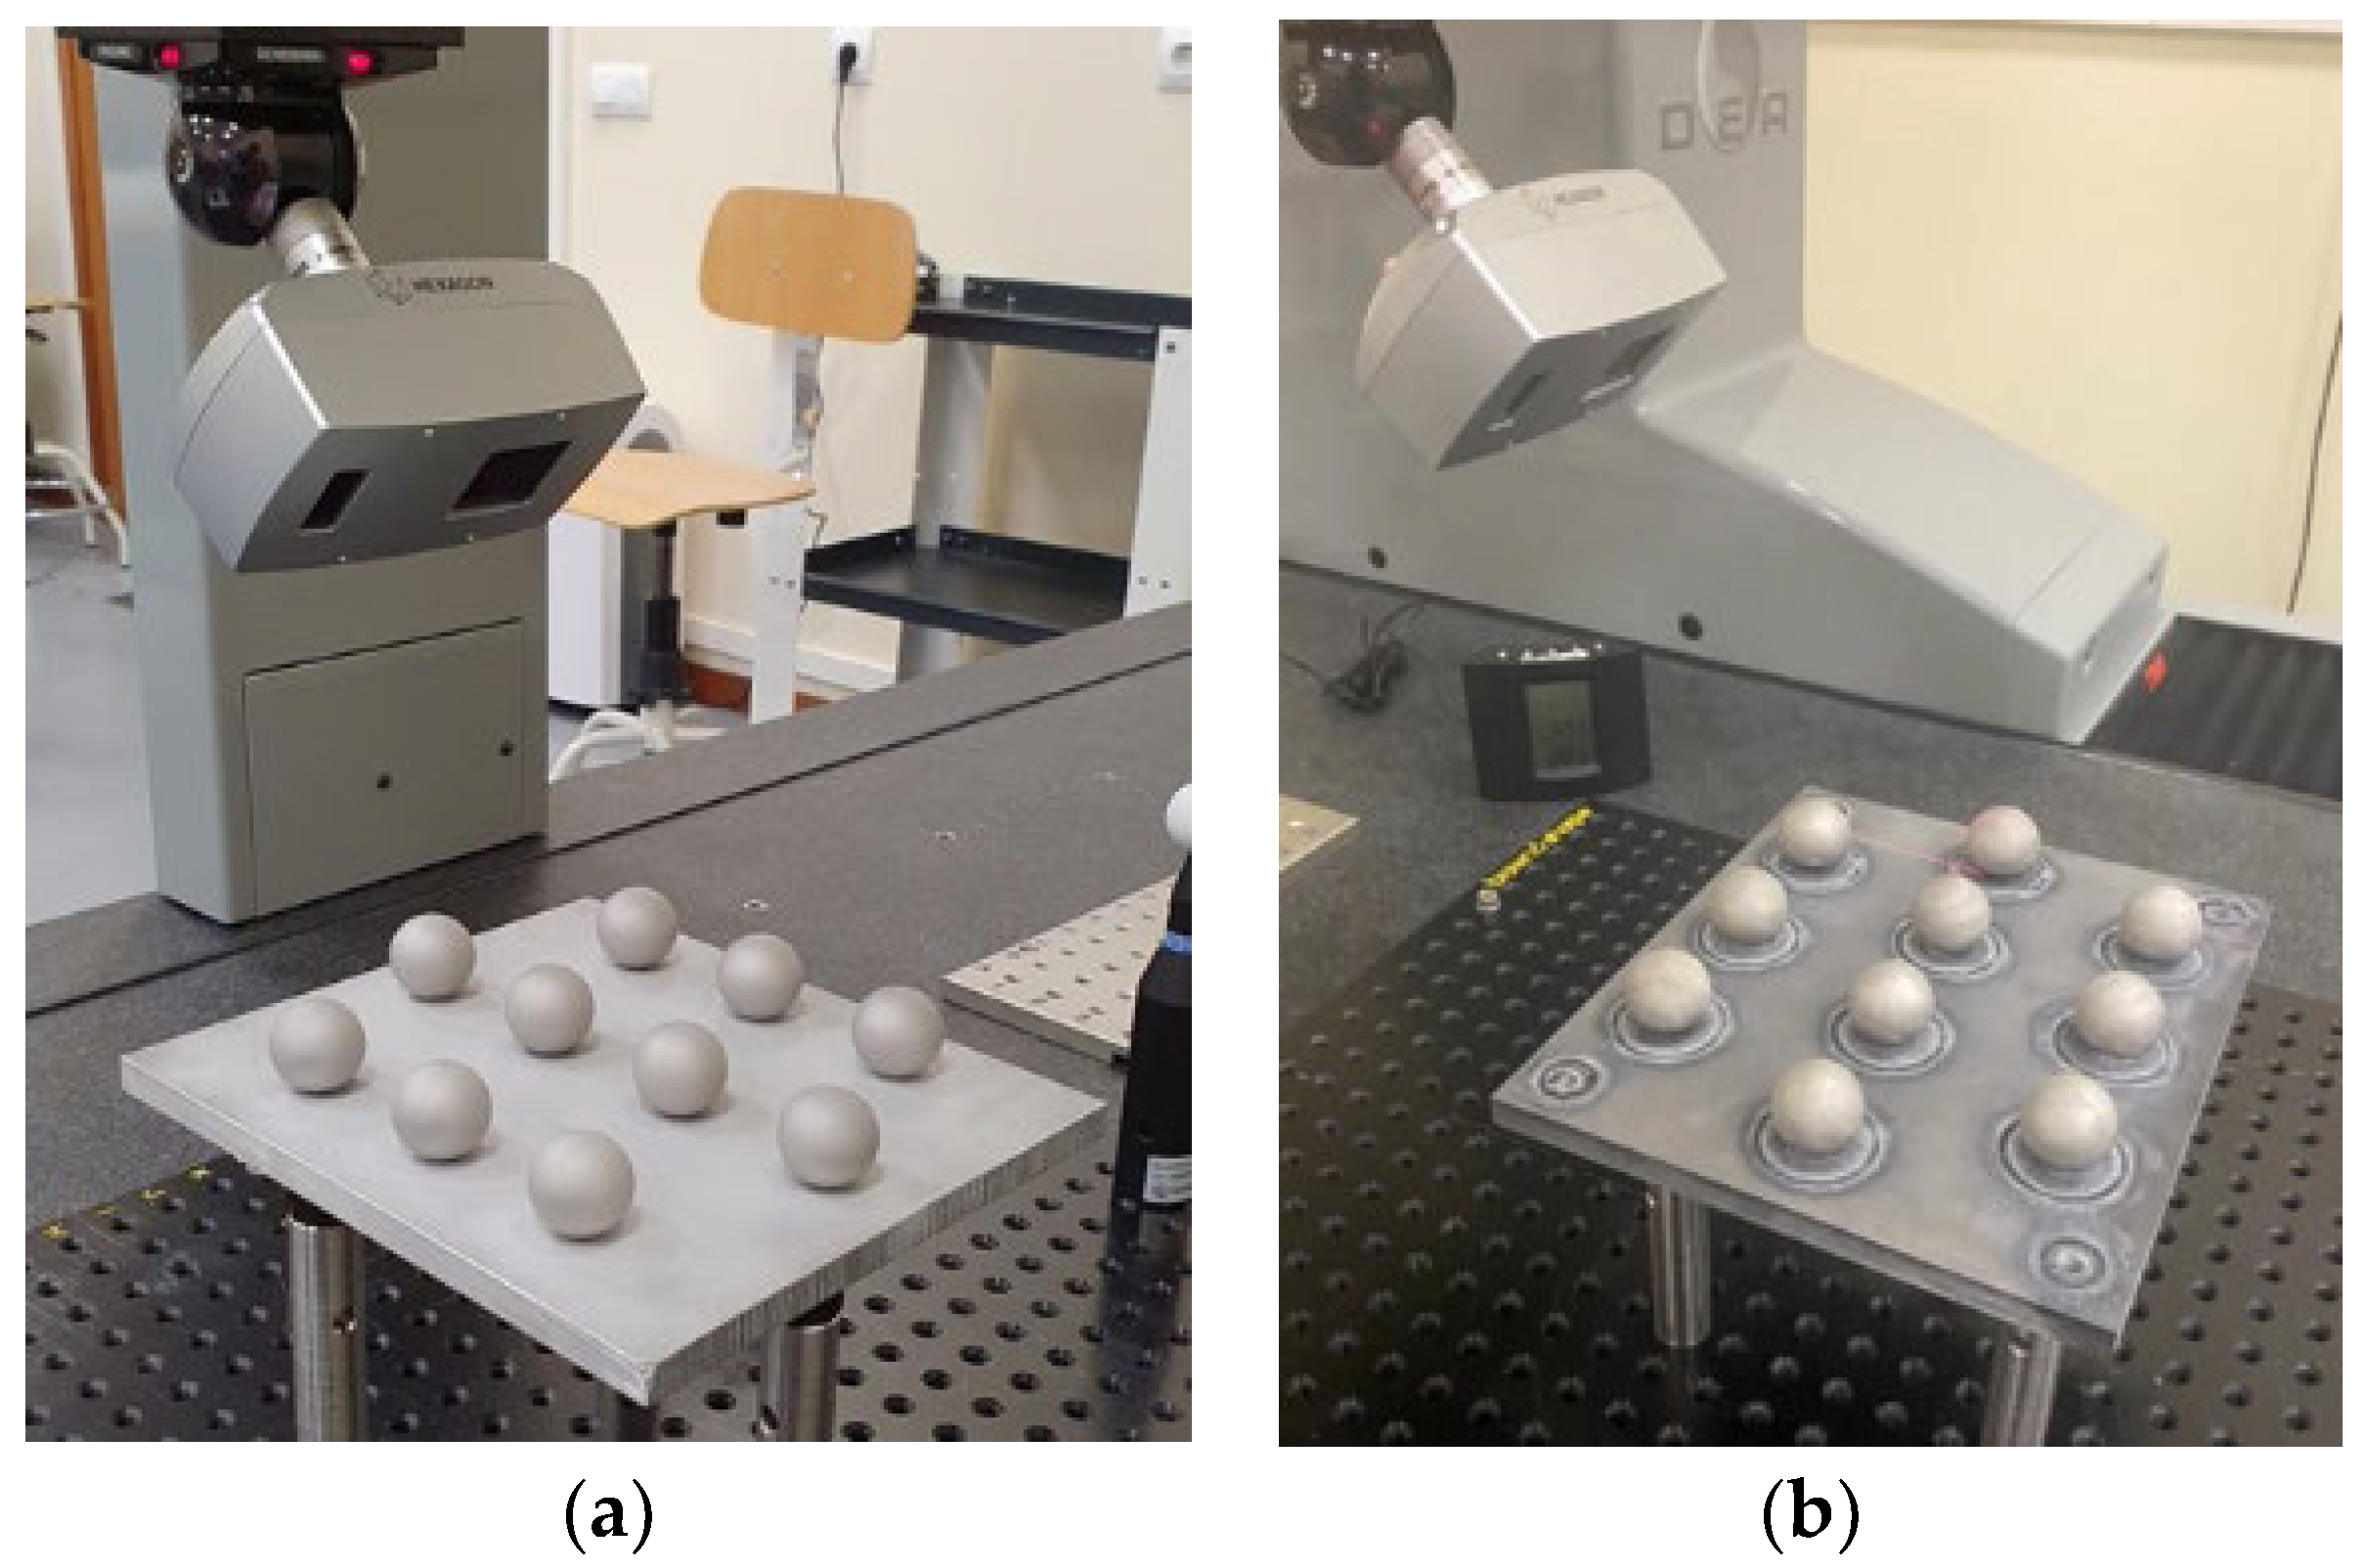
On the other hand, the equipment used for noncontact measurement was a laser triangulation sensor HP-L-10.6 from Hexagon Metrology (
Figure 2b) also mounted on the same CMM. It is a sensor with a FOV (Field Of View) of 170 ± 30 mm, with three magnification options, which leads to three line widths (24/60/124 mm) and two options for the distance between points at each magnification setting, according to the frequency or line rate, being 53 Hz the maximum value. The control software used for programming and executing the measurement routines was PC-DMIS 2018 R2 for both contact and laser sensors. Measurements took place in the same laboratory at a controlled temperature of 20 ± 5 °C as indicated in the ISO 1:2002 [
19].
The experimentation was developed in five phases corresponding to the following activities:
Manufacturing and the assembly of the plates with spheres. Three plates, with sets of 10 spheres of equal size per plate (Ø10 mm, Ø18 mm, and Ø25 mm), were manufactured. The arrangement of the spheres, as well as the identical assembly on each plate, make the handle easier and favours the univocal identification of each sphere at its location (
Figure 1b);
Contact and noncontact measurements of the original spheres. Firstly, all the spheres on the plates were measured by contact probing at the CMM in order to obtain reference values, both dimensional and geometrical, with great accuracy. Additionally, the spheres were digitised by laser scanning using the aforementioned sensor;
Surface treatment of the artefacts. Similar to the previous experimentation [
18], where 3 sets of spheres (10 spheres of size Ø10 mm, 10 of Ø18 mm, and 10 of Ø25 mm) had been subjected to a sandblasting operation with aluminium oxide particles, now new sets of spheres (10/10/10) are chemically etched by immersion in a bath consisting of hydrochloric acid (HCl) at 35% and nitric acid (HNO
3) at 65% (molar ratio 3:1) for 8 min. The surface finishing of the spheres is modified, thus obtaining sets with less brightness and different texture;
Contact and noncontact measurements of all treated sets. Both the sandblasted sets and the etched ones were measured again after the corresponding treatment by contact probing in the CMM first and second, by digitising with a laser triangulation sensor;
Analysis of results. Finally, the measurement results obtained before and after treating the sets of spheres by sanding and chemical etching were compared. In this comparison, the values of the measured dimensions and deviations regarding geometrical tolerances were first obtained by contact measurement and subsequently by analysis of the point clouds acquired by noncontact measurement.
The first device employed for measuring the sets of spheres was the CMM equipped with a contact probe. The objective of this contact measurement was to determine the reference values of those dimensions and geometric tolerance deviations selected for the comparative analysis. The minimum density for the contact probing was set to 0.2 points/mm
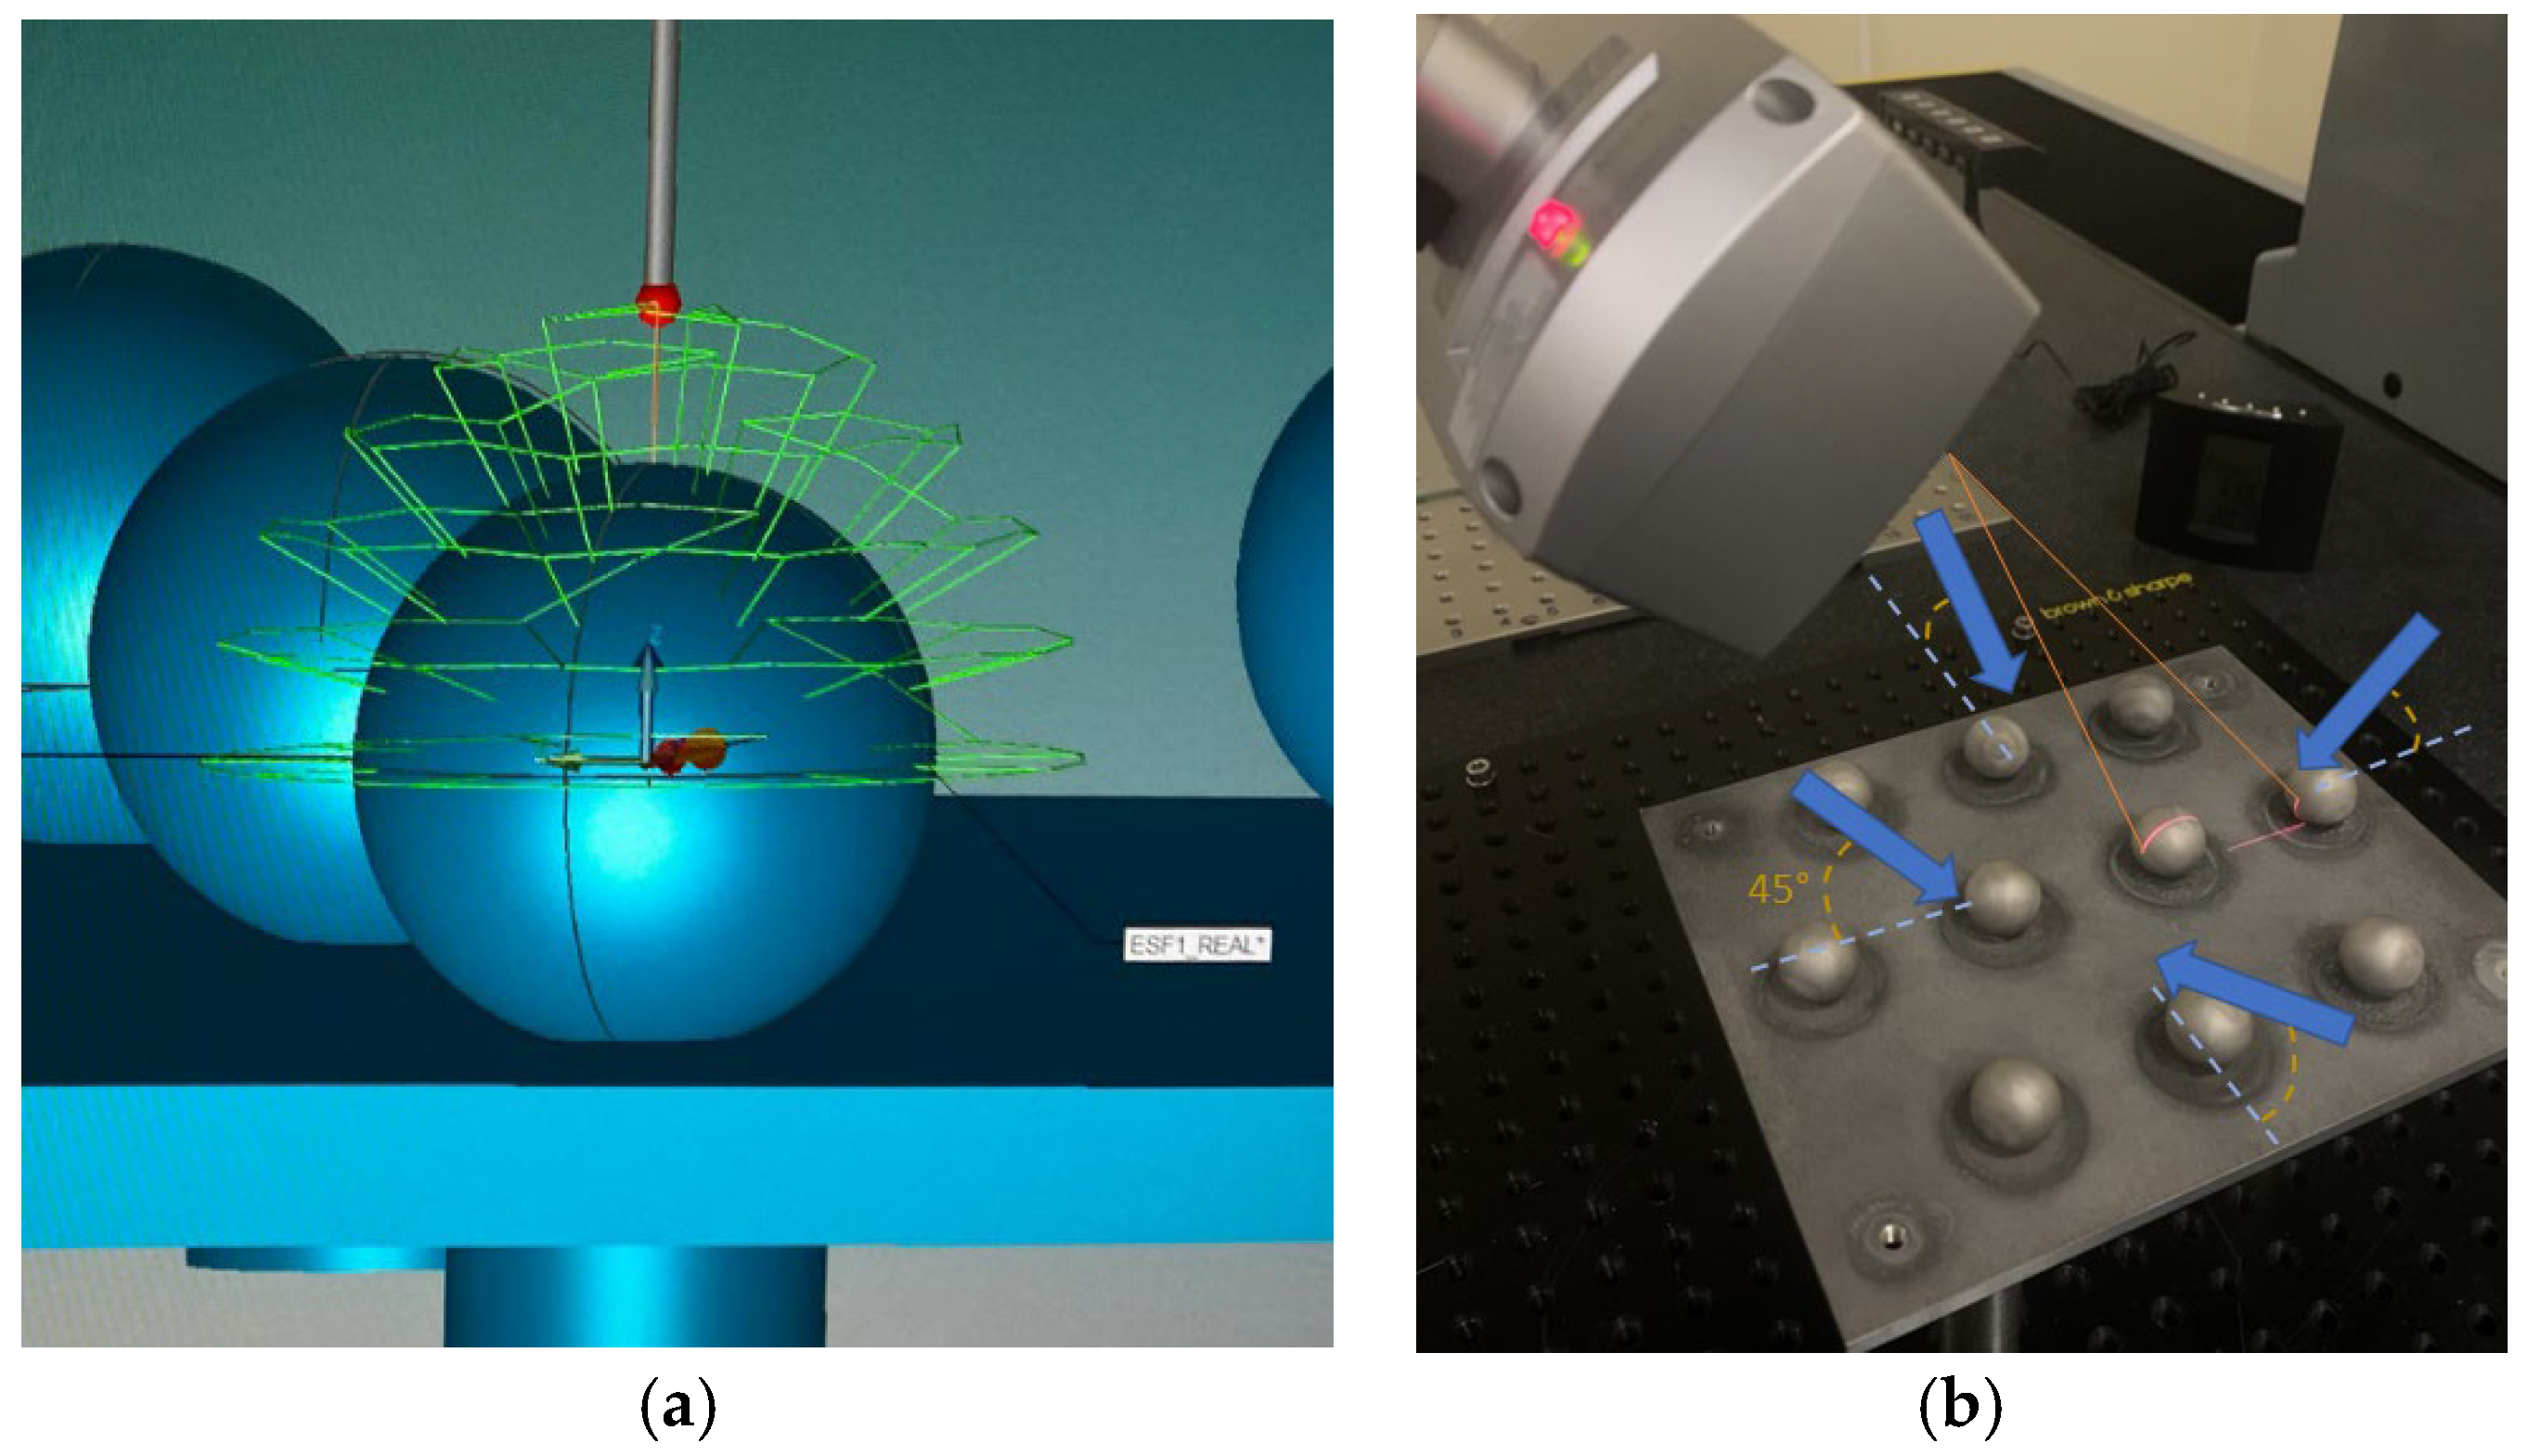
2 so that 40 points were probed on each of the Ø10 mm spheres, 100 points on the Ø18 mm spheres, and 200 points on the Ø25 mm spheres, measuring only the upper hemispheres. These sets of points were distributed differently on the surface of the spheres according to the sphere size, leading to 5, 7, and 10 rows (meridians) for the location of the probing points. On the other hand, the noncontact measurement was carried out by a laser sensor mounted on the ram of the CMM. This sensor can adjust the light intensity point to point (10 times/point), thus providing an excellent optical range. The point density was set to 16.8 points/mm with a line width of 123 mm to acquire the best quality and reliable point clouds. The sensor was located in five different orientations (
Figure 3) to cover a high portion of the spherical surface, even acquiring points below the horizontal equator of the sphere: A0B0, A45B0, A45B180, A45B90, and A45B-90 according to the terminology of the Renishaw
® PH10MQ motorised probe head.
Although the programming time for the automatic scanning in PC-DMIS® was about 2 h, the program execution time was less than 2 min for each plate, including all scanning orientations.
Before obtaining the measurement data from the point clouds scanned with the laser triangulation sensor, a previous study was carried out aimed at determining the best type of filter for “cleaning” the point clouds. From previous research works [
20], it is known that the best filter for subsequent reconstruction of an entity from the filtered point cloud is the Sigma or Standard Deviation (σ) filter. This filter discards or removes points located at a distance (from the reconstructed entity) larger than
x times the standard deviation of the point cloud (usually
x is 2 or 3, leading to 2σ or 3σ filters).
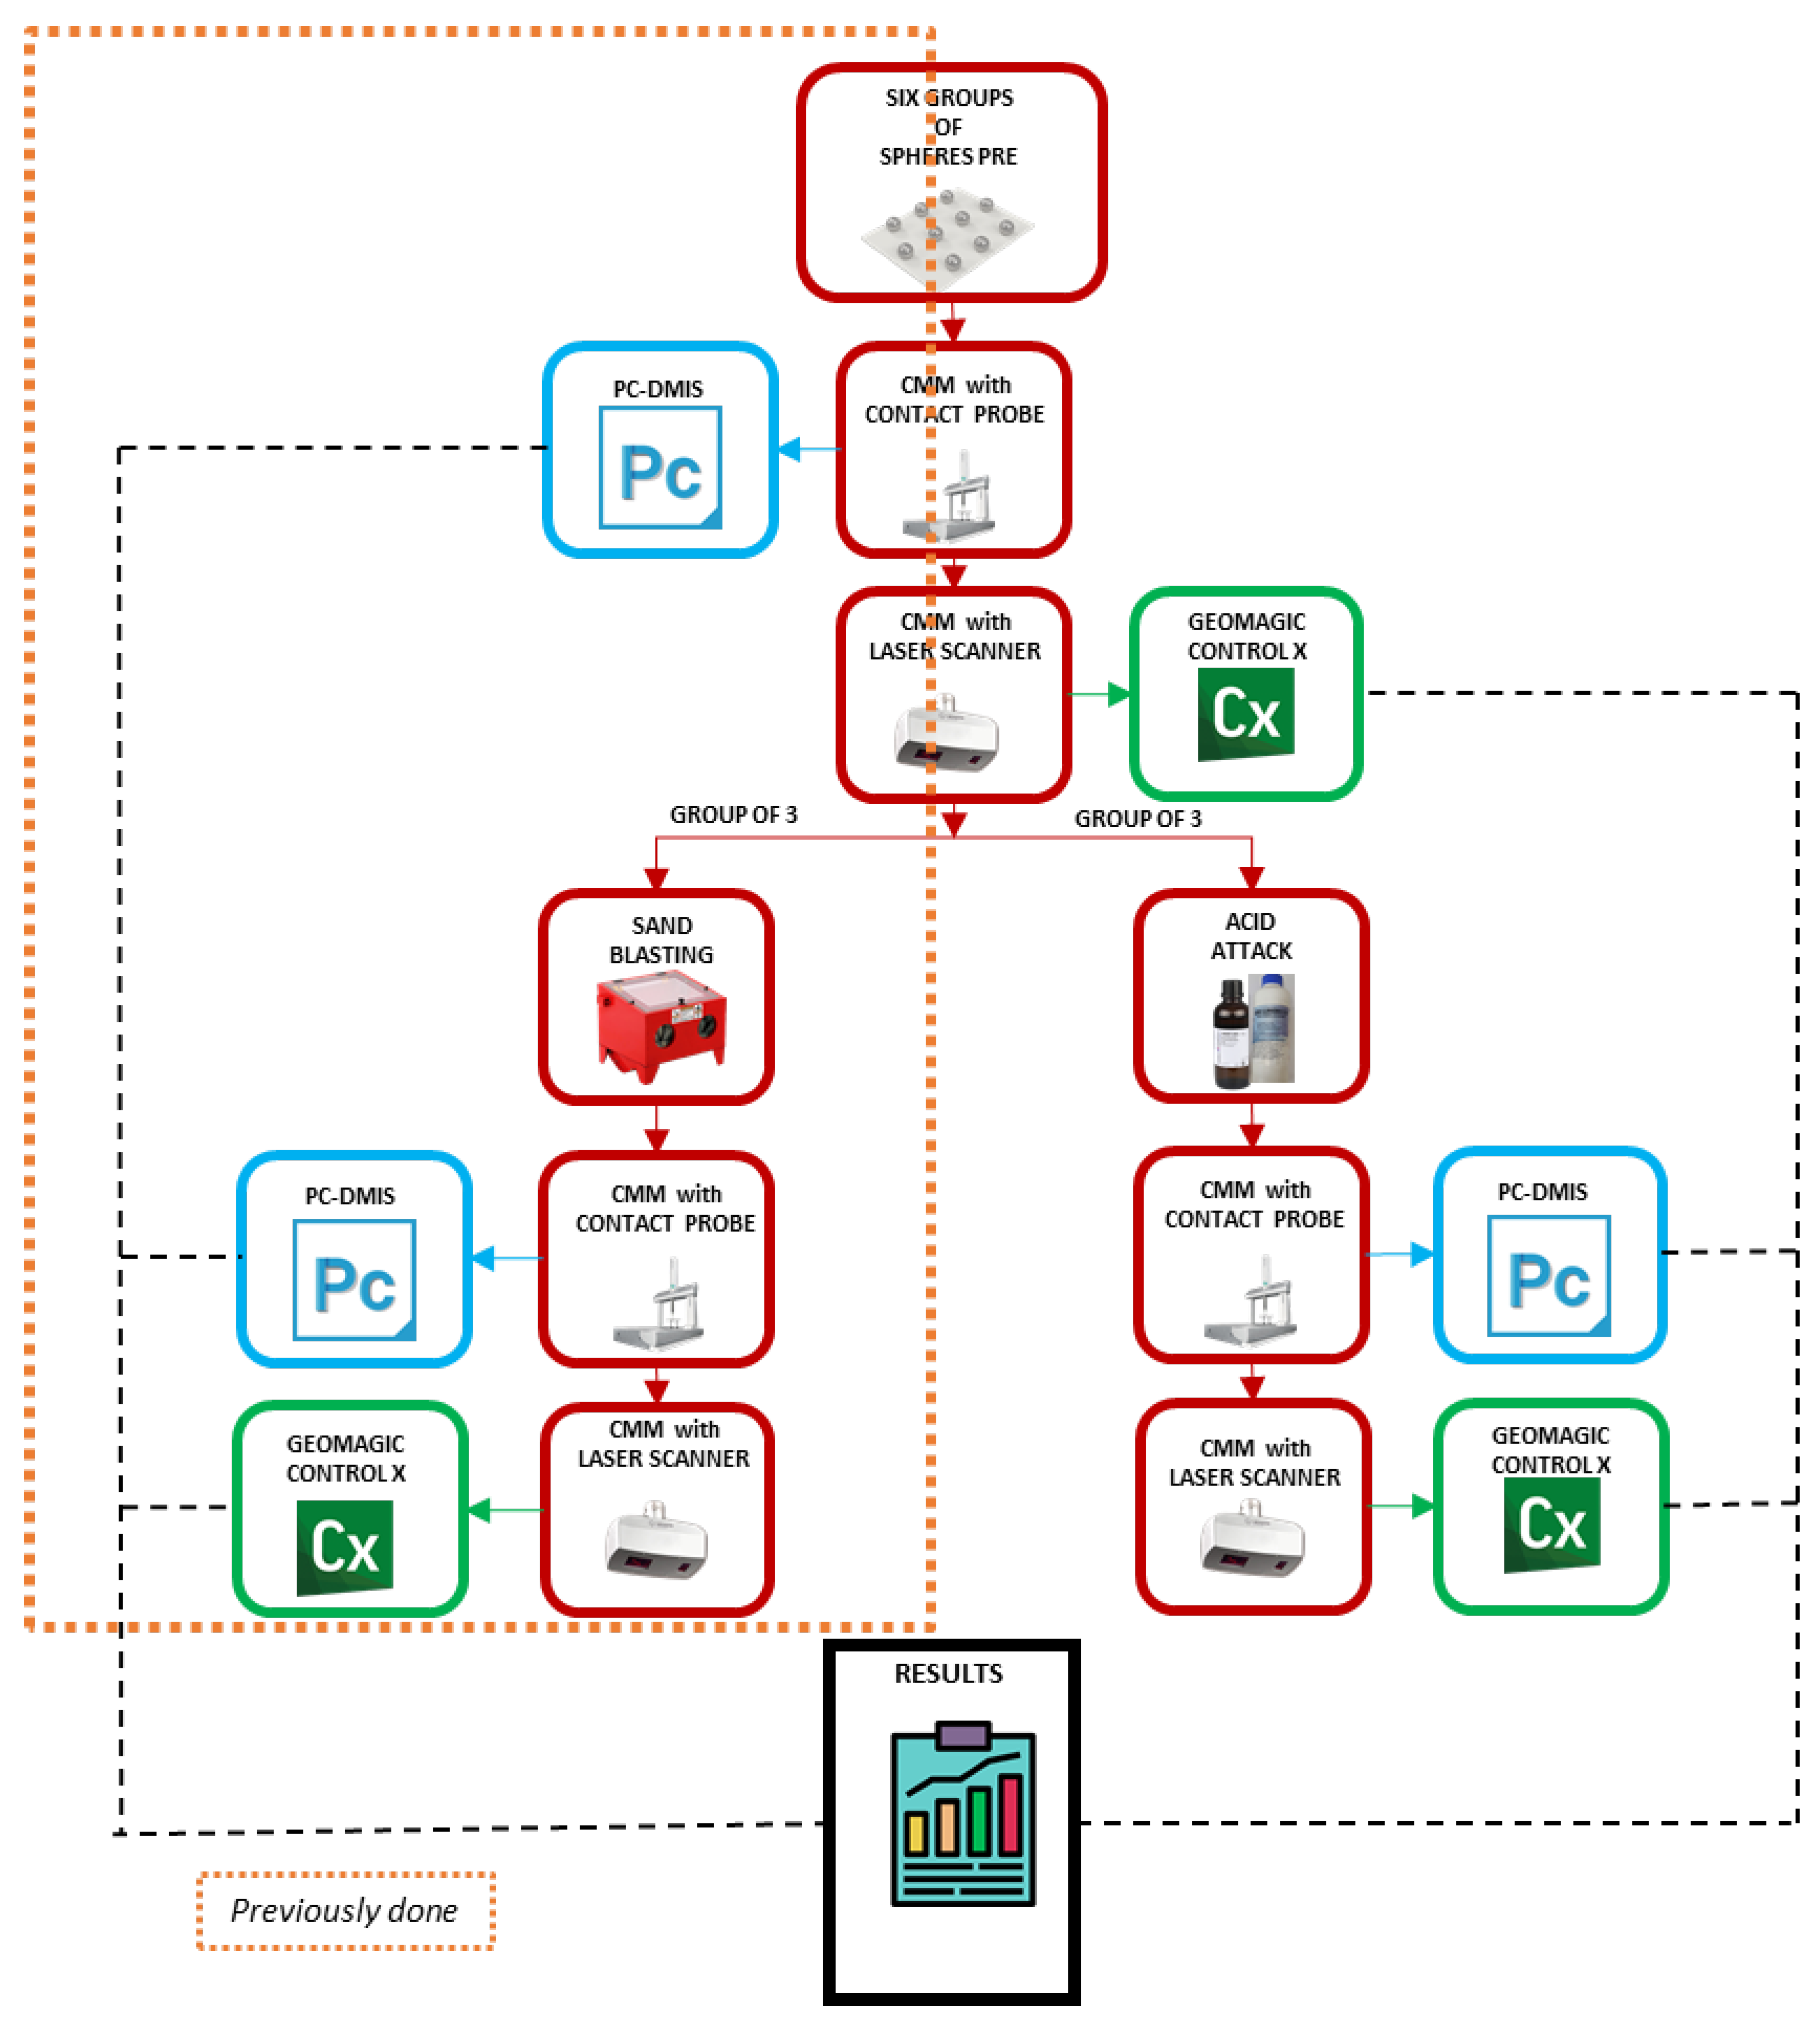
The study for the best type of filter and its value was performed with the aid of the Geomagic® Control X 2020 (3D Systems, Rock Hill, SC, USA) software. The methodology followed in this study involved:
Reconstruction of the entity (“best fit” sphere) without applying any filter;
Determination of the standard deviation of the point cloud with regard to the “best fit” sphere;
Calculation of the value of the filter by multiplying the standard deviation and the selected factor (2, 3, …) for analysis;
Reconstruction of the entity (“best fit” sphere) after applying the filter with the value calculated in the previous step.
This methodology was applied because the value of the standard deviation filter defined by default in the software was not able to provide the expected results, as it was demonstrated in previous research [
20]. For a better understanding of the proposed methodology, it is summarised in
Figure 4.
For both contact and noncontact measurements, different fixturing systems were arranged for clamping the sets of plates and spheres, selecting for each case the optimal solution that maximises the accessibility of the probe (
Figure 5a) or the visibility of the laser triangulation sensor (
Figure 5b) when measuring the spherical components.
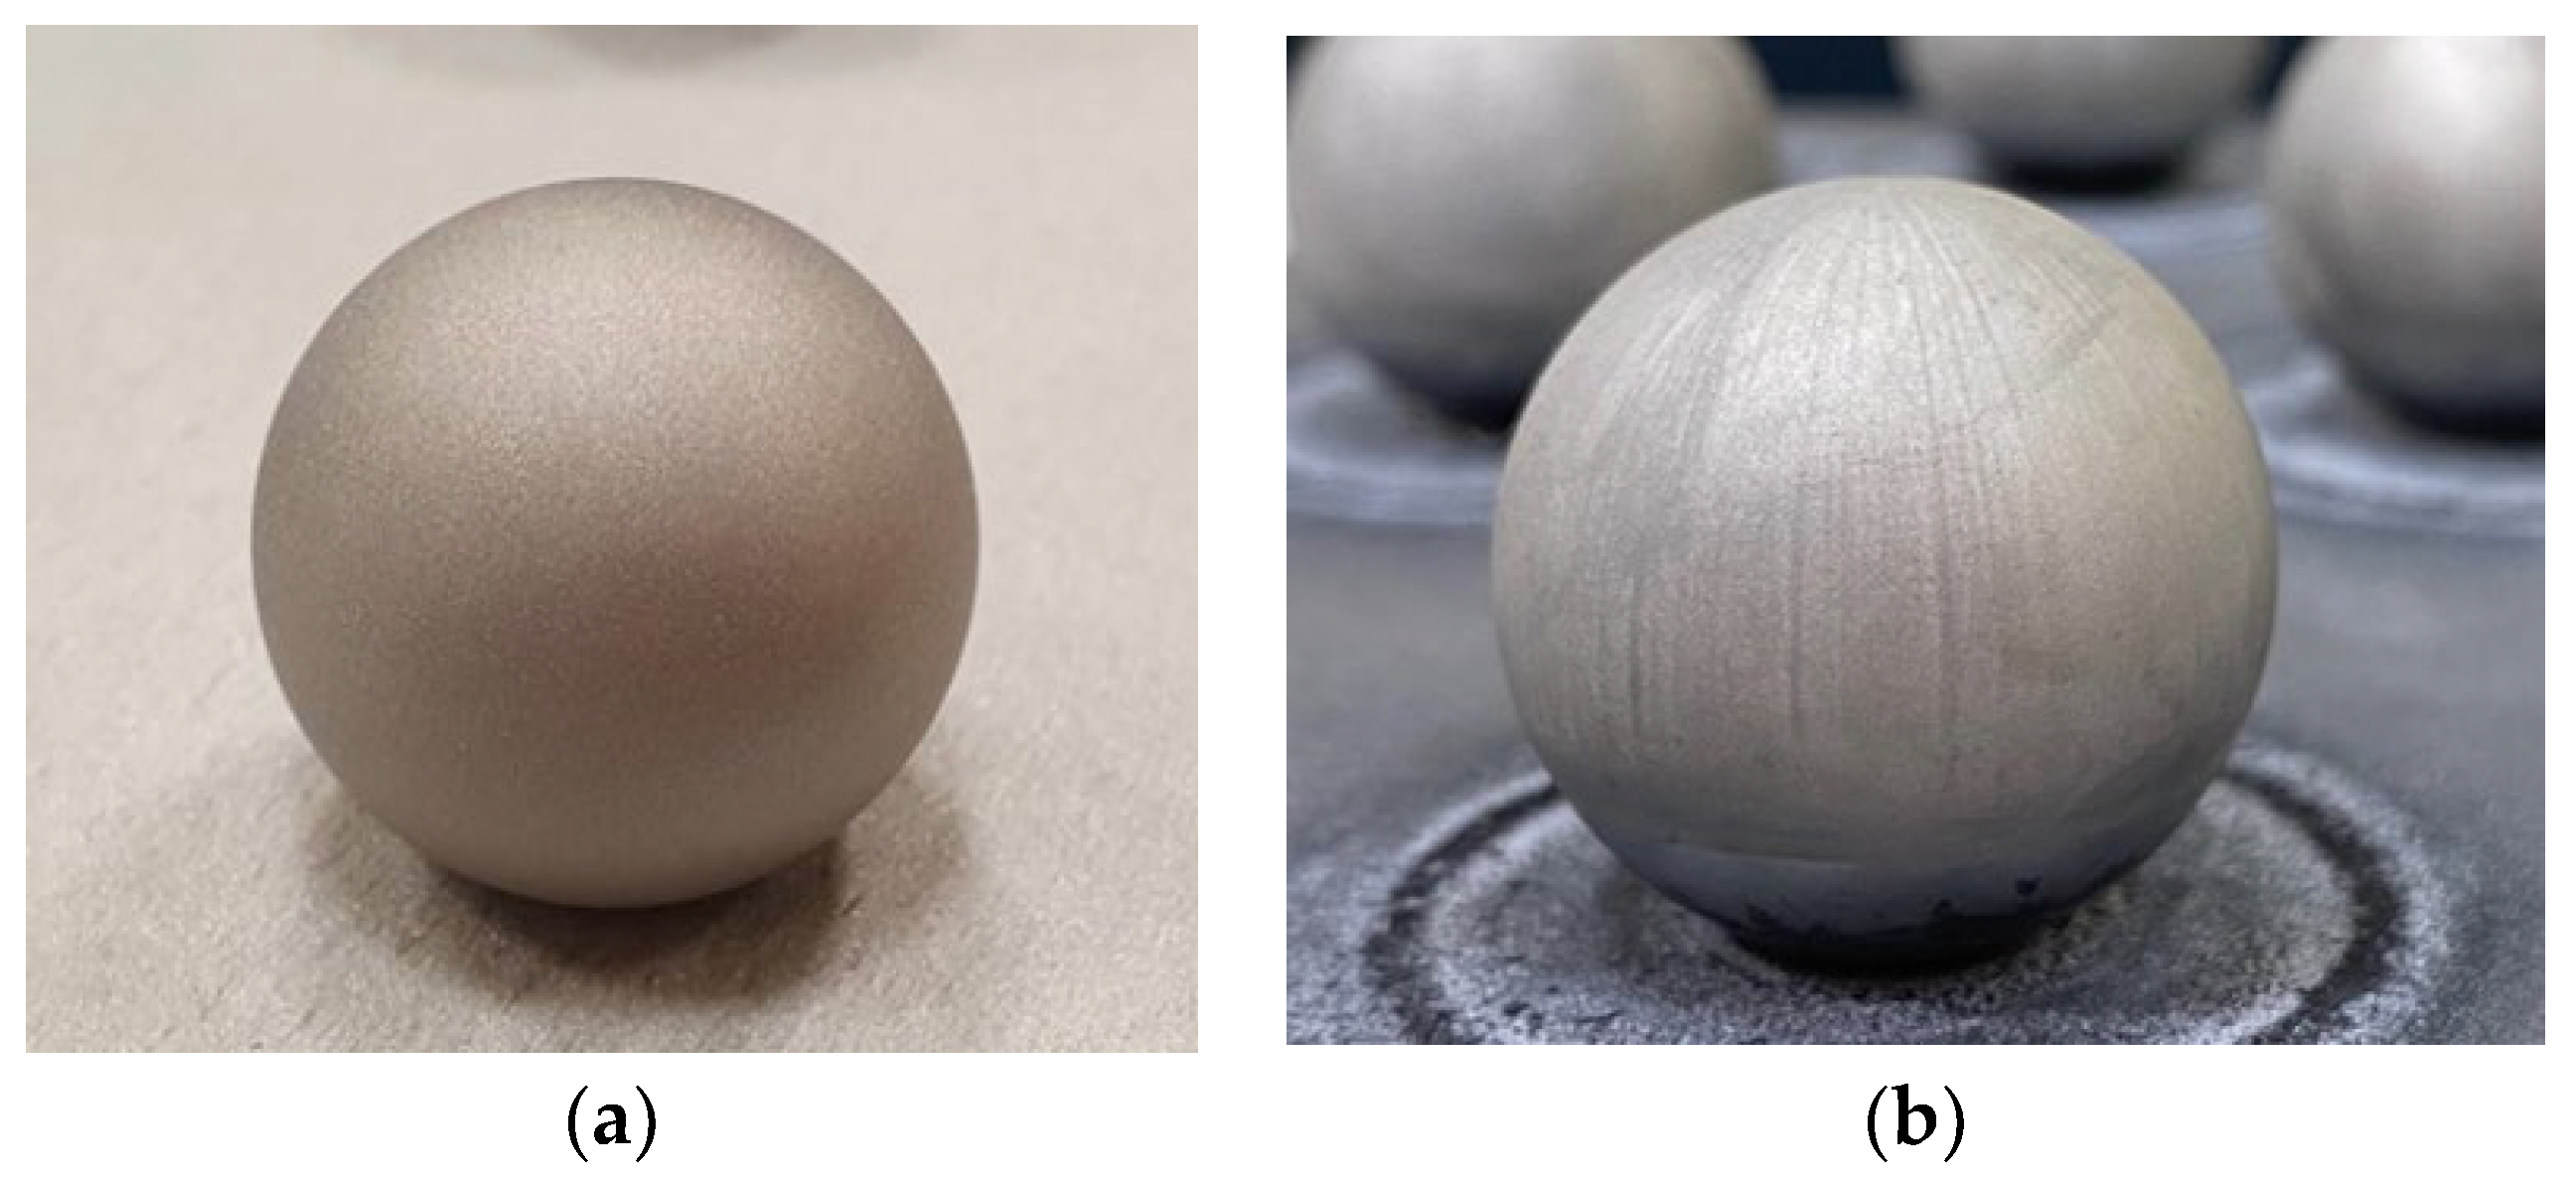
The sandblasting treatment was carried out using aluminium oxide WFA F100 as the abrasive (
Figure 6a). In the present research, spheres were subjected to a chemical etching by immersion in aqua regia solution, to which 3 g of iron chloride (FeCl
3) were added for dyeing. The different sphere sets were immersed in a glass recipient filled with the solution so that it only came into contact with the precision spheres. After 8 min of immersion, each sphere set was extracted and rapidly immersed in another recipient filled with deionised water in order to stop the chemical reaction and to remove the acid from the sphere’s surface. Finally, spheres were air-dried, leading to the result that can be observed in
Figure 6b.
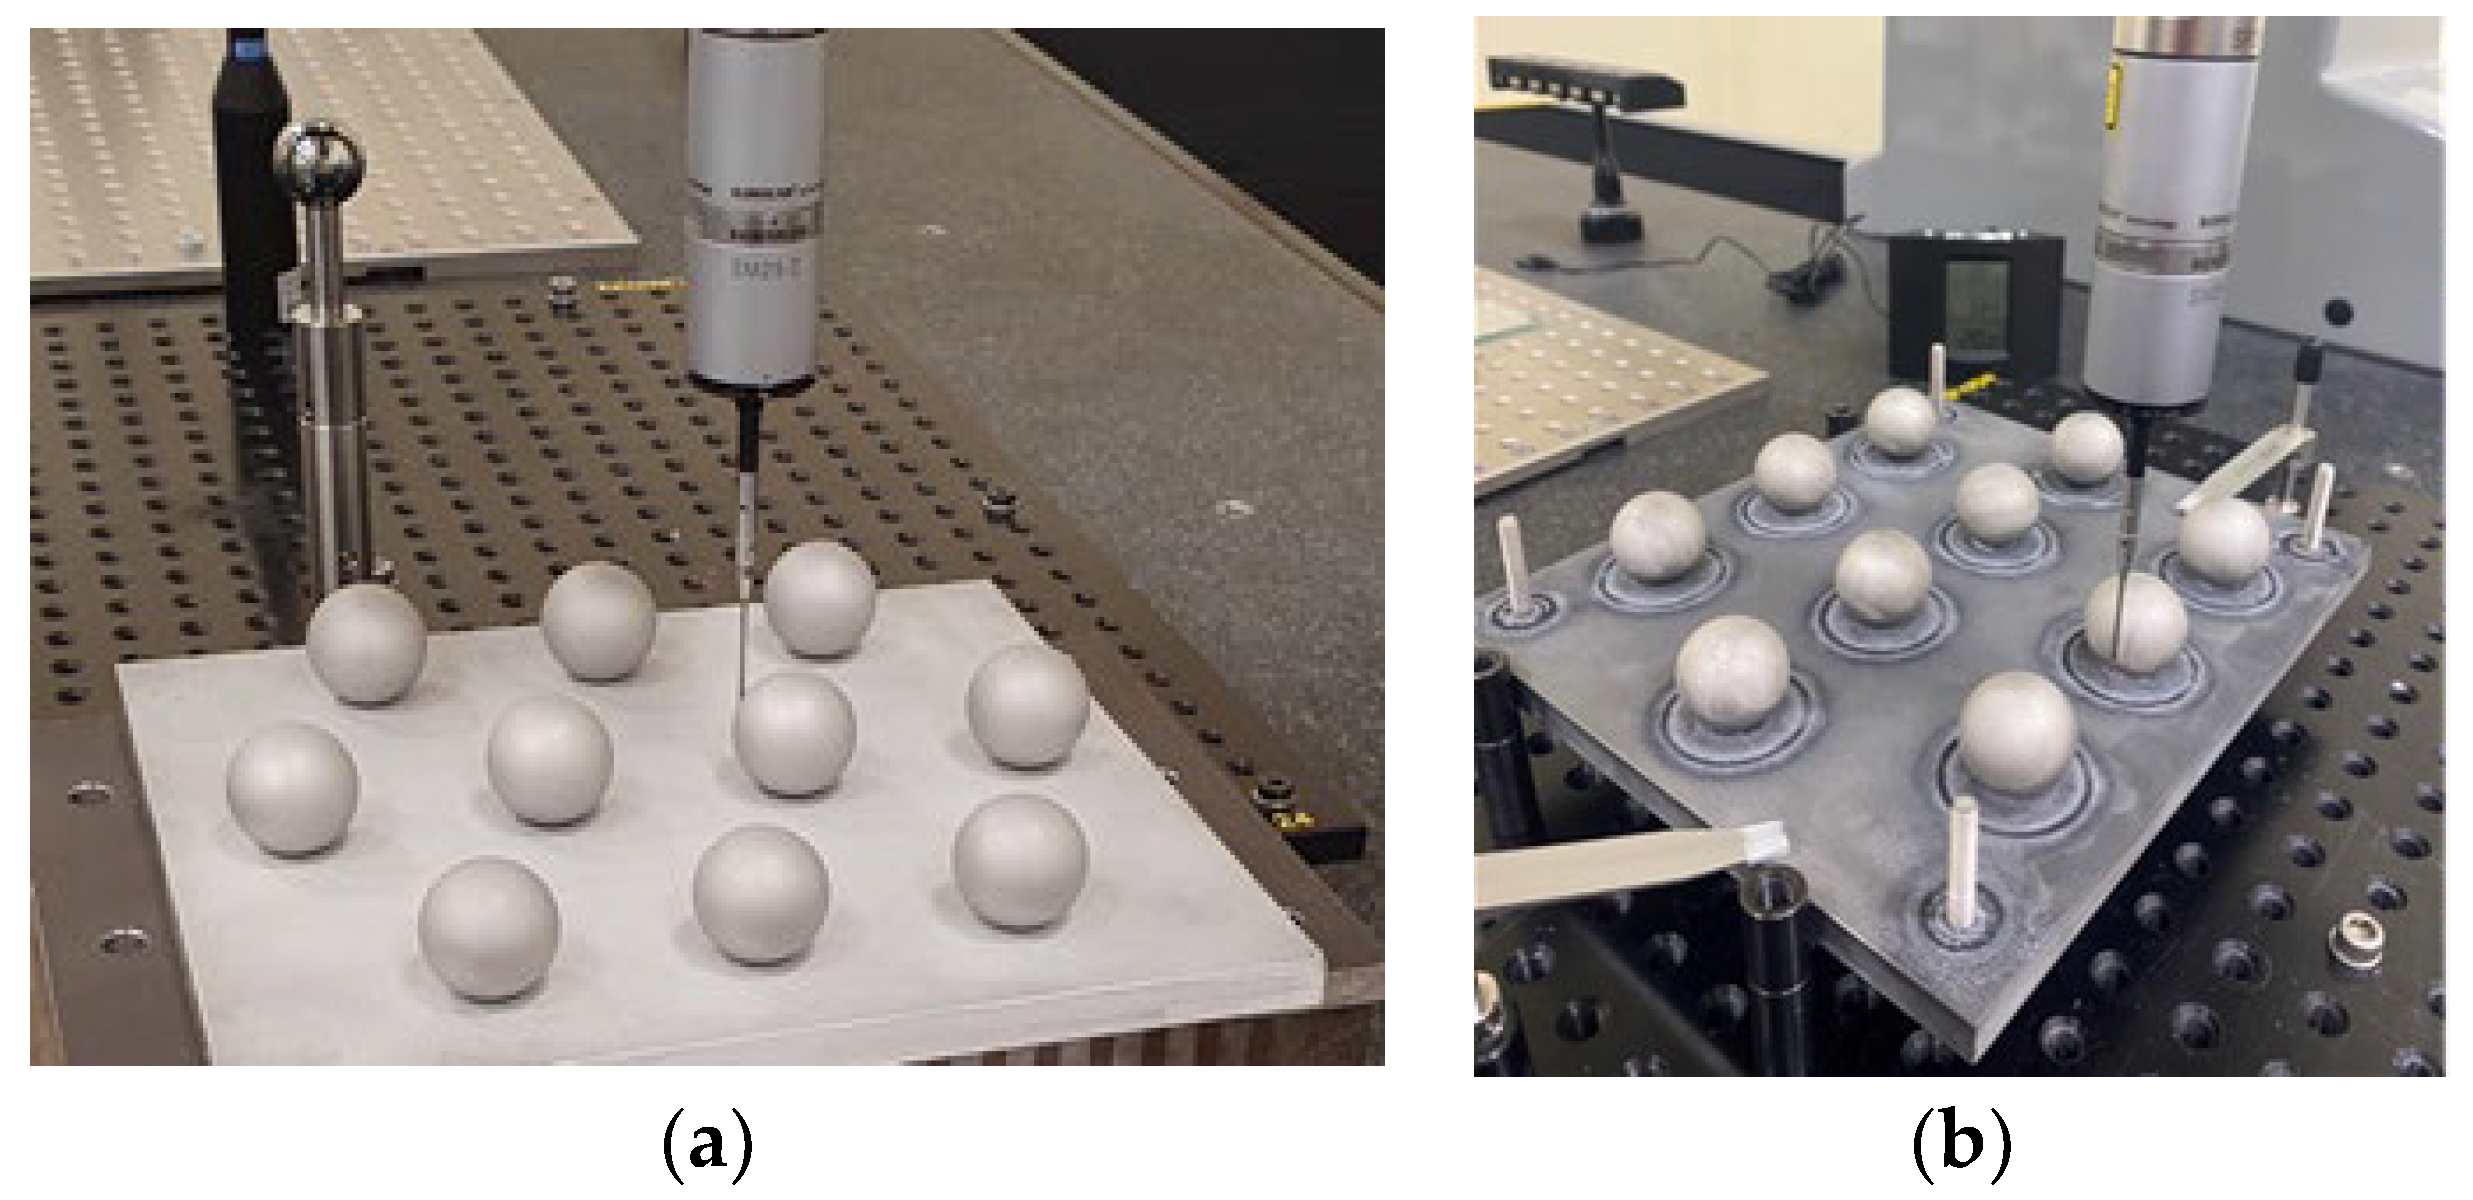
Once the processes for modifying the surface finish of the spheres with aqua regia were completed, new measurements were performed on the sets of spheres, again by contact probing in the CMM (
Figure 7) and by noncontact digitising with the laser triangulation sensor (
Figure 8).
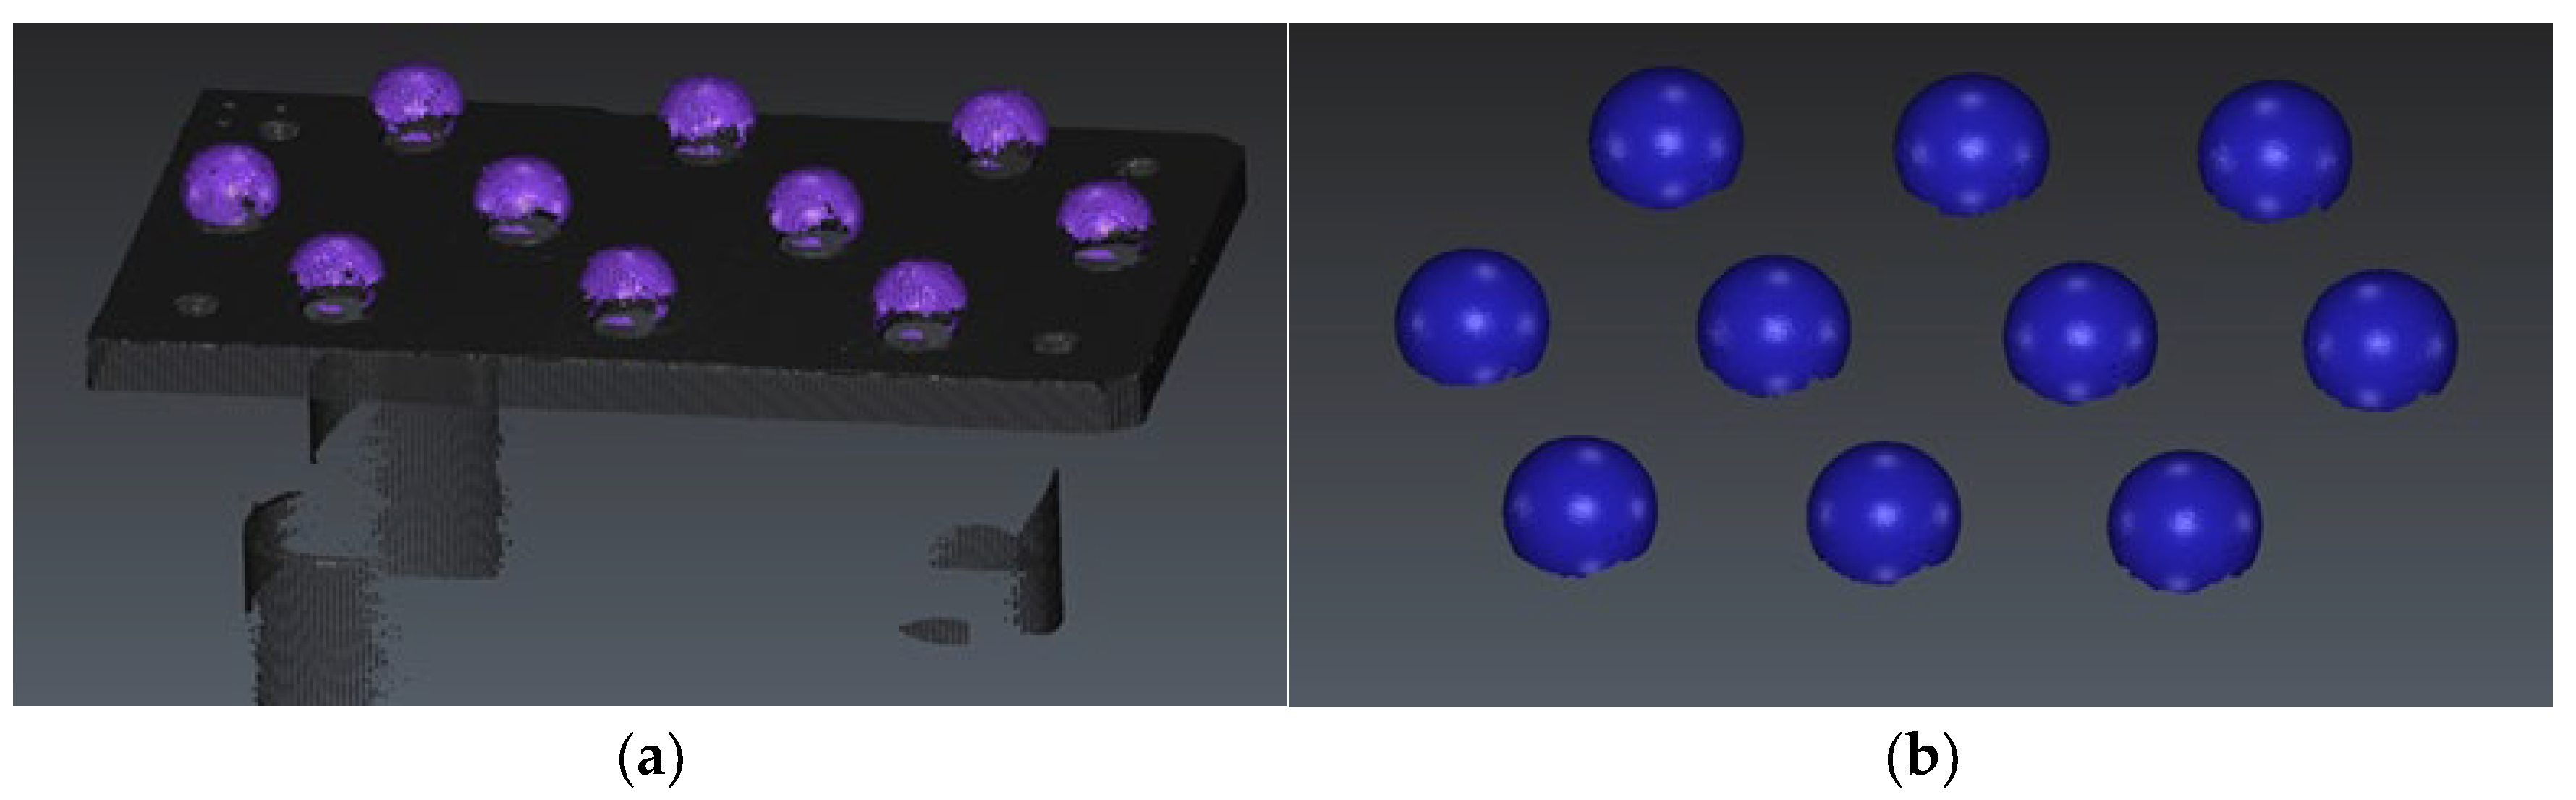
In a similar manner to the original measurements of the spheres, before any surface treatment, in the procedure of noncontact measurement of the treated spheres, these were captured using 5 different orientations of the laser sensors that allow the generation of the point clouds shown in
Figure 9a. This number of orientations was sufficient to capture, at least, the upper hemisphere of each sphere. The processing of the point clouds, carried out with the aid of Geomagic
® Control X 2020 (3D Systems, Rock Hill, SC, USA), involved, in the first place, the removal of those points not pertaining to the spheres (points of the base plate and the auxiliary fixture devices) so that the point clouds to be addressed are only those relating to the upper hemispheres.
In the second place, points located below the horizontal equator of each sphere were erased (
Figure 9b). In the last step, a 2σ filter is applied to remove spurious points, which are clearly located far away from the sphere surface and whose inclusion in the analysis would distort all the performed measurements.
4. Conclusions
The improvement of the quality of point clouds acquired by noncontact measurement systems and the metrological parameters extracted from them has been evaluated by comparing the measurement results of metallic spheres before and after being subjected to two surface treatments: sandblasting and chemical etching by immersion in aqua regia. To ensure the repeatability of the experiments, the study was carried out employing a high number of spheres clustered according to three different sizes on different plates. Moreover, several repetitions of measurements were also performed, both in the contact measurements (by contact probing in a CMM) that were taken as reference and in the noncontact measurements (by scanning with a laser triangulation sensor mounted on the same CMM).
The first conclusion that can be extracted is that the treatment in aqua regia causes reductions in the diameters of the three sphere sizes that can be quantified in the range of 0.08 mm, as evaluated by contact measurements (see “CMM contact” columns in
Table 1). However, when spheres are scanned with the laser sensor, results show that the chemical treatment causes, on the one hand, a reduction in the diameter measurement of the smaller spheres (Ø10 mm), but on the other hand, an increase in the diameter measurement of the medium (Ø18 mm) and large size (Ø25 mm) spheres. This different tendency could be attributed to the influence of surface roughness on the contact measurement, which is greater for the smaller spheres.
The comparison of contact and noncontact measurement results obtained after the surface treatment revealed differences in diameter oscillating around an average value of 0.043 mm (−0.0478 with Ø10 mm, −0.0299 with Ø18 mm, −0.0527 with Ø25 mm). It is also observed that, once the spheres have been treated, the differences in the form error values obtained by contact and noncontact oscillate around 0.071 mm.
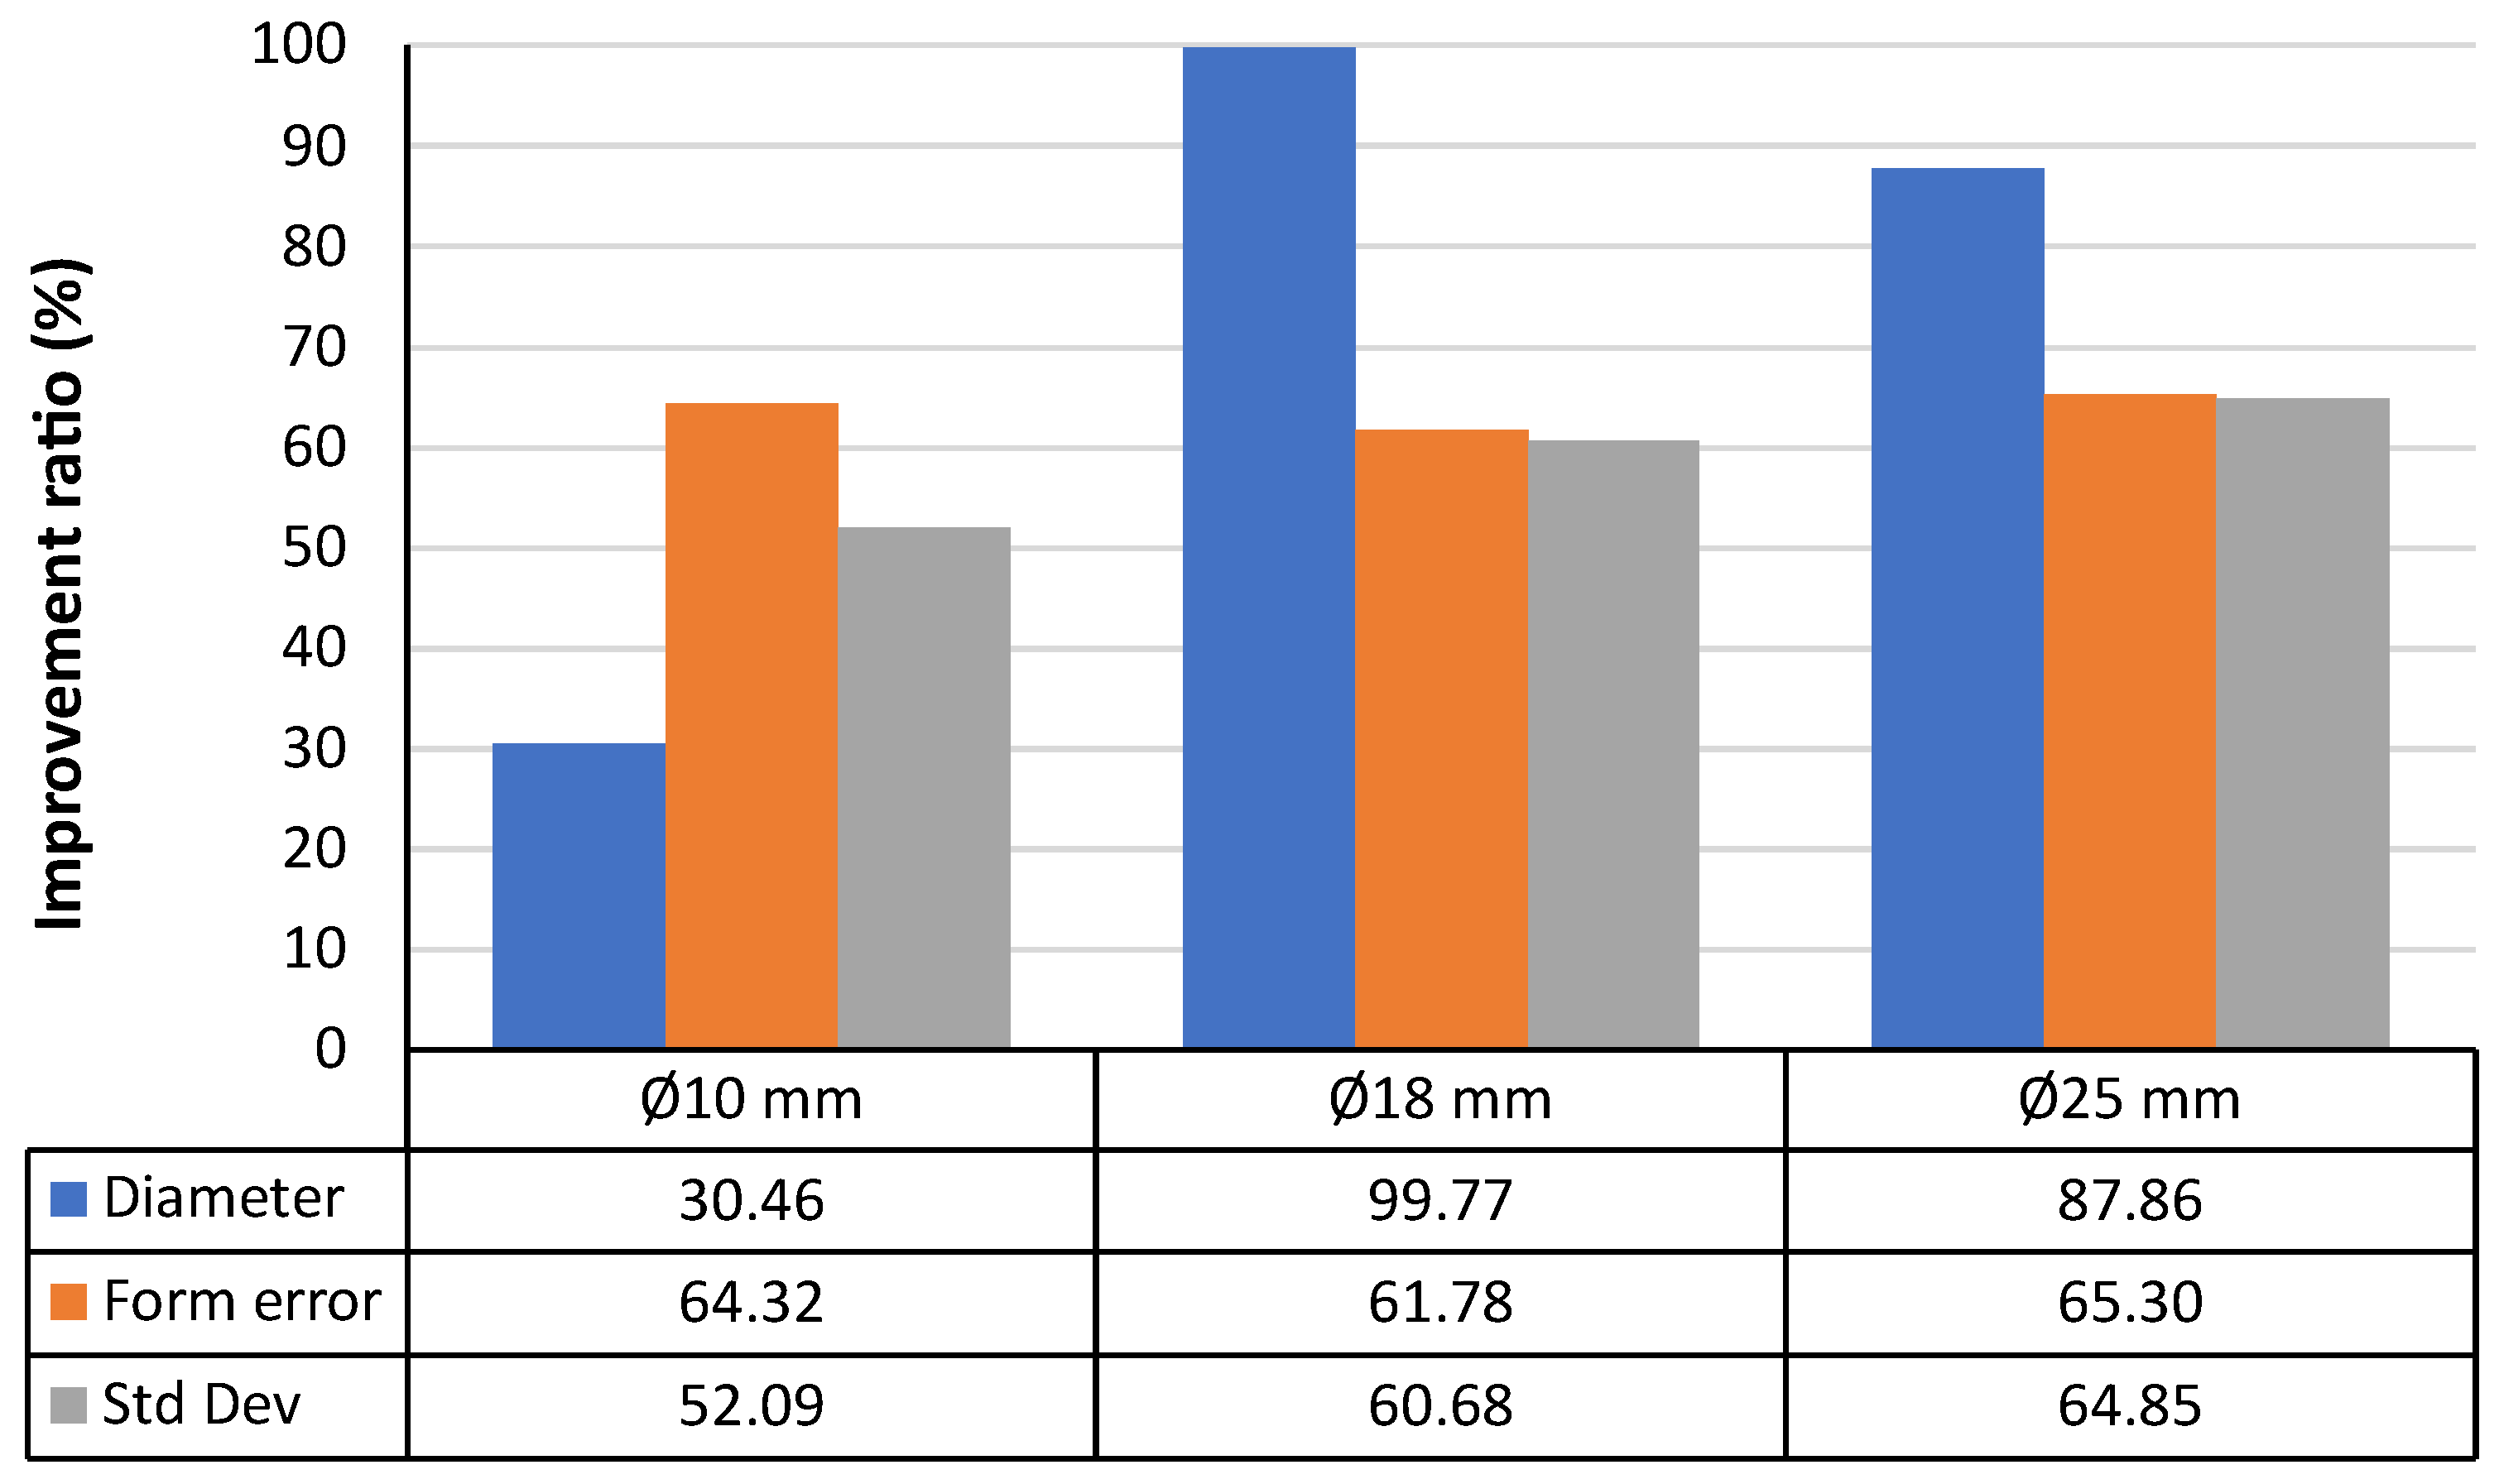
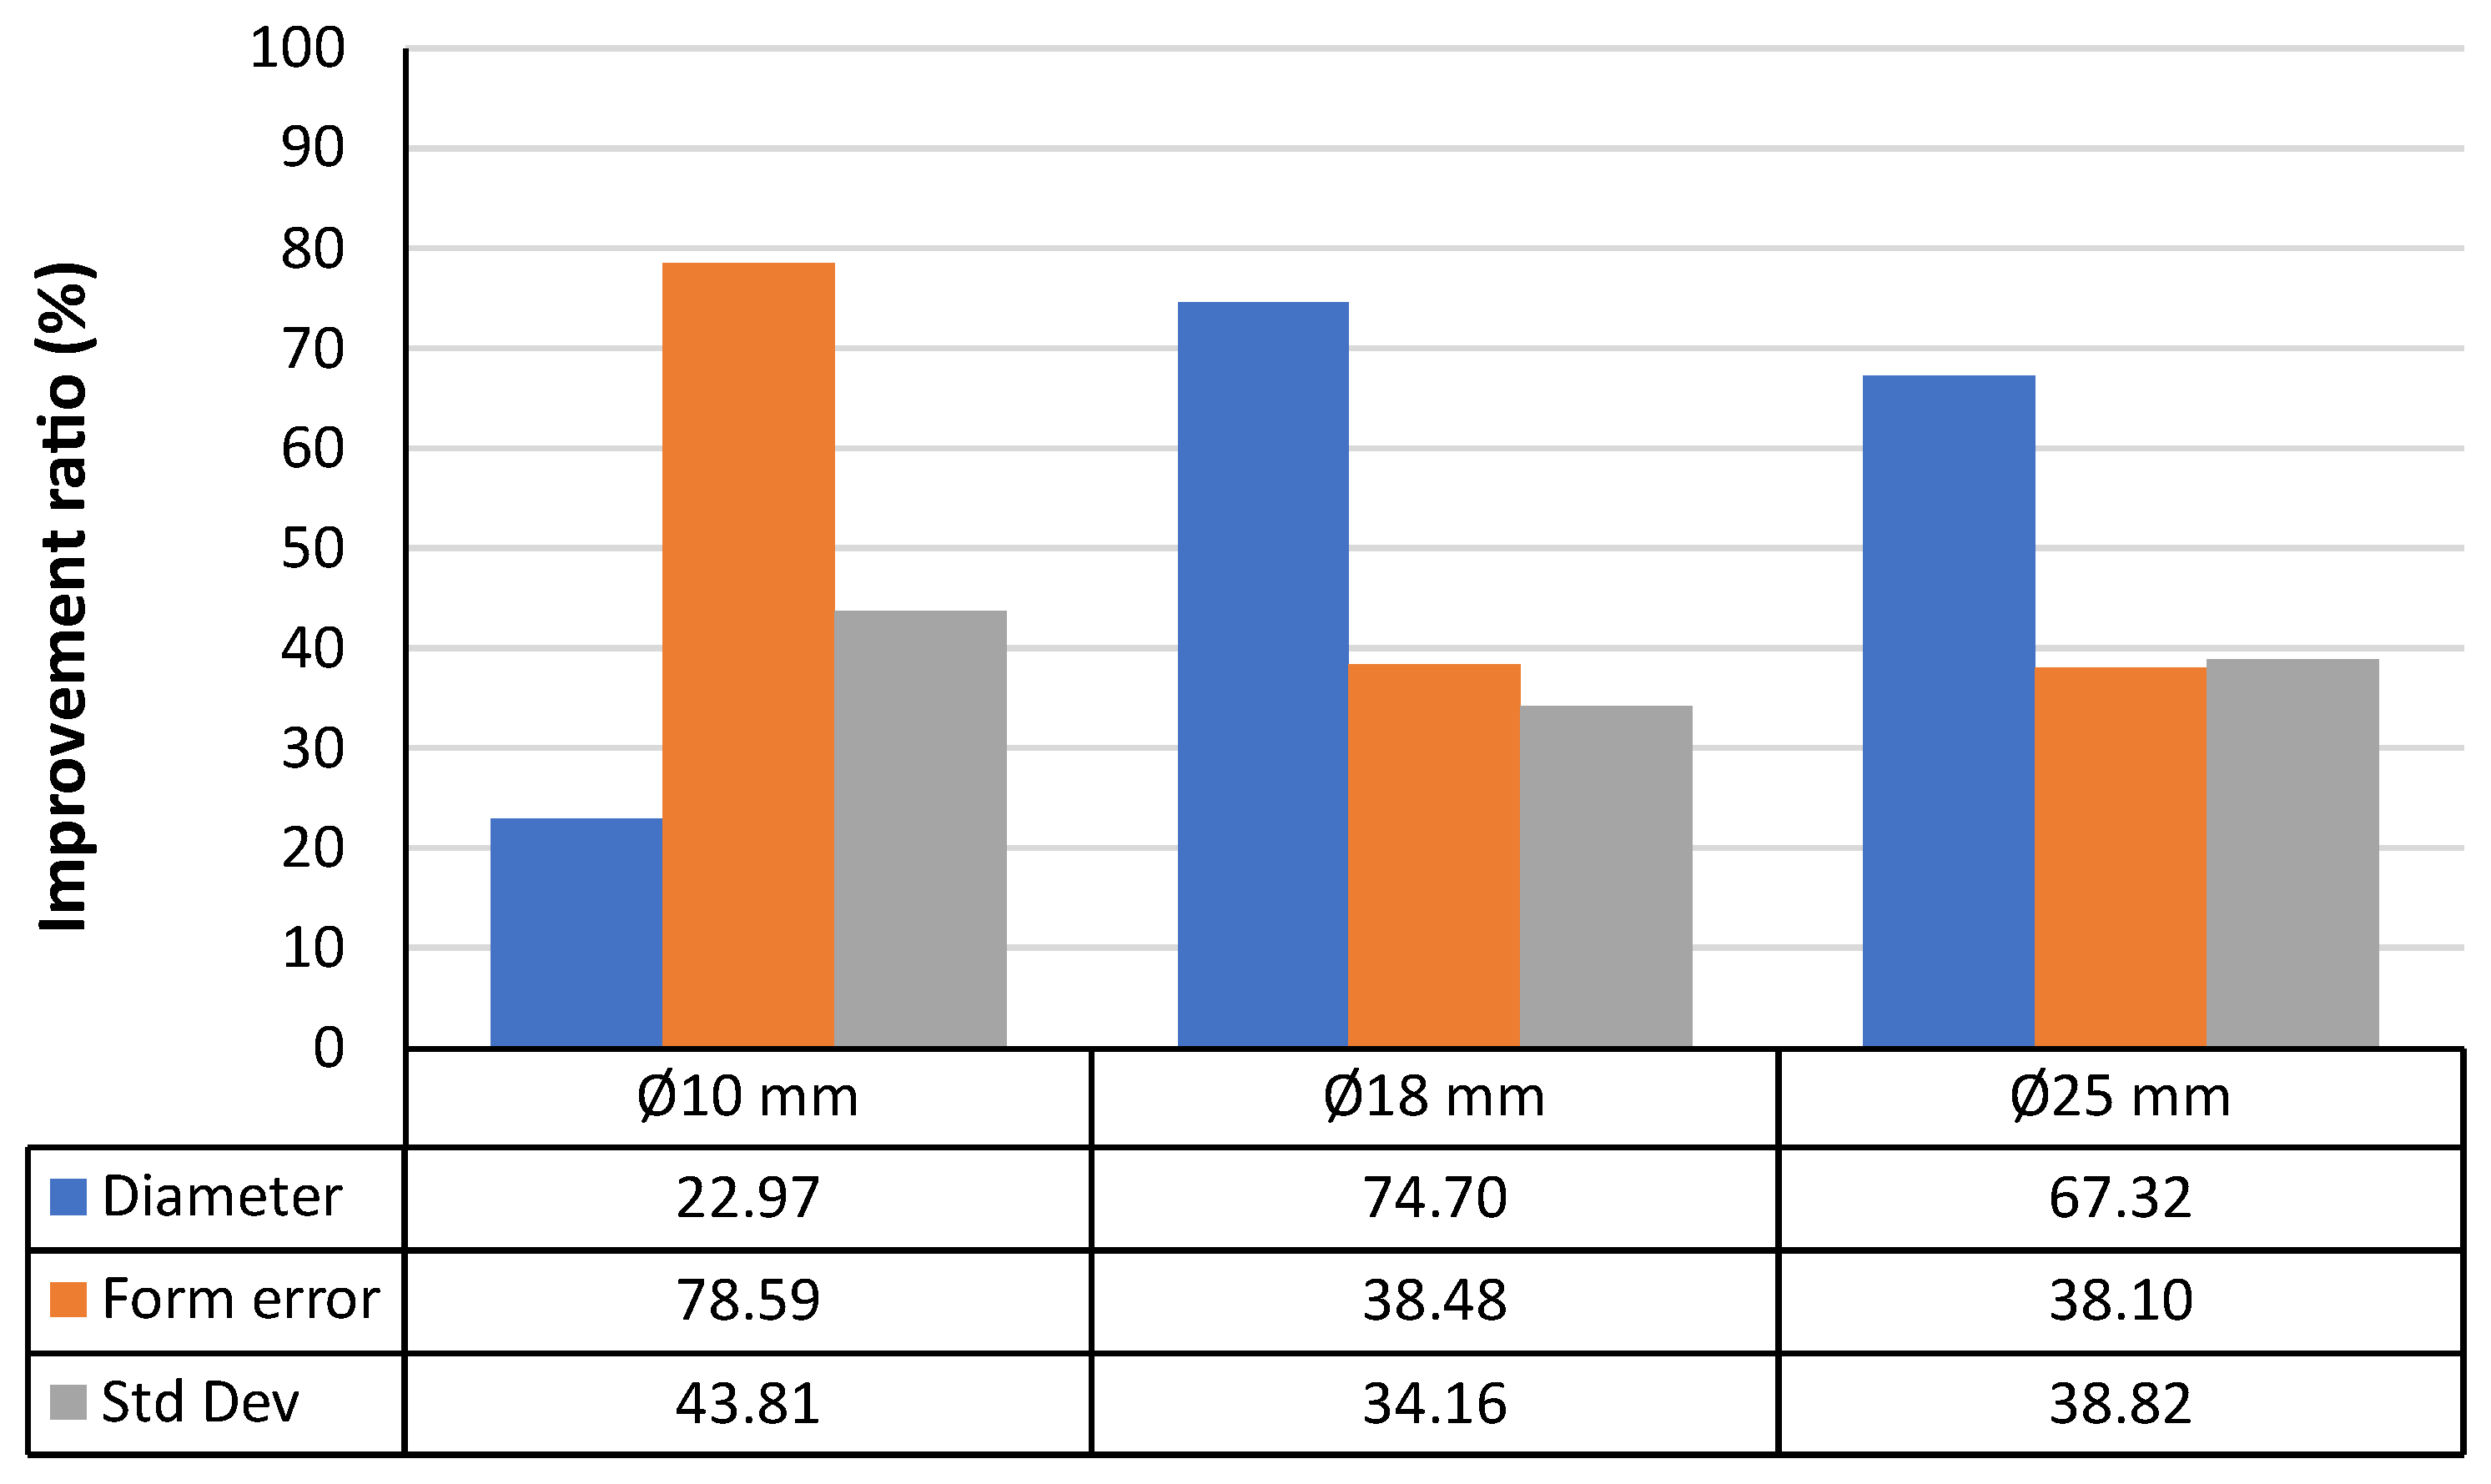
Secondly, the study confirms the improvements in the quality and quantity of the points belonging to the point clouds scanned by the laser sensor for all the sphere sizes after the chemical treatments, with ratios that even outperform the improvements achieved using sandblasting. The improvements are noticeably more significant in the case of the smaller spheres (76.78% in the chemically treated spheres and 61.72% in the sandblasted spheres).
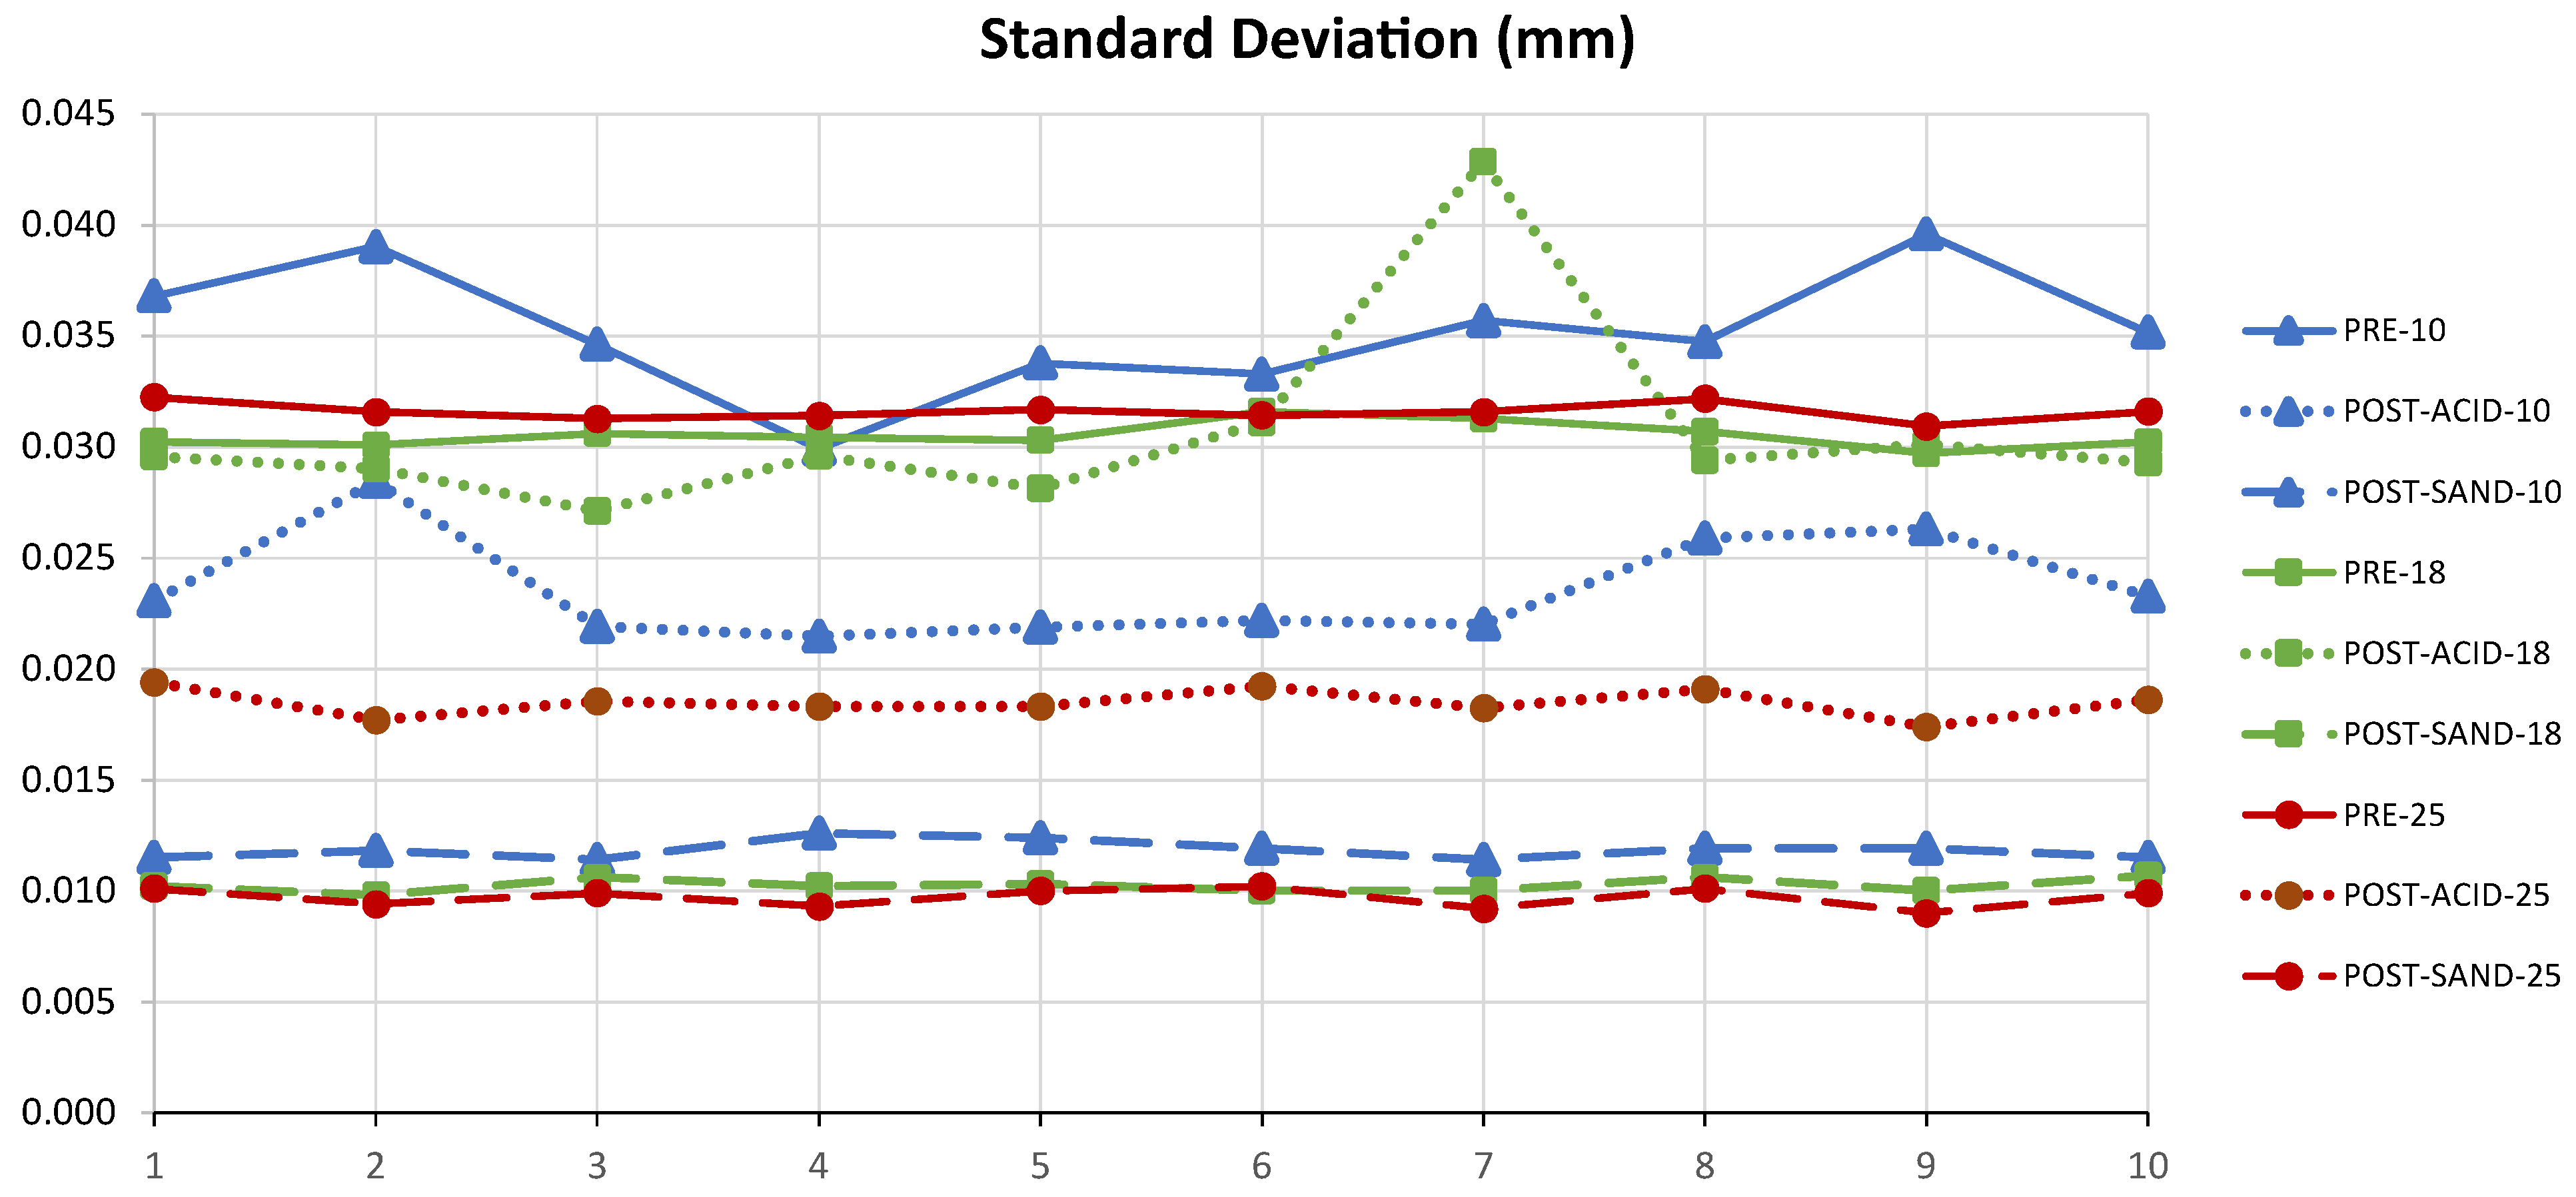
Regarding the standard deviation of point clouds scanned before and after the two surface treatments, the analysis reveals a reduction in this parameter after treating the spheres. This reduction is lower in the case of the chemical treatment than in the sandblasting treatment. Likewise, the range of values of this parameter for each position of the spheres is noticeably larger in the case of the chemically treated spheres, with results oscillating between 0.0174 mm and 0.0428 mm, while the values obtained from the sandblasted spheres reflect a greater homogeneity (between 0.0093 mm and 0.0126 mm).
Thirdly, it can be stated that the mechanical treatment of spheres by means of sandblasting produces a better dimensional agreement between contact and noncontact measurements than the chemical treatment. This result can be checked for the three analysed parameters (diameter, form deviation, and standard deviation of the point cloud), although it is more clearly observed in the case of medium and large spheres (Ø18 mm and Ø25 mm).
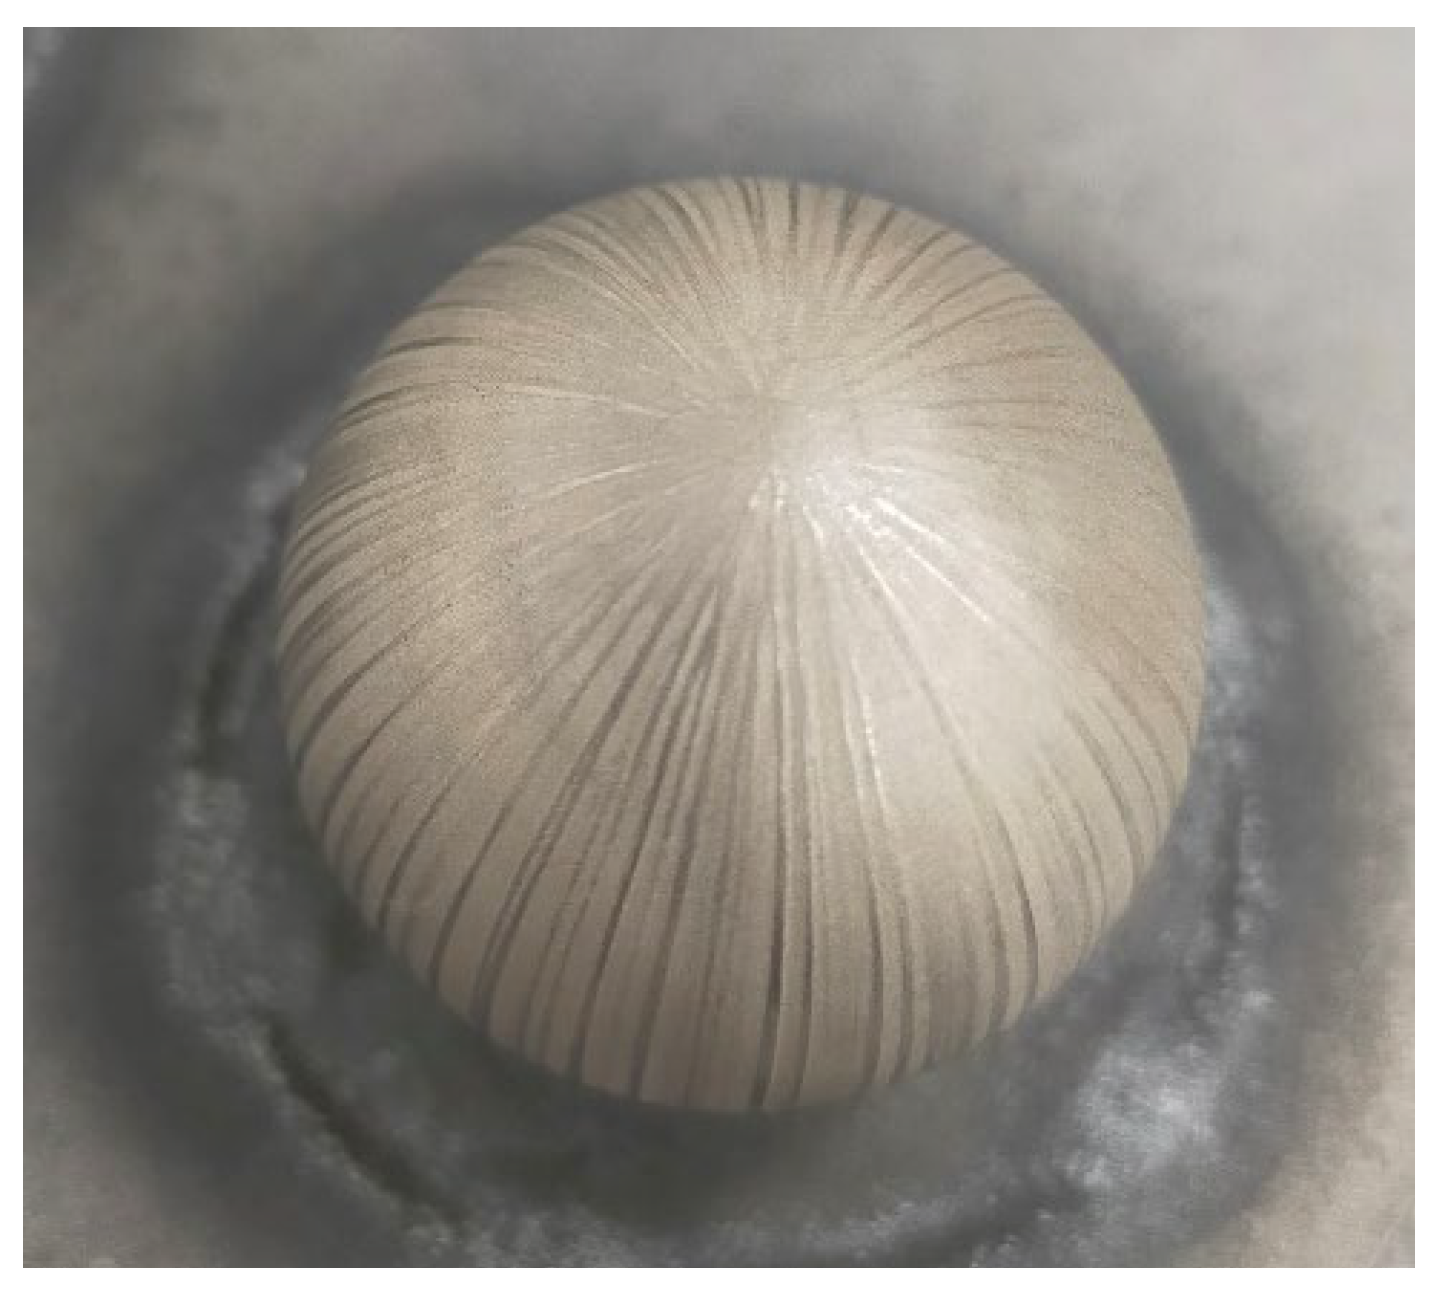
This research proves that the chemical treatment is able to minimise the light reflections on the sphere surface, thus enhancing point capture by laser scanning, but it also modifies substantially the analysed metrological parameters, which invalidates this process for obtaining spheres that can be used as reference elements. Therefore, the objective of improving the values obtained by sandblasting, whose validity had been proved in previous work, is not achieved. It is important to note that the immersion in an acid bath is more aggressive as the time during which the stainless steel sphere is immersed increases. In fact, after immersing the spheres for 8 min, a subsequent cleansing was needed, and the final air drying has generated marks on the sphere surface in the form of meridians caused by gravity, which has affected the surface finish (
Figure 14).
A complete control of the way to attack, i.e., the exposure-to-acid time and the position of the spheres, and even the drying process, could help achieve better results than those obtained within this research, which undoubtedly can constitute the basis of future work.


 ,
, 


