
Selective Laser Melting of CuSn10: Simulation of Mechanical Properties, Microstructure, and Residual Stresses


Abstract
:1. Introduction
2. Materials and Methods
3. Results and Discussion
4. Conclusions
- It was found that CuSn10 could be processed well at a laser power of 100 W. However, relatively small layer thicknesses and track spacings were required, resulting in a significant increase in the production time. Accordingly, a more powerful laser unit is recommended for economical use.
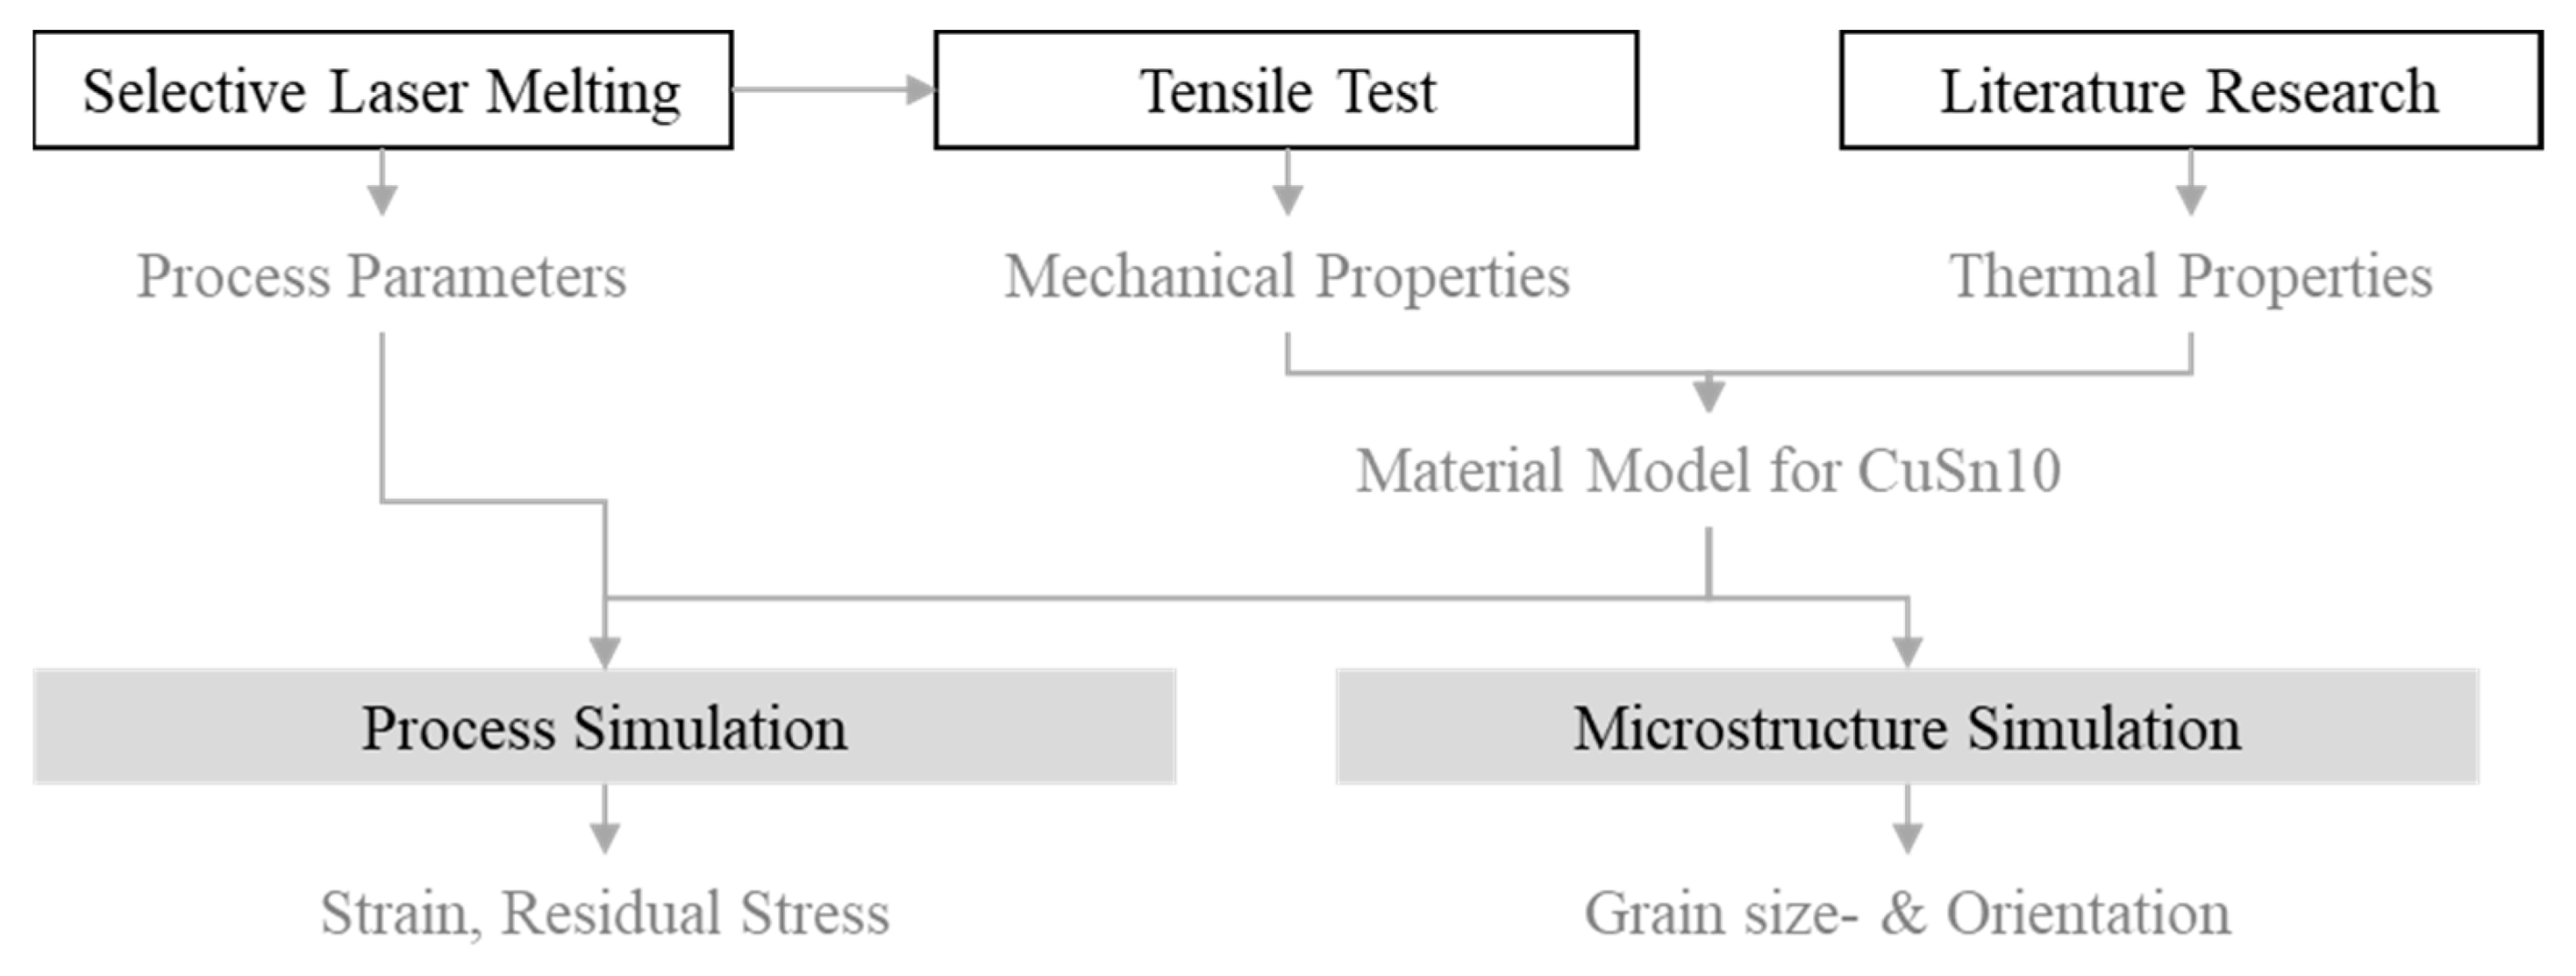
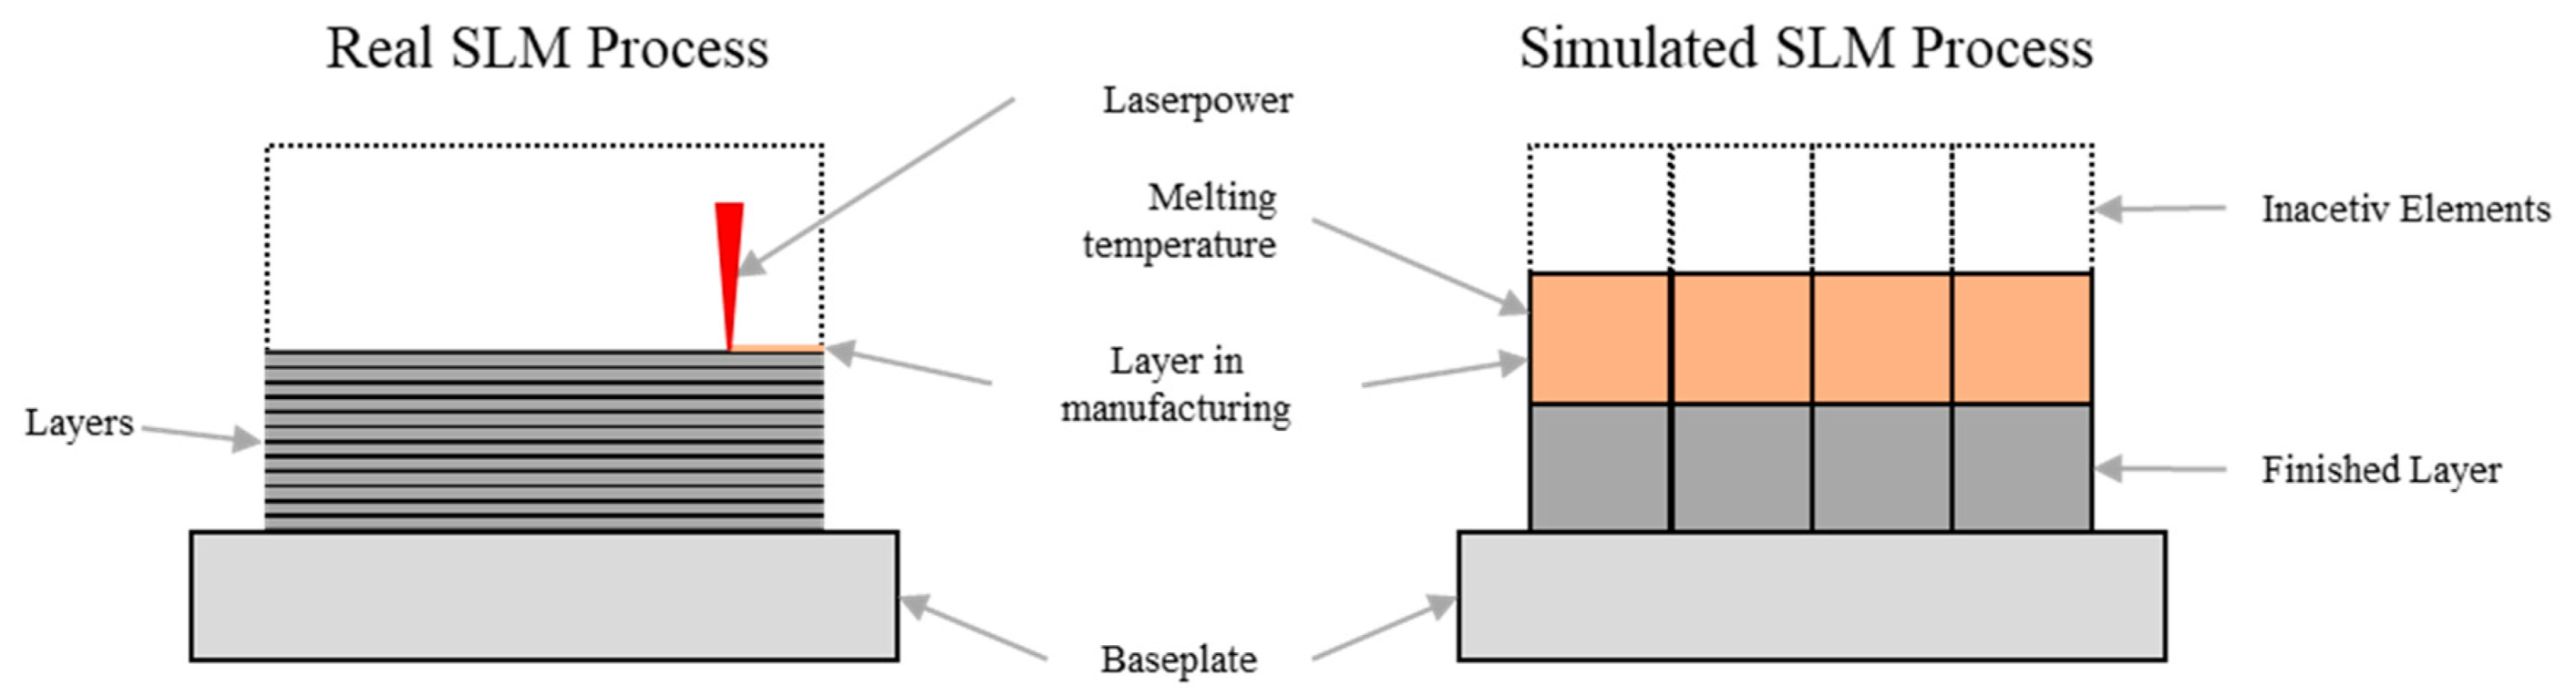
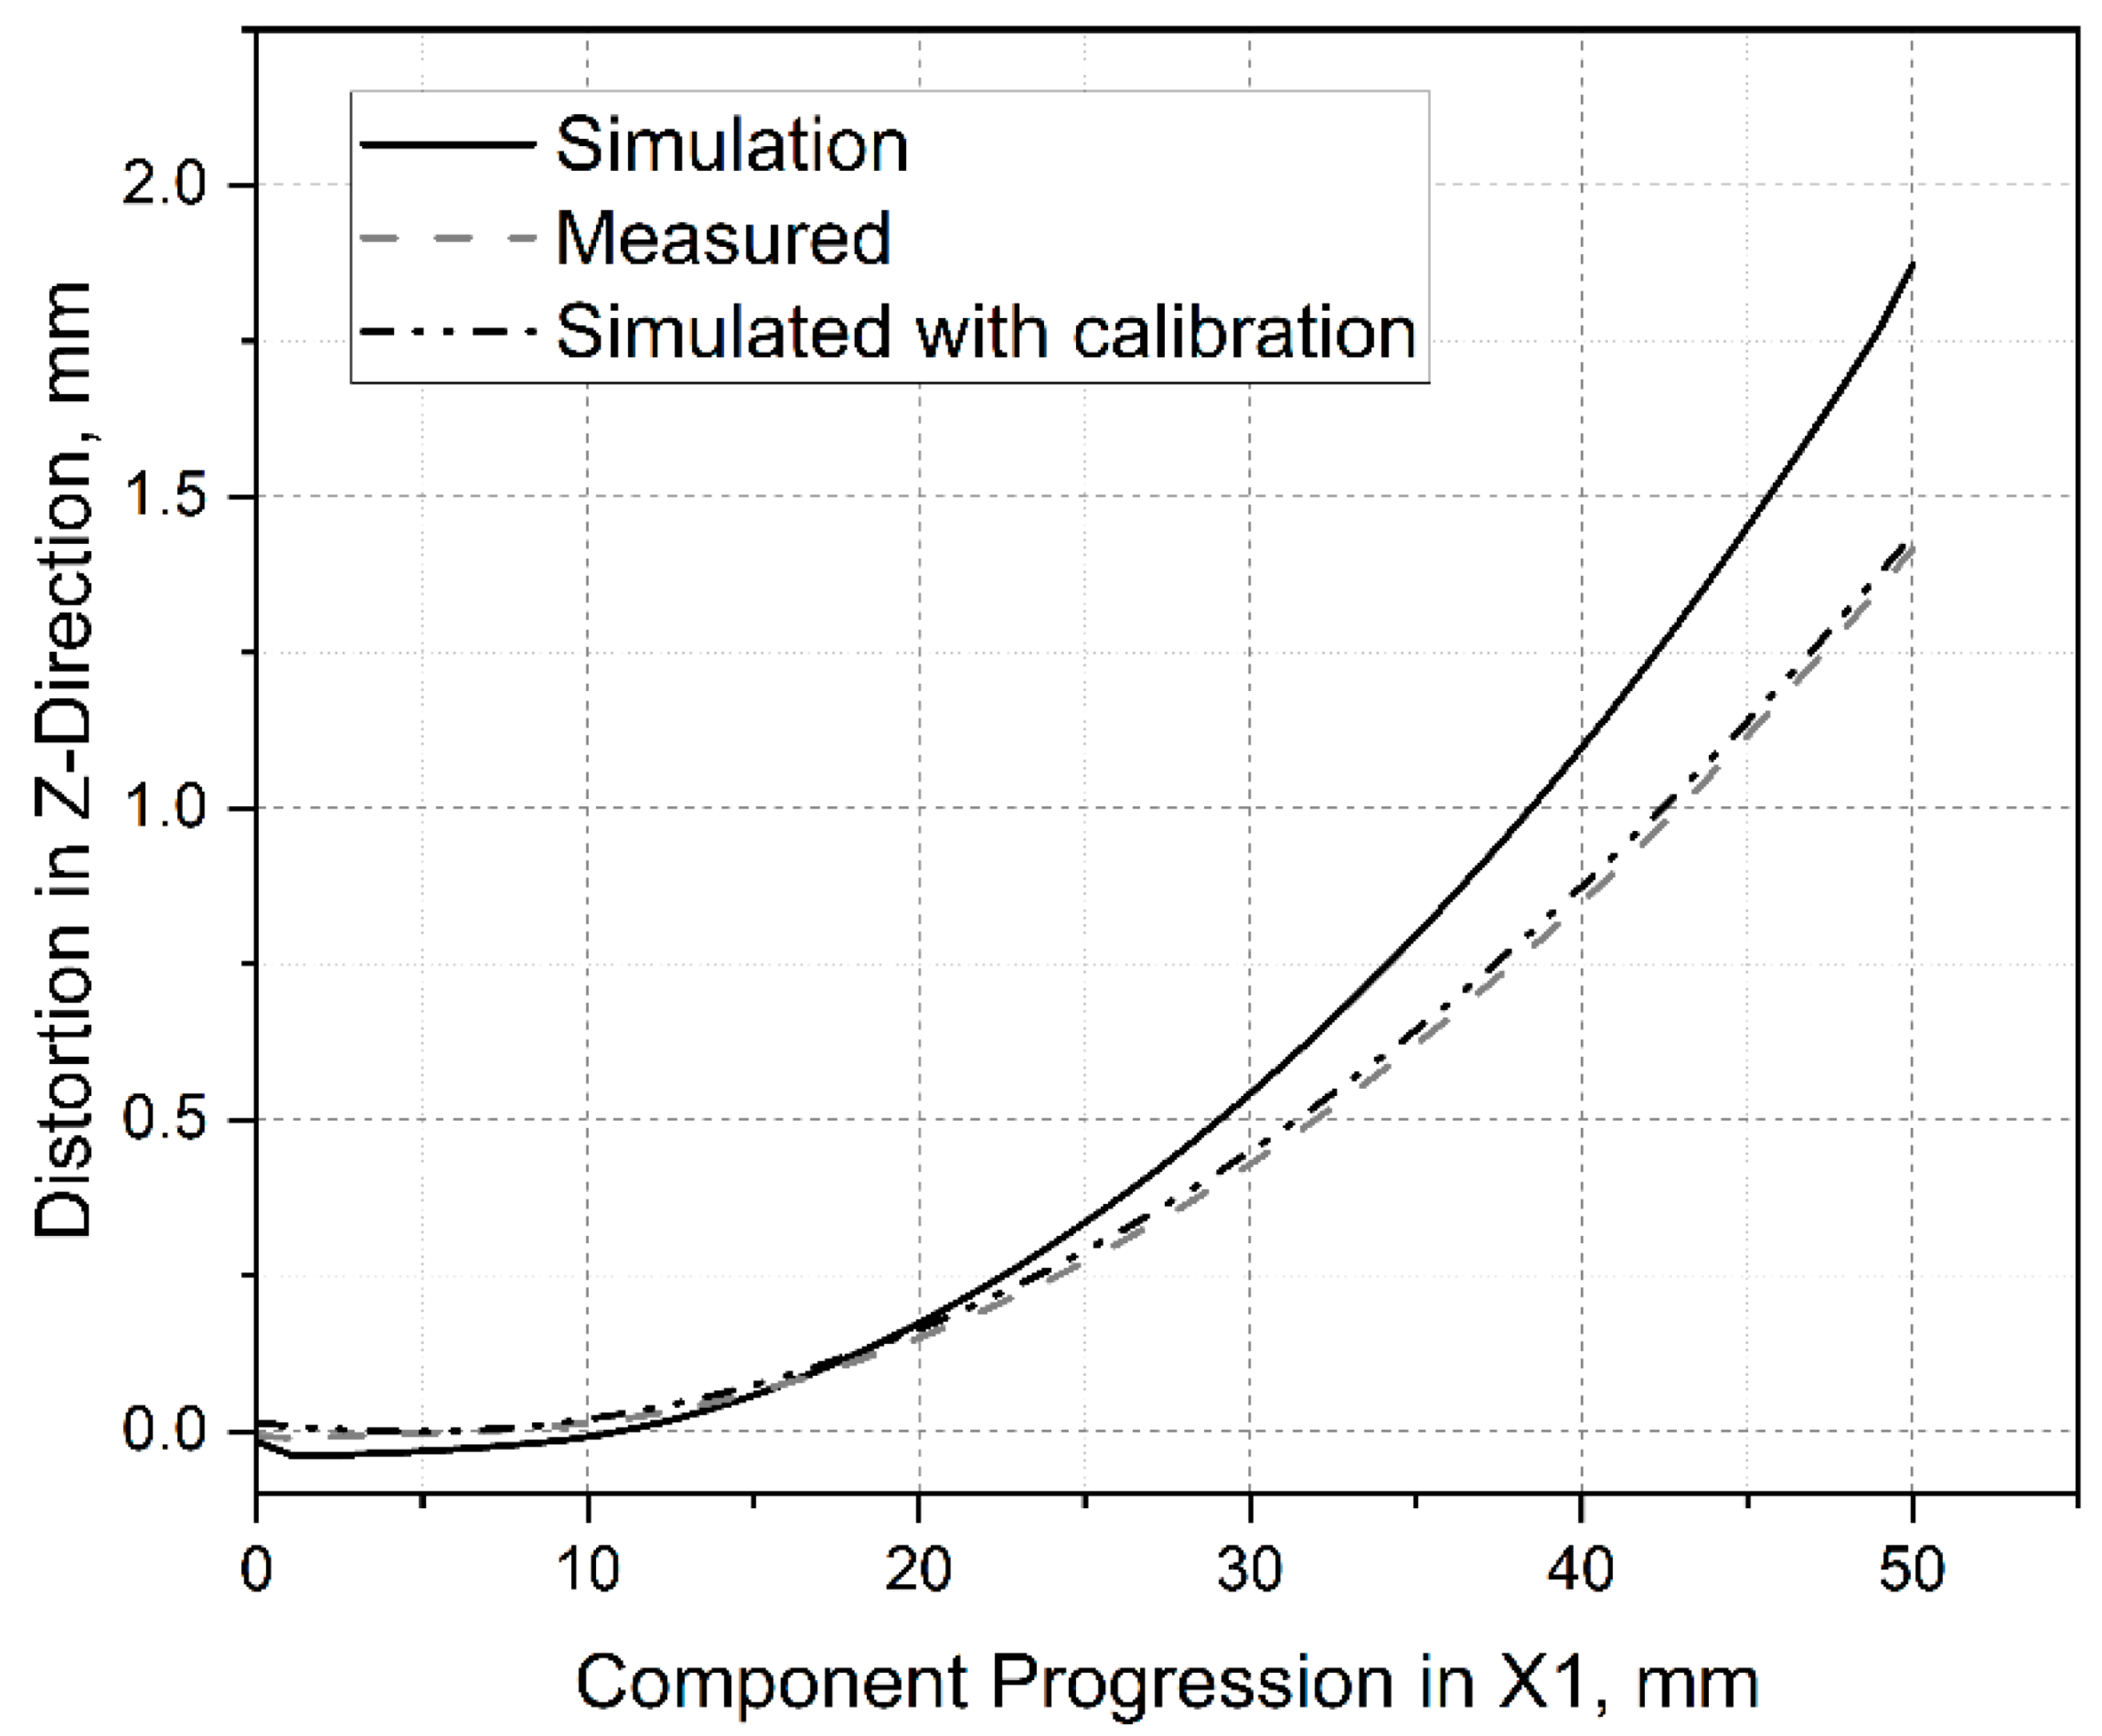
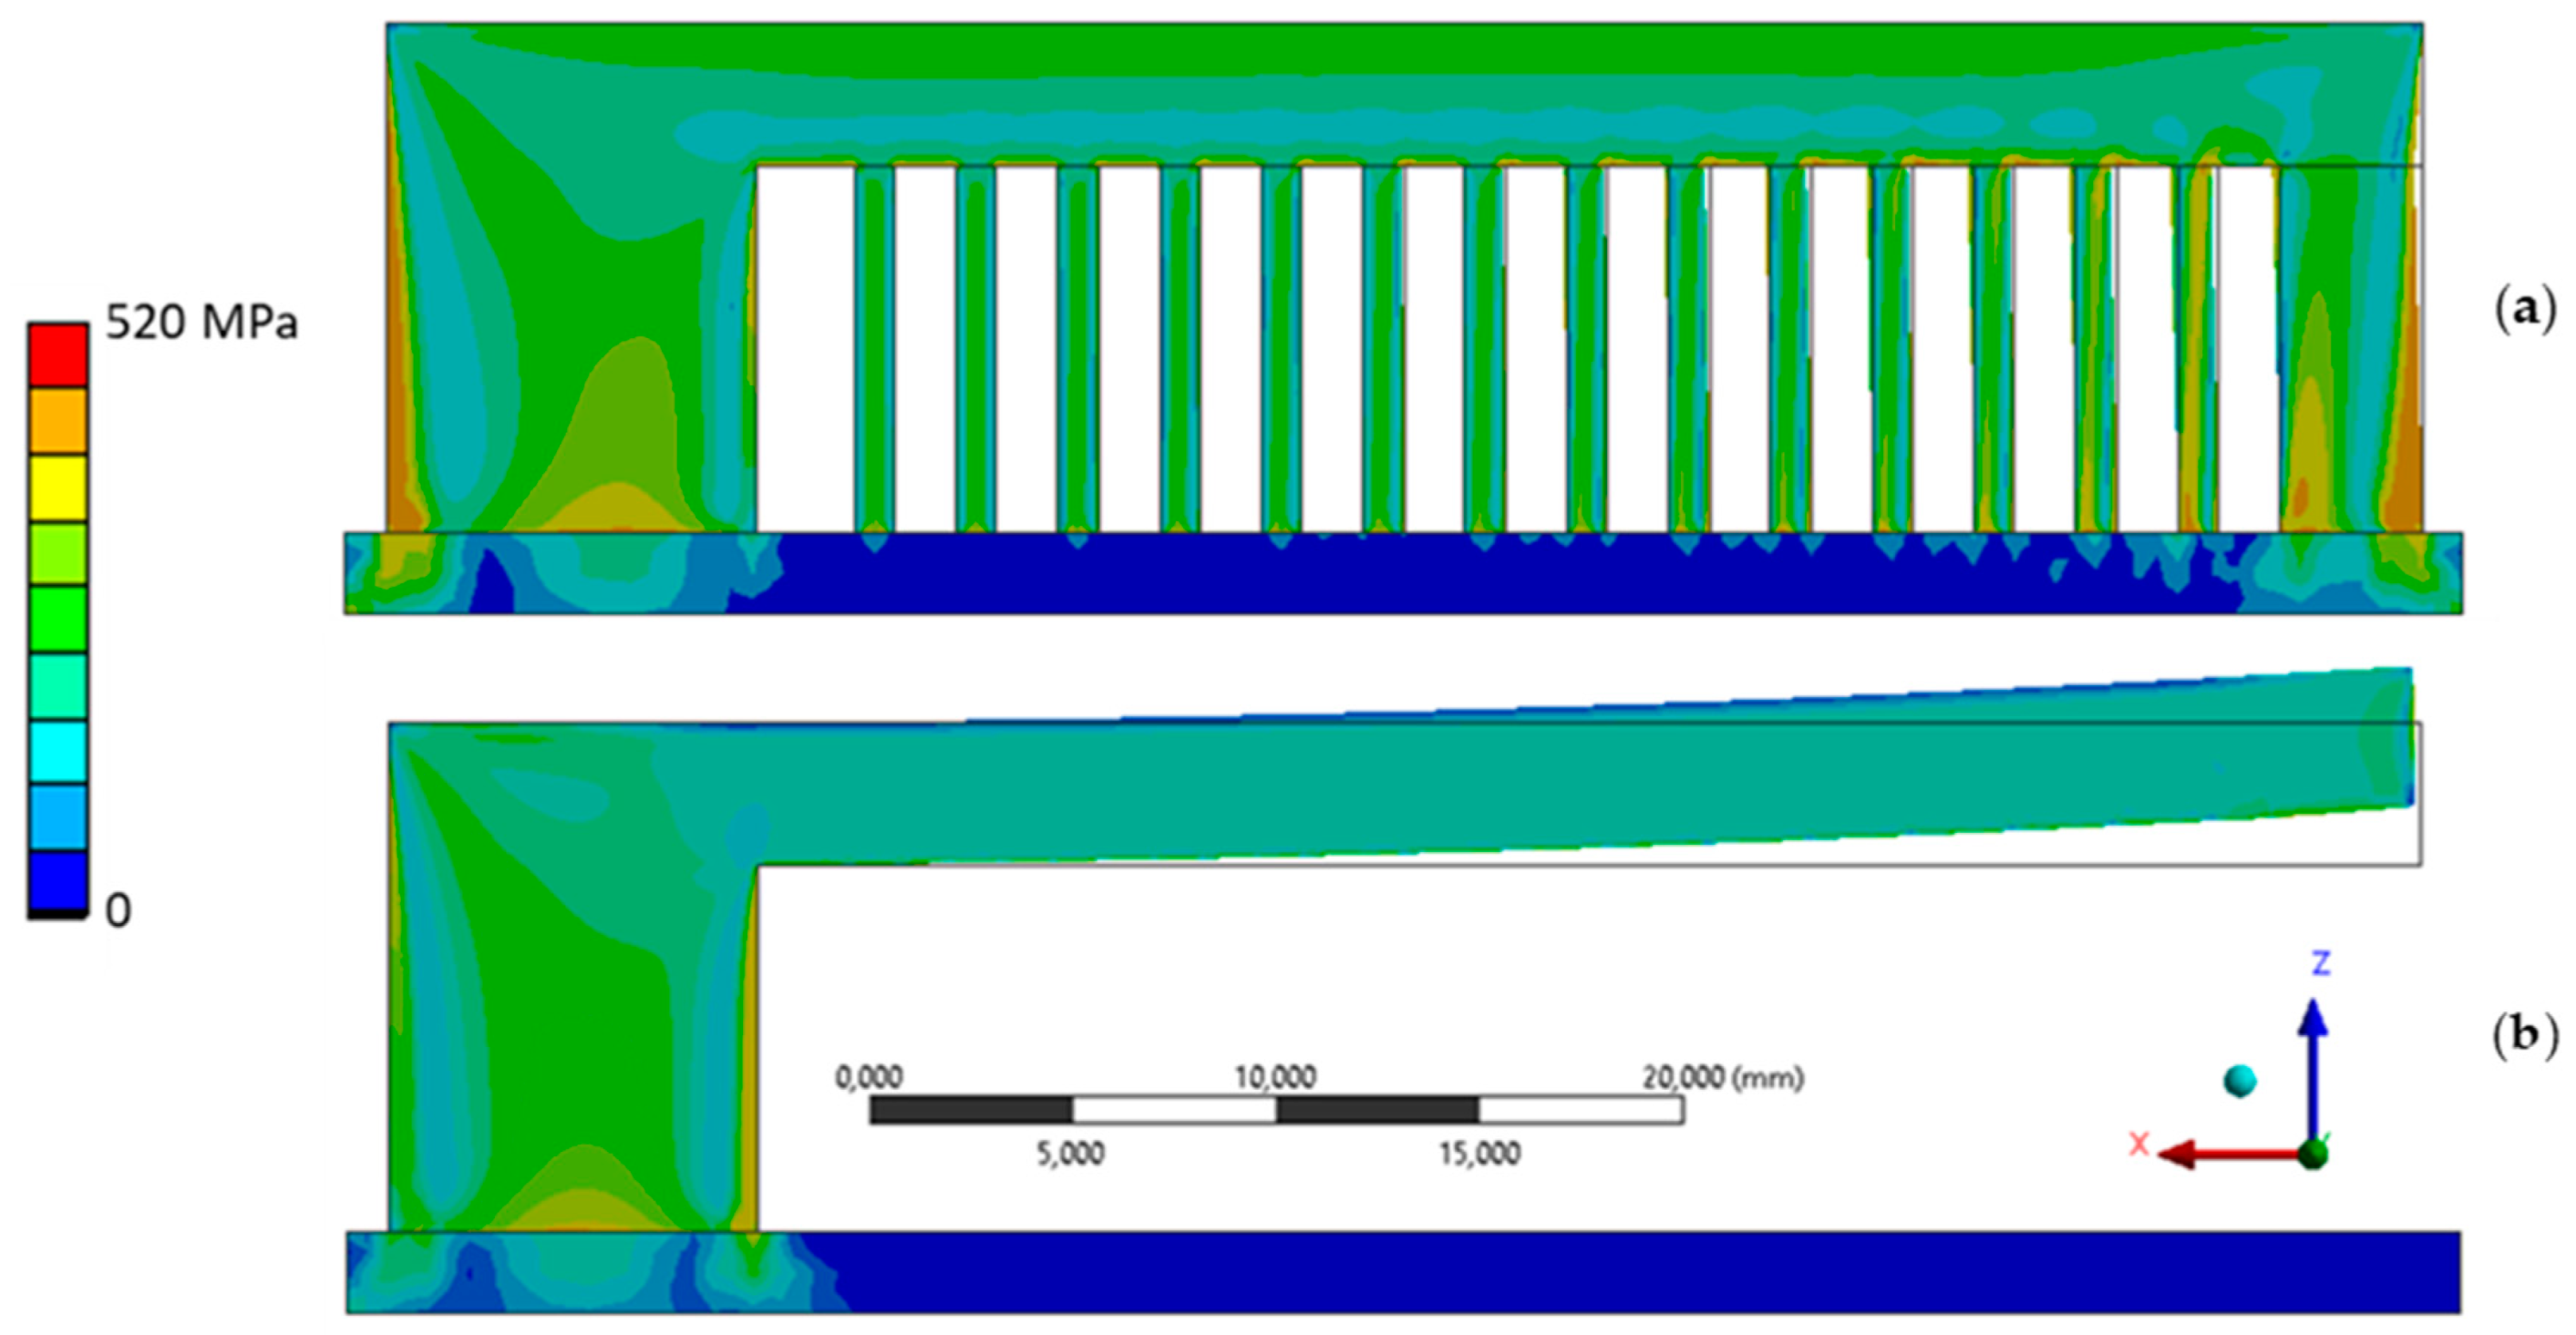
- A simulation model was developed and validated for predicting deformations and residual stresses in Ansys. For this purpose, thermal and mechanical calculations were coupled, and some simplifications were introduced to achieve an acceptable compromise between computation time and imaging accuracy. A calibration factor had to be used to adjust the simulation because the deformations calculated in the thermal–mechanical approach were too large. The necessity of a calibration factor is assumed to be the limitations of the material and simulation model. On the one hand, the material parameters, which were not entirely defined via the process temperature, led to deviations between the simulation and reality. In addition, the method used to describe the relationship between stress and strain offered only a low mapping accuracy beyond the elastic range. This was considered acceptable as only small stresses were expected. Partially high-stress peaks up to 500 MPa were due to singularities in the transition area between base plate and component. No adjustment was made, as these were clearly identifiable and occurred in a non-critical range. Finally, the simplifications in the simulation model led to deviations. However, since the losses could be compensated by introducing a correction factor, leading to a significant time saving, the method was evaluated positively. However, the determined correction value was only valid for the material used; the correction factor is not valid with the used material. The measurement of residual stresses seemed to show outliers. Due to the production and measurement wall, no additional measurements could be carried out. Alternatives to the measurement carried out should be examined, and, if necessary, semi-destructive methods should be used [32,33].
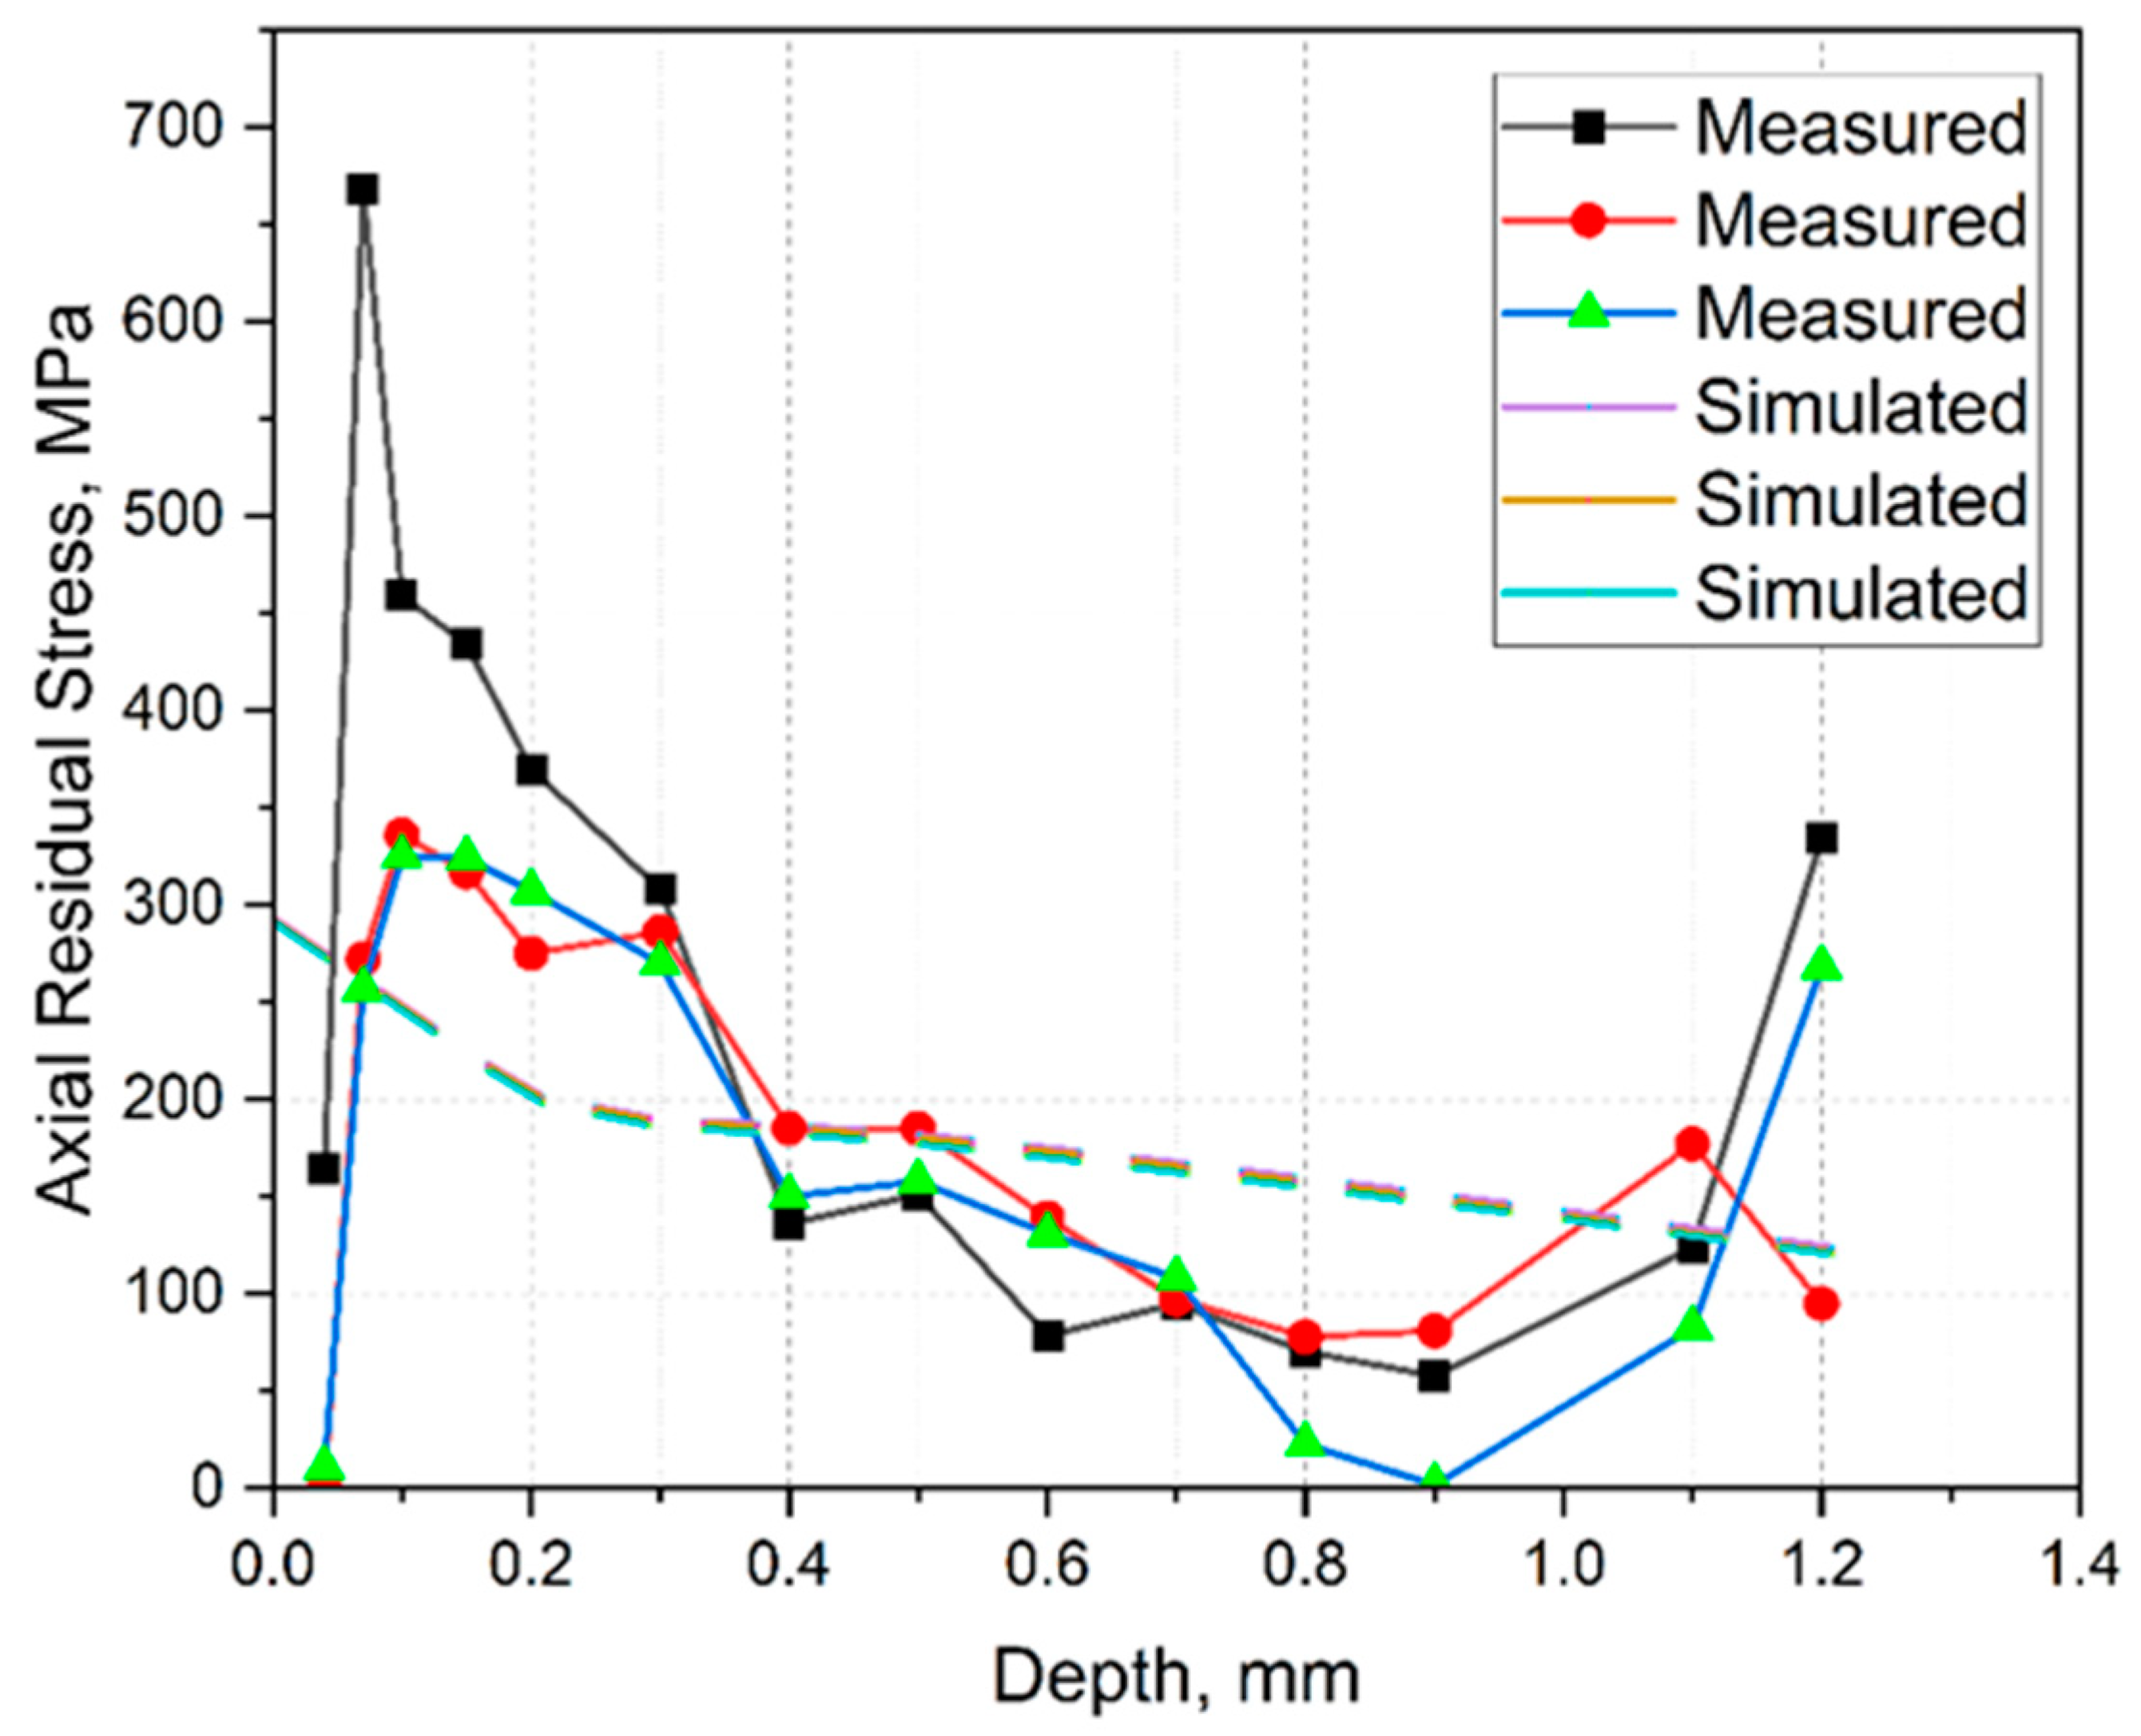
- The simulated residual stresses showed a comparable intensity and course compared with the measured ones. However, a deviation could be observed on the surface due to the inability of the hole drilling technique in measuring fine gradation on the surface.
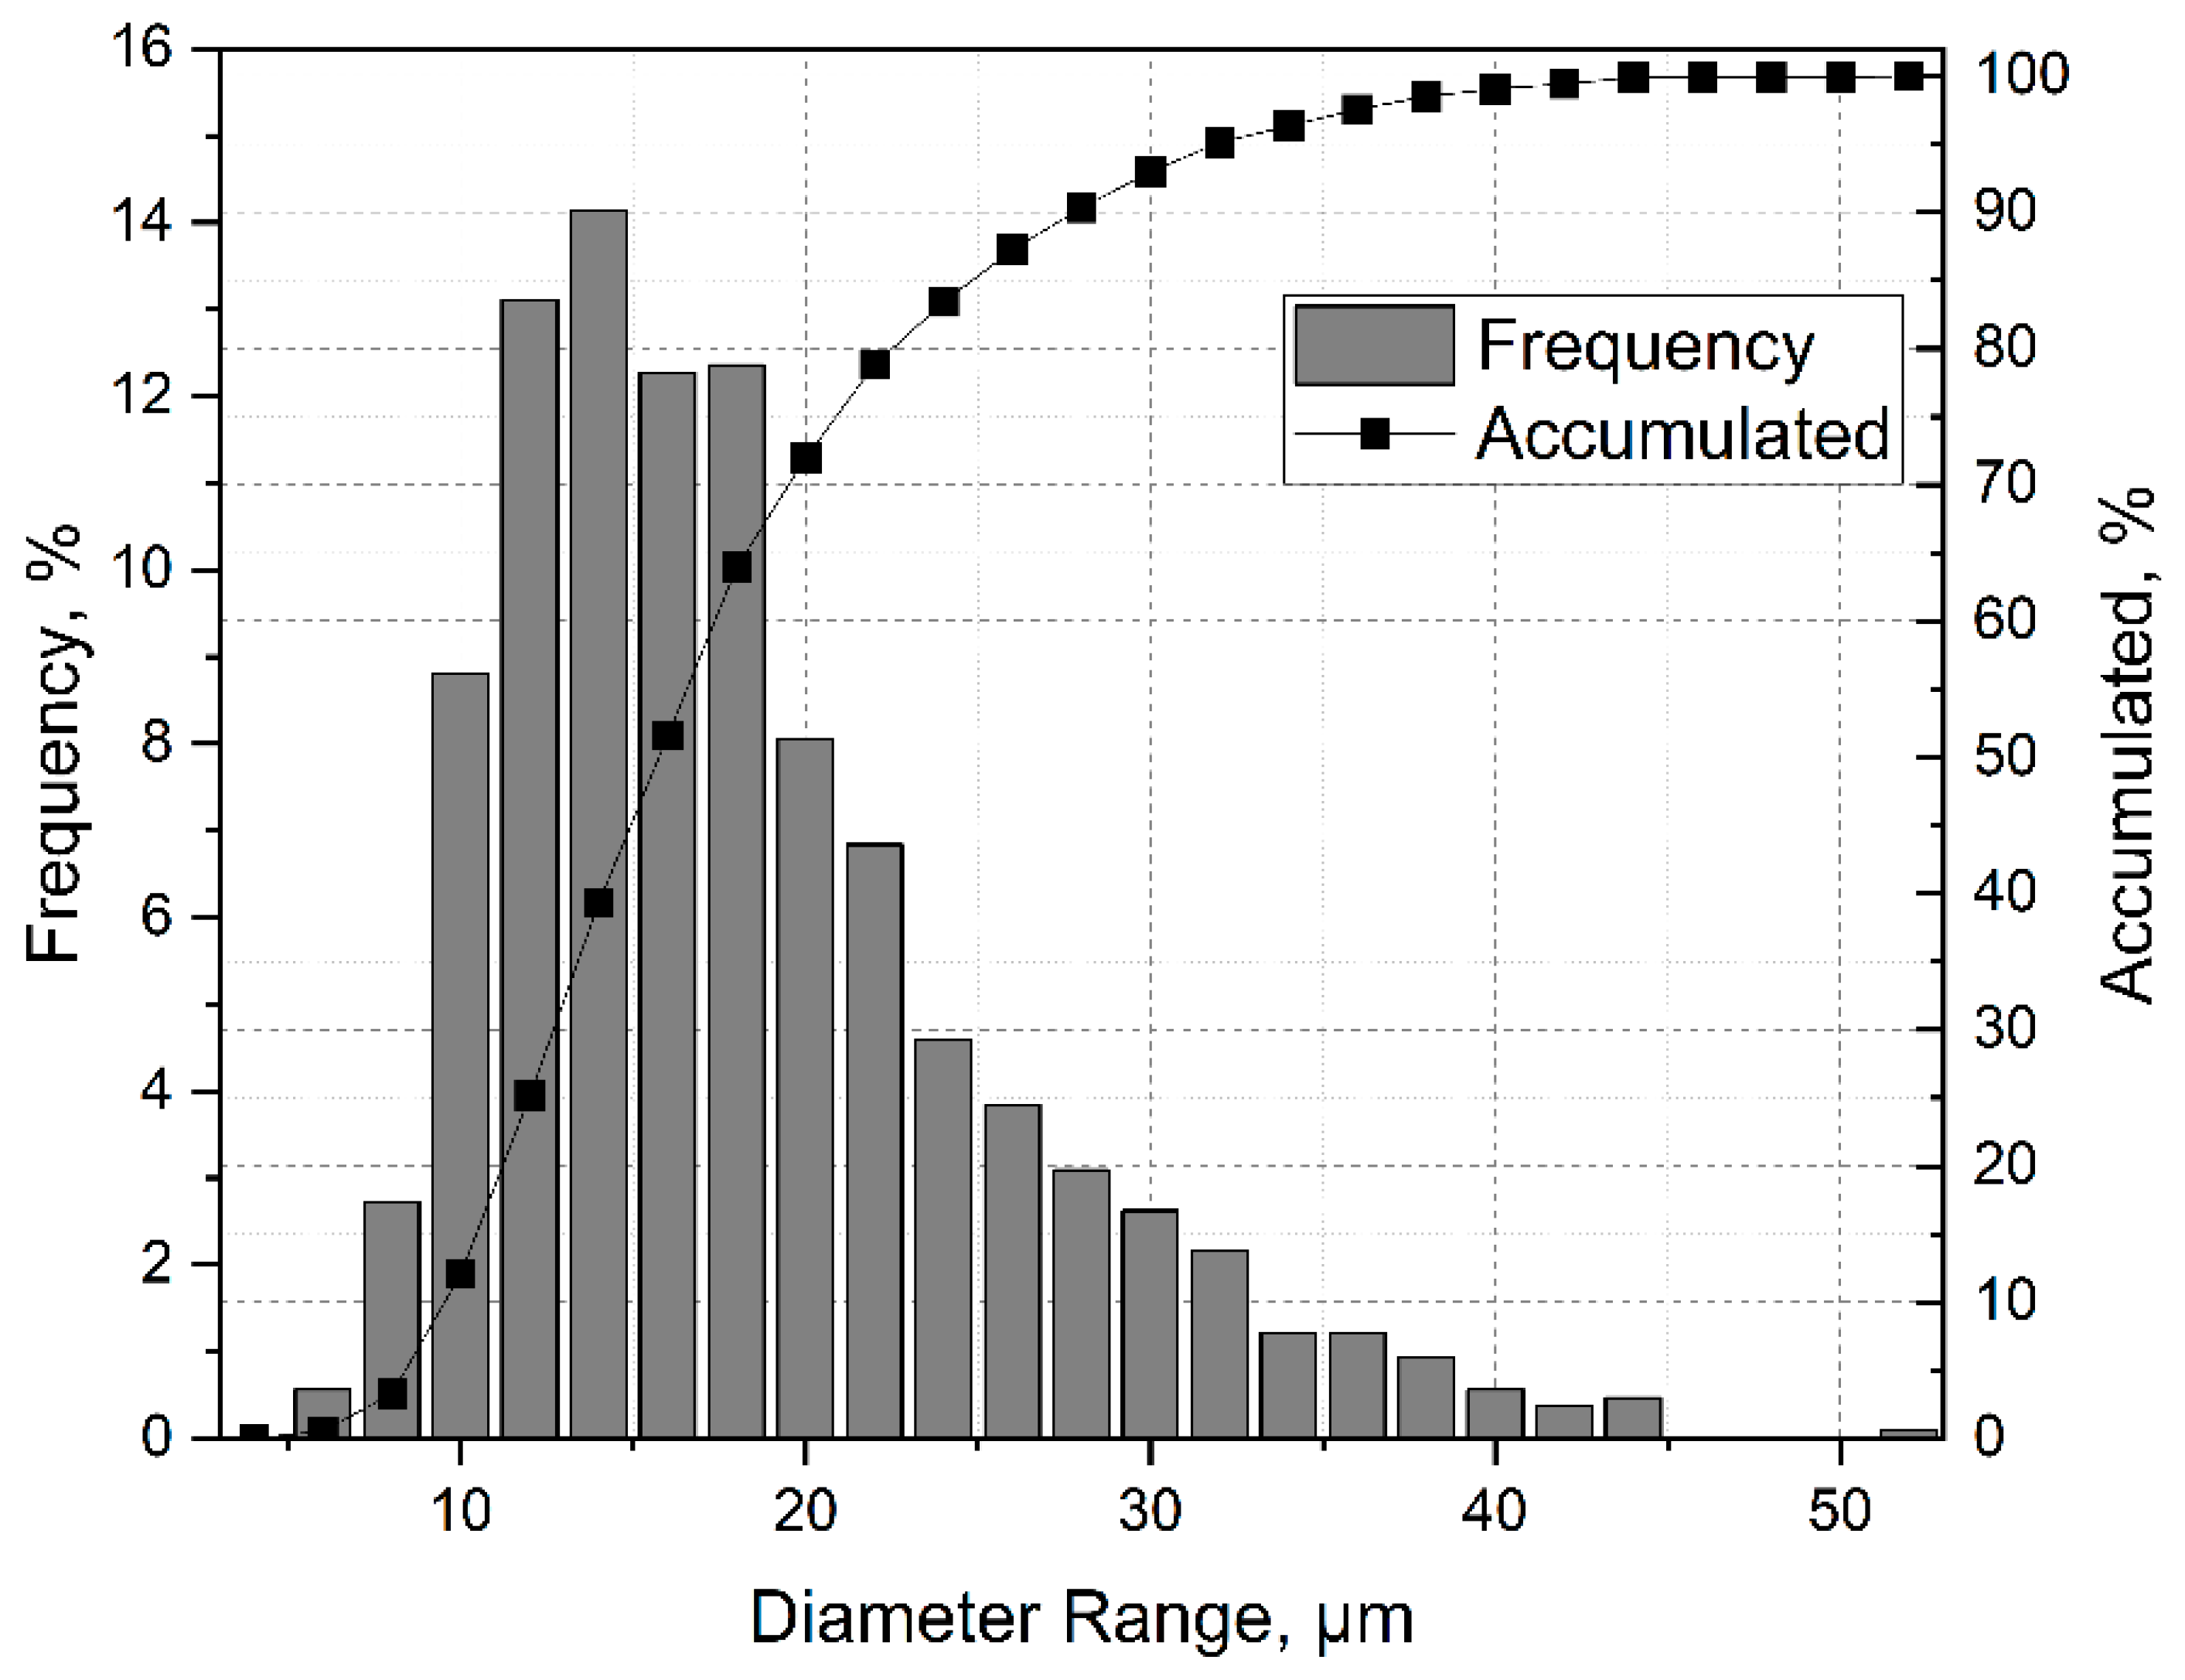
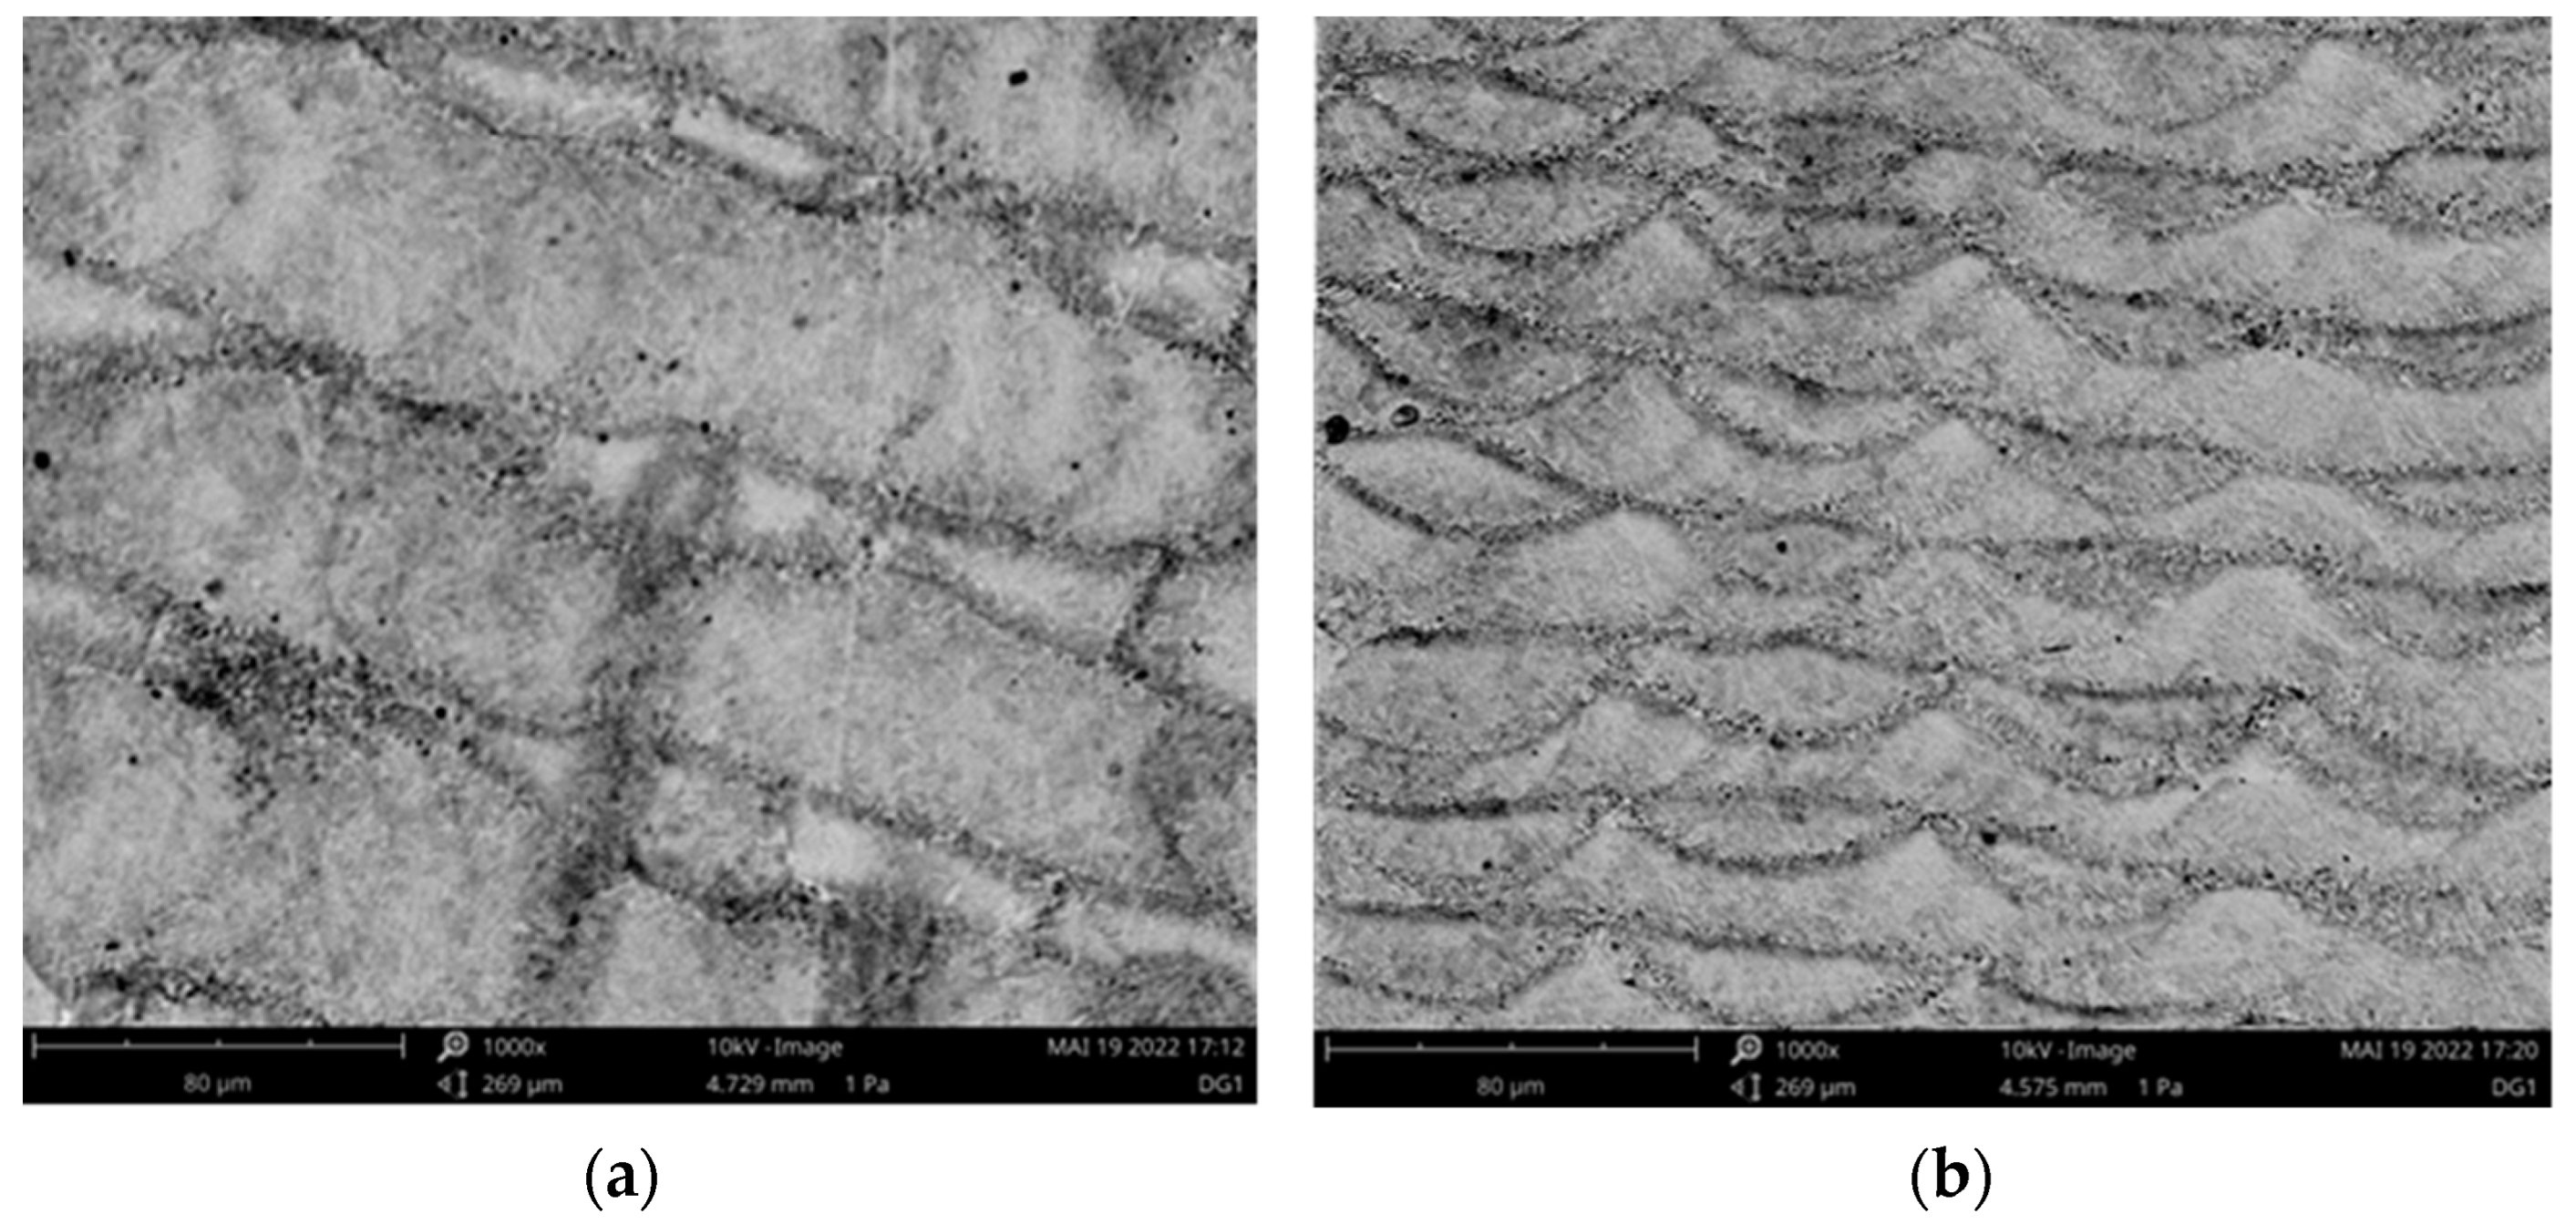
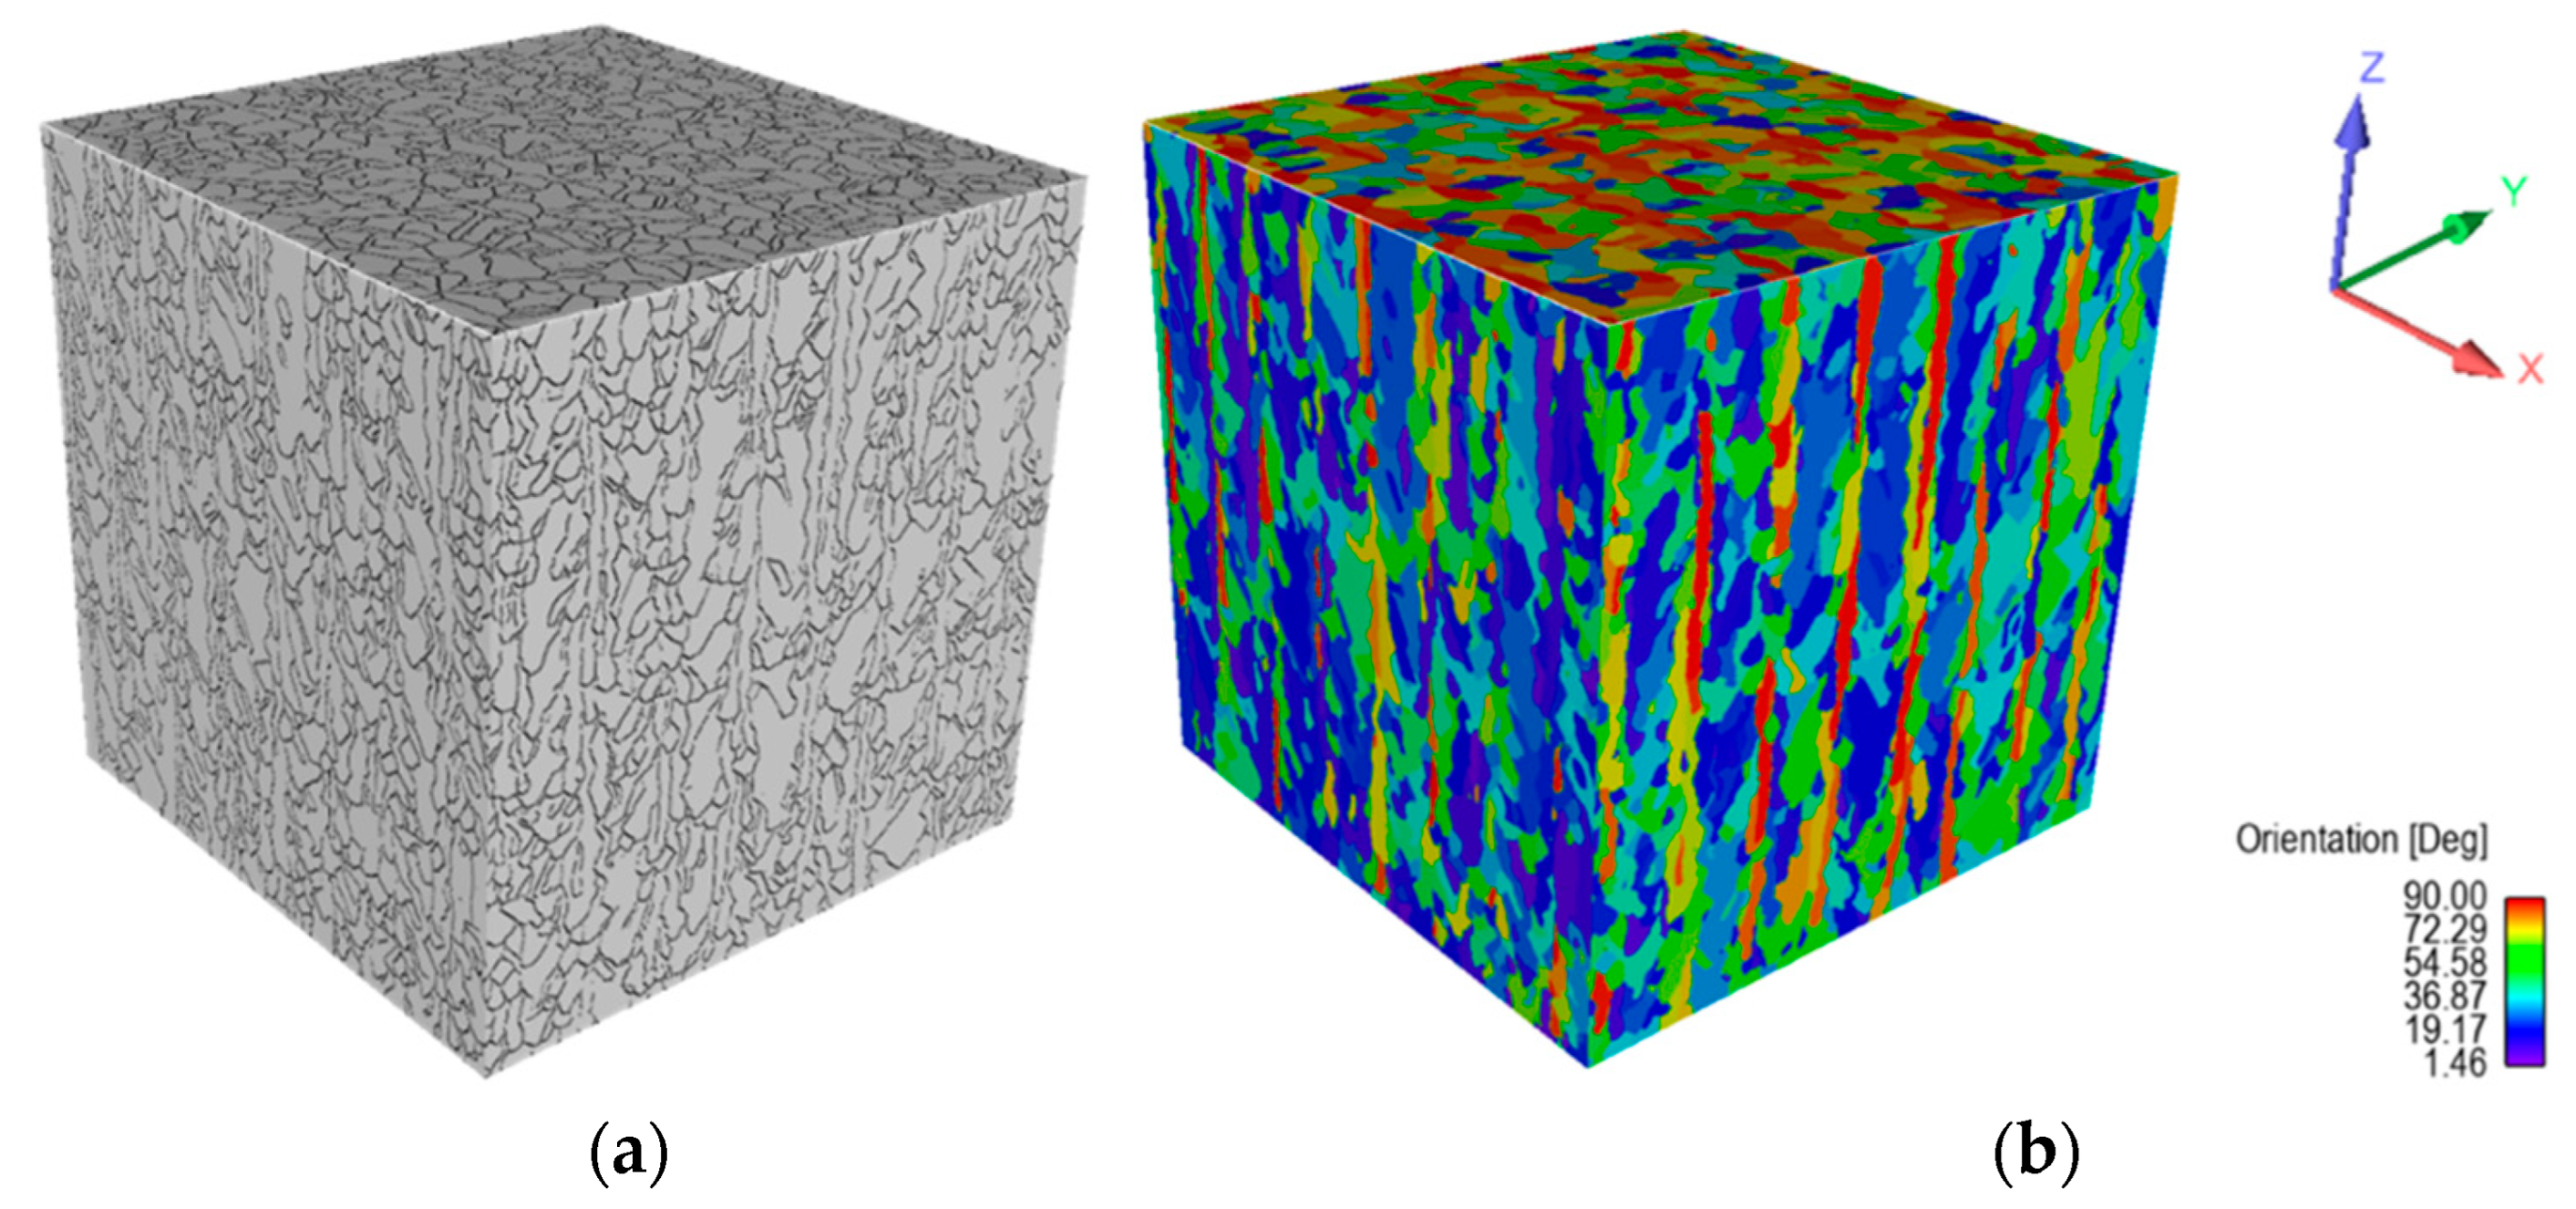
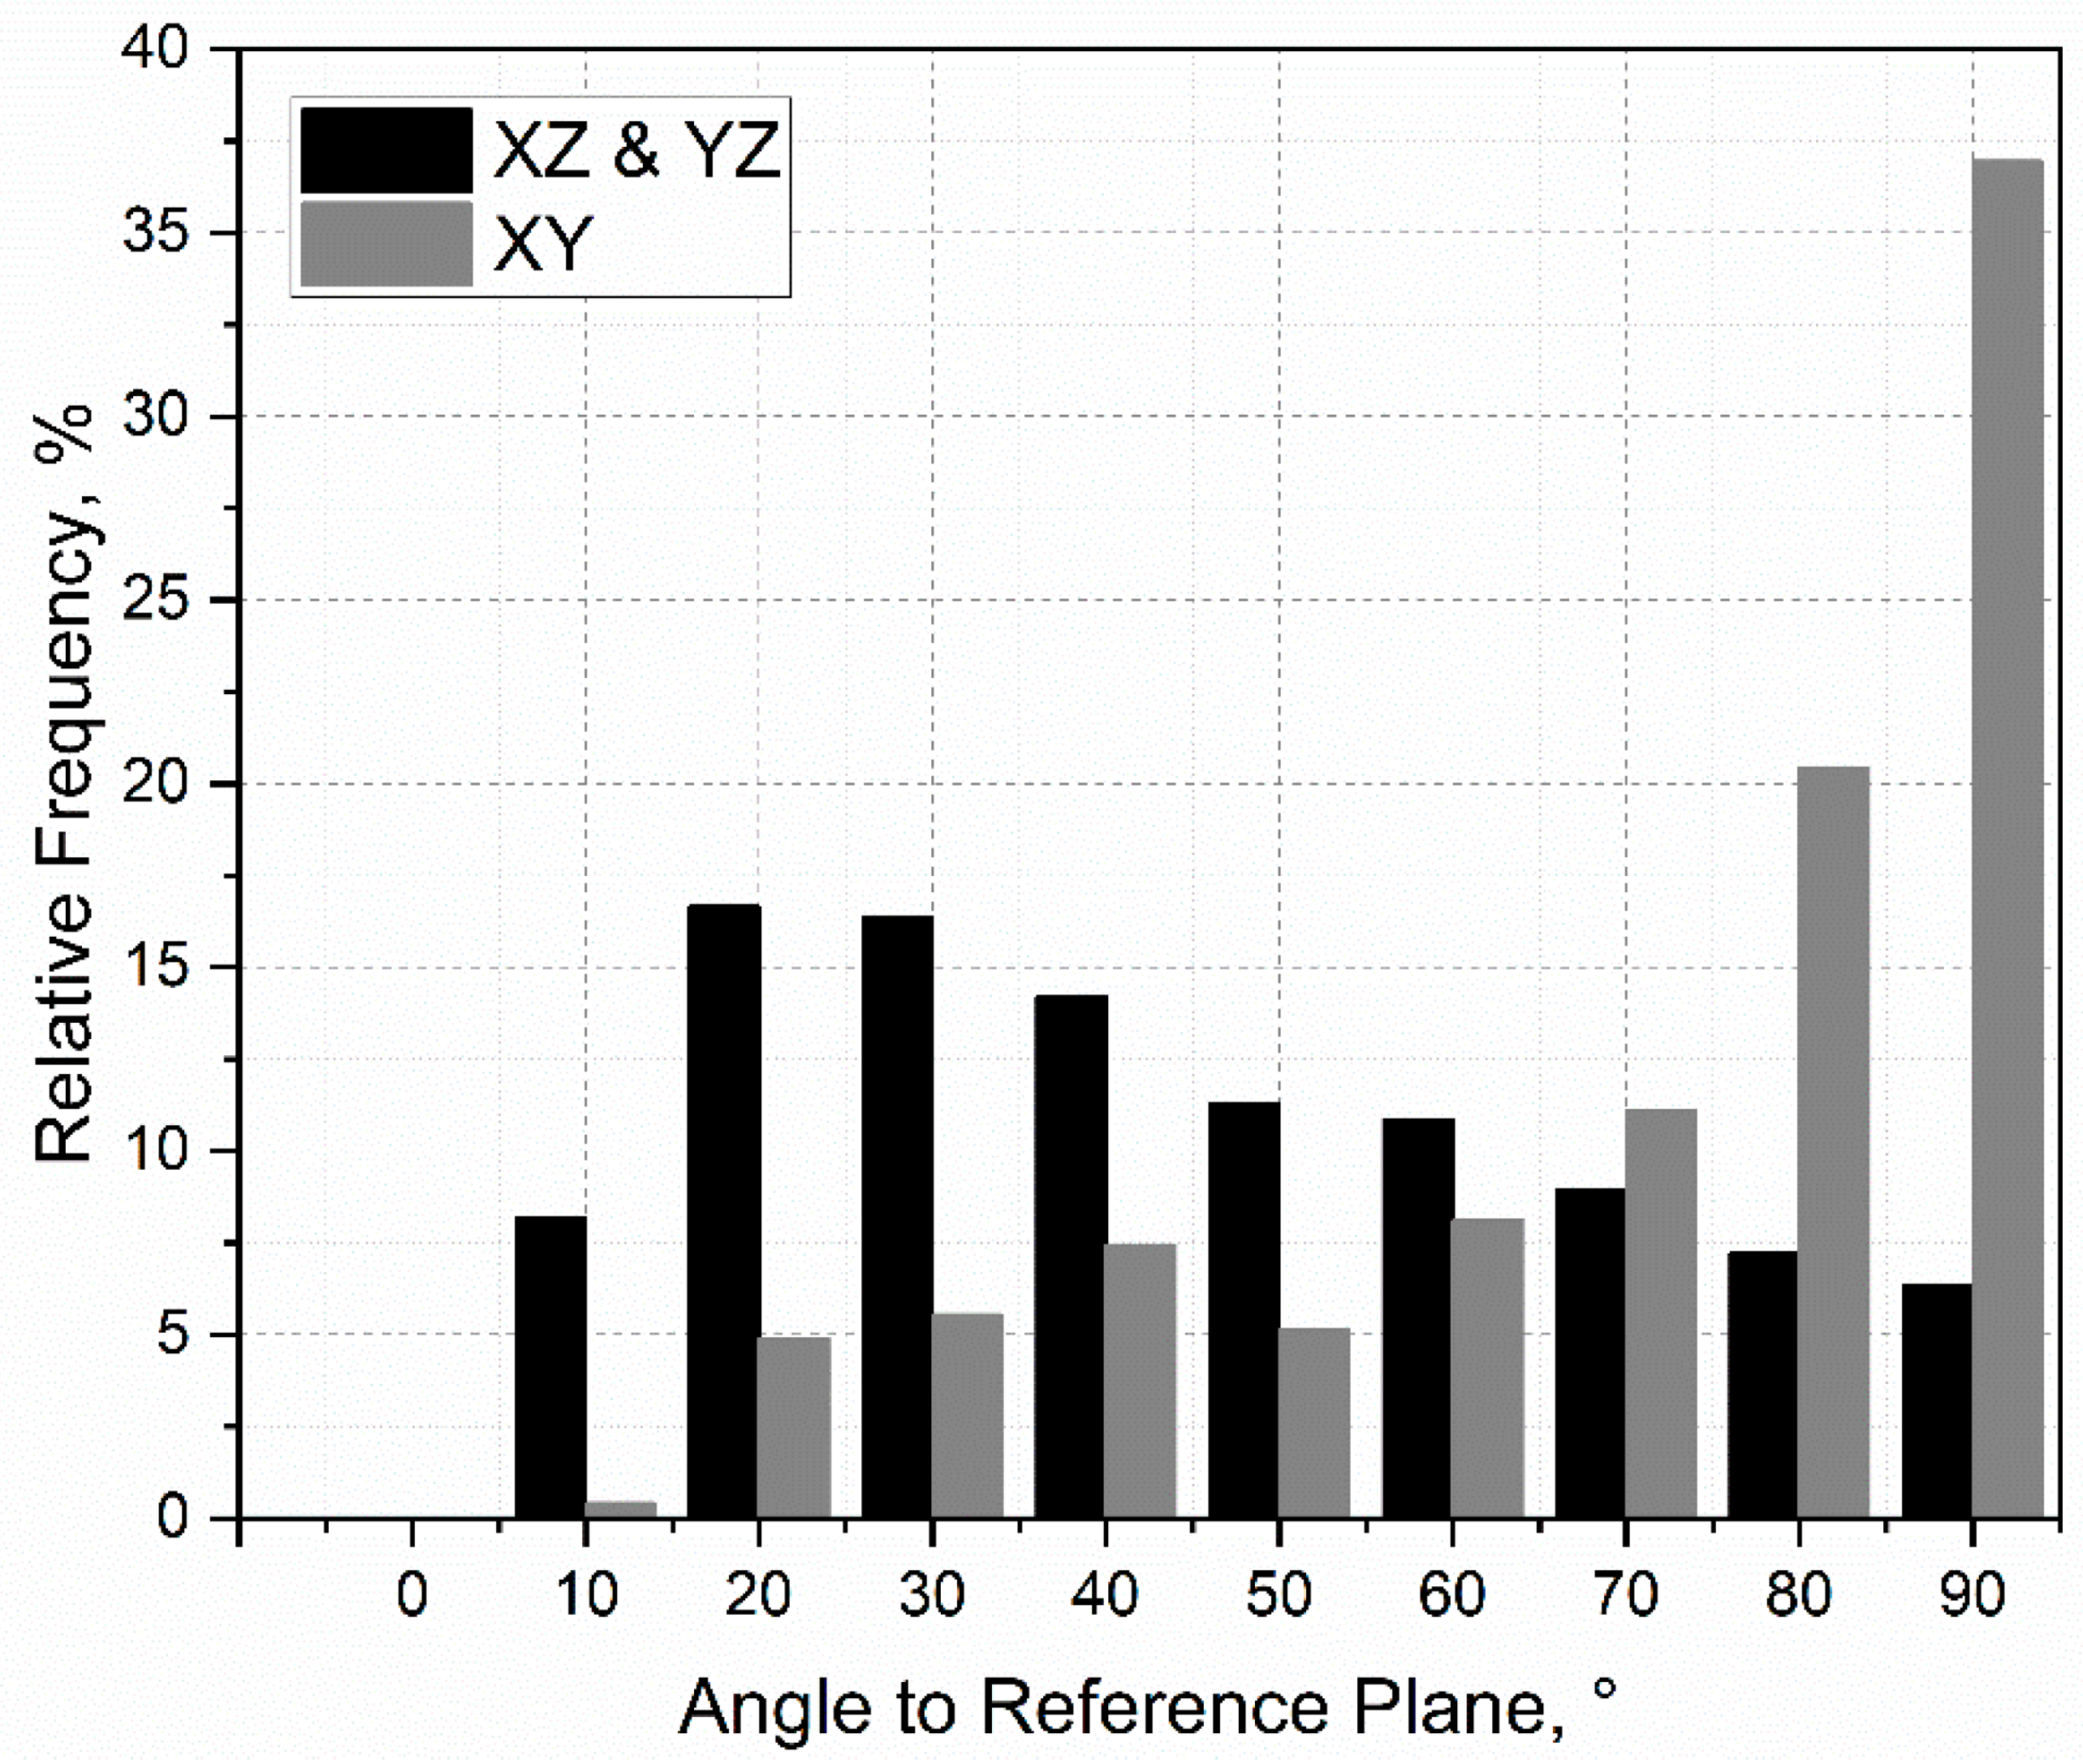
- In a further simulation, the microstructure of the SLM-produced CuSn10 material was modeled. It was possible to simulate the microstructure with relatively small grains (average circle-equivalent diameter of 19 ± 11 μm) in a clear preferential direction. The calculated microstructure corresponds to the expectations and is plausible but could not be validated. The software developed by Ansys only offers a limited range of setting options, which is why an alternative will be used in the long term.
Author Contributions
Funding
Institutional Review Board Statement
Informed Consent Statement
Conflicts of Interest
References
- VDI-Gesellschaft Produktion und Logistik (GPL). VDI 3405: Additive Fertigungsverfahren—Grundlagen, Begriffe, Verfahrensbeschreibung; Verein Deutscher Ingenieure e.V: Düsseldorf, Germany, 2014. [Google Scholar]
- Nakano, T. Selective Laser Melting in Multi-Dimensional Additive Manufacturing; Springer: Singapore, 2021; pp. 3–26. [Google Scholar] [CrossRef]
- Kremer, R. Einflussuntersuchung der Prozessparameter Hinsichtlich der Werkstoff-Und Oberflächeneigenschaften Beim Selektiven Laserschmelzen Mit 1.4404 Pulver. Bachelor’s Thesis, Fachhochschule Dortmund, Dortmund, Germany, 2018. [Google Scholar]
- Seifi, M.; Salem, A.; Beuth, J.; Harrysson, O.; Lewandowski, J.J. Overview of Materials Qualification Needs for Metal Additive Manufacturing. JOM 2016, 68, 747–764. [Google Scholar] [CrossRef] [Green Version]
- Lachmayer, R.; Lippert, R.B. Additive Manufacturing Quantifiziert; Springer: Berlin/Heidelberg, Germany, 2017. [Google Scholar]
- Mercelis, P.; Kruth, J.-P. Residual stresses in selective laser sintering and selective laser melting. Rapid Prototyp. J. 2006, 12, 254–265. [Google Scholar] [CrossRef]
- Körner, C.; Bauereiß, A.; Attar, E. Fundamental consolidation mechanisms during selective beam melting of powders. Model. Simul. Mater. Sci. Eng. 2013, 21, 85011. [Google Scholar] [CrossRef] [Green Version]
- Kok, Y.; Tan, X.; Wang, P.; Nai, M.; Loh, N.; Liu, E.; Tor, S.B. Anisotropy and heterogeneity of microstructure and mechanical properties in metal additive manufacturing: A critical review. Mater. Des. 2018, 139, 565–586. [Google Scholar] [CrossRef]
- Oluwajobi, A.O.; Adebowale, I.I. The Finite Element Modelling of Selective Laser Melting of Metals. Model. Addit. Manuf. Processes 2019, 9, 12–181. [Google Scholar]
- Foadian, F.; Carradó, A.; Pirling, T.; Palkowski, H. Residual stresses evolution in Cu tubes, cold drawn with tilted dies—Neutron diffraction measurements and finite element simulation. Mater. Des. 2016, 107, 163–170. [Google Scholar] [CrossRef]
- Foadian, F. Precision Tube Production Influencing the Eccentricity, Residual Stresses and Texture Developments: Experiments and Multiscale Simulation. Ph.D. Thesis, Technische Universität Clausthal, Clausthal-Zellerfeld, Germany, 2018. [Google Scholar]
- Condruz, M.R.; Matache, G.; Paraschiv, A.; Frigioescu, T.F.; Badea, T. Microstructural and Tensile Properties Anisotropy of Selective Laser Melting Manufactured IN 625. Materials 2020, 13, 4829. [Google Scholar] [CrossRef] [PubMed]
- Cui, W.; Yang, Y.; Di, L.; Dababneh, F. Additive manufacturing-enabled supply chain: Modeling and case studies on local, integrated production-inventory-transportation structure. Addit. Manuf. 2021, 48, 102471. [Google Scholar] [CrossRef]
- Lachmayer, R.; Lippert, R.B. Entwicklungsmethodik für Die Additive Fertigung; Springer: Berlin/Heidelberg, Germany, 2020. [Google Scholar]
- Siewert, M.; Neugebauer, F.; Epp, J.; LoShikhin, V.P. Validation of Mechanical Layer Equivalent Method for simulation of residual stresses in additive manufactured components. Comput. Math. Appl. 2019, 78, 2407–2416. [Google Scholar] [CrossRef]
- Simulation für Die Additive Fertigung; Ansys/CADFEM: Canonsburg, PA, USA, 2022.
- Additive Manufacturing Simulation Tools in Education. In Proceedings of the 2018 World Engineering Education Forum—Global Engineering Deans Council (WEEF-GEDC), Albuquerque, NM, USA, 12–16 November 2018; IEEE: Piscataway, NJ, USA, 2019.
- Deng, C.; Kang, J.; Feng, T.; Feng, Y.; Wang, X.; Wu, P. Study on the Selective Laser Melting of CuSn10 Powder. Materials 2018, 11, 614. [Google Scholar] [CrossRef] [PubMed] [Green Version]
- Akram, J.; Chalavadi, P.; Pal, D.; Stucker, B. Understanding grain evolution in additive manufacturing through modeling. Addit. Manuf. 2018, 21, 255–268. [Google Scholar] [CrossRef]
- Keller, N. Verzugsminimierung Bei Selektiven Laserschmelzverfahren Durch Multi-Skalen-Simulation. Ph.D. Thesis, Universität Bremen, Bremen, Germany, 2016. [Google Scholar]
- Schober, A. Eine Methode Zur Wärmequellenkalibrierung in der Schweißstruktursimulation; Utzverlag: München, Germany, 2014. [Google Scholar]
- Maiwald, D.; Stelzer, S.; Hoffmann, S. Laserstrahlschmelzen-Experimentelle Untersuchungen und Validierung einer Simulationsbasierten Prozesskette. In Proceedings of the 37 CADFEM ANSYS Simulation Conference, Kassel, Germany, 14–16 October 2019. [Google Scholar]
- Kochmann, D.M.; Amelang, J.S. The Quasicontinuum Method: Theory and Applications; Weinberger, C.R., Tucker, G.J., Eds.; Springer International Publishing: Cham, Switzerland, 2016; pp. 159–193. [Google Scholar]
- Foadian, F.; Carradó, A.; Brokmeier, H.G.; Palkowski, H. Integrated computational material engineering model development for tube drawing process. Procedia Manuf. 2018, 15, 287–293. [Google Scholar] [CrossRef]
- Foadian, F.; Khani, S.; Carradó, A.; Brokmeier, H.G.; Palkowski, H. Multiscale Simulation Study on the Anisotropic Behavior of Seamless Copper Tubes Processed under Varied Conditions. J. Manuf. Processes 2020, 56, 258–270. [Google Scholar] [CrossRef]
- Kupfer-Zinn-Knetlegierungen (Zinnbronzen); Deutsches Kupferinstitut: Duesseldorf, Germany, 2019.
- Branner, G. Modellierung Transienter Effekte in der Struktursimulation von Schichtbauverfahren; Technischen Universität München: München, Germany, 2011. [Google Scholar]
- Additive Manufacturing 2021 R2 User´s Guide; Ansys, Inc.: Canonsburg, PA, USA, 2022.
- Ding, R.; Guo, Z.X. Microstructural modelling of dynamic recrystallisation using an extended cellular automaton approach. Comput. Mater. Sci. 2002, 23, 209–218. [Google Scholar] [CrossRef]
- Nastac, L. Numerical modeling of solidification morphologies and segregation patterns in cast dendritic alloys. Acta Mater. 1999, 47, 4253–4262. [Google Scholar] [CrossRef]
- Technisches Datenblatt Brz10: Metallpulver für das laserbasierte Pulverbettverfahren; M4P Material Solutions GmbH: Magdeburg, Germany, 2019.
- Taraphdar, P.K.; Thakare, J.G.; Pandey, C.; Mahapatra, M.M. Novel residual stress measurement technique to evaluate through thickness residual stress fields. Mater. Lett. 2020, 277, 128347. [Google Scholar] [CrossRef]
- Giri, A.; Pandey, C.; Mahapatra, M.M.; Sharma, K.; Singh, P.K. On the estimation of error in measuring the residual stress by strain gauge rosette. Measurement 2015, 65, 41–49. [Google Scholar] [CrossRef]


| Parameter | Numerical Value | Unit |
|---|---|---|
| Laser power | 95 | W |
| Scan speed | 324 | mm/s |
| Hatching | 0.065 | mm |
| Layer thickness | 0.02 | mm |
| Inert gas | Nitrogen |
| Parameter | Numerical Value and Unit | Temperature (°C) | Reference |
|---|---|---|---|
| Density | 8.76 g/cm³ | 20 | Measured |
| Coefficient of thermal expansion | 0.0000193 1/K | 20 | [26] |
| Liquidus temperature | 1020 °C | - | [26] |
| Yield strength | 420 MPa | 20 | Measured |
| Modulus of elasticity | 102 GPa | 20 | |
| 100 GPa | 100 | ||
| 96 GPa | 200 | [26] | |
| 92 GPa | 300 | ||
| 87 GPa | 400 | ||
| Coefficient of thermal conductivity | 59 W/(m × K) | 20 | |
| 67 W/(m × K) | 100 | [26] | |
| 76 W/(m × K) | 200 | ||
| Specific heat capacity | 0.38 J/(g × K) | 20 | |
| 0.40 J/(g × K) | 800 | ||
| 1.00 J/(g × K) | 850 | [27] | |
| 1.65 J/(g × K) | 1000 | ||
| 0.40 J/(g × K) | 1020 |
| Parameter | Numerical Value | Unit | Reference |
|---|---|---|---|
| Coating time | 9.5 | s | Measured |
| Preheating temperature | 22 | °C | No preheating |
| Gas and powder temperature | 22 | °C | No preheating |
| Process temperature | 40 | °C | Adapted |
| Gas and powder convection coefficient | 0.00001 | W/(mm² × K) |
| Parameter | Numerical Value | Unit | Reference |
|---|---|---|---|
| Cooling rate | 308,100 | K/s | Simulated |
| Temperature gradient | 3,258,504 | K/m | Simulated |
| Melt track width | 0.083 | mm | Measured |
| Melt track depth | 0.03 | mm | Measured |
| Reference | Density (g/cm³) | Yield Strength (MPa) | Tensile Strength (MPa) | Elongation (%) | Hardness HV |
|---|---|---|---|---|---|
| Supplier [31] | - | - | 430 | 7 | 170 |
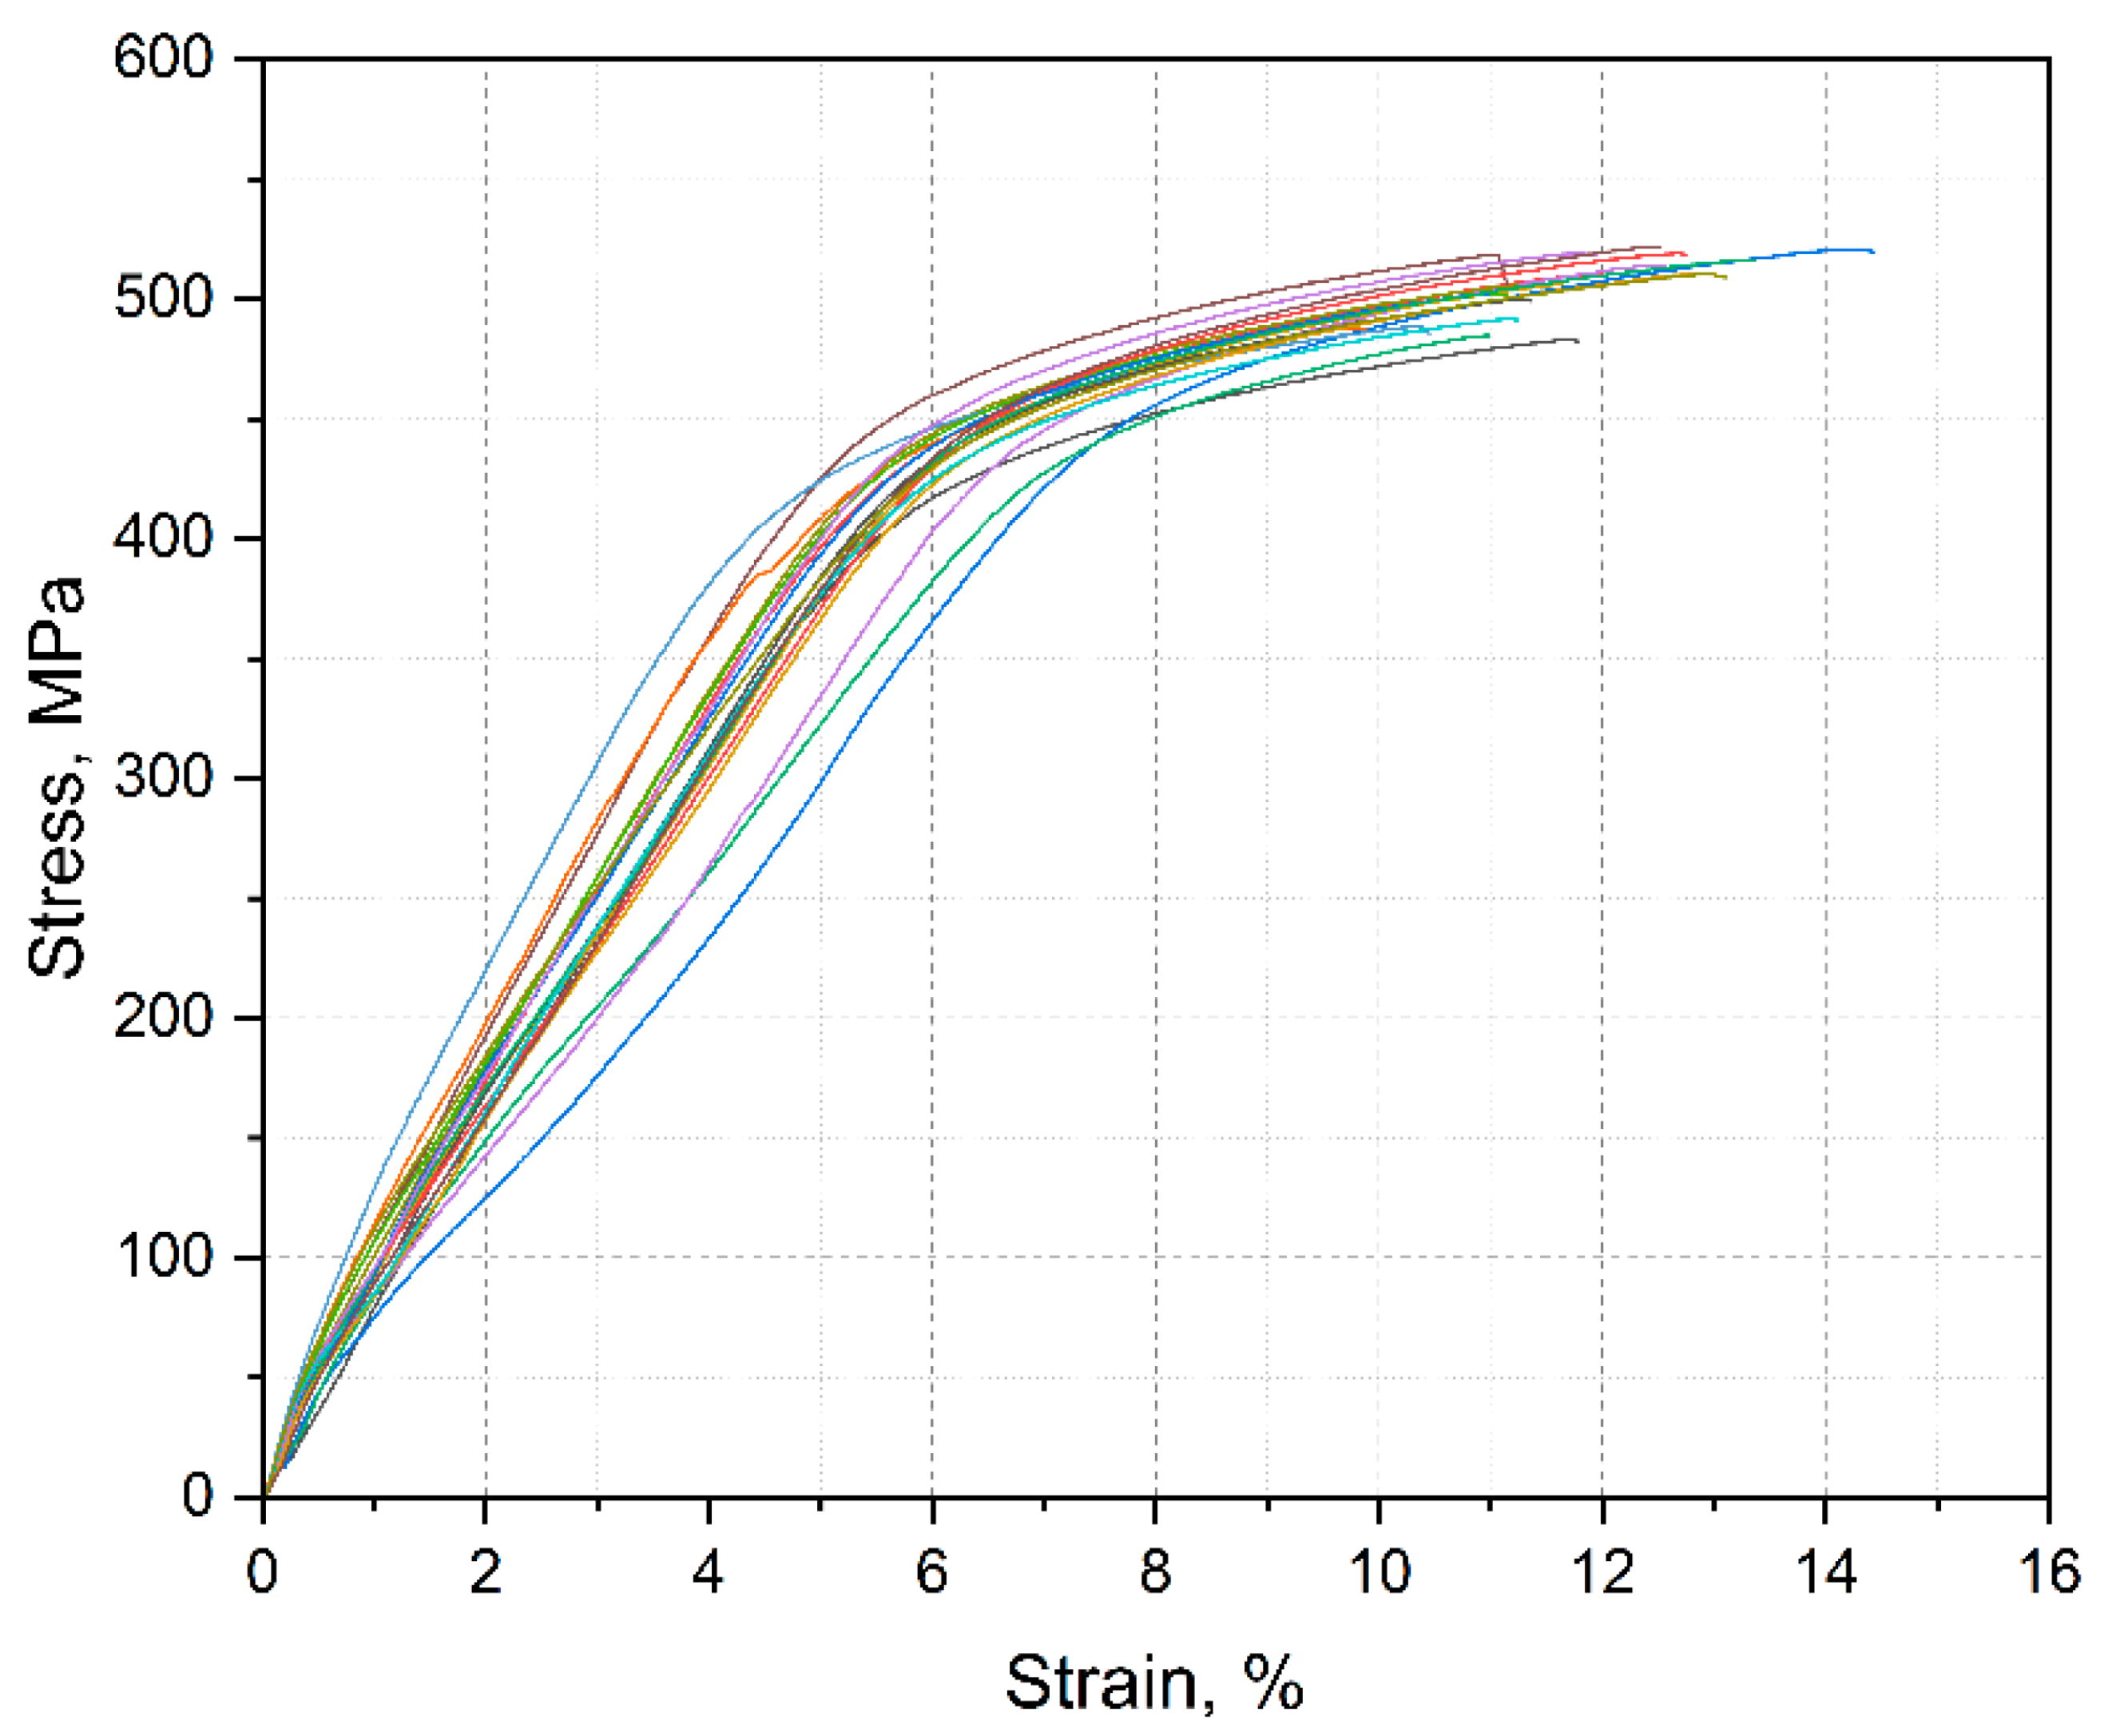
| Experiment | 8.76 | 420 ± 124 | 487 ± 12 | 5 ± 0.5 | 173 ± 3 |
Publisher’s Note: MDPI stays neutral with regard to jurisdictional claims in published maps and institutional affiliations. |
© 2022 by the authors. Licensee MDPI, Basel, Switzerland. This article is an open access article distributed under the terms and conditions of the Creative Commons Attribution (CC BY) license (https://creativecommons.org/licenses/by/4.0/).
Share and Cite
Kremer, R.; Khani, S.; Appel, T.; Palkowski, H.; Foadian, F. Selective Laser Melting of CuSn10: Simulation of Mechanical Properties, Microstructure, and Residual Stresses. Materials 2022, 15, 3902. https://0-doi-org.brum.beds.ac.uk/10.3390/ma15113902
Kremer R, Khani S, Appel T, Palkowski H, Foadian F. Selective Laser Melting of CuSn10: Simulation of Mechanical Properties, Microstructure, and Residual Stresses. Materials. 2022; 15(11):3902. https://0-doi-org.brum.beds.ac.uk/10.3390/ma15113902
Chicago/Turabian StyleKremer, Robert, Somayeh Khani, Tamara Appel, Heinz Palkowski, and Farzad Foadian. 2022. "Selective Laser Melting of CuSn10: Simulation of Mechanical Properties, Microstructure, and Residual Stresses" Materials 15, no. 11: 3902. https://0-doi-org.brum.beds.ac.uk/10.3390/ma15113902