Article

Water Splitting on Multifaceted SrTiO3 Nanocrystals: Calculations of Raman Vibrational Spectrum

by
Veera Krasnenko
1,
Leonid L. Rusevich
2,
Aleksander Platonenko
2,
Yuri A. Mastrikov
2,*,
Maksim Sokolov
2 and
Eugene A. Kotomin
2,3
1
Institute of Physics, University of Tartu, 50411 Tartu, Estonia
2
Institute of Solid State Physics, University of Latvia, LV-1586 Riga, Latvia
3
Max Planck Institute for Solid State Research, 70569 Stuttgart, Germany
*
Author to whom correspondence should be addressed.
Submission received: 10 May 2022 / Revised: 6 June 2022 / Accepted: 7 June 2022 / Published: 15 June 2022
(This article belongs to the Topic Surface Engineered Materials)

Abstract

:
Various photocatalysts are being currently studied with the aim of increasing the photocatalytic efficiency of water splitting for production of hydrogen as a fuel and oxygen as a medical gas. A noticeable increase of hydrogen production was found recently experimentally on the anisotropic faces (facets) of strontium titanate (SrTiO3, STO) nanoparticles. In order to identify optimal sites for water splitting, the first principles calculations of the Raman vibrational spectrum of the bulk and stepped (facet) surface of a thin STO film with adsorbed water derivatives were performed. According to our calculations, the Raman spectrum of a stepped STO surface differs from the bulk spectrum, which agrees with the experimental data. The characteristic vibrational frequencies for the chemisorption of water derivatives on the surface were identified. Moreover, it is also possible to distinguish between differently adsorbed hydrogen atoms of a split water molecule. Our approach helps to select the most efficient (size and shape) perovskite nanoparticles for efficient hydrogen/oxygen photocatalytic production.

1. Introduction

Thanks to the progress in the new materials development and understanding the dominating factors in the photochemical processes, great advancement has recently been made in the photocatalytic activity of various materials in visible light (e.g., [1]). Despite great achievements, many problems remain yet unsolved. For example, the efficient separation of photogenerated charges as well as catalytic reduction and oxidation sites on semiconductor-based photocatalysts remains one of the challenging issues in photocatalytic water splitting [2,3,4,5,6]. It can be noted that a low charge recombination rate is one of the key properties of a high-performance water splitting material. There are conflicting opinions about effect of nanoparticle size. For example, according to Townsend et al., the overall photocatalytic water splitting reaction is less effective at the nanoscale STO (with co-catalyst) particles due to increase of the water oxidation overpotential for the small particles (<30 nm) and a decrease in light absorption (due to a quantum size effect) [7]. However, Nuraje et al. consider that virus-templated STO nanowires have improved hydrogen evolution rate characteristics due to smaller particle size (∼5 nm in diameter) that provide a larger surface to volume ratio and the high crystallinity that prevents excited charge recombination at lattice defect sites [8]. The increase of the hydrogen production efficiency with STO facet nanoparticles was observed also by Mu [9] and Kržmanc [10]. As a result of recent developments in nanocrystal synthesis, materials with improved charge separation, achieved through heterojunction [10,11], mesocrystallinity [12], porosity [13] or exposed anisotropic facets [9,14,15,16,17]. The spatial separation of reduction and oxidation active sites can also become an effective method to reduce the recombination of photogenerated charge carriers that, in turn, can improve solar energy conversion efficiency (e.g., [18]).
According to recent developments, the photogenerated charge is shared between different facets of a semiconductor crystals with low symmetry [19,20]. Among other materials for water splitting, strontium titanate SrTiO3 (STO) is well known [15,18,21,22,23,24,25,26,27,28,29,30], where the processes of water adsorption and dissociation have been studied in detail [31,32,33]. Despite the fact that many semiconductor crystals are highly symmetric and have isotropic facets that are not suitable for charge separation between faces, it was found that the selective distribution on the anisotropic faces of 18-facet strontium titanate nanocrystals leads to a noticeable increase of apparent quantum efficiency [9]. Structurally, in 18-facet STO nanoparticles, the {0 0 1} facets coexist with the facets parallel to the {1 1 0} crystallographic plane. According to different models, an 18-facet nanoparticle is a natural platform for the efficient charge separation, whereas the reaction zone of the edges of a six-facet nanoparticle (which is a cube with the {0 0 1} faces) also differs from the {0 0 1} flat parts. A noticeable improvement of water splitting efficiency was also found experimentally on the anisotropic facets of STO nanocrystals. In the present study, we use an atomistic model of the {0 0 1} stepped surface, which is relevant to both six- as well as eighteen-facet STO nanoparticles. The challenging problem is identification of the most efficient facets and intermediate products of water splitting on nanoparticles which could be performed using the ESR (Electron Spin Resonance) and/or vibrational (Raman) spectroscopy [34,35].
To investigate the surface superstructure, direct observation of reproducible orbital selective tunneling on the STO (0 0 1) surface using scanning tunneling microscopy have been done by Song et al. [36]. In that observation, the electronic structures of the STO surface reversibly switched between different sets of symmetries depending on the bias of the sample. Such a switching was followed by a noticeable change in energy-dependent spectroscopy data. These observed experimental data were combined with density functional theory (DFT) calculations. As a result, it was clarified that symmetry breaking at the studied surface caused a crystal-splitting field of electron orbitals with strong in-plane anisotropy—this allowed the electrons alternately fill these orbitals during imaging with different biases. Therefore, understanding the atomic and orbital structure of the surfaces of complex oxides with broken symmetry is important to managing their functionality in new applications and opens up opportunities to explore novel physical and chemical properties.
Comparative ab initio calculations of HF and DFT using different exchange-correlation functionals and localized/plane wave basis showed the presence of crumpling and relative displacements of the second and third planes near the STO surface [37]. It was also found that structural transformations in low temperature tetragonal phase of STO associate with very tiny changes of the unit cell energy [37,38]. The group-theoretical analysis and first-principles hybrid DFT calculations have employed by Blokhin et al to prove the existence of a second-order anti-ferrodistortive phase transition in a defect-free ultrathin film of STO [39]. Low temperature structural transformations on the STO (0 0 1) surface of single crystals were studied theoretically and experimentally by Krainyukova et al [40], where structural anomalies were found depending on temperature. Obviously, the properties of the STO surface, including symmetry breaking, are also important for the study of effective water splitting.
Recent first principles study [41] of water splitting on stepped STO surface revealed very important results—three distinct adsorption regions of such the surface demonstrated very different catalytic activity. Thus, searching, validation and calculation of promising surfaces is a way to improve catalytic activity towards water splitting. In such a case, the calculations of Raman spectra of different anisotropic surfaces could help to distinguish the chemical adsorption of water derivatives on chosen surfaces and allow comparing calculated data with available experimental ones.
The calculation of Raman vibrational spectrum of chosen surface allows comparing the available experimental data of pure crystal and distinguishing the Raman frequencies, that are responsible for the specificity of the surface (size of the chosen nanostructure) as well as for chemical adsorption of water derivatives on surface. In order to estimate which Raman frequencies describe the stepped surface area, we performed a first-principles calculation of phonons and the Raman spectrum in the tetragonal phases of STO crystal and a thin film. As is well known, in the room temperature cubic phase of a perfect SrTiO3, no phonon modes are first-order Raman active and only a broad, multiphonon spectrum is observed [42]. However, the Raman peaks are still observed at room temperature due to lifting of inversion symmetry, caused by presence of defects, impurities or dopant ions, the grains or to the existence of strains (particularly in thin films). This is why in this study of water derivatives in SrTiO3 films we used SrTiO3 tetragonal phase.

2. Methods and Computational Details

The surface was designed and modeled as a thin STO film (slab) with steps, the slopes of which are parallel to {0 0 1} (see also ref. [41]). Although the surfaces {0 0 1} and {1 0 0} for a real strontium titanate material may not be equivalent depending on the temperature regime [43], such a distortion of the perovskite structure is irrelevant for the present study, and the surface orientations are given relative to the cubic phase. To cancel the dipole moment, the adsorbate was placed on both sides of the slab. Although the difference in the energies of the rhombohedral and tetragonal phases was insignificant, the bulk STO structure in the rhombohedral phase was taken as a matrix for the STO film with a stepped surface, since it turned out to be energetically more favorable. The difference in energy between distorted phases and cubic one is much larger than that between the different distorted phases. On such a stepped STO surface, there are three distinct areas of water adsorption—ridge, slope and gully (Figure 1). Among other areas of adsorption, the ridge one is of special interest because of oxygen vacancy formation upon water adsorption and their possible subsequent substitution/replacement by oxygen ions during the splitting of water molecules on this specific surface [41]. Thus, for the Raman calculations, a model with adsorbed derivatives of water on the ridge region of the STO stepped surface was chosen. To compare with the available experimental data and to estimate which Raman frequencies, describe the stepped surface area and adsorbates, we have also performed calculations of the Raman spectrum of the tetragonal phase of a bulk crystal.
Because of the stepped surface, oxygen atoms in the ridge region, participating in the creation of surface defects (oxygen vacancies), initially have only two bonds with the nearest titanium atoms (Figure A1, Appendix A). During the adsorption of a water molecule on a titanium atom at the surface, a redistribution of charge occurs between this titanium and the neighboring oxygen atoms of the STO surface, as well as between the atoms of the water molecule. In addition, there is a change in the charge of 4.3% of the strontium atoms closest to the created vacancy in comparison with the charges of strontium atoms in the slab without adsorbates. Charge redistribution leads to the breaking of the Ti-O bond with the simultaneous splitting of the water molecule. As the result, a second OH bond and an oxygen vacancy are formed on the STO film surface. Oxygen atoms “half detached” from the film surface form pure covalent bonds with titanium atoms, which are shorter and therefore more advantageous than Ti-O bonds in stepped STO film without adsorbates. Both water derivatives are adsorbed close enough to each other on the STO stepped surface, forming a small cluster of two OH groups supported by hydrogen bonding. Such a scenario (see also Figure A1) seems more plausible in comparison with the probability of the chemisorption of the hydrogen atom (H2) of the split water at a longer distance from the other part of the adsorbate (O-H1 group).
As the initial guess, the oxygen atom of the water molecule was placed in the immediate vicinity and directly atop the titanium atom in the region of the STO film ridge, and the O-H bonds of the water molecule were directed outward from the surface. The adsorbate concentration was one water molecule per 0.83 nm 2 of the STO stepped surface.
The calculations were performed using the plane waves-based first principles method as implemented in the CASTEP module [44] of the Materials Studio package. The local density approximation (LDA) with the Ceperley–Alder–Perdew–Zunger (CA-PZ) functional [45] (pseudopotentials: norm conserving) was applied due to the low computational cost and energy consumption. The plane-wave basis energy cutoff was chosen as 750 eV for the STO bulk (10 atoms) and film with stepped surface (104 atoms + 6 atoms of two water molecules) models (the calculation of STO thin film with a flat {0 0 1} surface (26 atoms) was also performed). The calculated lattice parameters were a = b = 5.410 Å, c = 7.710 Å, and a = 7.71 Å, b = 10.92 Å, c = 21.20 Å, α = β = γ = 90 ° for bulk STO tetragonal phase and thin film with stepped surface, respectively: taking into account that a typical feature of such kind of calculations is that the LDA data are slightly underestimated if compared with the experimental values, the optimized structural constants for bulk STO tetragonal phase are in good agreement with experimental ones ( a = b = 5.507 Å, c = 7.796 Å). The obtained angle of octahedral rotation is 2.03° that is very close to experimental value of 2.1° at 4.2 K [46]. Because the CASTEP calculations are periodic in all three directions, in order to exclude the interaction between the films in the calculations of the surface of STO thin films, a vacuum layer with thickness of 10 Å was used.
The Monkhorst–Pack scheme k-points grid sampling was set at 3 × 3 × 4 for the Brillouin zone for the bulk and 2 × 1 × 1 for the film model calculations. The convergence parameters were set as follows: total energy, 10 5 eV/atom; maximum force, 0.03 eV/Å; maximum stress 0.05 GPa; and maximum atomic displacement, 10 3 Å. The explicitly treated electronic configurations for the chemical elements forming the studied materials were as follows: 2 s 2 2 p 4 (O), 3 s 2 3 p 6 3 d 2 4 s 2 (Ti), 4 s 2 4 p 6 5 s 2 (Sr), 1 s 1 (H).

3. Main Results

3.1. The Bulk STO Crystal

Both experimental and our computational studies have revealed that for pure STO crystals are 7 Raman active modes in the tetragonal phase with the I4/mcm space group. The calculated Raman-active frequencies of bulk STO crystal are in a good agreement with experimental data (see Table 1). These data are classified into IR-active and silent modes, Table A1 and Table A2 in Appendix A. In addition, the phonon density of states was calculated for a thin STO film and a bulk STO crystal (Figure A2, Appendix A). The most intensive peaks are at 45.23 cm 1 ( E g ), 144.98 cm 1 ( E g ), 150.79 cm 1 ( B 2 g ), and 440.82 cm 1 ( B 2 g ) (see Figure 2 and Figure A3 in Appendix A).
The A 1 g mode is shifted towards higher frequencies whereas B 2 g towards lower frequencies as compared with experimental data. According to previous calculations the closest to experimental value of A 1 g mode obtained by Evarestov et al. [38] using B3PW hybrid functional. The closest to experimental value of B 2 g mode obtained by Tenne et al. [47] using the density-functional perturbation theory (DFPT) approach, but the structural modes calculated using this approach are in a poorer agreement with experimental data—most likely due to the fact that the data obtained from phonon calculations performed for cubic phase of STO. To find out the reason for this discrepancy, we have carried out an additional calculation using the LDA and DS-VWN5 [48] functional implemented in CRYSTAL17 computer code [49]. As a result, the A 1 g value became closer to the experimental one. Obviously, the local density approximation does not have a sufficient theoretical level for such complex interactions, but it can still be improved by choosing more suitable functionals.
Table 1. Pure STO (SG 140, bulk), calculated and experimental Raman-active frequencies, cm 1 .
Our CalculationsOther Calculations
Modes LDA (CA-PZ)LDA (DS-VWN5) B1WC [50] DFPT-LDA [47] PBE [38] PBE0 Opt [38] B3PW [38] PW PBE [38] PW, LCAO [39] Exp
E g 45.2339.852159487976171715 [51],
40 [52],
11 [53]
A 1 g 140.39117.7475162296361988544 [47],
48 [51],
52 [52]
E g 144.98149.06146171137146144183142144 [47],
143 [51]
B 2 g 150.79154.48148230152158157140157235 [51],
229 [52],
224 [54]
B 2 g 440.82442.02453.62453441466462421
E g 442.75444.51454.2557444468465425454445 [47],
460 [51],
447 [52],
420 [53]
B 1 g 510.47517.80497789438479469437
Figure 2. Raman spectra of calculated (black line, Lorentzian smearing is 5 cm 1 ) STO film with stepped surface, experimental [47] tetragonal STO single crystal and 1 μ m STO thin film in the tetragonal phase (red and blue line, respectively). Structural modes from experimental data in bulk STO are marked with R (cm 1 ). Optical phonons from the SrRuO3 buffer layer are marked with stars: STO thin films grown on STO substrates with a SrRuO3 buffer layer [47,55,56]. The experimentally observed first order Raman scattering by hard-mode TO4 phonons are marked with “TO4” [47,55]. The temperature of 10 K and the incident light of 514.5 nm (Ar + laser line for excitation) were used for both calculation and experimental data.
Materials 15 04233 g002
According to our calculations (including additional ones), vibrations of Ti atoms do not participate in the Raman spectrum of STO. Our data are also consistent with those of Rusevich et al. [50] and Evarestov et al. [38]. Peaks A 1 g , B 1 g and both B 2 g in the Raman spectrum are formed by rotating oxygen atoms that vibrate in the xy plane, whereas in the case of 150 cm 1 ( B 2 g ) vibrations, the contribution of oxygen atoms is insignificant. Sr atoms vibrating along the tetragonal axis contribute to both B 2 g lines, although this contribution is significant for the 150 cm 1 line and negligible for the 440.82 cm 1 line. Oxygen atoms vibrating along and perpendicular to the z axis give the main contribution to the 45.23 cm 1 ( E g ) line, while the contribution of Sr atoms vibrating in the xy plane is insignificant. The main contribution to the 144.98 cm 1 ( E g ) line comes from the strontium atoms, which oscillate in the xy plane, the contribution of oxygen atoms is unnoticeable. For a better understanding, see Figure A4 in Appendix A, where the modes are visualized as vectors of vibration amplitudes.

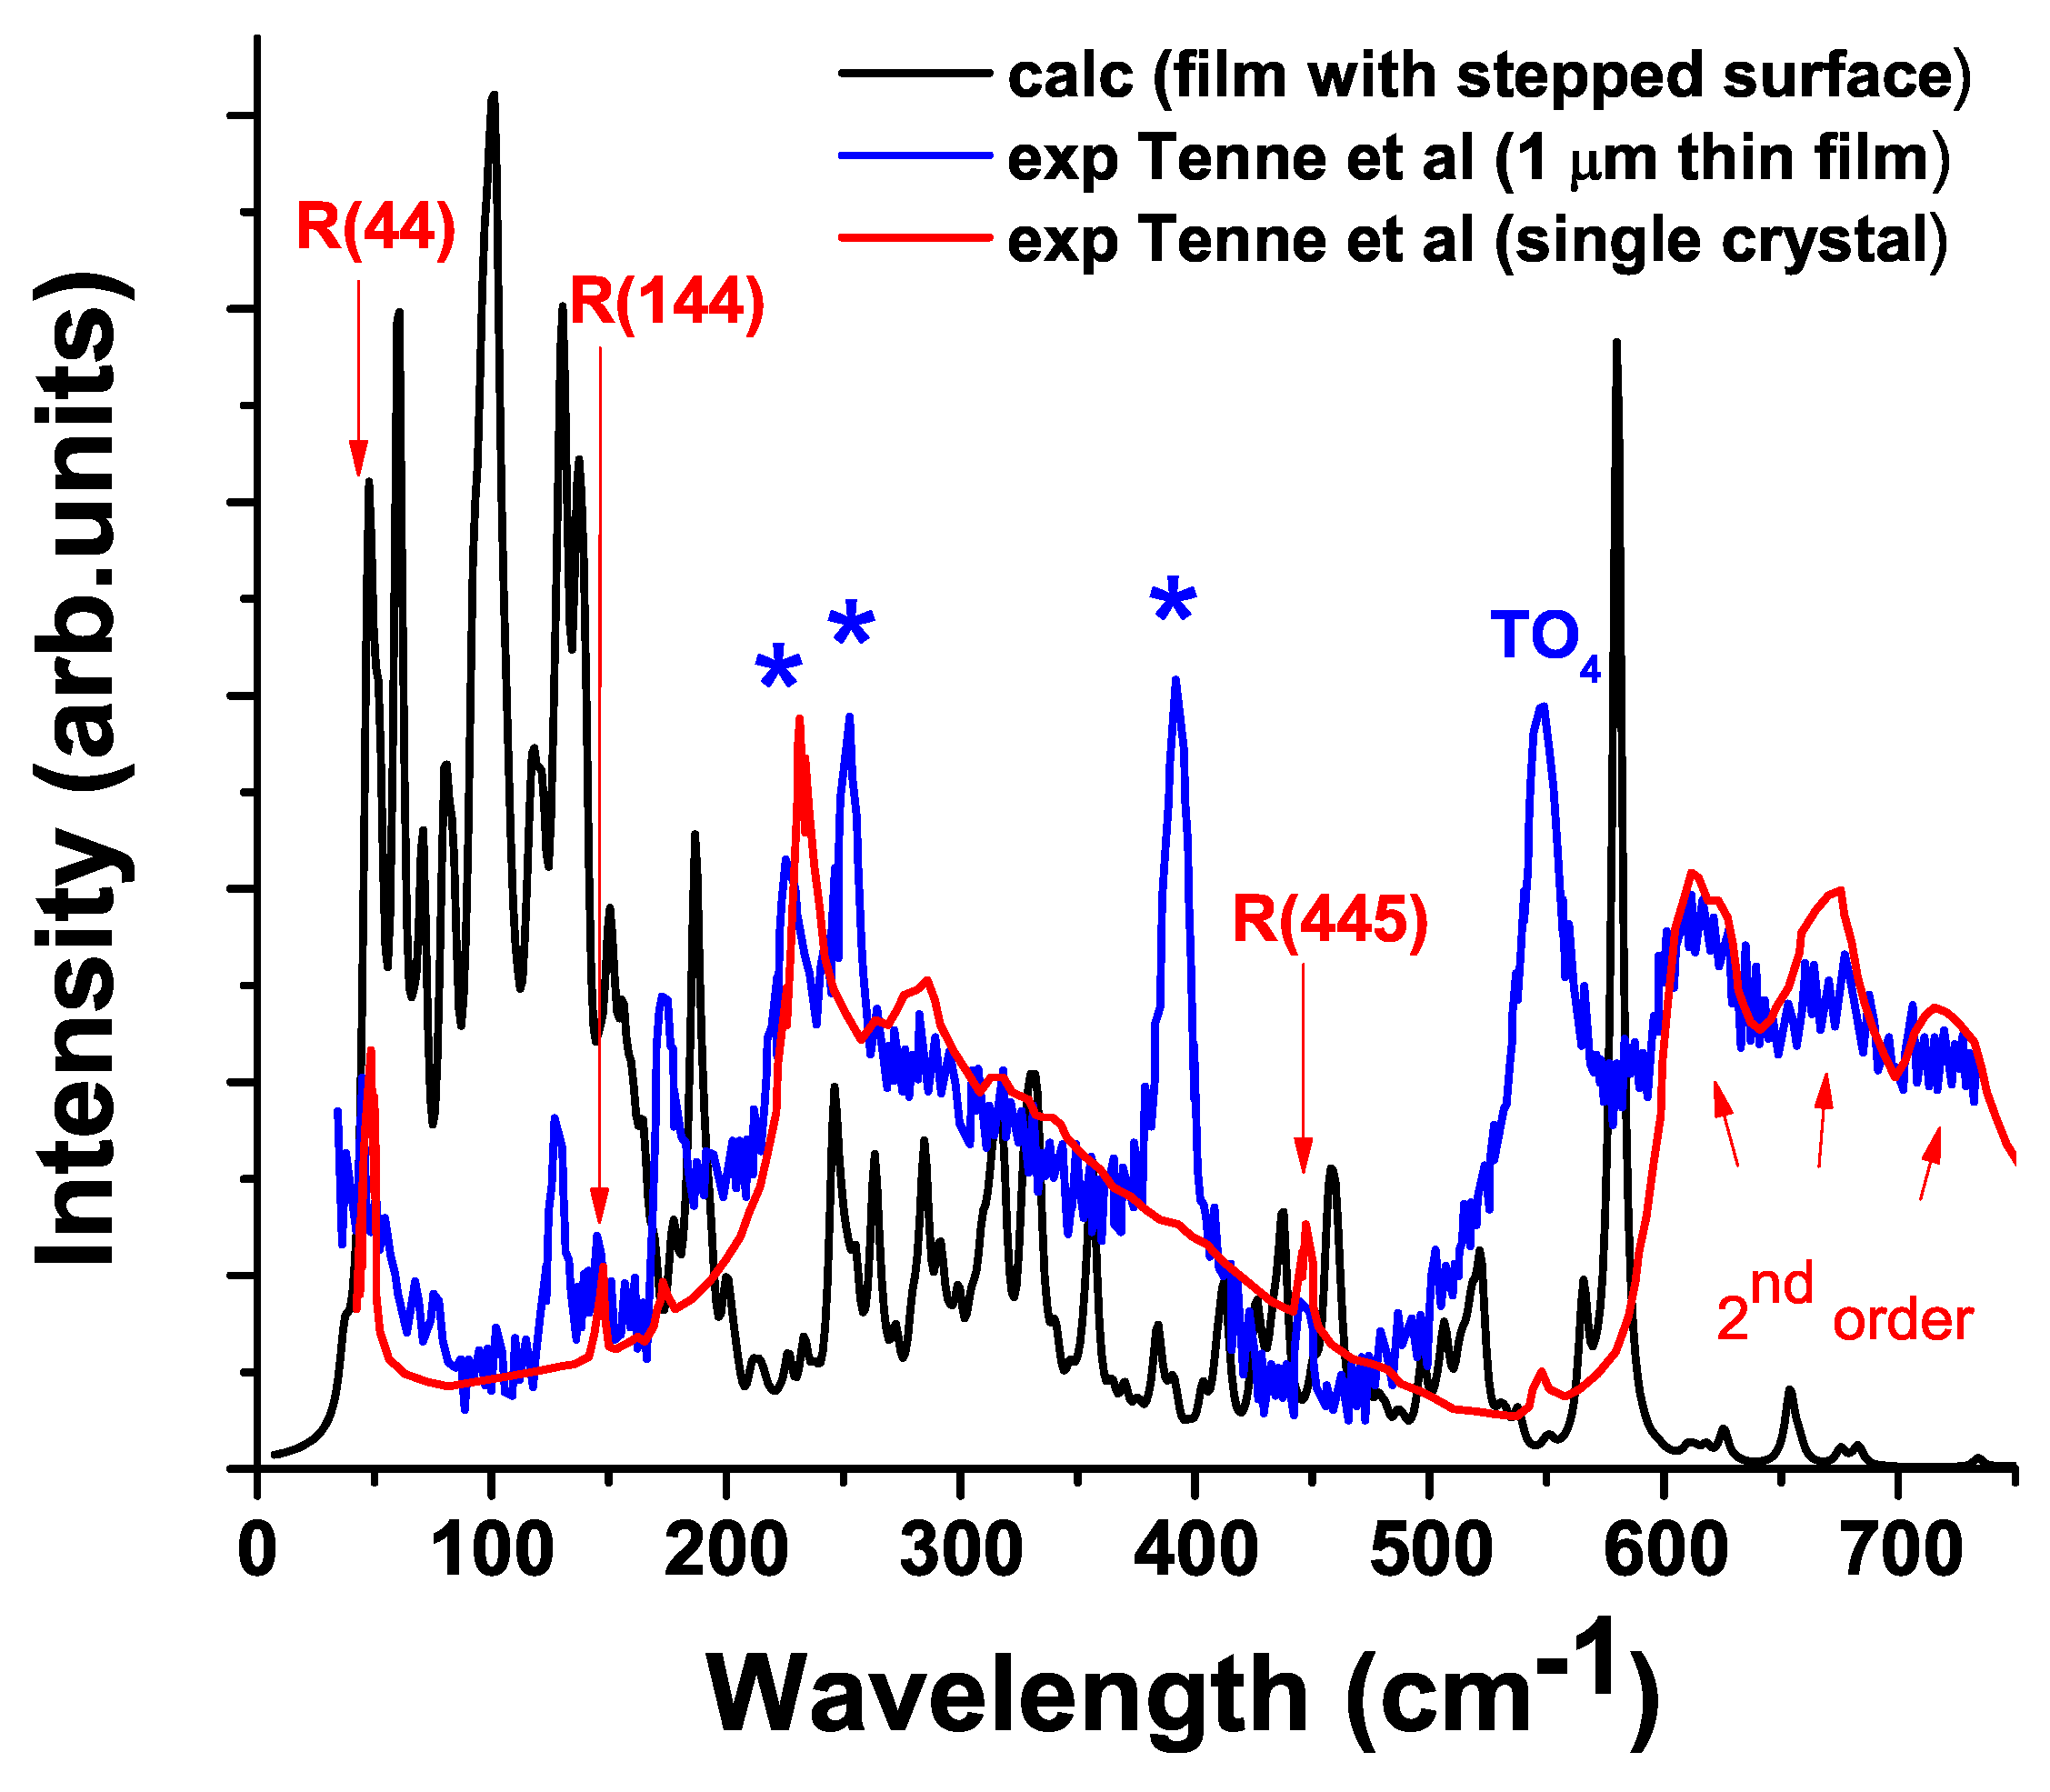
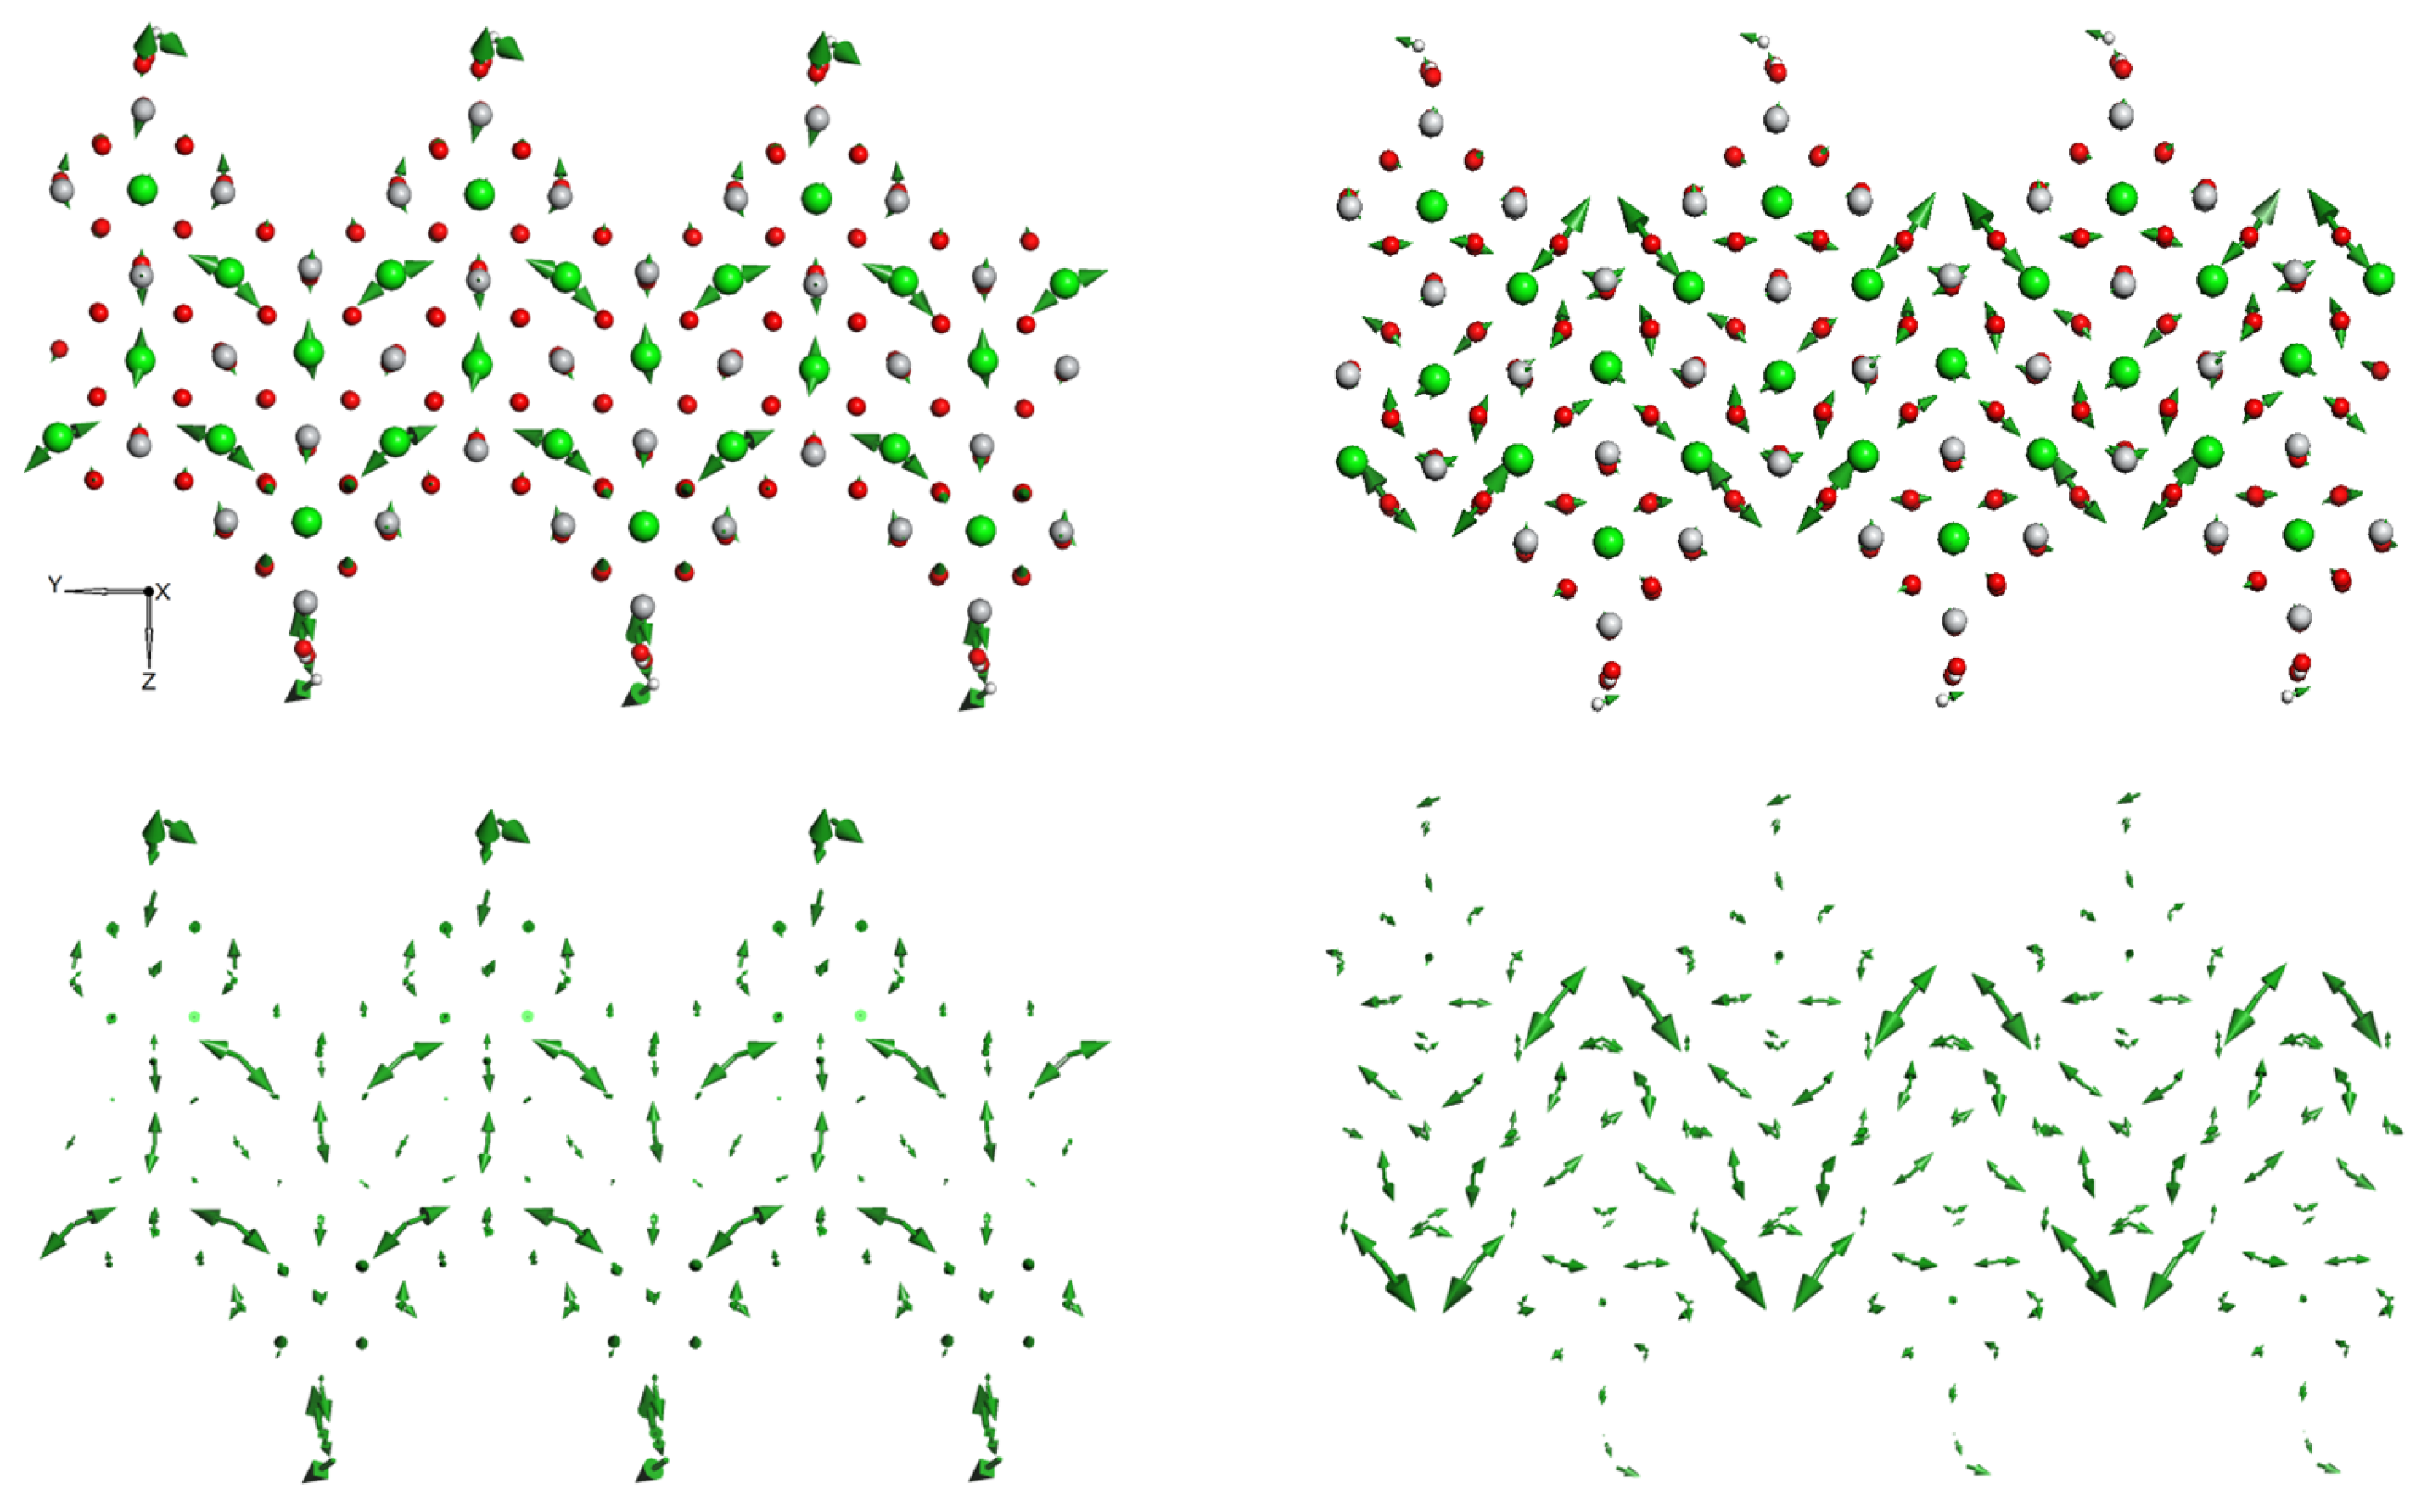
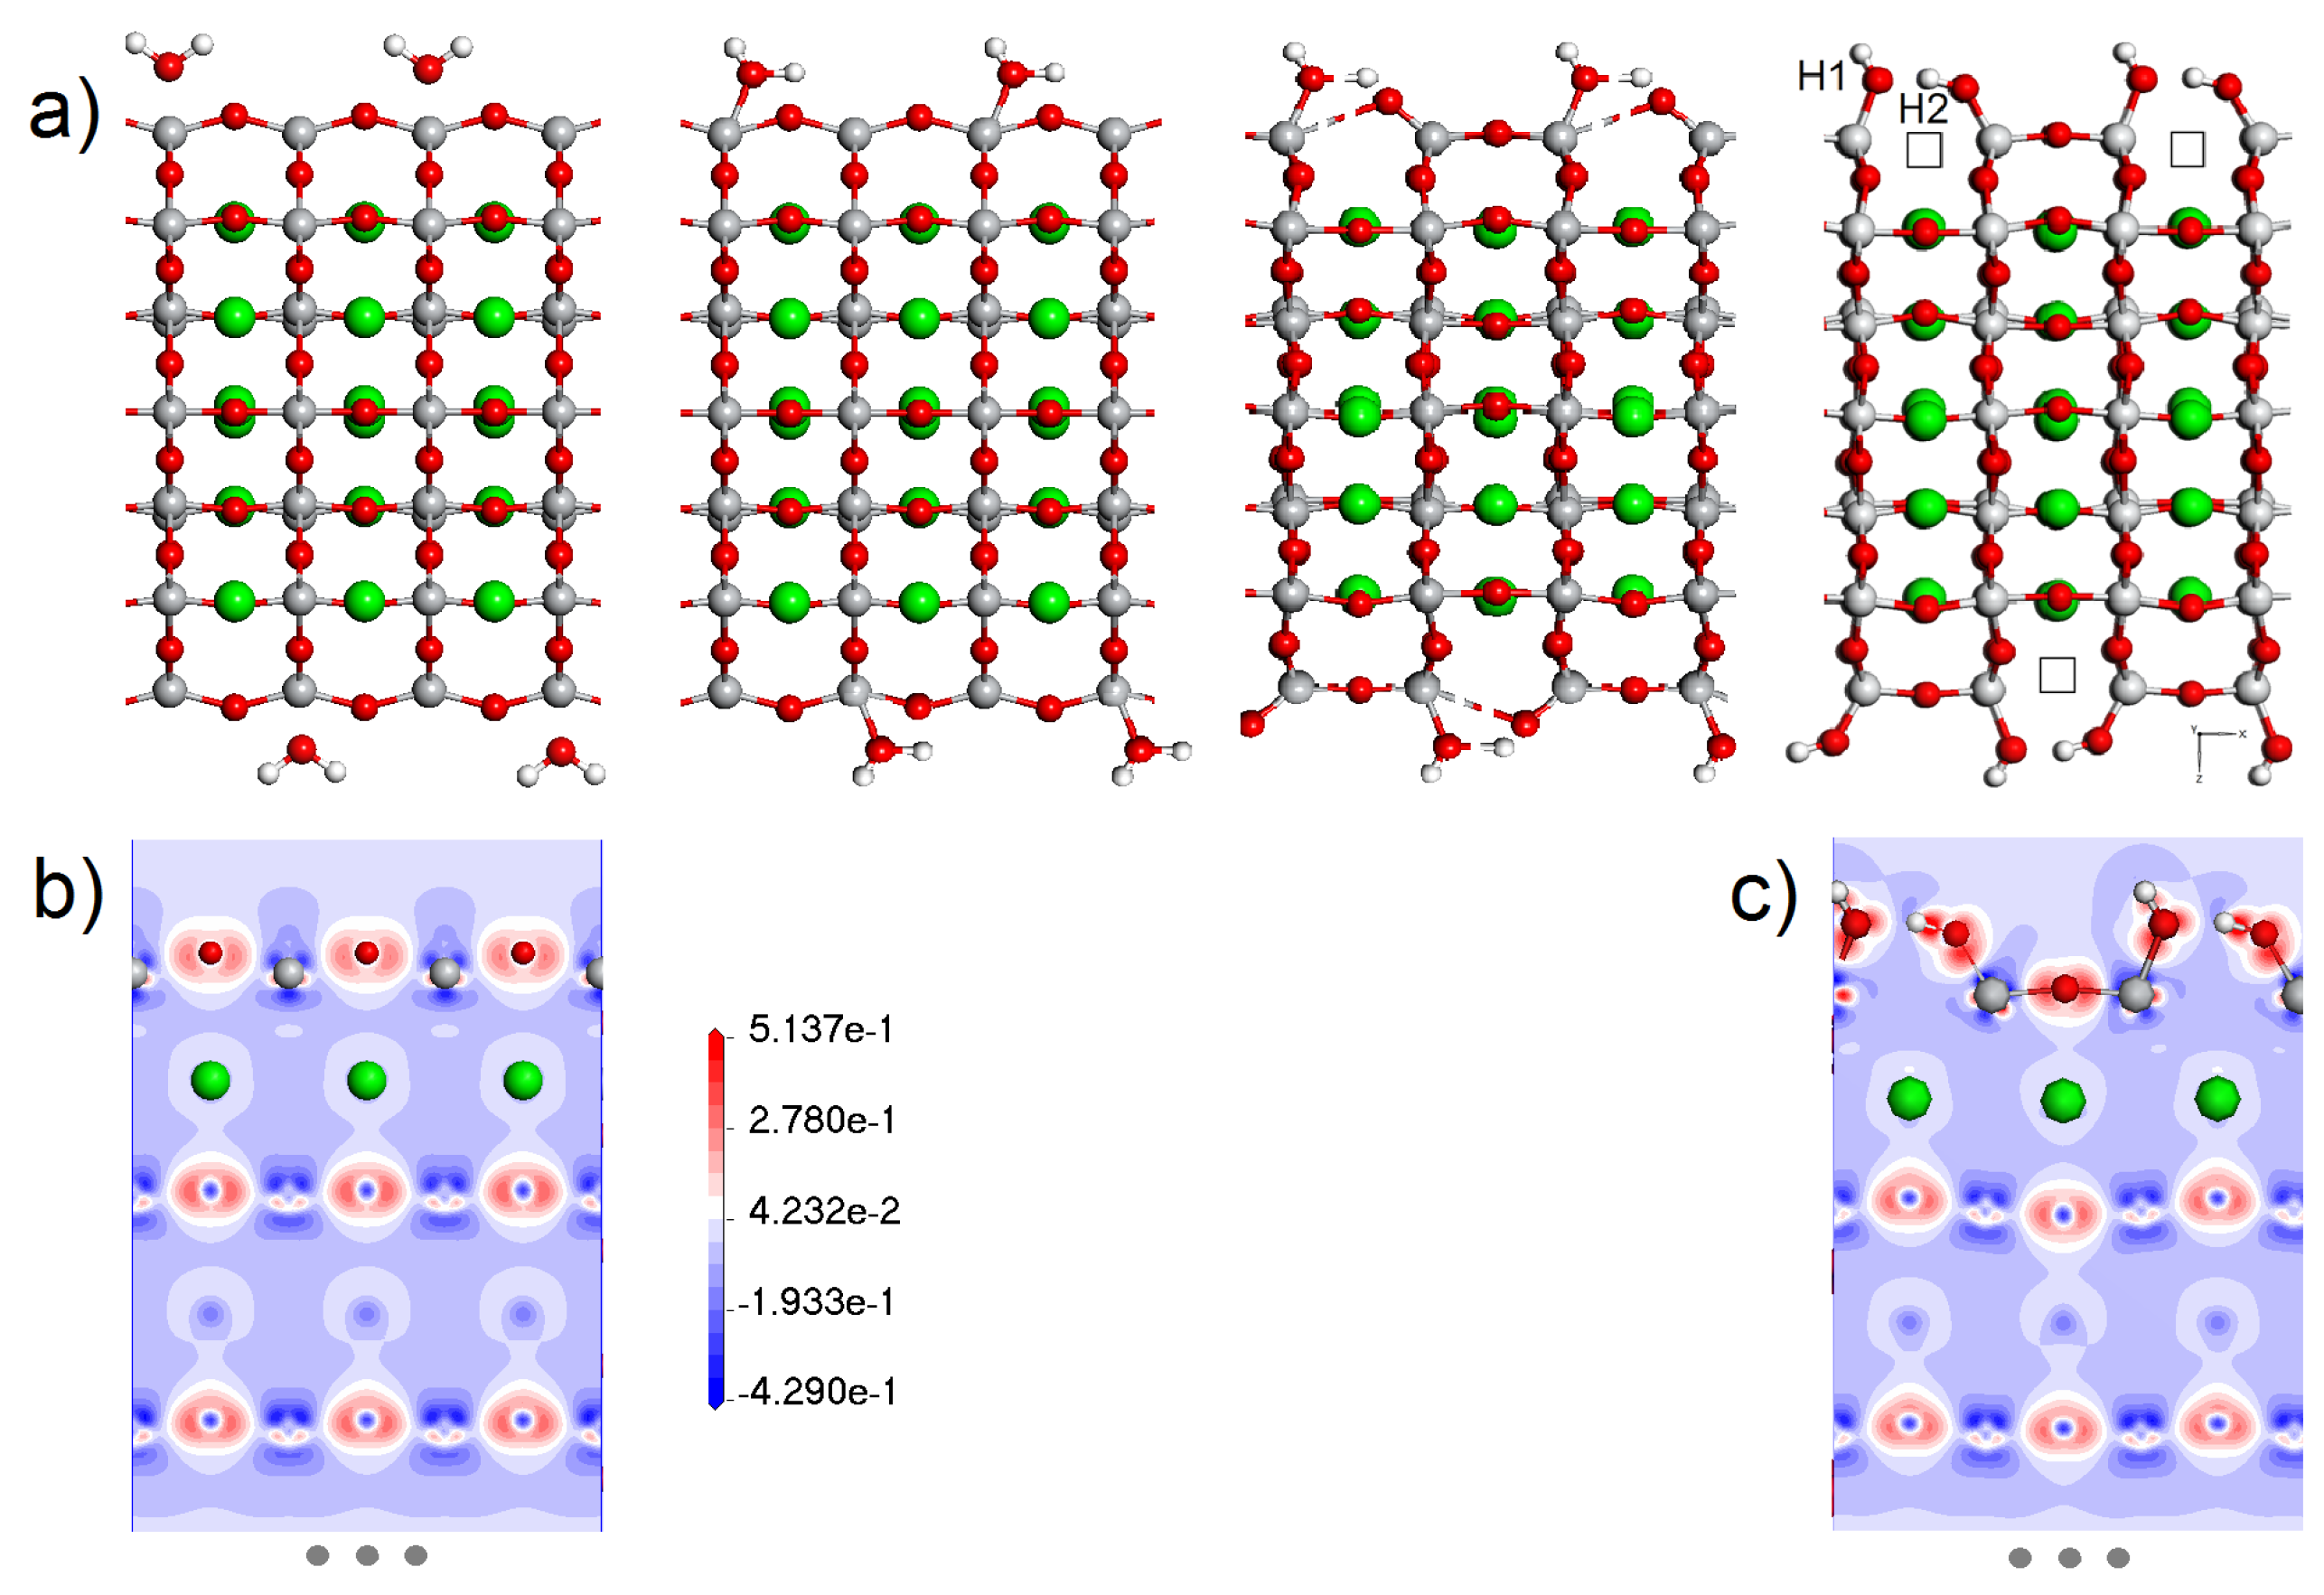
3.2. STO Plane {0 0 1} Surface without and with Stepped Surface and Adsorbates

The calculated Raman spectrum of a thin STO film differs from the bulk spectrum, which also agrees with the experimental data (Figure 2) [47,54,55]. According to Hilt Tisinger et al. [56], when compared with bulk STO, the additional (Raman-forbidden) modes in STO film are induced by defects or lattice distortion in the films. In addition, the cations nonstoichiometry in homoepitaxial STO films also leads to the appearance of first-order peaks in the Raman spectra, which are symmetry-forbidden in the paraelectric STO [57].
Although structural R-modes should exist in the tetragonal phase, in their experiments Sirenko et al did not find R-modes of bulk STO (SG 140) in thin films (0.5 μ m) [55]. As one of the possible reasons they cited the weaker intensity of R-modes compared to the Γ -point phonons, whereas the weakening of the intensity of the structural modes can occur due to the method of growing thin films, where the initially growing layers repeat the pattern of the substrate. Thus, the lattice mismatch between the film and the substrate acts as an external source of deformation by that lowering the symmetry of the film lattice [54,55,58]. In contrast to Sirenko et al. [55], Tenne et al. [47] have discovered first-order peaks of STO phonons in 1 μ m films (as well as in reduced crystals), which indicates the existence of local regions with broken inversion symmetry, due to which the modes become Raman-active [47].
It was assumed that the symmetry of the thin films may be lower than the tetragonal structure due to strain, which is consistent with our calculations. As expected, the difference in structural data between the crystal and the film is enhanced near the surface. Due to the extremely small thickness of the modelled film, the difference is noticeable even in the centre of the film (see Appendix A, Table A3 and Table A4). Other factors that, in our case, cause differences in the properties of thin films from bulk ones, are oxygen vacancies, which are also common defects in thin oxide films [47,59,60]. All above mentioned factors affected the Raman spectrum.
The authors of previous experiments [61,62] suggest that the appearance of the broad bands at around 90 cm 1 is connected to the presence of defect-induced polar microregions. Additionally it was reported that dependence of the “soft” TO1 phonon frequency is different for STO thin films with different microstructural peculiarities [63]. It was also shown that the phonon dynamics in the low-frequency spectral region (10–100 cm 1 ) is also different for different STO nanocubes (average edge lengths of 60 and 120 nm) [54]. Apparently, in both cases (thin films and nanocubes), certain spectral features cannot be attributed the TO1 phonon [54]. The results of previous studies also show that these differences in the behavior of the band below 100 cm 1 arise due to polar domains, which occupy a much larger part of the total volume of STO nanocubes. Obviously, the low frequency region deserves further study since the “soft” phonon plays the important role in determining the dielectric properties of STO.
According to our calculations, the structural vibrational modes of a pure STO crystal differ from those of both a thin film with flat {0 0 1} and a stepped surface (Figure 2). In contrast to a pure crystal, where the structural modes have a special structure with certain vibrations of O or (and) Sr atoms (see Figure A4), and where the contribution of other atoms is negligible or none at all, the structural modes of the flat and stepped film do not exactly repeat the modes of the bulk STO crystal.
Moreover, the contribution of other atoms to the structural modes found to be more significant comparing to those in the bulk STO crystal. The Raman spectrum of a film with STO flat {0 0 1} surface, calculated taking into account symmetry, contains modes characterizing STO single crystal vibrations or close to them, as well as modes associated with surface vibrations. Compared to the calculated Raman spectrum without considering symmetry, the frequencies are slightly shifted (10 cm 1 ), and the vibrations with the highest amplitudes in both cases are mainly related to the vibrations of atoms on the surface of the STO film.
We have also found that new features appear in the Raman spectrum due to vibrational modes associated with stepped specific film surface, defects and adsorbates (see Figure 2 and Figure 3). Some modes have a special pattern that allows one to identify the regions of a stepped surface (gully, slope and ridge). Some Raman frequencies that are responsible for the peculiarity of the stepped surface and specific vibrations of atoms in the pyramid (gully, slope and ridge regions) are shown in Figure 3 (see also Figure A6 in Appendix A).
For a stepped surface with adsorbate, the calculated vibrational frequencies span from 7 to 3675 cm 1 . There are almost no vibrations in the range of 1052–2751 cm 1 . The peaks between 2751 and 3675 cm 1 belong to hydrogen vibrations: O-H2 modes have frequency of 2751–2753 cm 1 , whereas O-H1 situated in 3674–3675 cm 1 range. The most important regions of the normal mode spectrum are below 150 cm 1 , and around 580 cm 1 since these frequencies contribute the most to high amplitude fluctuations. For example, the mode of 102.15 cm 1 is associated with possibility to heal the adsorbate-induced partial oxygen reduction from STO surface (see Figure 4). According to our work, the frequencies at 658, 675, and 680 cm 1 correspond to the relative motion of Ti and O ions near the vacancy, whereas the highest frequency around 683 cm 1 mainly refers to the Ti-O stretching vibrations near the vacancy. According to Evarestov group [64], the frequencies of 505 and 630 cm 1 correspond to the relative motion of Ti and O ions near the vacancy, whereas the highest frequency around 700 cm 1 mainly refers to Ti-O stretching vibrations near the vacancy.
In addition, the calculated Raman spectrum of stepped STO film makes it possible to distinguish the Raman frequencies responsible for the chemical adsorption of water derivatives on the surface (Figure 5, (Figure A5 Appendix A)).
Our simulation indicates that the hydrogen atom H1 of O−H group chemisorbed onto Ti atom of STO surface exhibits stretching vibrational frequencies of 3674 and 3675 cm 1 . This is consistent with typical OH stretching band at 3100–3700 cm 1 (see e.g., Ref. [65] (3100–3690 cm 1 in solid hydroxides); Ref. [66] (3400–3800 cm 1 in fluor-elbaite); Ref. [67] (2900–3800 cm 1 in water)). On the contrary, the hydrogen atom H2, chemisorbed on the oxygen atom displaced from the surface, exhibits stretching vibration frequencies of 2751 and 2753 cm 1 . The decrease of the vibrational frequency has been interpreted to be caused by hydrogen bond formed between formed OH groups as well as by increasing of the metal oxygen bond strength [33]. It is known fact that the formation of a hydrogen bond leads to significant changes in the Raman spectra.
Depending on hydrogen bond length and angle frequency shifts can reach the order of hundreds of cm 1 . The straighter and shorter hydrogen bond has a lower vibration frequency. The formed covalent Ti-O bonds of Ti-O-H2 and Ti-O-H1 have distances of 1.86 and 1.75 Å, respectively. It should be noted that formed lengths are shorter than that of 1.93 Å in a pure STO crystal indicating benefit of the covalent bond formation.
According to our calculations the length of hydrogen bond (d(O-O)) is 2.48 Å and the angle (∡O-H-O) of H-bond bent is 162.3°. Remembering that LDA calculations typically underestimate experimental lattice constants, the calculated H-bond frequencies are in good agreement with the correlation of O-H stretching frequencies and O-H-O hydrogen bond lengths in minerals and in a good agreement with available experimental (see [68] and references therein) as well as theoretical data [33].
Thus it was found that it is possible to discern one of the hydrogen atoms that originally belonged to the water molecule from the other one: a hydrogen atom (H1) attached to the oxygen atom of the former water molecule vibrates at higher frequencies than hydrogen atom (H2) attached to the STO oxygen atom (Figure 1 and Figure 5 and Figure A5 in Appendix A). In case of stepped STO surface the close position of water derivatives on the STO surface leads to OH induced cluster formation, where the hydrogen bridges caused lowering of the hydrogen stretching vibrations in O-H groups.

4. Conclusions

Despite known limitations of the local density approximation (LDA), the calculated Raman spectra are in a good agreement with other theoretical calculations (including those with hybrid functionals), while the computational costs are noticeably much lower. It should be noted that proper management of available computational resources and reasonable energy consumption are extremely important nowadays, so choosing to use less calculation time with reasonable results contributes to this goal.
The calculated Raman-active frequencies of the slab and bulk STO crystal are in good agreement with the experimental data. The results of the Raman calculation of stepped STO surface with adsorbed water derivatives are also comparable with available experimental data. The calculated Raman spectrum of a thin STO film differs from the bulk spectrum, which also agrees with the experimental data. Moreover the calculated Raman spectrum of stepped STO film allows to identify the specific Raman frequencies for chemical adsorption of water derivatives (OH) on such a facet surface. In particular, it is possible to distinguish one of the hydrogen atoms that originally came from the water molecule from another one: a hydrogen atom (H1) attached to the oxygen atom of the former water molecule vibrates at higher frequencies than hydrogen atom (H2) attached to the oxygen removed from the surface.
We also have found that new features appear in the Raman spectra due to vibrational modes associated with the stepped film surface (Figure 2 and Figure 3). The water adsorption in the ridge position is accompanied by a pronounced structural reconstruction—breaking of the Ti-O bonds. In spite of this, the other two distinct surface regions of water adsorbtion (slope and gully) could also be important for further Raman calculations. It was shown that defects caused by water adsorption give the characteristic Raman frequencies that can be used to identify adsorbates and facet surfaces promising for photocatalysis. This approach opens the way to selection of the most catalytically efficient perovskite nanoparticles for water splitting and hydrogen production.

Author Contributions

Conceptualization, E.A.K., V.K. and Y.A.M.; data curation, L.L.R. and V.K.; formal analysis, M.S.; funding acquisition, V.K. and E.A.K.; investigation, V.K., M.S., Y.A.M. and L.L.R.; methodology, V.K., Y.A.M., L.L.R., A.P. and E.A.K.; project administration, V.K. and E.A.K.; resources, Y.A.M. and E.A.K.; software, M.S., L.L.R., A.P. and V.K.; supervision, E.A.K., L.L.R. and Y.A.M.; validation, M.S., A.P., L.L.R., Y.A.M. and V.K.; visualization, V.K.; writing—original draft, V.K., L.L.R. and Y.A.M.; writing—review and editing, E.A.K., L.L.R. and Y.A.M. All authors have read and agreed to the published version of the manuscript.

Funding

The financial support of M-ERA.net SunToChem project is greatly acknowledged by L.L.R. and Y.A.M. This paper is partly based upon COST (European Cooperation in Science and Technology) Action 18234 Short Term Scientific Mission. The support is greatly acknowledged by E.K. and V.K. The Institute of Solid State Physics, University of Latvia (Latvia) as the Centre of Excellence has received funding from the European Union’s Horizon 2020 Frame-work Programme H2020-WIDESPREAD-01-2016-2017-Teaming Phase2 under grant agreement No. 739508, project CAMART2. The computer resources were provided by the Stuttgart Supercomputing Center (HLRS project DEFTD 12939) and Latvian Super Cluster (LASC).

Acknowledgments

Authors thank M. Kržmanc and J. Wu for fruitful discussions.

Conflicts of Interest

The authors declare no conflict of interest.

Appendix A

Figure A1. Formation of water derivatives (water splitting) on STO stepped surface: (a). schematic representation. The Sr-O bonds are omitted. The empty squares are oxygen vacancies. Isosurface of cross-section (charge) density difference (three atoms: titanium, oxygen and strontium near to surface) without (b) and with (c) adsorption of water derivatives.
Materials 15 04233 g0a1
Figure A2. Density of phonon states of bulk STO crystal (red dashed line) and STO film with stepped surface (black line). Notice different frequency scales: normal (right) and enlarged for better visibility (left).
Materials 15 04233 g0a2
Figure A3. Raman spectrum of calculated bulk STO crystal: increased scaling for better visibility.
Materials 15 04233 g0a3
Figure A4. Mode representations for bulk STO in the tetragonal phase (Green—Strontium, Grey—Titanium, Red—Oxygen, calculated by LDA (CA-PZ)): (a) E g (45.23 cm 1 ), (b) A 1 g (140.39 cm 1 ), (c) E g (144.98 cm 1 ), (d) B 2 g (150.79 cm 1 ), (e) B 2 g (440.82 cm 1 ), (f) E g (442.75 cm 1 ) and (g) B 1 g (510.47 cm 1 ) The modes are visualized as vectors of vibration amplitudes, the visualization of weak vibrations are omitted.
Materials 15 04233 g0a4
Figure A5. Raman spectrum of the STO film with stepped surface with adsorbed derivatives of water molecules (at the “Ridge” site on both sides of the film) in the range of 2700–3750 cm 1 .
Materials 15 04233 g0a5
Figure A6. Examples of modes (image on the left—(a) 120.66 cm 1 , (c) 246.72 cm 1 , (e) 586.46 cm 1 , on the right—(b) 162.61 cm 1 , (d) 380.09 cm 1 , (f) 657.90 cm 1 ) with specific patterns of STO film with stepped surface, calculated by LDA (CA-PZ). Modes are visualized as vectors of vibrational amplitudes. The green, red, white, and gray balls are strontium, oxygen, hydrogen, and titanium atoms, respectively. Right hand side figures are given for a better view of the pattern of vibrational amplitudes of the stepped STO film: the atoms are omitted.
Materials 15 04233 g0a6
Table A1. Pure STO (SG 140, bulk), calculated and experimental IR-active frequencies (cm 1 ).
IR (Pure STO 140)
Bulk, Calc
Other Calc [50] Our Calc
Mode Rep B1WC, Crystal LDA (CA-PZ), Castep LDA, Crystal Exp [52]
Eu4766.05115.4815
A2u5375.34126.77
Eu173173.14181.38172
A2u175180.02184.63
Eu260250.51251.06
Eu453.64441.75450.84436
Eu554544.99560.54548
A2u556548.83564.01
Table A2. Pure STO (SG 140, bulk), calculated silent frequencies, cm 1 .
IR (Pure STO 140)
Bulk, Calc
Other Calc [50] Our Calc
Mode Rep B1WC, Crystal LDA (CA-PZ), Castep LDA, Crystal
B1u263(B2u) 264.78 (O)260.97
A1u453437.02 (Ti)447.64
A2g495498.90 (O)511.36
A2g872853.50 (O) Octa860.34
Table A3. The difference of structural data of STO crystal and film of strontium titanate with plane {0 0 1}.
Distances in Å
Slab Bulk Slab Bulk
Sr-Sr Sr-O
SrO layer4.09—between SrO layers 3.79—in SrO layer3.86—between SrO layers 3.83—in SrO layer2.62, 2.97—between SrO and neighbouring central TiO2 layer 2.60, 2.64—between SrO and neighbouring surface TiO2 layer 2.68—in SrO layer2.58, 2.86—between SrO and neighbouring TiO2 layer 2.71—in SrO layer
Ti-TiTi-O
TiO2 layer3.77—between TiO2 layers 3.79—in TiO2 layers3.86—between TiO2 layer 3.83—in TiO2 layer1.94 0 between central (TiO2) and neighboring SrO layer 1.83—between surface (TiO2) and neighboring SrO layer 1.90—in the surface (TiO2) layer 1.91—in the central (TiO2) layer (in the center of the film)1.93—between TiO2 layers 1.92—in TiO2 layer
Table A4. The difference of structural data of STO crystal and film of strontium titanate with stepped surface.
Distances in Å
Sr-Sr Sr-O
Stepped Slab Bulk Stepped Slab Bulk
SrO layer3.66–3.79—gully 3.80–3.85—ridge (depending on the directions) 3.65–4.03—between SrO layers 3.79—in central SrO layer3.86—between SrO layers 3.83—in SrO layer2.60–2.92—gully 2.51—2.89 and 2.54–2.99—ridge (H atom towards and outwards to nearest slope, respectively)2.58, 2.86—between SrO and neighboring TiO2 layers 2.71—in SrO layer
Ti-TiTi-O
TiO2 layer3.69—gully 3.54–3.72—ridge 3.75—in the center of the film3.86—between TiO2 layers 3.83—in TiO2 layer1.86–1.92—gully 1.90–1.99 and 1.87–1.99—slope (H atom towards and outwards to nearest slope, respectively) 1.78–1.80—ridge 1.91–1.95—in the center of the film1.93—between TiO2 layers 1.92—in TiO2 layer

References

  1. Osterloh, F.E.; Parkinson, B.A. Recent developments in solar water-splitting photocatalysis. MRS Bull. 2011, 36, 17–22. [Google Scholar] [CrossRef] [Green Version]
  2. Kudo, A.; Miseki, Y. Heterogeneous photocatalyst materials for water splitting. Chem. Soc. Rev. 2009, 38, 253–278. [Google Scholar] [CrossRef]
  3. Yang, J.; Wang, D.; Han, H.; Li, C.A.N. Roles of Cocatalysts in Photocatalysis and Photoelectrocatalysis. Acc. Chem. Res. 2013, 46, 1900–1909. [Google Scholar] [CrossRef]
  4. Ariando, A.; Wang, X.; Baskaran, G.; Liu, Z.Q.; Huijben, J.; Yi, J.B.; Annadi, A.; Barman, A.R.; Rusydi, A.; Dhar, S.; et al. Electronic phase separation at the LaAlO3 / SrTiO3 interface. Nat. Commun. 2011, 2, 1–7. [Google Scholar] [CrossRef] [Green Version]
  5. Zhang, J.; Xu, Q.; Feng, Z.; Li, M.; Li, C. Importance of the Relationship between Surface Phases and Photocatalytic Activity of TiO2. Angew. Chem. Int. Ed. 2008, 47, 1766–1769. [Google Scholar] [CrossRef] [PubMed]
  6. Wang, X.; Xu, Q.; Li, M.; Shen, S.; Wang, X.; Wang, Y.; Feng, Z.; Shi, J.; Han, H.; Li, C. Photocatalytic Overall Water Splitting Promoted by an a–b phase Junction on Ga2O3. Angew. Chem. Int. Ed. 2012, 51, 13089–13092. [Google Scholar] [CrossRef]
  7. Townsend, T.K.; Browning, N.D.; Osterloh, F.E. Nanoscale Strontium Titanate Photocatalysts for Overall Water Splitting. ACS Nano 2012, 6, 7420–7426. [Google Scholar] [CrossRef]
  8. Nuraje, N.; Dang, X.; Qi, J.; Allen, M.A.; Lei, Y.; Belcher, A.M. Biotemplated Synthesis of Perovskite Nanomaterials for Solar Energy Conversion. Adv. Mater. 2012, 24, 2885–2889. [Google Scholar] [CrossRef]
  9. Mu, L.; Zhao, Y.; Li, A.; Wang, S.; Wang, Z.; Yang, J.; Wang, Y.; Liu, T.; Chen, R.; Zhu, J.; et al. Enhancing charge separation on high symmetry SrTiO3 exposed with anisotropic facets for photocatalytic water splitting. Energy Environ. Sci. 2016, 9, 2463–2469. [Google Scholar] [CrossRef]
  10. Kržmanc, M.M.; Daneu, N.; Čontala, A.; Santra, S.; Kamal, K.M.; Mac, M.; Likozar, B.; Spreitzer, M. SrTiO3/Bi4Ti3O12 Nanoheterostructural Platelets Synthesized by Topotactic Epitaxy as Effective Noble-Metal-Free Photocatalysts for pH-Neutral Hydrogen Evolution. ACS Appl. Mater. Interfaces 2021, 13, 370–381. [Google Scholar] [CrossRef]
  11. Afroz, K.; Moniruddin, M.; Bakranov, N.; Kudaibergenov, S.; Nuraje, N. A heterojunction strategy to improve the visible light sensitive water splitting performance of photocatalytic materials. J. Mater. Chem. A 2018, 6, 21696–21718. [Google Scholar] [CrossRef]
  12. Li, X.; Yu, J.; Jaroniec, M. Hierarchical photocatalysts. Chem. Soc. Rev. 2016, 45, 2603–2636. [Google Scholar] [CrossRef] [PubMed]
  13. Moniruddin, M.; Afroz, K.; Shabdan, Y.; Bizri, B.; Nuraje, N. Hierarchically 3D assembled strontium titanate nanomaterials for water splitting application. Appl. Surf. Sci. 2017, 419, 886–892. [Google Scholar] [CrossRef]
  14. Takata, T.; Jiang, J.; Sakata, Y.; Nakabayashi, M.; Shibata, N.; Nandal, V.; Seki, K.; Hisatomi, T.; Domen, K. Photocatalytic water splitting with a quantum efficiency of almost unity. Nature 2020, 581, 411–414. [Google Scholar] [CrossRef]
  15. Kato, H.; Kobayashi, M.; Hara, M.; Kakihana, M. Fabrication of SrTiO3 exposing characteristic facets using molten salt flux and improvement of photocatalytic activity for water splitting. Catal. Sci. Technol. 2013, 3, 1733–1738. [Google Scholar] [CrossRef]
  16. Wang, B.; Shen, S.; Guo, L. Surface Reconstruction of Facet-Functionalized SrTiO3 Nanocrystals for Photocatalytic Hydrogen Evolution. ChemCatChem 2016, 8, 798–804. [Google Scholar] [CrossRef]
  17. Hsieh, P.l.; Naresh, G.; Huang, Y.S.; Tsao, C.W.; Hsu, Y.J.; Chen, L.J.; Huang, M.H. Shape-Tunable SrTiO3 Crystals Revealing Facet-Dependent Optical and Photocatalytic Properties. J. Phys. Chem. C 2019, 123, 13664–13671. [Google Scholar] [CrossRef]
  18. Wang, B.; Shen, S.; Guo, L. SrTiO3 single crystals enclosed with high-indexed {0 2 3} facets and {0 0 1} facets for photocatalytic hydrogen and oxygen evolution. Appl. Catal. B 2015, 166–167, 320–326. [Google Scholar] [CrossRef]
  19. Li, R.; Zhang, F.; Wang, D.; Yang, J.; Li, M.; Zhu, J.; Zhou, X.; Han, H.; Li, C. Spatial separation of photogenerated electrons and holes among {0 1 0} and {1 1 0} crystal facets of BiVO4. Nat. Commun. 2013, 4, 1–7. [Google Scholar] [CrossRef] [Green Version]
  20. Li, R.; Han, H.; Zhang, F.; Wang, D.; Li, C. Highly efficient photocatalysts constructed by rational assembly of dual-cocatalysts separately on different facets of BiVO4. Energy Environ. Sci. 2014, 7, 1369–1376. [Google Scholar] [CrossRef]
  21. Kato, H.; Kudo, A. Visible-Light-Response and Photocatalytic Activities of TiO2 and SrTiO3 Photocatalysts Codoped with Antimony and Chromium. J. Phys. Chem. B 2002, 106, 5029–5034. [Google Scholar] [CrossRef]
  22. Miyauchi, M.; Nakajima, A.; Watanabe, T.; Hashimoto, K. Photocatalysis and Photoinduced Hydrophilicity of Various Metal Oxide Thin Films. Chem. Mater. 2002, 14, 2812–2816. [Google Scholar] [CrossRef]
  23. Konta, R.; Ishii, T.; Kato, H.; Kudo, A. Photocatalytic Activities of Noble Metal Ion Doped SrTiO3 under Visible Light Irradiation. J. Phys. Chem. B 2004, 108, 8992–8995. [Google Scholar] [CrossRef]
  24. Yu, S.C.; Huang, C.W.; Liao, C.H.; Wu, J.C.S.; Chang, S.T.; Chen, K.H. A novel membrane reactor for separating hydrogen and oxygen in photocatalytic water splitting. J. Membr. Sci. 2011, 382, 291–299. [Google Scholar] [CrossRef]
  25. Ham, Y.; Hisatomi, T.; Goto, Y.; Moriya, Y.; Sakata, Y. Flux-mediated doping of SrTiO3 photocatalysts for efficient overall water splitting. J. Mater. Chem. A 2016, 5, 3027–3033. [Google Scholar] [CrossRef] [Green Version]
  26. Foo, G.S.; Hood, Z.D.; Wu, Z. Shape Effect Undermined by Surface Reconstruction: Ethanol Dehydrogenation over Shape-Controlled SrTiO3 Nanocrystals. ACS Catal. 2018, 8, 555–565. [Google Scholar] [CrossRef]
  27. Li, D.; Yu, J.C.C.; Nguyen, V.H.; Wu, C.S.; Wang, X. A dual-function photocatalytic system for simultaneous separating hydrogen from water splitting and photocatalytic degradation of phenol in a twin-reactor. Appl. Catal. B 2018, 239, 268–279. [Google Scholar] [CrossRef]
  28. Kampouri, S.; Stylianou, K.C. Dual-Functional Photocatalysis for Simultaneous Hydrogen Production and Oxidation of Organic Substances. ACS Catal. 2019, 9, 4247–4270. [Google Scholar] [CrossRef]
  29. Kanazawa, T.; Nozawa, S.; Lu, D.; Maeda, K. Structure and Photocatalytic Activity of PdCrOx Cocatalyst on SrTiO3 for Overall Water Splitting. Catalysts 2019, 9, 59. [Google Scholar] [CrossRef] [Green Version]
  30. Saleem, Z.; Pervaiz, E.; Yousaf, M.U.; Niazi, M.B.K. Two-Dimensional Materials and Composites as Potential Water Splitting Photocatalysts: A Review. Catalysts 2020, 10, 464. [Google Scholar] [CrossRef]
  31. Guhl, H.; Miller, W.; Reuter, K. Water adsorption and dissociation on SrTiO3 (0 0 1) revisited: A density functional theory study. Phys. Rev. B 2010, 81, 155455. [Google Scholar] [CrossRef] [Green Version]
  32. Cui, M.; Liu, T.; Li, Q.; Yang, J.; Jia, Y. Oxygen Evolution Reaction (OER) on Clean and Oxygen Deficient Low-Index SrTiO3 Surfaces: A Theoretical Systematic Study. ACS Sustain. Chem. Eng. 2019, 7, 15346–15353. [Google Scholar] [CrossRef]
  33. Holmström, E.; Spijker, P.; Foster, A.S. The interface of SrTiO3 and H2O from density functional theory molecular dynamics Subject Areas. Proc. R. Soc. A 2016, 472, 20160293. [Google Scholar] [CrossRef] [Green Version]
  34. Nosaka, Y.; Nosaka, A.Y. Generation and Detection of Reactive Oxygen Species in Photocatalysis. Chem. Rev. 2017, 117, 11302–11336. [Google Scholar] [CrossRef]
  35. Shiraishi, Y.; Kanazawa, S.; Tsukamoto, D.; Shiro, A.; Sugano, Y.; Hirai, T. Selective Hydrogen Peroxide Formation by Titanium Dioxide Photocatalysis with Benzylic Alcohols and Molecular Oxygen in Water. ACS Catal. 2013, 3, 2222–2227. [Google Scholar] [CrossRef]
  36. Song, C.; Li, X.; Jiang, Y.; Wang, X.; Yao, J.; Meng, S.; Zhang, J. Real-Space Imaging of Orbital Selectivity on SrTiO3(0 0 1) Surface. ACS Appl. Mater. Interfaces 2019, 11, 37279–37284. [Google Scholar] [CrossRef]
  37. Heifets, E.; Kotomin, E.A.; Trepakov, V.A. Calculations for antiferrodistortive phase of SrTiO3 perovskite: Hybrid density functional study. J. Phys. Condens. Matter 2006, 18, 4845–4851. [Google Scholar] [CrossRef] [Green Version]
  38. Evarestov, R.A.; Blokhin, E.; Gryaznov, D.; Kotomin, E.A.; Maier, J. Phonon calculations in cubic and tetragonal phases of SrTiO3: A comparative LCAO and plane-wave study. Phys. Rev. B 2011, 83, 134108. [Google Scholar] [CrossRef] [Green Version]
  39. Blokhin, E.; Evarestov, R.A.; Gryaznov, D.; Kotomin, E.A.; Maier, J. Theoretical modeling of antiferrodistortive phase transition for SrTiO3 ultrathin films. Phys. Rev. B 2013, 88, 241407. [Google Scholar] [CrossRef]
  40. Krainyukova, N.V.; Hamalii, V.O.; Peschanskii, A.V.; Popov, A.I.; Kotomin, E.A. Low temperature structural transformations on the (0 0 1) surface of SrTiO3 single crystals. Low Temp. Phys. 2020, 46, 740. [Google Scholar] [CrossRef]
  41. Sokolov, M.; Mastrikov, Y.A.; Zvejnieks, G.; Bocharov, D.; Kotomin, E.A.; Krasnenko, V. Water Splitting on Multifaceted SrTiO3 Nanocrystals: Computational Study. Catalysts 2021, 11, 1326. [Google Scholar] [CrossRef]
  42. Gray, D.J.; Merz, T.A.; Hikita, Y.; Hwang, H.Y.; Mabuchi, H. Orientation-resolved domain mapping in tetragonal SrTiO3 using polarized Raman spectroscopy. Phys. Rev. B 2016, 94, 214107. [Google Scholar] [CrossRef] [Green Version]
  43. Lytle, F.W. X-ray Diffractometry of Low-Temperature Phase Transformations in Strontium Titanate. J. Appl. Phys. 1964, 35, 2212–2215. [Google Scholar] [CrossRef]
  44. Accelrys Software Inc. Material Studio Release Notes, Release 6.1; Accelrys Software Inc.: San Diego, CA, USA, 2012. [Google Scholar]
  45. Ceperley, D.M.; Alder, B.J. Ground state of the electron gas by a stochastic model. Phys. Rev. Lett. 1980, 45, 566–569. [Google Scholar] [CrossRef] [Green Version]
  46. Unoki, H.; Sakudo, T. Electron Spin Resonance of Fe3+ in SrTiO3 with Special Reference to the 110 K Phase Transition. J. Phys. Soc. Jpn. 1967, 23, 546–552. [Google Scholar] [CrossRef]
  47. Tenne, D.A.; Gonenli, I.E.; Soukiassian, A.; Schlom, D.G.; Nakhmanson, S.M.; Rabe, K.M.; Xi, X.X. Raman study of oxygen reduced and re-oxidized strontium titanate. Phys. Rev. B 2007, 76, 024303. [Google Scholar] [CrossRef] [Green Version]
  48. Vosko, S.H.; Wilk, L.; Nusair, M. Accurate spin-dependent electron liquid correlation energies for local spin density calculations: A critical analysis. Can. J. Phys. 1980, 58, 1200–1211. [Google Scholar] [CrossRef] [Green Version]
  49. Dovesi, R.; Erba, A.; Salustro, S.; Kirtman, B.; Zicovich-wilson, R.O.C.M.; Civalleri, B.; Maschio, L.; Rérat, M.; Casassa, S.; Baima, J. Quantum-mechanical condensed matter simulations with CRYSTAL. Wiley Interdiscip. Rev. Comput. Mol. Sci. 2018, 8, e1360. [Google Scholar] [CrossRef]
  50. Rusevich, L.L.; Kotomin, E.A.; Zvejnieks, G.; Popov, A.I. Ab initio calculations of structural, electronic and vibrational properties of BaTiO3 and SrTiO3 perovskite crystals with oxygen vacancies. Low Temp. Phys. 2020, 46, 1185. [Google Scholar] [CrossRef]
  51. Fleury, P.A.; Scott, J.F.; Worlock, J.M. Soft phonon modes and the 110 K phase transition in SrTiO3. Phys. Rev. Lett. 1968, 21, 16–19. [Google Scholar] [CrossRef]
  52. Petzelt, J.; Ostapchuk, T.; Gregora, I.; Rychetsky, I.; Hoffmann-Eifert, S.; Pronin, A.V.; Yuzyuk, Y.; Gorshunov, B.P.; Kamba, S.; Bovtun, V.; et al. Dielectric, infrared, and Raman response of undoped SrTiO3 ceramics: Evidence of polar grain boundaries. Phys. Rev. B 2001, 64, 184111. [Google Scholar] [CrossRef]
  53. Shigenari, T.; Abe, K.; Takemoto, T.; Sanaka, O.; Akaike, T.; Sakai, Y.; Wang, R.; Itoh, M. Raman spectra of the ferroelectric phase of SrTi18O3: Symmetry and domains below Tc and the origin of the phase transition. Phys. Rev. B 2006, 74, 174121. [Google Scholar] [CrossRef]
  54. Rabuffetti, F.A.; Kim, H.S.; Enterkin, J.A.; Wang, Y.; Lanier, C.H.; Marks, L.D.; Poeppelmeier, K.R.; Stair, P.C. Synthesis-Dependent First-Order Raman Scattering in SrTiO3 Nanocubes at Room Temperature. Chem. Mater. 2008, 20, 5628–5635. [Google Scholar] [CrossRef]
  55. Sirenko, A.A.; Akimov, I.A.; Fox, J.R.; Clark, A.M.; Li, H.C.; Si, W.; Xi, X.X. Observation of the First-Order Raman Scattering in SrTiO3 Thin Films. Phys. Rev. Lett. 1999, 82, 4500–4503. [Google Scholar] [CrossRef] [Green Version]
  56. Hilt Tisinger, L.; Liu, R.; Kulik, J.; Zhang, X.; Ramdani, J.; Demkov, A.A. Ultraviolet-Raman studies of SrTiO3 ultrathin films on Si. J. Vac. Sci. Technol. B 2003, 21, 53–56. [Google Scholar] [CrossRef]
  57. Tenne, D.A.; Farrar, A.K.; Brooks, C.M.; Heeg, N.; Schubert, J.; Jang, H.W.; Bark, C.W.; Folkman, C.M.; Eom, C.B.; Schlom, D.G. Ferroelectricity in nonstoichiometric SrTiO3 films studied by ultraviolet Raman spectroscopy. Appl. Phys. Lett. 2010, 97, 142901. [Google Scholar] [CrossRef] [Green Version]
  58. Gupta, S.; Katiyar, R.S. Temperature-dependent structural characterization of sol-gel deposited strontium titanate (SrTiO3) thin films using Raman spectroscopy. J. Raman Spectrosc. 2001, 32, 885–891. [Google Scholar] [CrossRef]
  59. Akimov, I.A.; Sirenko, A.A.; Clark, A.M.; Hao, J.H.; Xi, X.X. Electric-Field-Induced Soft-Mode Hardening in SrTiO3 Films. Phys. Rev. Lett. 2000, 84, 4625–4628. [Google Scholar] [CrossRef]
  60. Waser, R.; Smith, D.M. Ferroelectric Thin Films: Synthesis and Basic Properties. In Ferroelectric Thin Films: Synthesis and Basic Properties; De Araujo, C.P., Scott, J.F., Taylor, G.W., Eds.; Gordon and Breach: Amsterdam, The Netherlands, 1996; p. 47. [Google Scholar]
  61. Ranson, P.; Ouillon, R.; Pruzan, P.; Mishra, S.K.; Ranjan, R.; Pandey, D. The various phases of the system Sr1–xCaxTiO3—A Raman scattering study. J. Raman Spectrosc. 2005, 36, 898–911. [Google Scholar] [CrossRef]
  62. Du, Y.L.; Chen, G.; Zhang, M.S. Investigation of structural phase transition in polycrystalline SrTiO3 thin films by Raman spectroscopy. Solid State Commun. 2004, 130, 577–580. [Google Scholar] [CrossRef]
  63. Ostapchuk, T.; Petzelt, J.; Železny, V.; Pashkin, A.; Pokorny, J.; Drbohlav, I.; Kužel, R.; Rafaja, D.; Gorshunov, B.P.; Dressel, M.; et al. Origin of soft-mode stiffening and reduced dielectric response in SrTiO3 thin films. Phys. Rev. B 2002, 66, 235406. [Google Scholar] [CrossRef] [Green Version]
  64. Evarestov, R.; Blokhin, E.; Gryaznov, D.; Kotomin, E.A.; Merkle, R.; Maier, J. Jahn-Teller effect in the phonon properties of defective SrTiO3 from first principles. Phys. Rev. B 2012, 85, 174303. [Google Scholar] [CrossRef]
  65. Lutz, H.D.; Eckers, W.; Haeuseler, H. OH Stretching Frequencies of Solid Hydroxides and of Free OH Ions. J. Mol. Struct. 1982, 80, 221–224. [Google Scholar] [CrossRef]
  66. Pieczka, A.; Ertl, A.; Gołȩbiowska, B.; Jeleń, P.; Kotowski, J.; Nejbert, K.; Stachowicz, M.; Giester, G. Crystal structure and Raman spectroscopic studies of OH stretching vibrations in Zn-rich fluor-elbaite. Am. Mineral. 2020, 105, 1622–1630. [Google Scholar] [CrossRef]
  67. Wang, Z.; Pakoulev, A.; Pang, Y.; Dlott, D.D. Vibrational Substructure in the OH Stretching Transition of Water and HOD. J. Phys. Chem. A 2004, 108, 9054–9063. [Google Scholar] [CrossRef]
  68. Libowitzky, E. Correlation of O-H Stretching Frequencies and O-H…O Hydrogen Bond Lengths. Monatsh. Chem. 1999, 130, 1047–1059. [Google Scholar] [CrossRef]
Figure 1. STO film with a faceted surface and with adsorbed water molecules at the “Ridge” site on both sides of the film (green, red, white, and gray balls are strontium, oxygen, hydrogen, and titanium atoms, respectively) [6]. The Sr-O bonds are not shown. The picture on the right is obtained by 90° rotation the left picture. The empty squares are oxygen vacancies. Hydrogen atoms originally belonged to water molecules adsorbed on the STO surface: H1 is a hydrogen atom still attached to the oxygen atom of the former water molecule, while H2 is the hydrogen atom that attached to the host oxygen atom removed from the surface (partial oxygen reduction).
Materials 15 04233 g001
Figure 3. Examples of modes (image on the left −116.04 cm 1 , on the right −150.35 cm 1 ) with specific patterns of STO film with stepped surface. Modes are visualized as vectors of vibrational amplitudes. The green, red, white, and gray balls are strontium, oxygen, hydrogen, and titanium atoms, respectively. The lower figures are given for a better view of the pattern of vibrational amplitudes of the stepped STO film: the atoms there are omitted.
Materials 15 04233 g003
Figure 4. A faceted surface of STO film with adsorbed water molecules (left side, see also Figure 1) and representation of the mode (right side) of 102.15 cm 1 , which may be related to the possibility of recovery the STO film surface from oxygen reduction. The green, red, white, and gray balls are strontium, oxygen, hydrogen, and titanium atoms, respectively. The Sr-O bonds are not shown. The empty squares are oxygen vacancies.
Materials 15 04233 g004
Figure 5. Raman spectrum of the STO film with stepped surface and with adsorbed derivatives of water molecules at the “Ridge” site on both sides of the film.
Materials 15 04233 g005
Publisher’s Note: MDPI stays neutral with regard to jurisdictional claims in published maps and institutional affiliations.

