
Effect of Water–Ethanol Extraction as Pre-Treatment on the Adsorption Properties of Aloe vera Waste

 , , , and
Abstract
:1. Introduction
2. Materials and Methods
2.1. Chemicals
2.2. Bio-Adsorbent Preparation
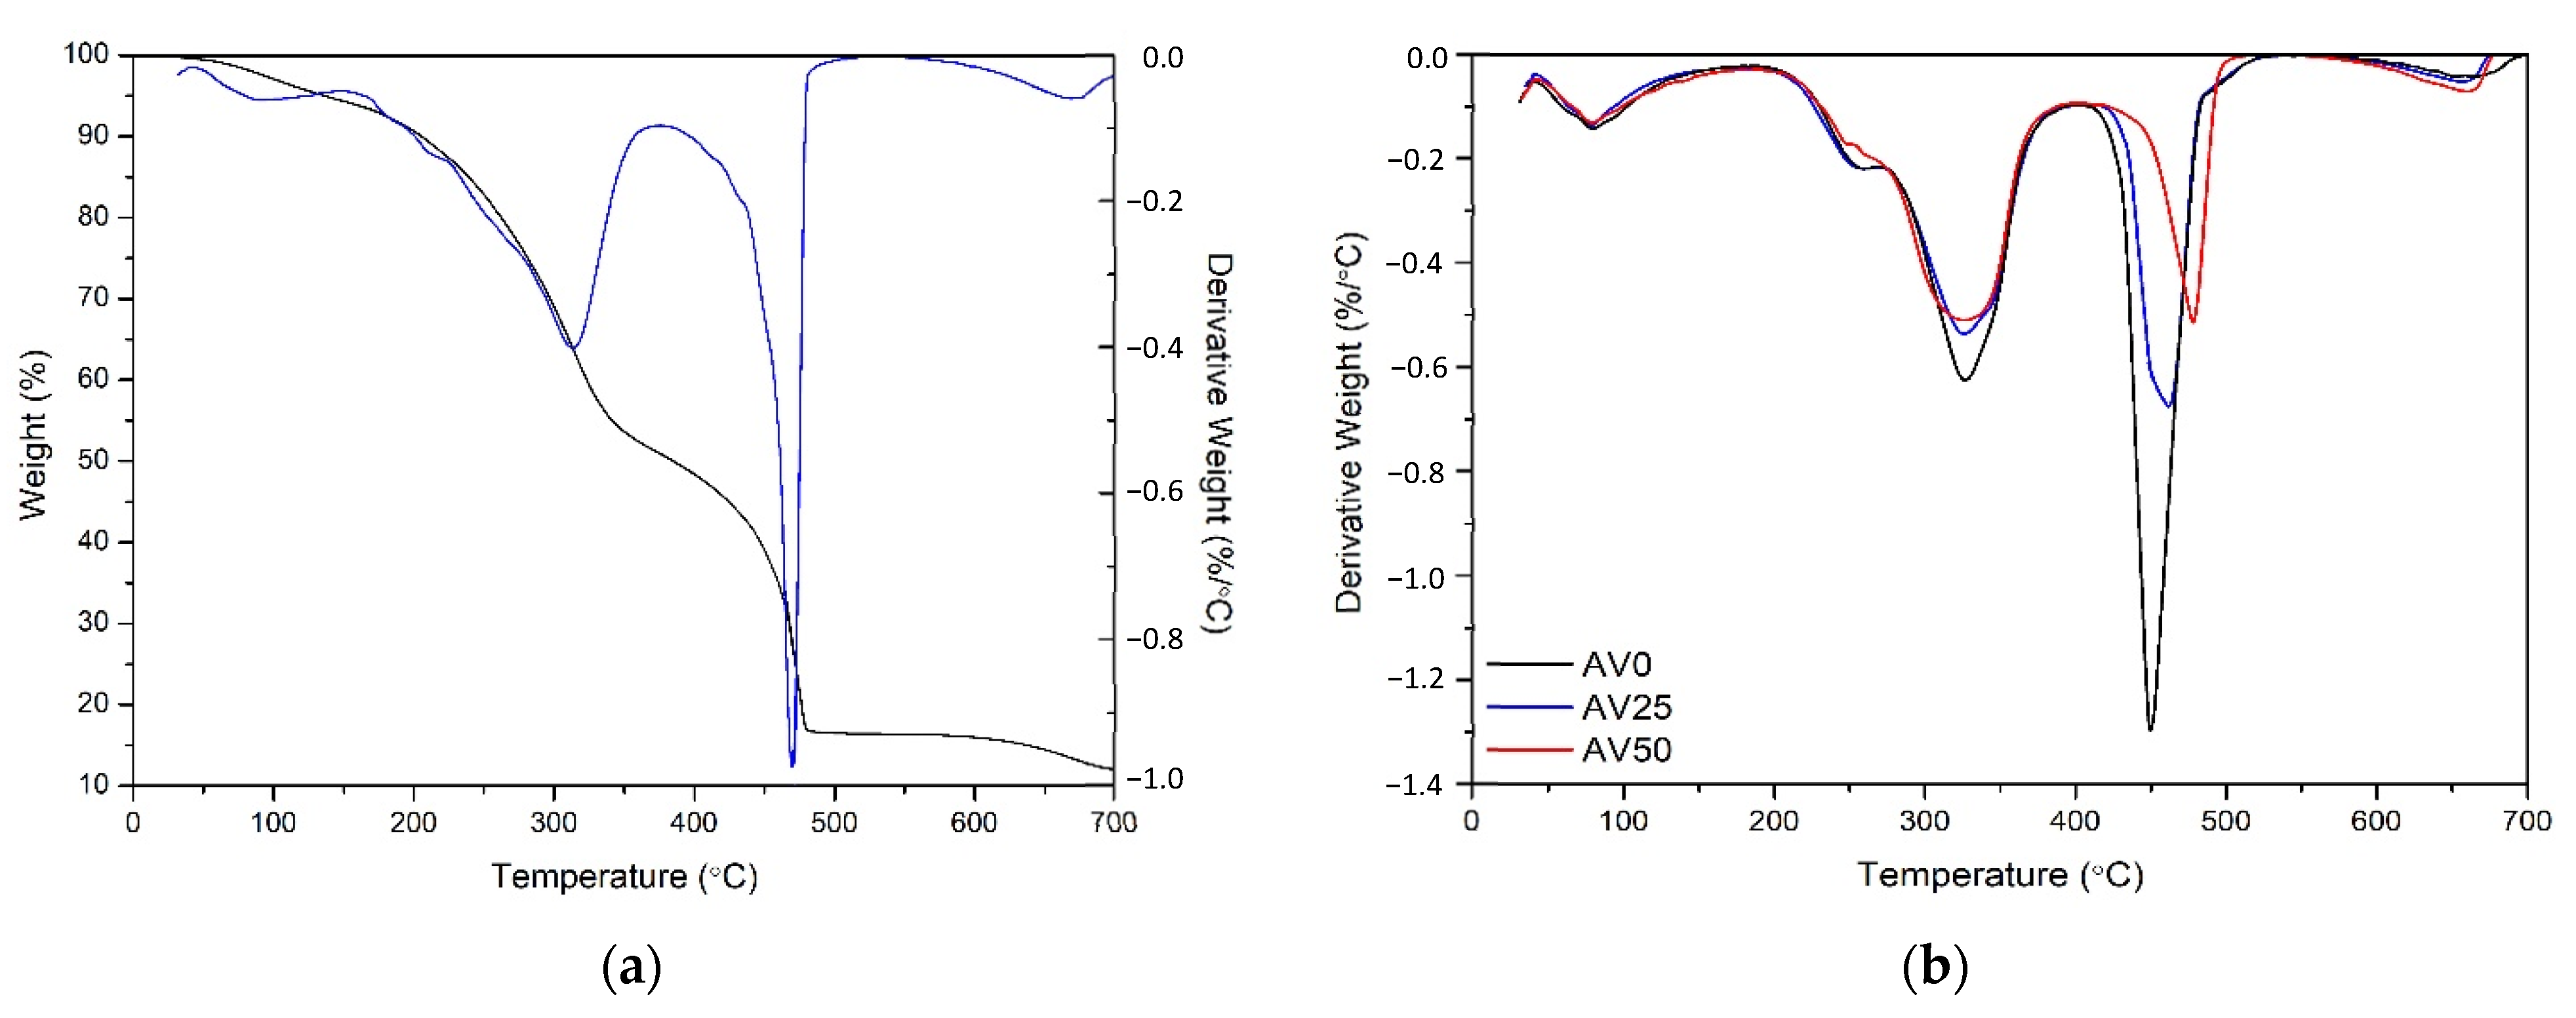
2.3. Bio-Adsorbent Characterization
2.4. Batch Tests
2.4.1. Equilibrium Tests
2.4.2. Kinetic Tests
3. Results and Discussion
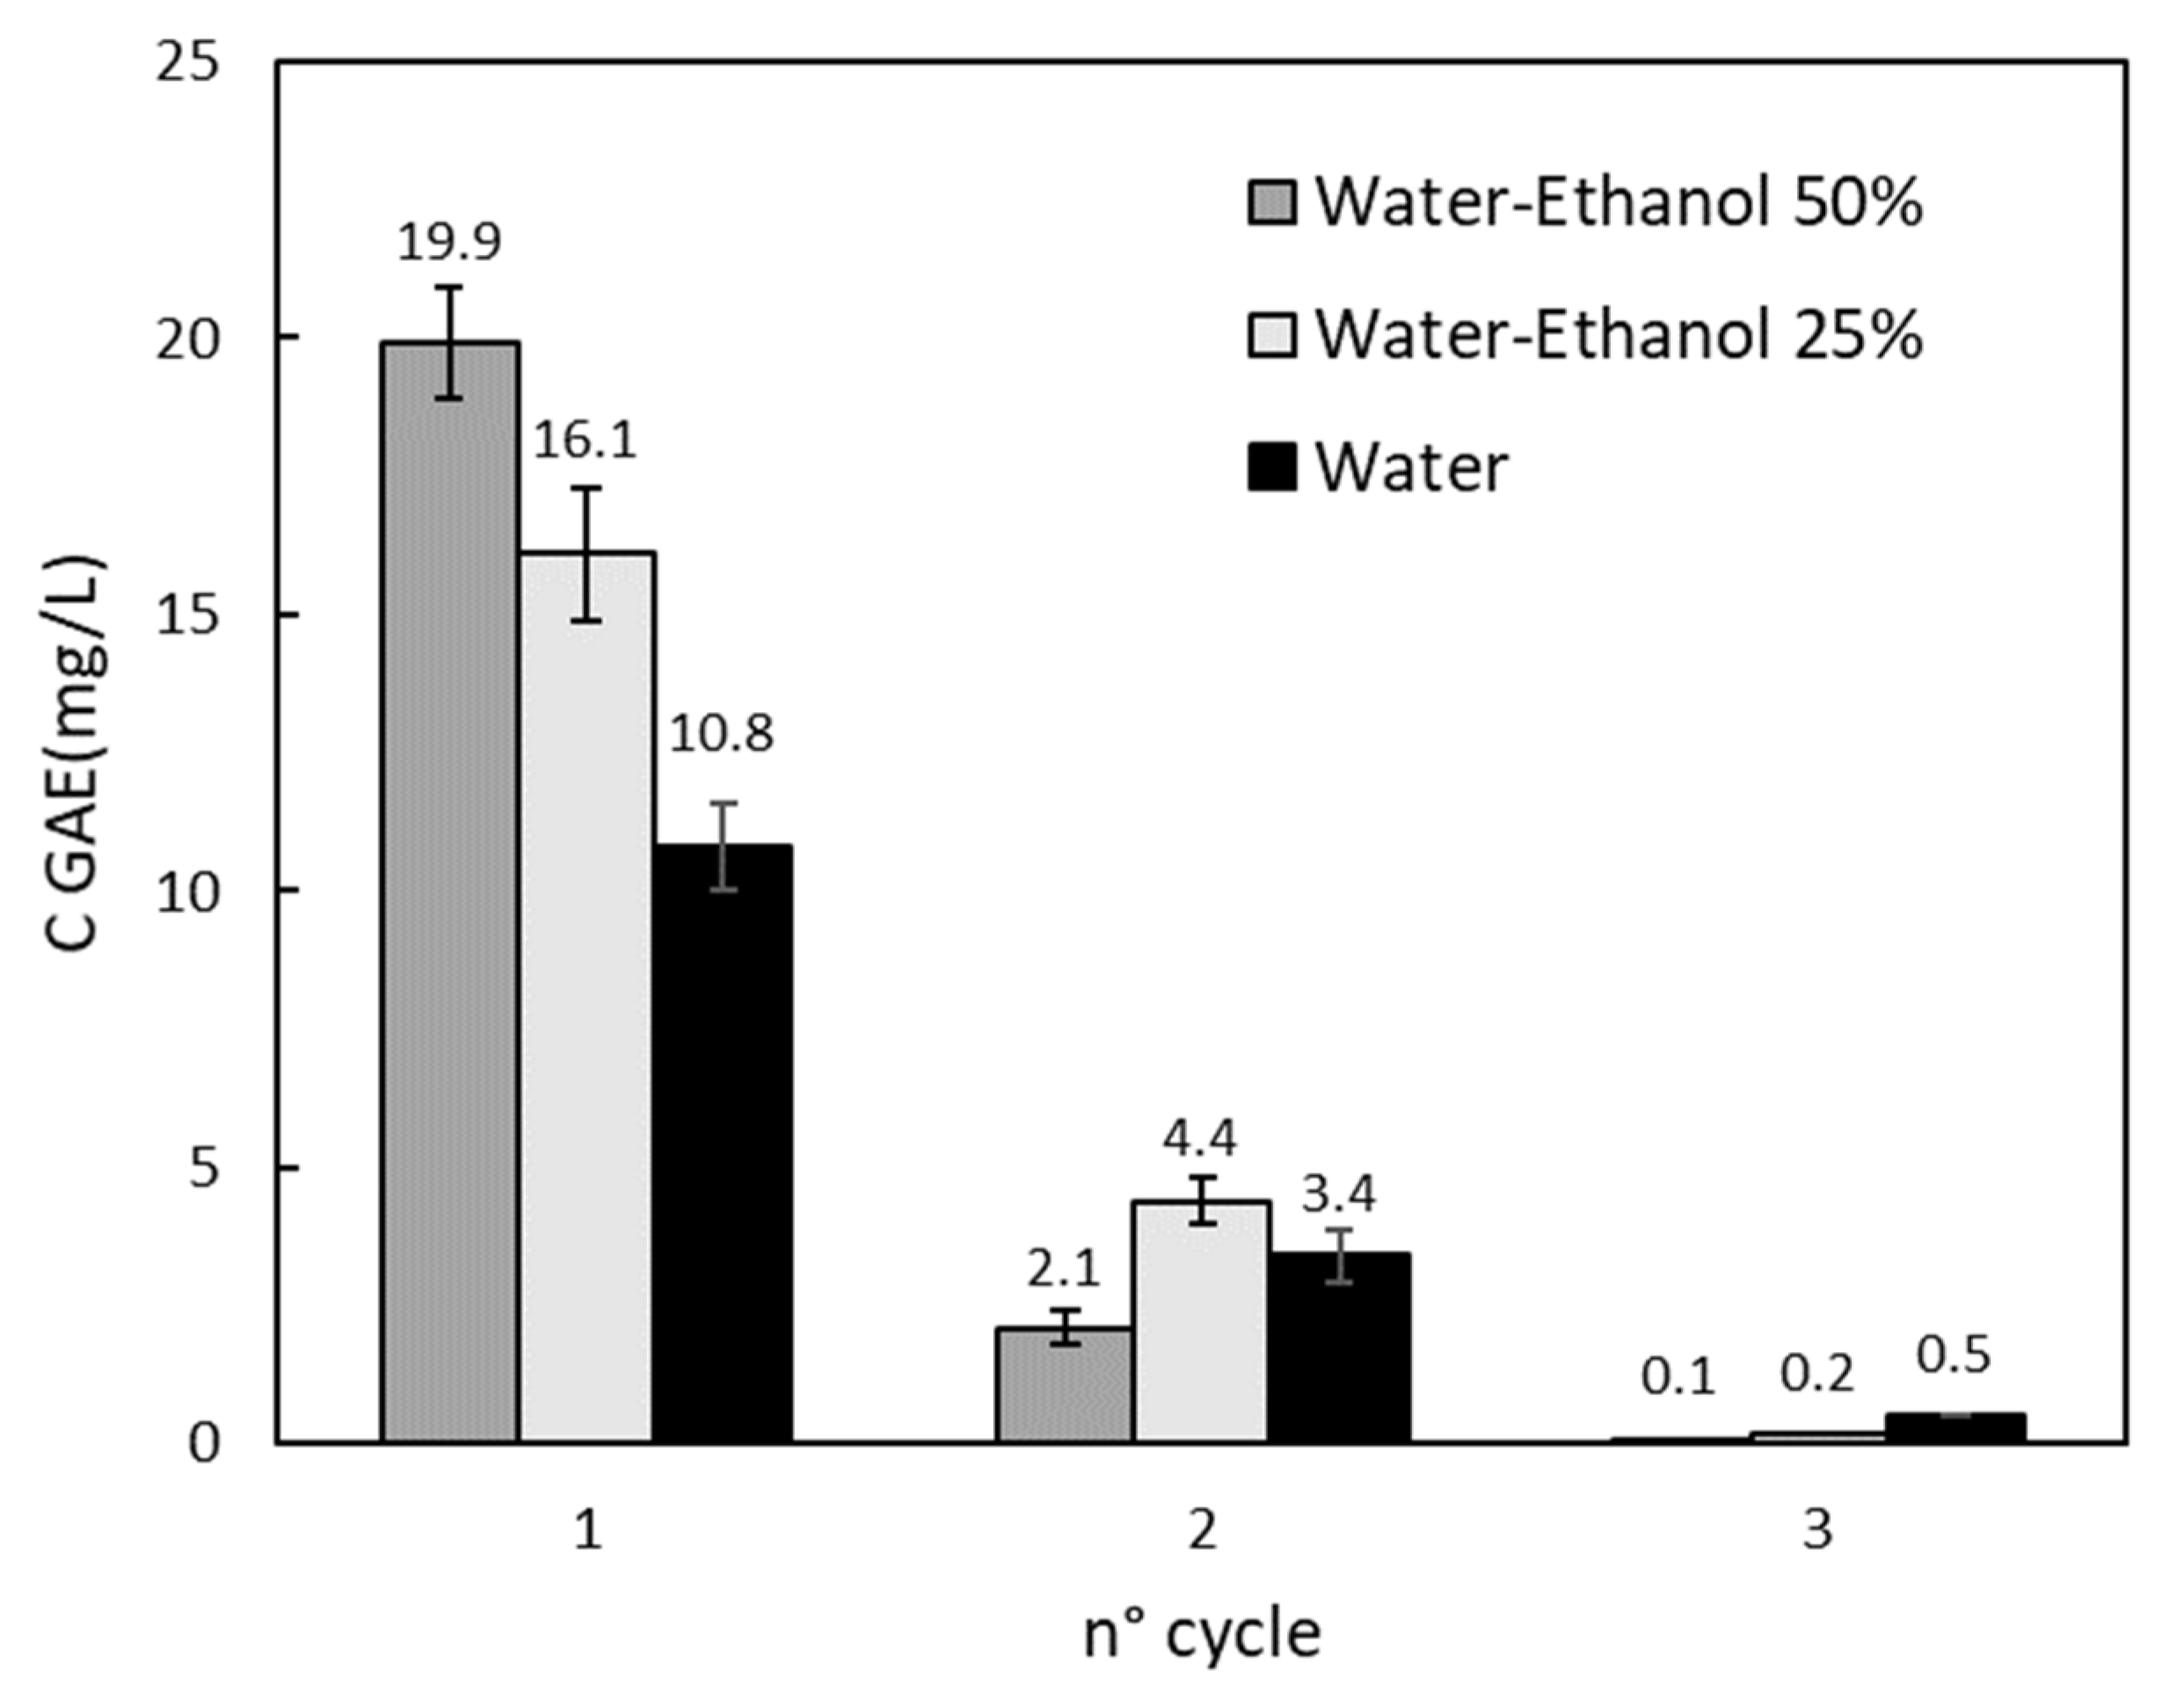
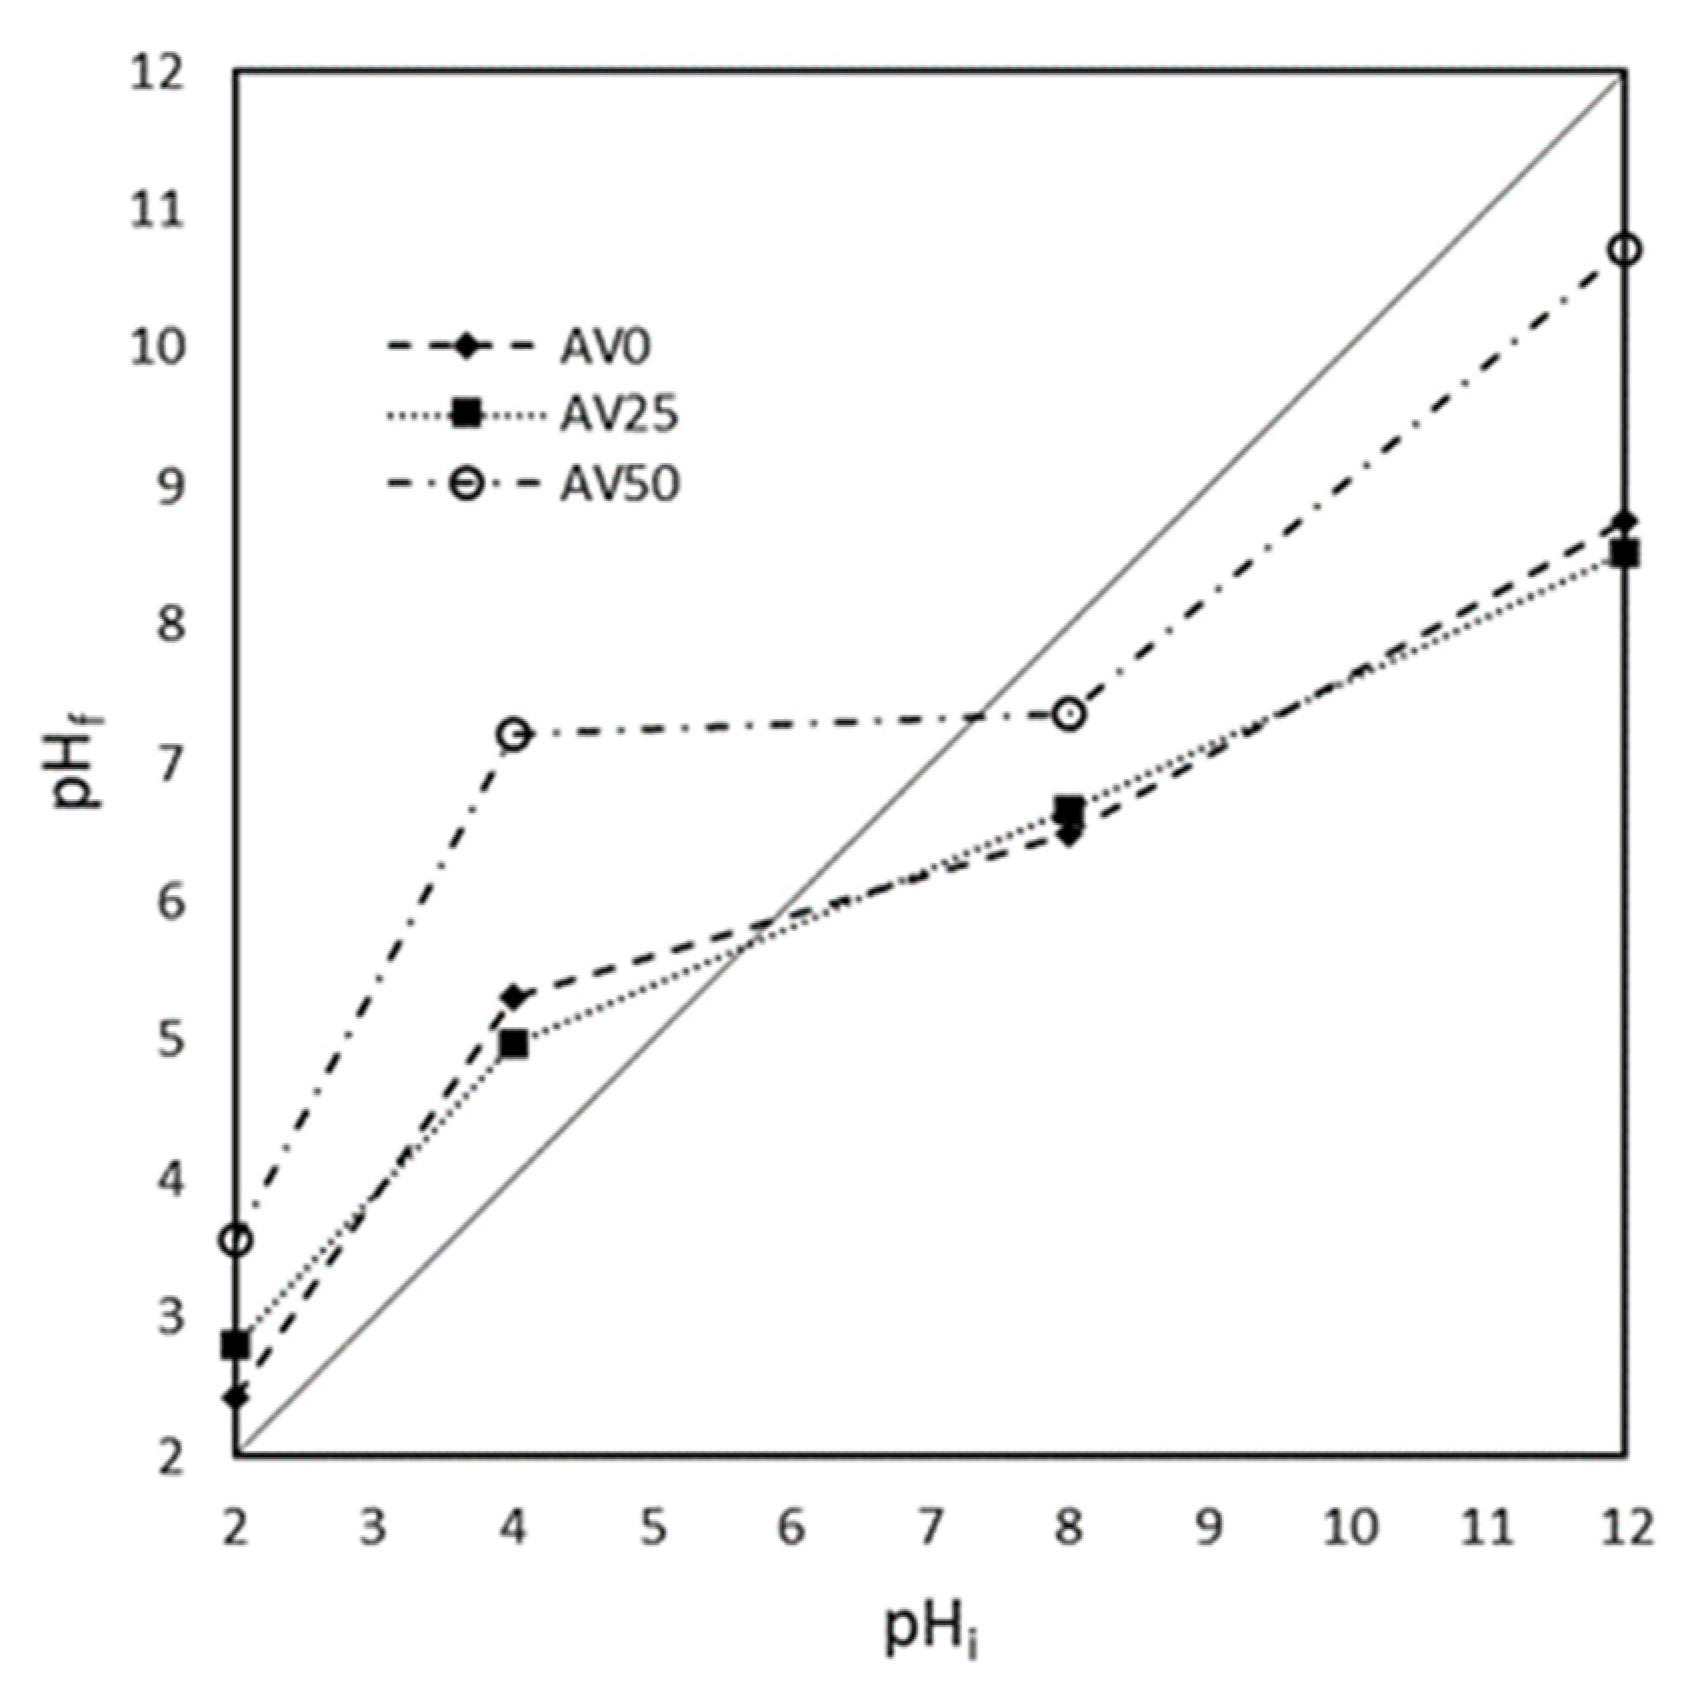
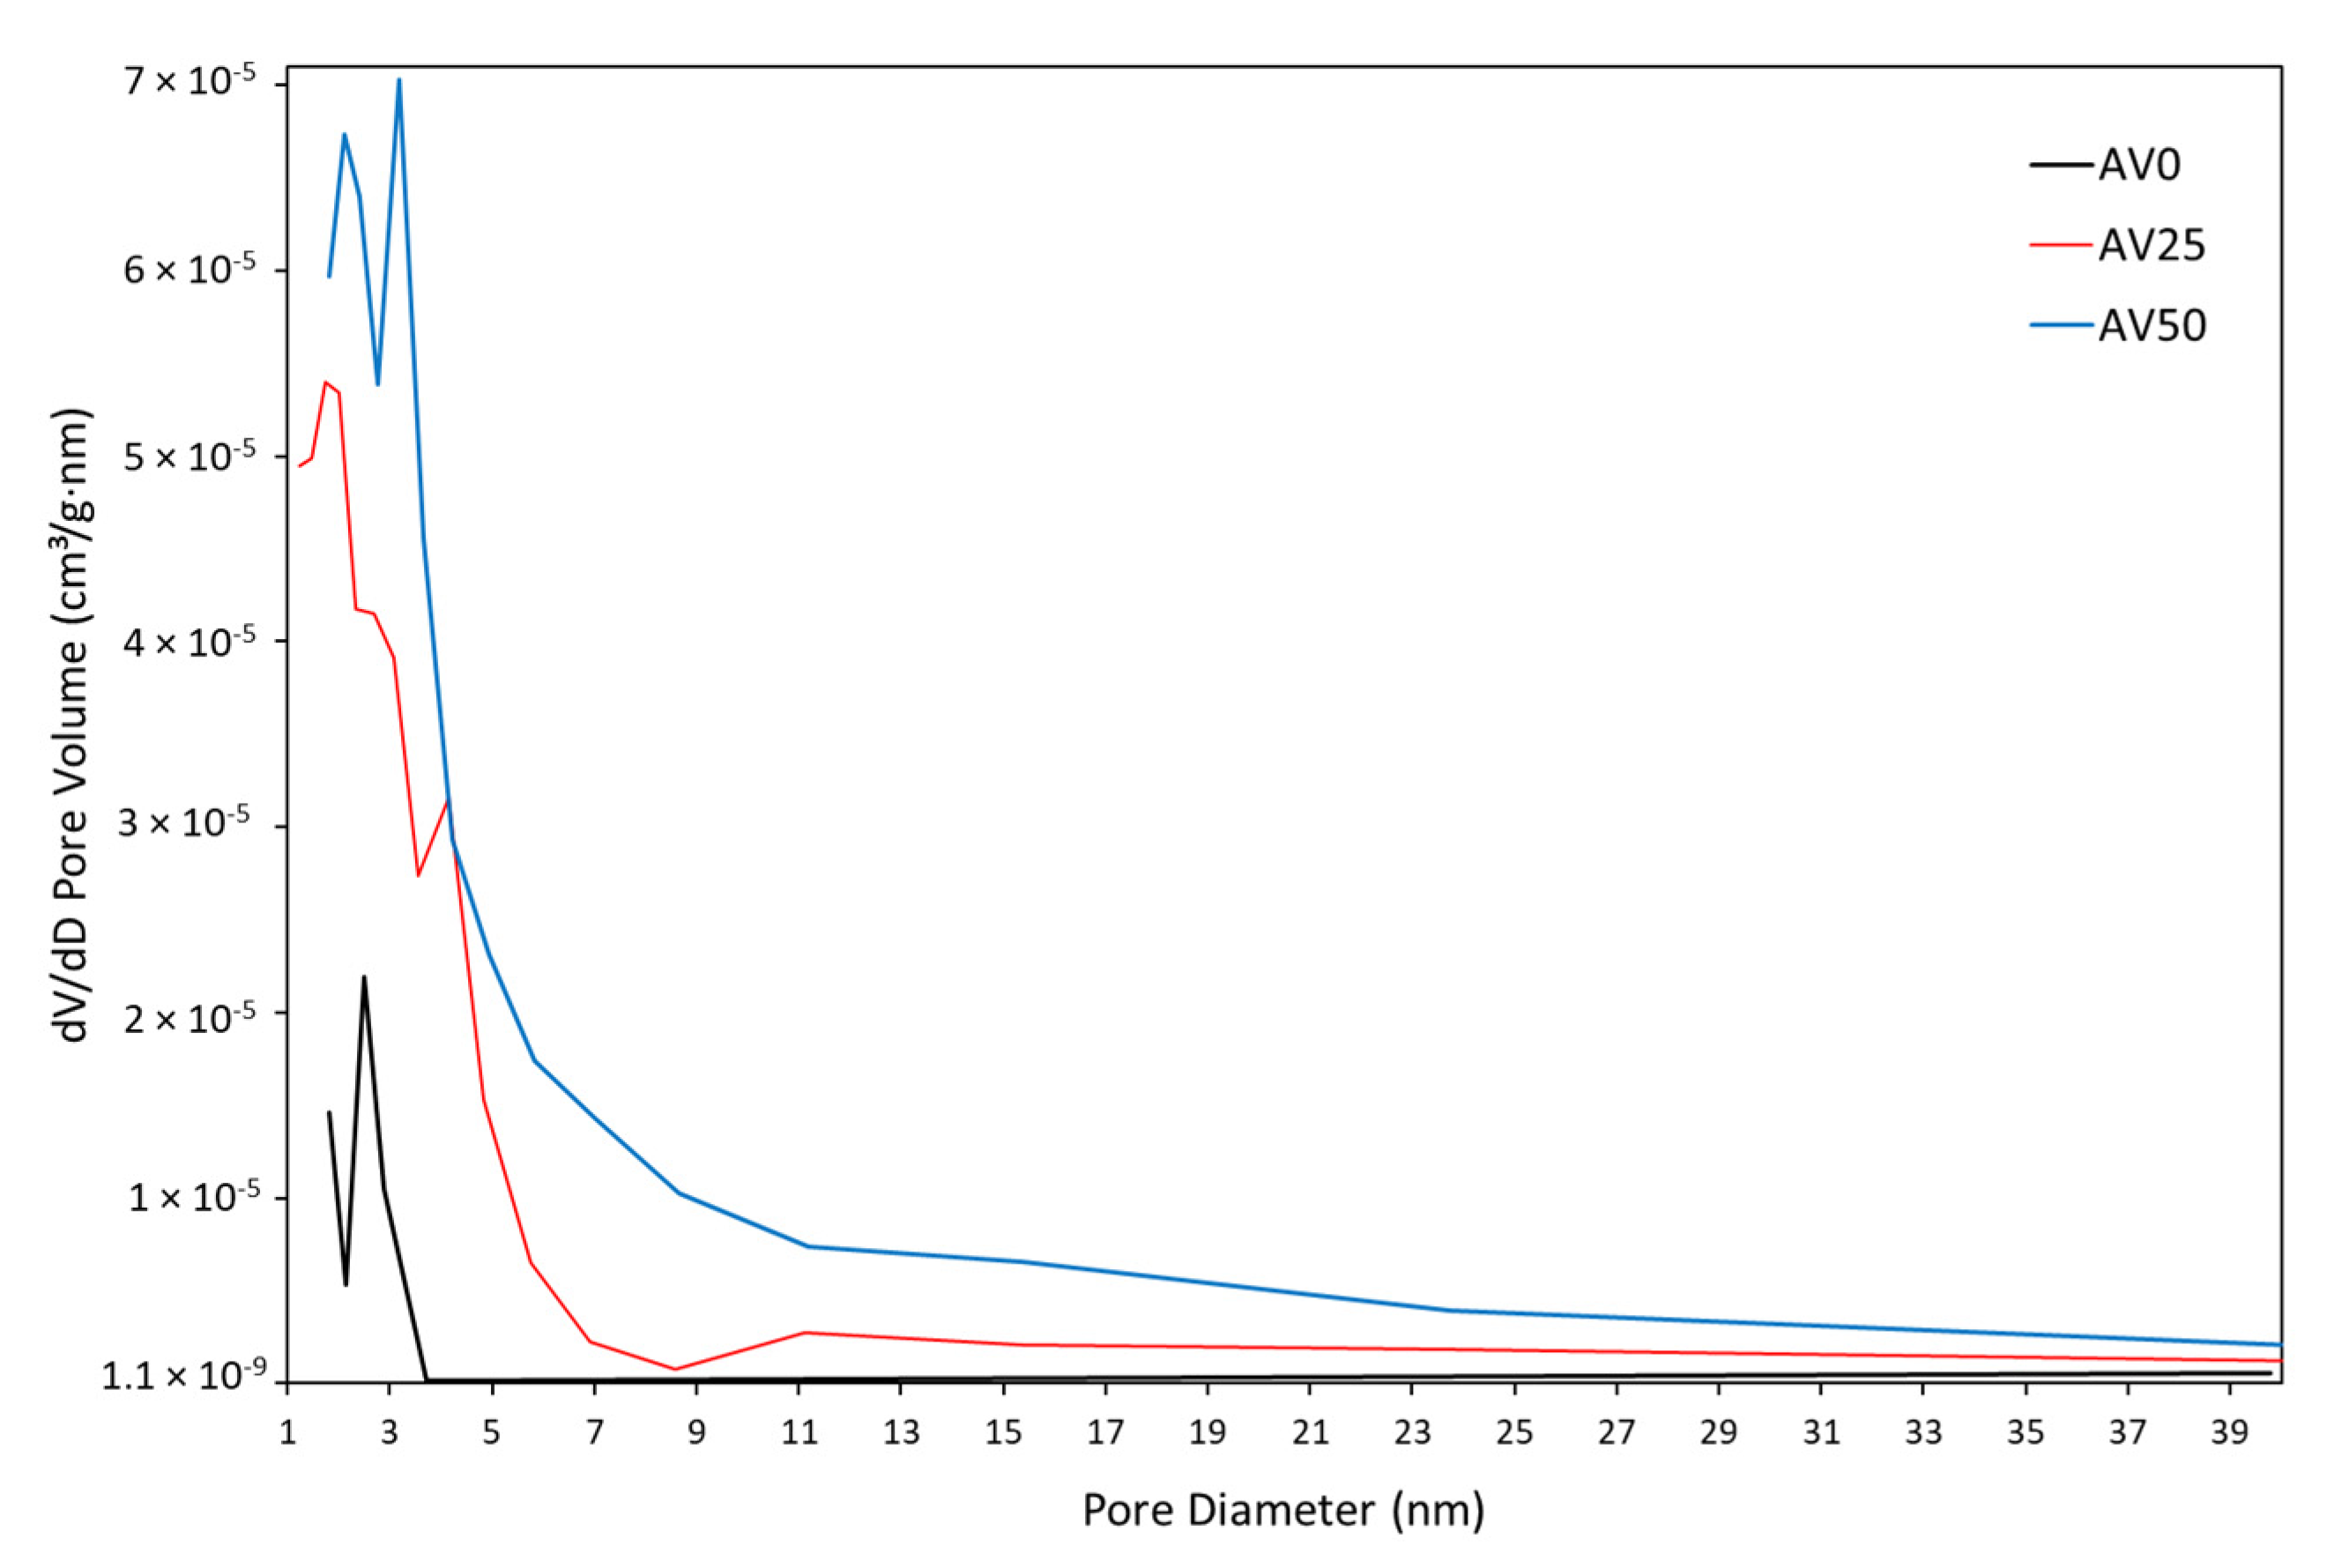
3.1. Bio-Adsorbent Pre-Treatment
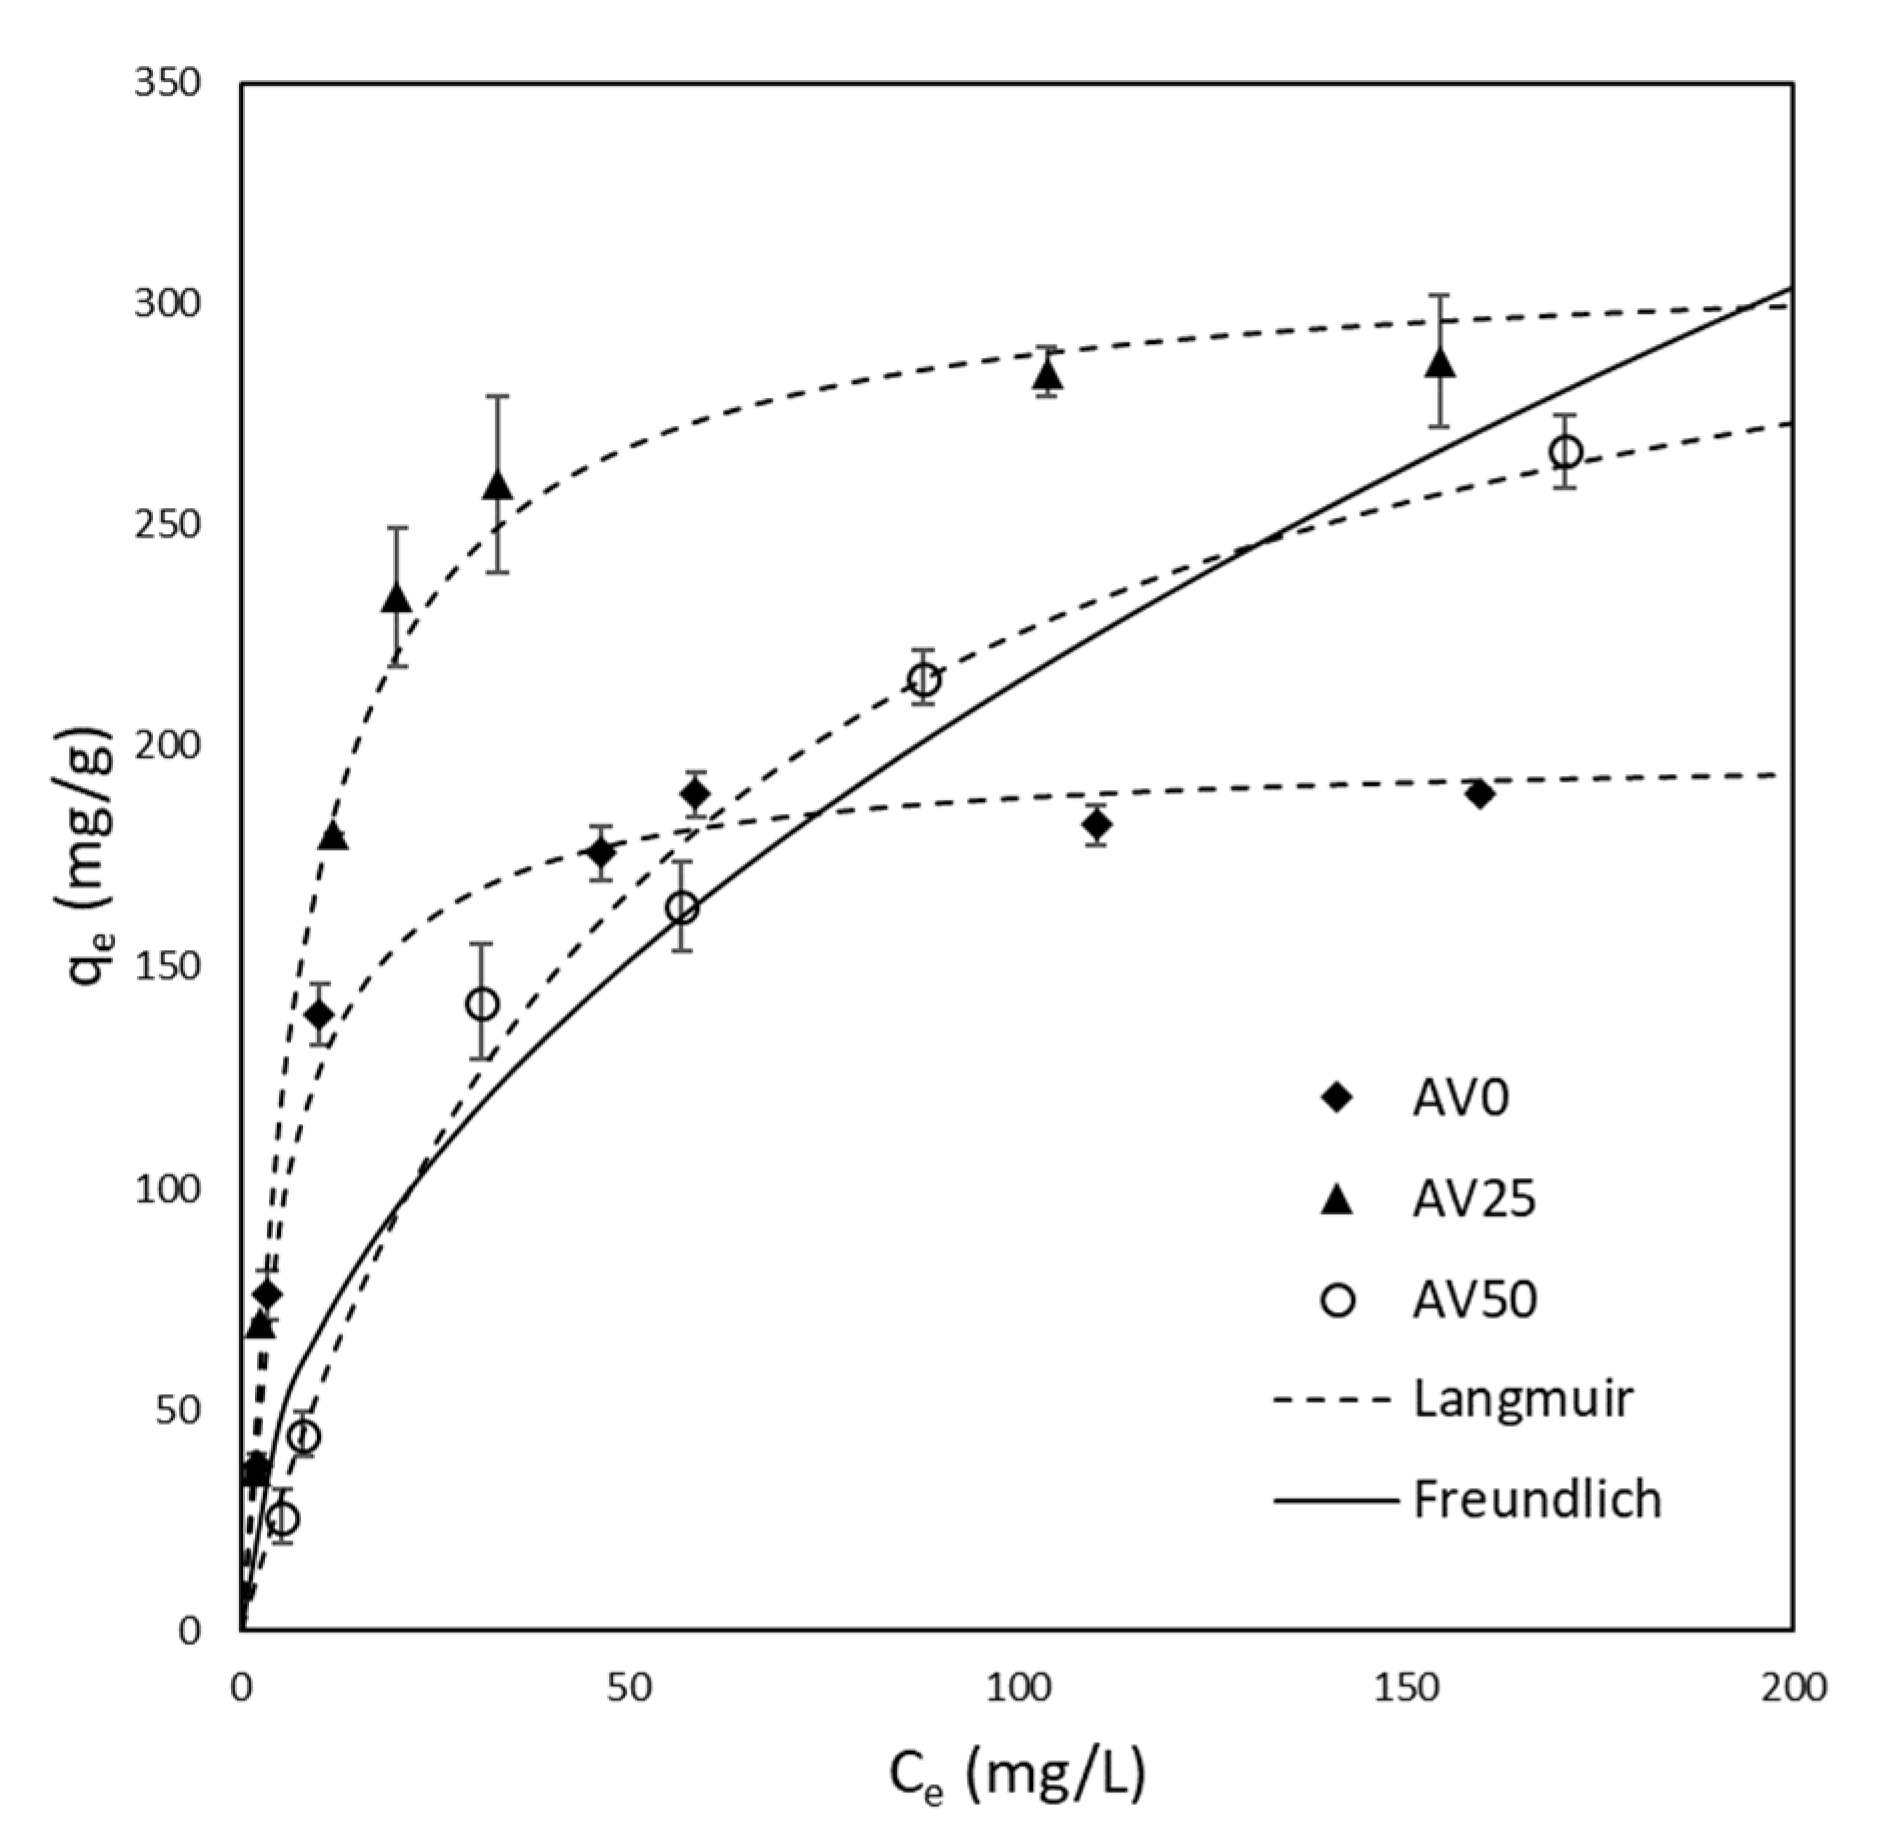
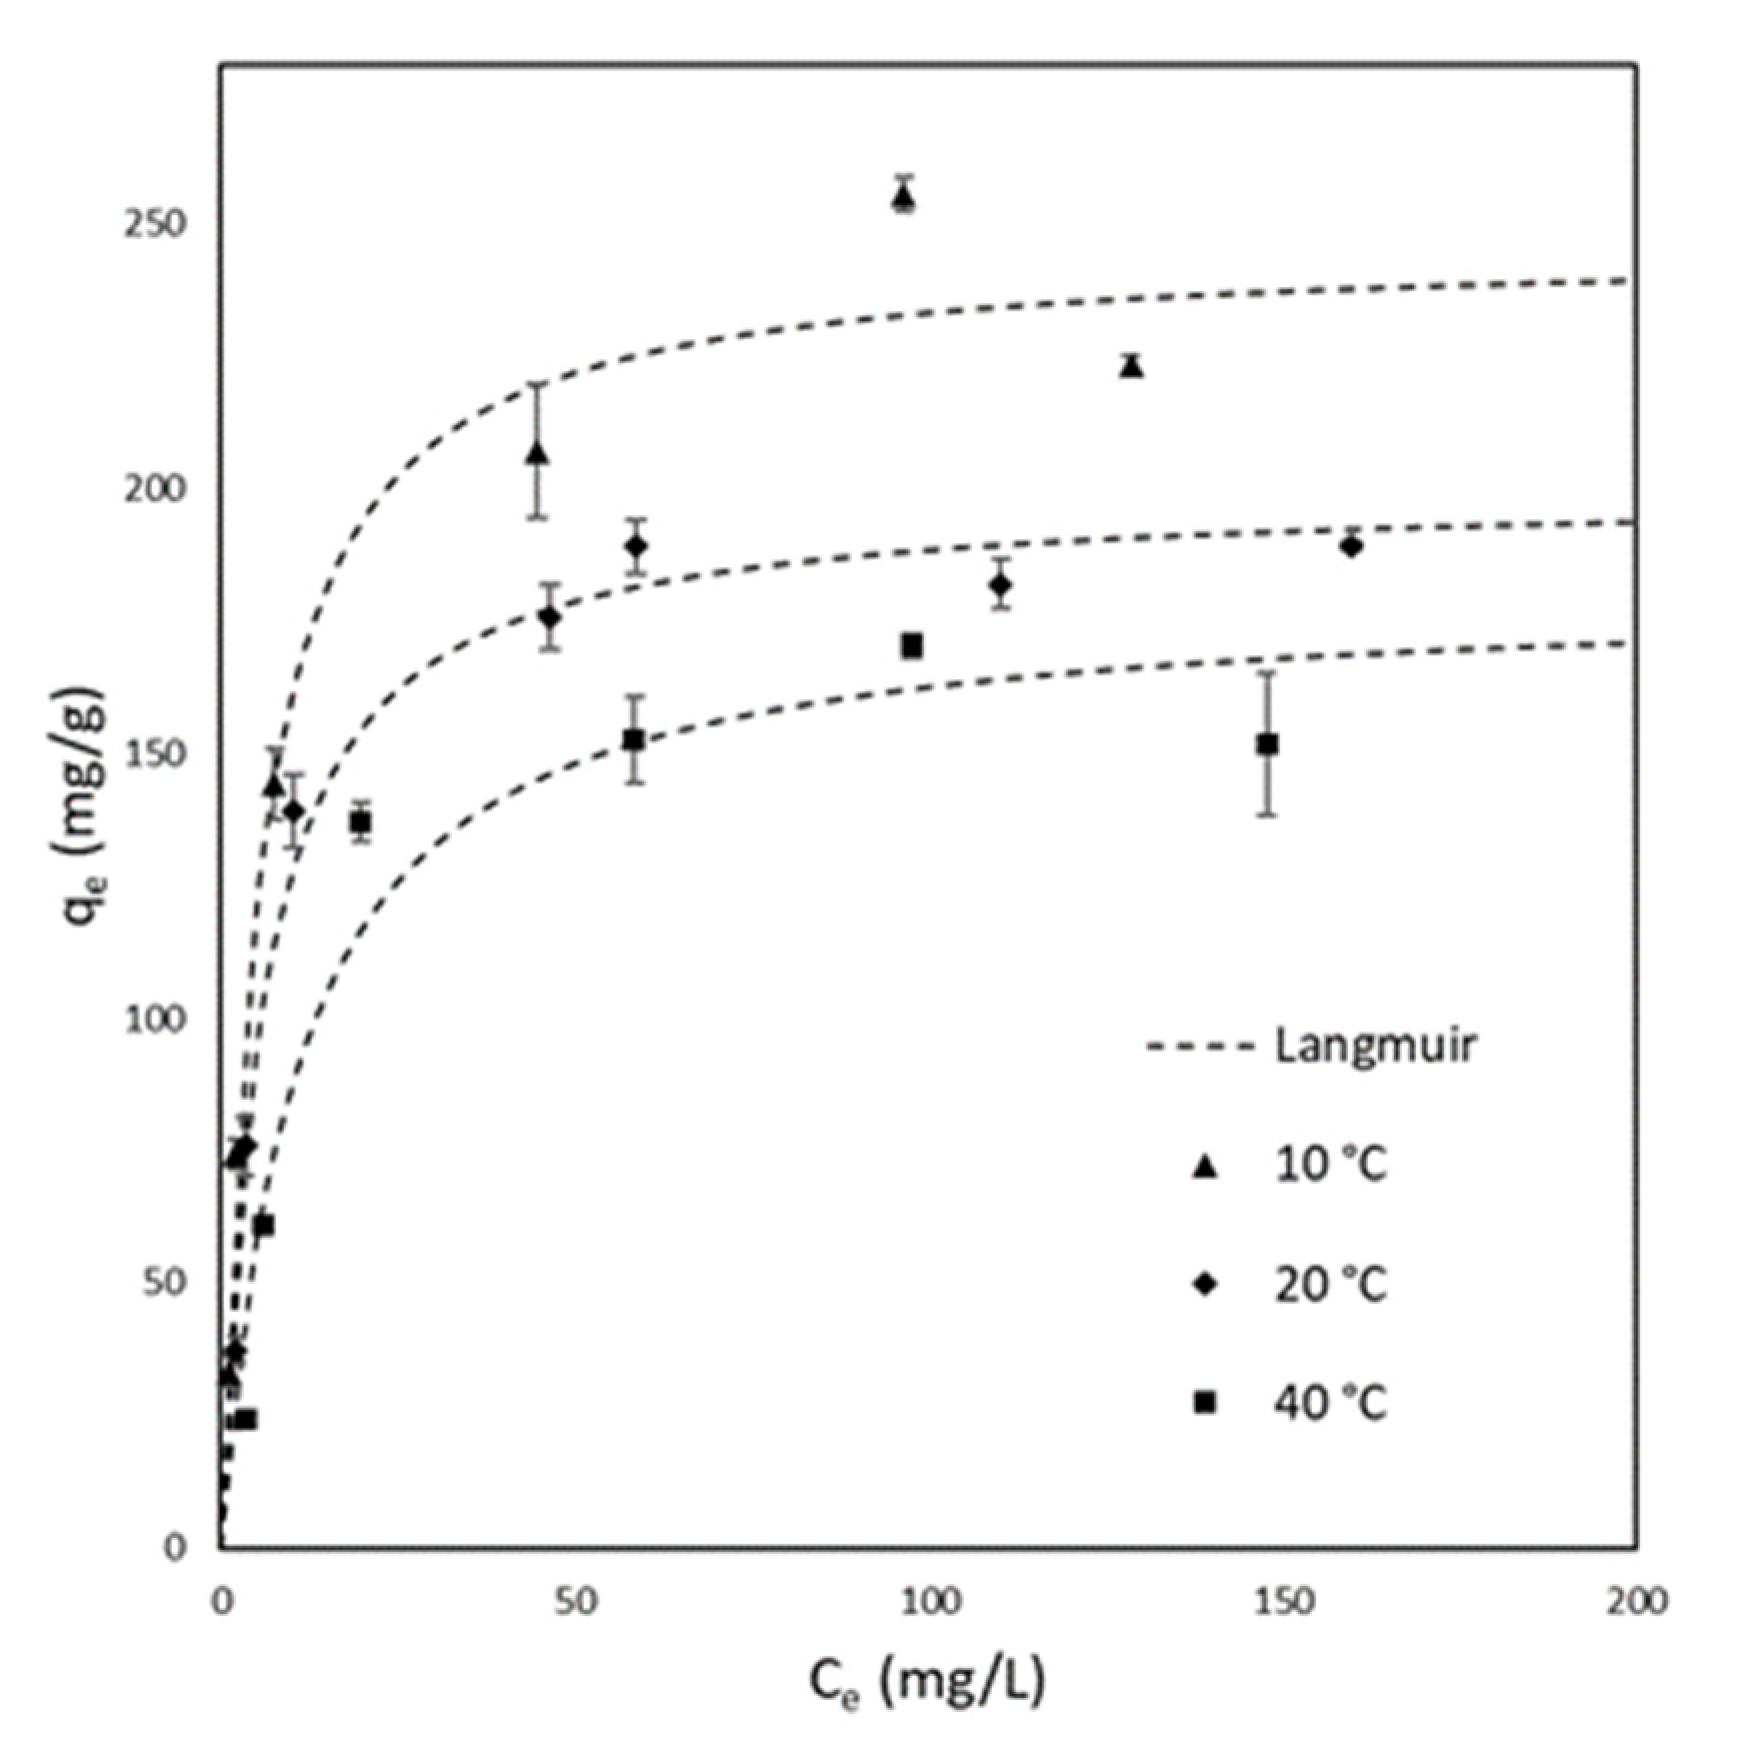
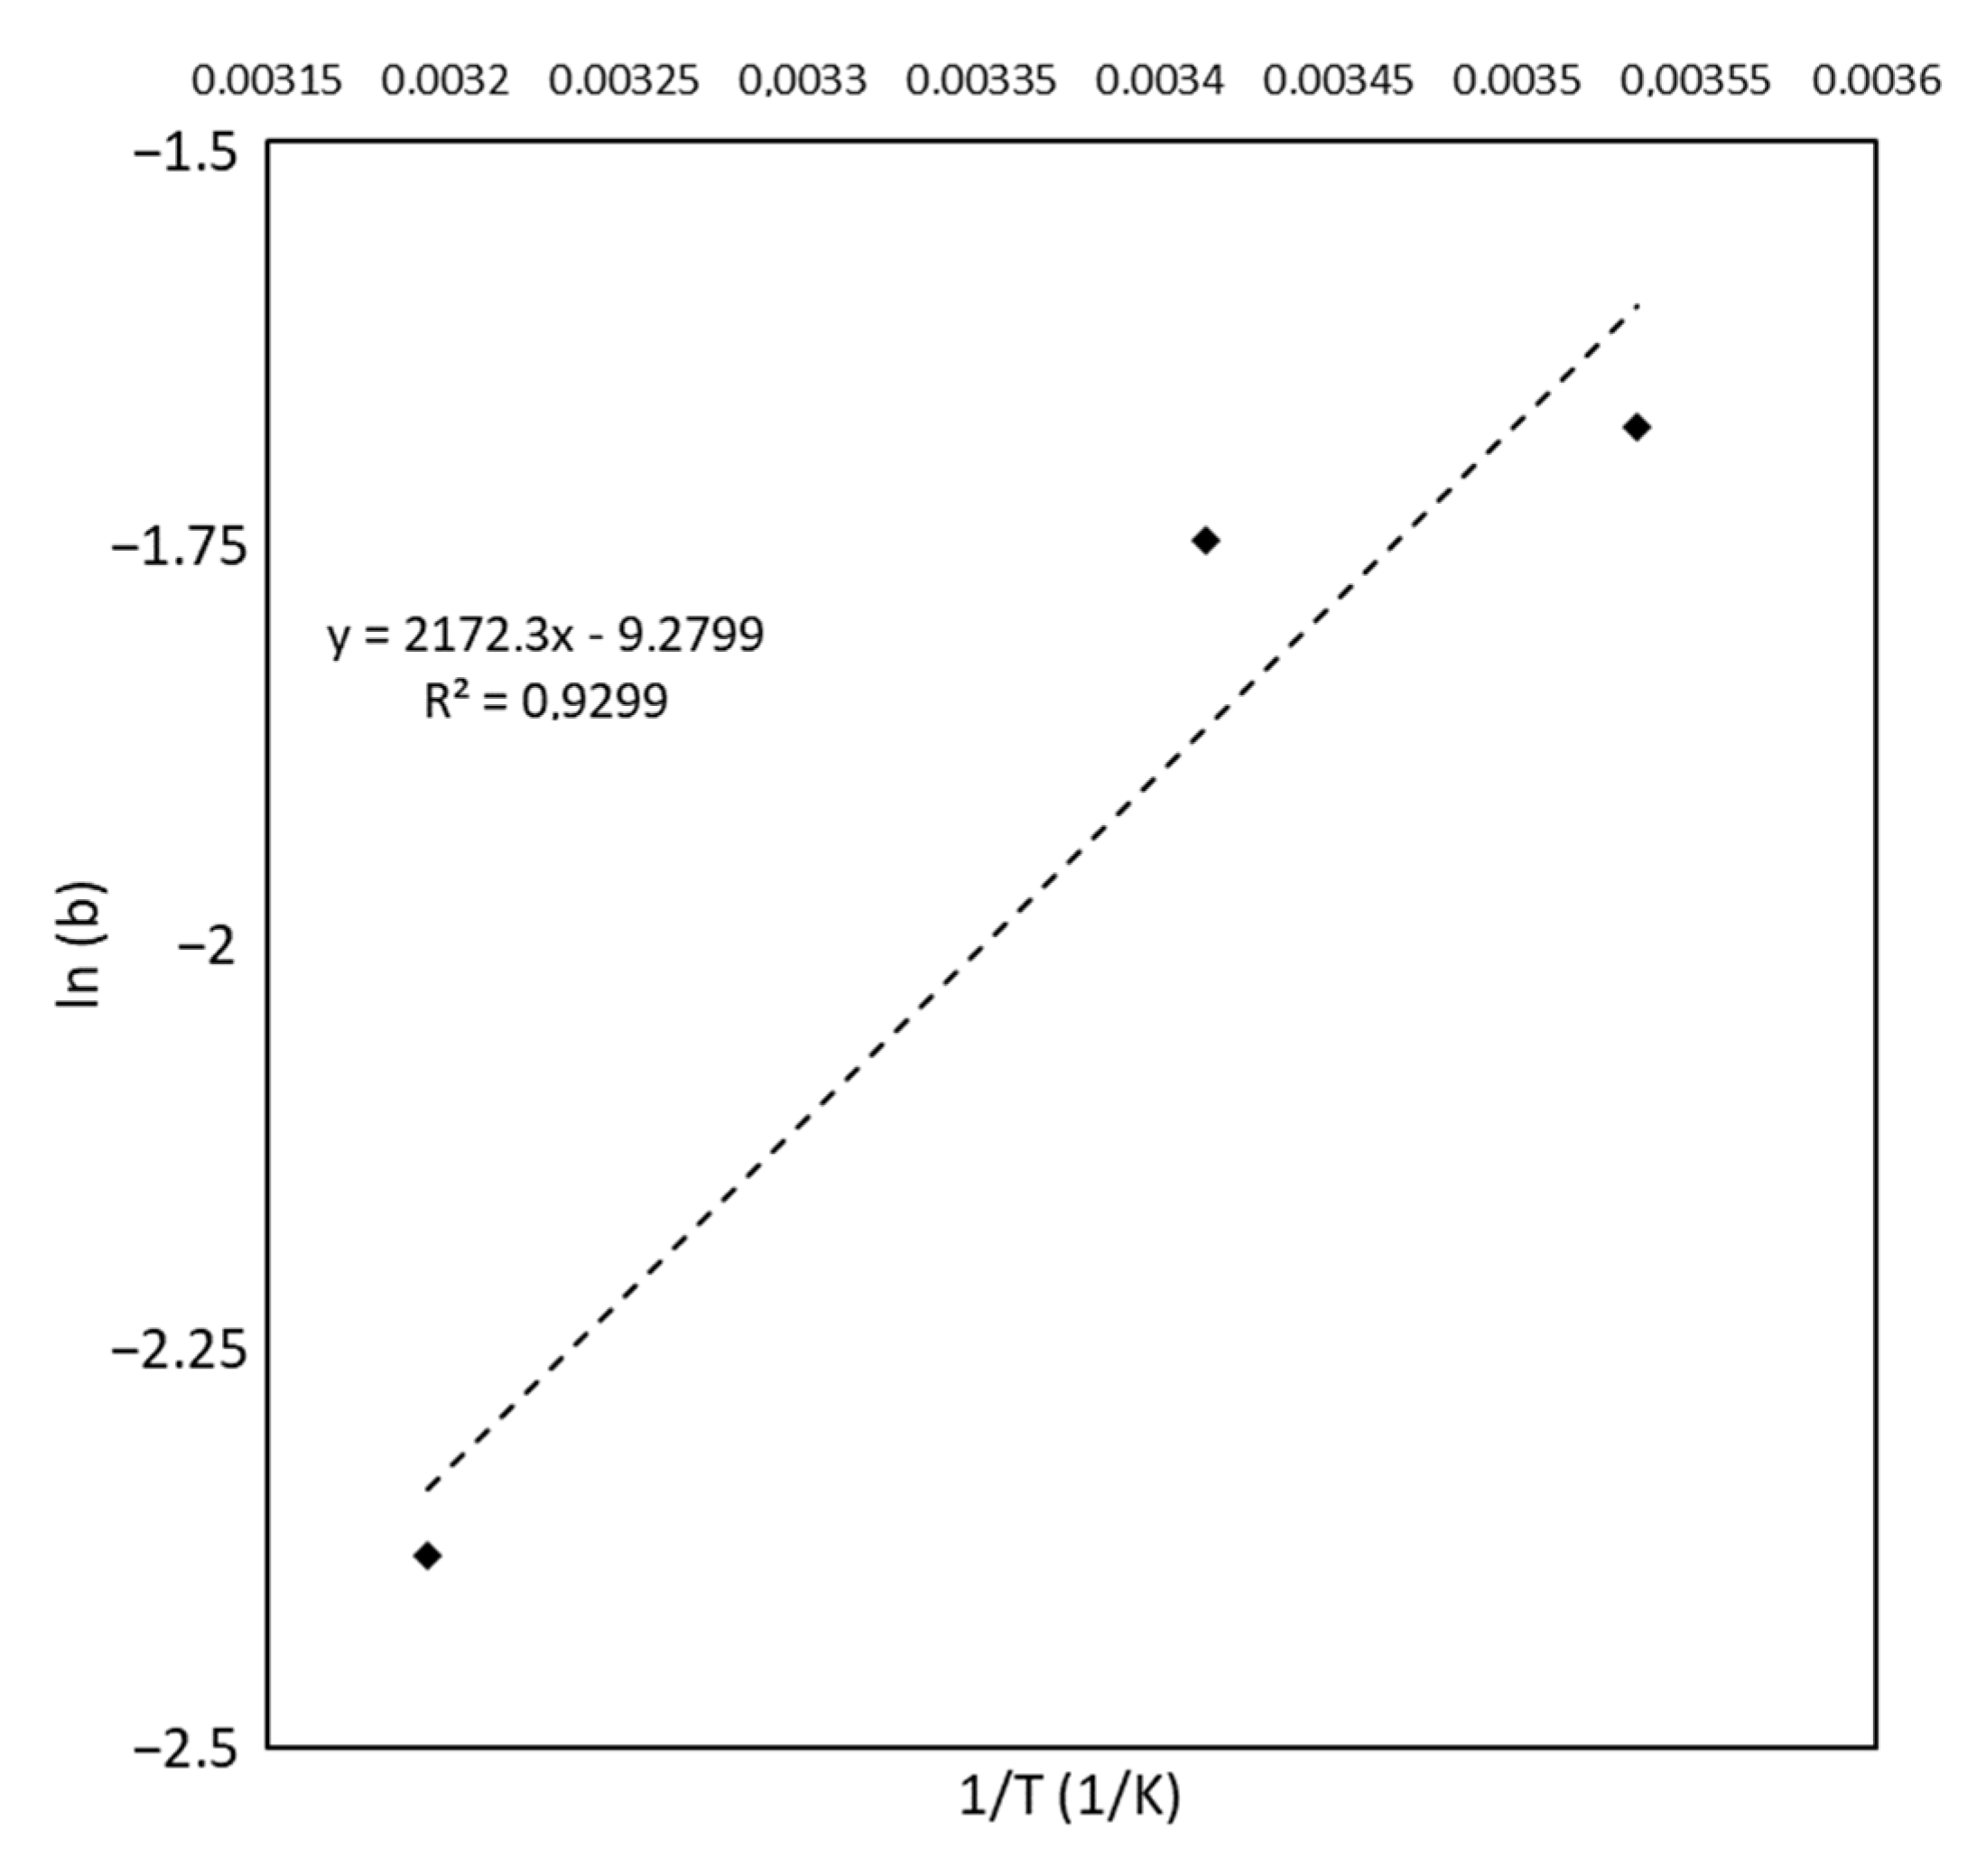
3.2. Equilibrium
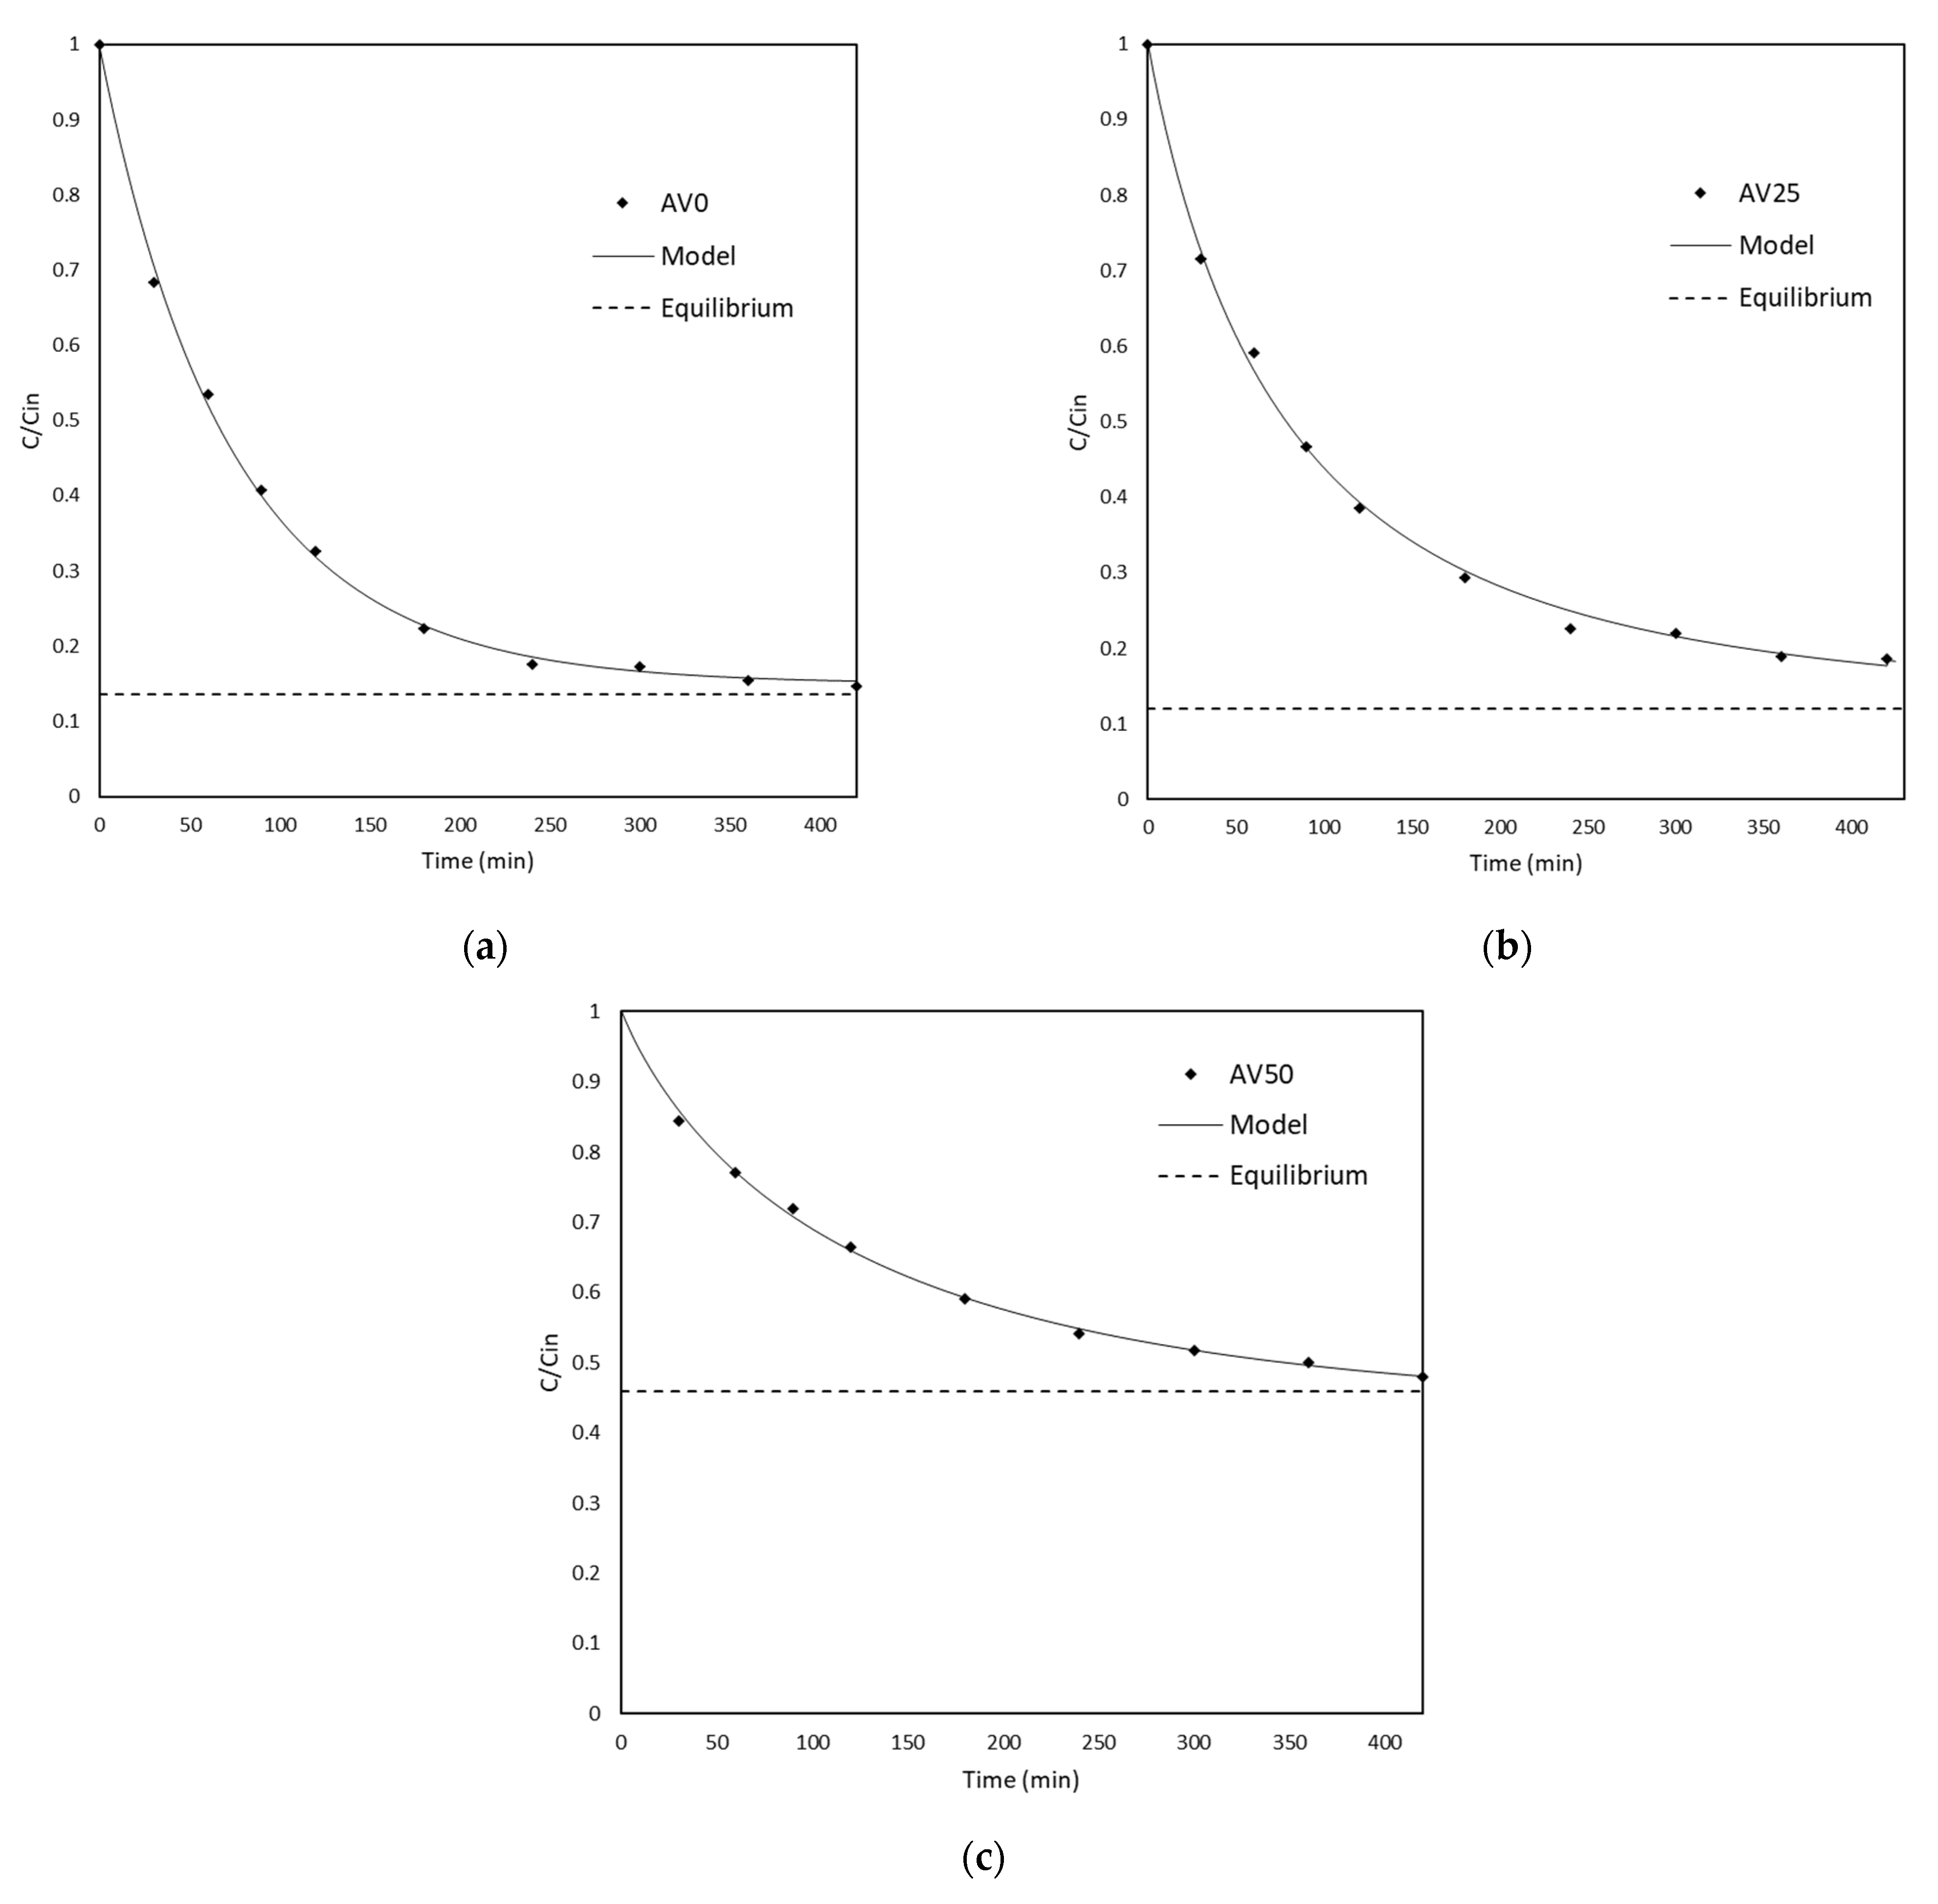
3.3. Kinetic Tests
- isothermal conditions;
- the batch system was perfectly mixed;
- solid particles were assumed to be spherical with a constant radius;
- equilibrium conditions were assumed at the solid–liquid interface.
4. Conclusions
Supplementary Materials
Author Contributions
Funding
Institutional Review Board Statement
Informed Consent Statement
Data Availability Statement
Conflicts of Interest
References
- Sardar, M.; Manna, M.; Maharana, M.; Sen, S. Remediation of Dyes from Industrial Wastewater Using Low-Cost Adsorbents. Environ. Chem. Sustain. World Green Adsorbents Remove Met. Dye. Boron Polluted Water 2021, 49, 377–403. [Google Scholar] [CrossRef]
- Rafatullah, M.; Sulaiman, O.; Hashim, R.; Ahmad, A. Adsorption of methylene blue on low-cost adsorbents: A review. J. Hazard. Mater. 2010, 177, 70–80. [Google Scholar] [CrossRef] [PubMed]
- Tan, I.; Ahmad, A.; Hameed, B. Adsorption of basic dye on high-surface-area activated carbon prepared from coconut husk: Equilibrium, kinetic and thermodynamic studies. J. Hazard. Mater. 2008, 154, 337–346. [Google Scholar] [CrossRef] [PubMed]
- Panagopoulos, A.; Haralambous, K.-J. Minimal Liquid Discharge (MLD) and Zero Liquid Discharge (ZLD) strategies for wastewater management and resource recovery – Analysis, challenges and prospects. J. Environ. Chem. Eng. 2020, 8, 104418. [Google Scholar] [CrossRef]
- Panagopoulos, A.; Haralambous, K.-J. Environmental impacts of desalination and brine treatment—Challenges and mitigation measures. Mar. Pollut. Bull. 2020, 161, 111773. [Google Scholar] [CrossRef] [PubMed]
- Panagopoulos, A. Water-energy nexus: Desalination technologies and renewable energy sources. Environ. Sci. Pollut. Res. 2021, 28, 21009–21022. [Google Scholar] [CrossRef] [PubMed]
- Gupta, V.K. Suhas Application of low-cost adsorbents for dye removal—A review. J. Environ. Manag. 2009, 90, 2313–2342. [Google Scholar] [CrossRef]
- Schwarzenbach, R.P.; Egli, T.; Hofstetter, T.B.; Von Gunten, U.V.; Wehrli, B. Global Water Pollution and Human Health. Annu. Rev. Environ. Resour. 2010, 35, 109–136. [Google Scholar] [CrossRef]
- Sulyman, M.; Namiesnik, J.; Gierak, A. Low-cost Adsorbents Derived from Agricultural By-products/Wastes for Enhancing Contaminant Uptakes from Wastewater: A Review. Pol. J. Environ. Stud. 2017, 26, 479–510. [Google Scholar] [CrossRef]
- Mazzeo, L.; Bavasso, I.; Bracciale, M.P.; Cocchi, M.; Di Palma, L.; Piemonte, V. Yerba Mate (Ilex paraguarensis) as Bio-Adsorbent for the Removal of Methylene Blue, Remazol Brilliant Blue and Chromium Hexavalent: Thermodynamic and Kinetic Studies. Water 2020, 12, 2016. [Google Scholar] [CrossRef]
- Maan, A.A.; Nazir, A.; Khan, M.K.I.; Ahmad, T.; Zia, R.; Murid, M.; Abrar, M. The therapeutic properties and applications of Aloe vera: A review. J. Herb. Med. 2018, 12, 1–10. [Google Scholar] [CrossRef]
- Hamman, J.H. Composition and Applications of Aloe vera Leaf Gel. Molecules 2008, 13, 1599–1616. [Google Scholar] [CrossRef] [PubMed]
- Canche-Escamilla, G.; Colli-Acevedo, P.; Borges-Argaez, R.; Quintana-Owen, P.; May-Crespo, J.F.; Cáceres-Farfan, M.; Puc, J.A.Y.; Sansores-Peraza, P.; Ku, B.M.V. Extraction of phenolic components from an Aloe vera (Aloe barbadensis Miller) crop and their potential as antimicrobials and textile dyes. Sustain. Chem. Pharm. 2019, 14, 100168. [Google Scholar] [CrossRef]
- Liu, C.; Cui, Y.; Pi, F.; Cheng, Y.; Guo, Y.; Qian, H. Extraction, Purification, Structural Characteristics, Biological Activities and Pharmacological Applications of Acemannan, a Polysaccharide from Aloe vera: A Review. Molecules 2019, 24, 1554. [Google Scholar] [CrossRef] [PubMed]
- Tan, Z.-J.; Li, F.-F.; Xu, X.-L. Extraction and purification of anthraquinones derivatives from Aloe vera L. using alcohol/salt aqueous two-phase system. Bioprocess Biosyst. Eng. 2013, 36, 1105–1113. [Google Scholar] [CrossRef] [PubMed]
- Katubi, K.; Amari, A.; Harharah, H.; Eldirderi, M.; Tahoon, M.; Ben Rebah, F. Aloe vera as Promising Material for Water Treatment: A Review. Processes 2021, 9, 782. [Google Scholar] [CrossRef]
- Giannakoudakis, D.A.; Hosseini-Bandegharaei, A.; Tsafrakidou, P.; Triantafyllidis, K.S.; Kornaros, M.; Anastopoulos, I. Aloe vera waste biomass-based adsorbents for the removal of aquatic pollutants: A review. J. Environ. Manag. 2018, 227, 354–364. [Google Scholar] [CrossRef] [PubMed]
- Hanafiah, M.A.K.M.; Mohd Jamaludin, S.Z.; Khalid, K.; Ibrahim, S. Methylene blue adsorption on aloe vera rind powder: Kinetics, isotherm and mechanisms. Nat. Environ. Pollut. Technol. 2018, 17, 1055–1064. [Google Scholar]
- Gironi, F.; Piemonte, V. Temperature and solvent effects on polyphenol extraction process from chestnut tree wood. Chem. Eng. Res. Des. 2011, 89, 857–862. [Google Scholar] [CrossRef]
- Fanali, C.; Gallo, V.; Della Posta, S.; Dugo, L.; Mazzeo, L.; Cocchi, M.; Piemonte, V.; De Gara, L. Choline Chloride–Lactic Acid-Based NADES As an Extraction Medium in a Response Surface Methodology-Optimized Method for the Extraction of Phenolic Compounds from Hazelnut Skin. Molecules 2021, 26, 2652. [Google Scholar] [CrossRef]
- Di Scala, K.; Vega-Gálvez, A.; Ah-Hen, K.; Nuñez-Mancilla, Y.; Tabilo-Munizaga, G.; Pérez-Won, M.; Giovagnoli, C. Chemical and physical properties of aloe vera (Aloe barbadensis Miller) gel stored after high hydrostatic pressure processing. Cienc. e Tecnol. Aliment. 2013, 33, 52–59. [Google Scholar] [CrossRef]
- Noubigh, A.; Jeribi, C.; Mgaidi, A.; Abderrabba, M. Solubility of gallic acid in liquid mixtures of (ethanol+water) from (293.15 to 318.15)K. J. Chem. Thermodyn. 2012, 55, 75–78. [Google Scholar] [CrossRef]
- Zanchi, D.; Vernhet, A.; Poncet-Legrand, C.; Cartalade, D.; Tribet, C.; Schweins, R.; Cabane, B. Colloidal Dispersions of Tannins in Water−Ethanol Solutions. Langmuir 2007, 23, 9949–9959. [Google Scholar] [CrossRef] [PubMed]
- Perdoncin, G.; Scorrano, G. Protonation Equilibria in Water at Several Temperatures of Alcohols, Ethers, acetone, Dimethyl Sulfide, and Dimethyl Sulfoxide. J. Am. Chem. Soc. 1977, 99, 6983–6986. [Google Scholar] [CrossRef]
- Hameed, B. Evaluation of papaya seeds as a novel non-conventional low-cost adsorbent for removal of methylene blue. J. Hazard. Mater. 2009, 162, 939–944. [Google Scholar] [CrossRef] [PubMed]
- Hameed, B. Grass waste: A novel sorbent for the removal of basic dye from aqueous solution. J. Hazard. Mater. 2009, 166, 233–238. [Google Scholar] [CrossRef] [PubMed]
- McKay, G.; Porter, J.F.; Prasad, G.R. The Removal of Dye Colours from Aqueous Solutions by Adsorption on Low-cost Materials. Water Air Soil Pollut. 1999, 114, 423–438. [Google Scholar] [CrossRef]
- Mazzeo, L.; Marzi, D.; Bavasso, I.; Bracciale, M.P.; Piemonte, V.; Di Palma, L. Characterization of waste roots from the As hyperaccumulator Pteris vittata as low-cost adsorbent for Methylene Blue removal. Chem. Eng. Res. Des. 2022, 186, 13–21. [Google Scholar] [CrossRef]
- Uddin, T.; Islam, A.; Mahmud, S. Rukanuzzaman Adsorptive removal of methylene blue by tea waste. J. Hazard. Mater. 2009, 164, 53–60. [Google Scholar] [CrossRef] [PubMed]
- Gong, R.; Li, M.; Yang, C.; Sun, Y.; Chen, J. Removal of cationic dyes from aqueous solution by adsorption on peanut hull. J. Hazard. Mater. 2005, 121, 247–250. [Google Scholar] [CrossRef]
- Pavan, F.A.; Lima, E.C.; Dias, S.L.; Mazzocato, A.C. Methylene blue biosorption from aqueous solutions by yellow passion fruit waste. J. Hazard. Mater. 2008, 150, 703–712. [Google Scholar] [CrossRef]
- Sostaric, T.; Petrović, M.; Milojković, J.; Petrović, J.; Stanojevic, M.; Lacnjevac, C.; Stojanović, M. Biosorption of methylene blue by waste apricot shells from food industry. J. Eng. Process. Manag. 2015, 7, 107–114. [Google Scholar] [CrossRef]
- Annadurai, G.; Juang, R.-S.; Lee, D.-J. Use of cellulose-based wastes for adsorption of dyes from aqueous solutions. J. Hazard. Mater. 2002, 92, 263–274. [Google Scholar] [CrossRef]
- Han, R.; Wang, Y.; Han, P.; Shi, J.; Yang, J.; Lu, Y. Removal of methylene blue from aqueous solution by chaff in batch mode. J. Hazard. Mater. 2006, 137, 550–557. [Google Scholar] [CrossRef] [PubMed]
- Franca, A.S.; Oliveira, L.S.; Ferreira, M.E. Kinetics and equilibrium studies of methylene blue adsorption by spent coffee grounds. Desalination 2009, 249, 267–272. [Google Scholar] [CrossRef]
- Bulut, Y.; Aydın, H. A kinetics and thermodynamics study of methylene blue adsorption on wheat shells. Desalination 2006, 194, 259–267. [Google Scholar] [CrossRef]
- Benzidia, B.; Barbouchi, M.; Hammouch, H.; Belahbib, N.; Zouarhi, M.; Erramli, H.; Daoud, N.A.; Badrane, N.; Hajjaji, N. Chemical composition and antioxidant activity of tannins extract from green rind of Aloe vera (L.) Burm. F. J. King Saud Univ.-Sci. 2019, 31, 1175–1181. [Google Scholar] [CrossRef]
- El-Azazy, M.; Dimassi, S.; El-Shafie, A.S.; Issa, A. Bio-Waste Aloe vera Leaves as an Efficient Adsorbent for Titan Yellow from Wastewater: Structuring of a Novel Adsorbent Using Plackett-Burman Factorial Design. Appl. Sci. 2019, 9, 4856. [Google Scholar] [CrossRef]
- Postai, D.L.; Demarchi, C.A.; Zanatta, F.; Melo, D.C.C.; Rodrigues, C.A. Adsorption of rhodamine B and methylene blue dyes using waste of seeds of Aleurites Moluccana, a low cost adsorbent. Alex. Eng. J. 2016, 55, 1713–1723. [Google Scholar] [CrossRef]
- Hong, S.; Wen, C.; He, J.; Gan, F.; Ho, Y.-S. Adsorption thermodynamics of Methylene Blue onto bentonite. J. Hazard. Mater. 2009, 167, 630–633. [Google Scholar] [CrossRef] [PubMed]
- Özer, D.; Dursun, G.; Özer, A. Methylene blue adsorption from aqueous solution by dehydrated peanut hull. J. Hazard. Mater. 2007, 144, 171–179. [Google Scholar] [CrossRef]
- Al-Qodah, Z.; Lafi, W.; Al-Anber, Z.; Al-Shannag, M.; Harahsheh, A. Adsorption of methylene blue by acid and heat treated diatomaceous silica. Desalination 2007, 217, 212–224. [Google Scholar] [CrossRef]
- Manes, M.; Hofer, L.J.E. Application of the Polanyi adsorption potential theory to adsorption from solution on activated carbon. J. Phys. Chem. 1969, 73, 584–590. [Google Scholar] [CrossRef]
- Adsorption: Science and Technology; Kluwer Academic Publishers: Dordrecht, The Netherlands, 1989; ISBN 9789401075145.
- Meshko, V.; Markovska, L.; Mincheva, M.; Rodrigues, A. Adsorption of basic dyes on granular acivated carbon and natural zeolite. Water Res. 2001, 35, 3357–3366. [Google Scholar] [CrossRef]
- Sáenz-Alanís, C.A.; García-Reyes, R.B.; Soto-Regalado, E.; García-González, A. Phenol and methylene blue adsorption on heat-treated activated carbon: Characterization, kinetics, and equilibrium studies. Adsorpt. Sci. Technol. 2017, 35, 789–805. [Google Scholar] [CrossRef]
- Yao, C.; Zhu, C. A new method of characterizing mass transfer controlling mechanism in pollutant adsorption from aqueous solutions. J. Mol. Liq. 2020, 301, 112455. [Google Scholar] [CrossRef]
- Baup, S.; Jaffré, C.; Wolbert, D.; Laplanche, A. Adsorption of Pesticides onto Granular Activated Carbon: Determination of Surface Diffusivities Using Simple Batch Experiments. Adsorption 2000, 6, 219–228. [Google Scholar] [CrossRef]


| Sample | Langmuir | Freundlich | ||||
|---|---|---|---|---|---|---|
| qmax (mg/g) | b (L/mg) | RMSE (mg/g) | KF ((mg/g)(L/mg)(1/nF)) | nF | RMSE (mg/g) | |
| AV50 | 346.52 | 0.018 | 9.01 | 4.92 | 2.83 | 17.02 |
| AV25 | 311.81 | 0.12 | 10.84 | 46.81 | 1.51 | 41.95 |
| AV0 | 199.13 | 8.74 | 5.17 | 2.26 | 23.48 | |
| Bio-Adsorbent | T (°C) | pH | Reference | ||
|---|---|---|---|---|---|
| Papaya seeds | 30 | 7 | 555.5 | 0.0028 | [25] |
| Grass waste | 30 | 7 | 457.6 | 0.0023 | [26] |
| AV50 | 20 | 7 | 346.52 | 0.018 | [This study] |
| Rice husk | 20 | 7 | 312.2 | 0.0171 | [27] |
| AV25 | 20 | 7 | 311.81 | 0.12 | [This study] |
| Cotton waste | 20 | 7 | 277.7 | 0.009 | [27] |
| AV0 | 20 | 7 | 199.13 | 0.17 | [This study] |
| Pteris waste roots | 20 | 7 | 112.3 | 0.62 | [28] |
| Tea waste | 25 | 8 | 85.1 | 1.26 | [29] |
| Peanut hull | 20 | 5 | 60.05 | 0.16 | [30] |
| Yerba Mate | 25 | 6 | 59.6 | 0.02 | [10] |
| Passion fruit waste | 25 | 8 | 44.70 | 0.002 | [31] |
| Apricot shells | 25 | 5 | 24.31 | 0.002 | [32] |
| Banana peel | 30 | 7 | 20.8 | 0.06 | [33] |
| Chaff | 25 | 7 | 20.03 | 0.22 | [34] |
| Spent coffee grounds | 25 | 5 | 18.72 | 0.27 | [35] |
| Orange peel | 30 | 7 | 18.6 | 0.05 | [33] |
| Wheat shells | 30 | 7 | 16.56 | 0.02 | [36] |
| Sample | SSA (m2/kg) | Mean Pore Diameter (nm) | Total Pore Volume (cm³/kg) |
|---|---|---|---|
| AV0 | 180.2 | 9.60 | 0.11 |
| AV25 | 313.3 | 5.11 | 0.37 |
| AV50 | 331.7 | 7.27 | 0.59 |
| Parameter | 10 °C | 20 °C | 40 °C |
|---|---|---|---|
| (mg/g) | 245.59 | 199.13 | 180.21 |
| (L/mg) | 0.18 | 0.17 | 0.09 |
| Parameter | AV0 | AV25 | AV50 |
|---|---|---|---|
| (1/min) | 0.013 ± 5.30 · 10−4 | 0.014 ± 5.43 · 10−4 | 0.008 ± 3.9 · 10−4 |
| (cm2/min) | 5.43 · 10−7 ± 9.02 · 10−8 | 3.89 · 10−7 ± 5.92 · 10−8 | 5.78 · 10−7 ± 4.30 · 10−8 |
| 12.1 | 13.6 | 17.9 |
Publisher’s Note: MDPI stays neutral with regard to jurisdictional claims in published maps and institutional affiliations. |
© 2022 by the authors. Licensee MDPI, Basel, Switzerland. This article is an open access article distributed under the terms and conditions of the Creative Commons Attribution (CC BY) license (https://creativecommons.org/licenses/by/4.0/).
Share and Cite
Mazzeo, L.; Bavasso, I.; Spallieri, M.; Bracciale, M.P.; Piemonte, V.; Di Palma, L. Effect of Water–Ethanol Extraction as Pre-Treatment on the Adsorption Properties of Aloe vera Waste. Materials 2022, 15, 5566. https://0-doi-org.brum.beds.ac.uk/10.3390/ma15165566
Mazzeo L, Bavasso I, Spallieri M, Bracciale MP, Piemonte V, Di Palma L. Effect of Water–Ethanol Extraction as Pre-Treatment on the Adsorption Properties of Aloe vera Waste. Materials. 2022; 15(16):5566. https://0-doi-org.brum.beds.ac.uk/10.3390/ma15165566
Chicago/Turabian StyleMazzeo, Leone, Irene Bavasso, Melissa Spallieri, Maria Paola Bracciale, Vincenzo Piemonte, and Luca Di Palma. 2022. "Effect of Water–Ethanol Extraction as Pre-Treatment on the Adsorption Properties of Aloe vera Waste" Materials 15, no. 16: 5566. https://0-doi-org.brum.beds.ac.uk/10.3390/ma15165566