
Effect of Rapid Heating and Cooling Conditions on Microstructure Formation in Powder Bed Fusion of Al-Si Hypoeutectic Alloy: A Phase-Field Study

Abstract
:1. Introduction
2. Methods
3. Results and Discussion
4. Conclusions
Author Contributions
Funding
Institutional Review Board Statement
Informed Consent Statement
Data Availability Statement
Conflicts of Interest
References
- Hagihara, K.; Nakano, T. Control of Anisotropic Crystallographic Texture in Powder Bed Fusion Additive Manufacturing of Metals and Ceramics—A Review. JOM 2021, 74, 1760–1773. [Google Scholar] [CrossRef]
- Liu, J.; Xiong, W.; Behera, A.; Thompson, S.; To, C.A. Mean-field polycrystal plasticity modeling with grain size and shape effects for laser additive manufactured FCC metals. Int. J. Solids Struct. 2017, 112, 35–42. [Google Scholar] [CrossRef]
- Bian, H.; Aoyagi, K.; Zhao, Y.; Maeda, C.; Mouri, T.; Chiba, A. Microstructure refinement for superior ductility of Al–Si alloy by electron beam melting. Addit. Manuf. 2020, 32, 100982. [Google Scholar] [CrossRef]
- Aboulkhair, N.T.; Simonelli, M.; Parry, L.; Ashcroft, I.; Tuck, C.; Hague, R. 3D printing of aluminium alloys: Additive manufacturing of aluminium alloys using selective laser melting. Prog. Mater. Sci. 2019, 106, 100578. [Google Scholar] [CrossRef]
- Aversa, A.; Marchese, G.; Saboori, A.; Bassini, E.; Manfredi, D.; Biamino, S.; Ugues, D.; Fino, P.; Lombardi, M. New aluminum alloys specifically designed for laser powder bed fusion: A review. Materials 2019, 12, 1007. [Google Scholar] [CrossRef] [PubMed]
- Martin, J.H.; Yahata, B.D.; Hundley, J.M.; Mayer, J.A.; Schaedler, T.A.; Pollock, T.M. 3D printing of high-strength aluminium alloys. Nature 2017, 549, 365–369. [Google Scholar] [CrossRef]
- Tang, M.; Pistorius, P.C.; Narra, S.; Beuth, J.L. Rapid solidification: Selective laser melting of AlSi10Mg. J. Miner. Met. Mater. 2016, 68, 960–966. [Google Scholar] [CrossRef]
- Zhang, H.; Zhu, H.; Nie, X.; Yin, J.; Hu, Z.; Zeng, X. Effect of Zirconium addition on crack, microstructure and mechanical behavior of selective laser melted Al-Cu-Mg alloy. Scr. Mater. 2017, 134, 6–10. [Google Scholar] [CrossRef]
- Yang, K.V.; Shi, Y.; Palm, F.; Wu, X.; Rometsch, P. Columnar to equiaxed transition in Al-Mg (-Sc) -Zr alloys produced by selective laser melting. Scr. Mater. 2018, 145, 113–117. [Google Scholar] [CrossRef]
- Takata, N.; Kodaira, H.; Suzuki, A.; Kobashi, M. Size dependence of microstructure of AlSi10Mg alloy fabricated by selective laser melting. Mater. Characterisation 2018, 143, 18–26. [Google Scholar] [CrossRef]
- Kusoglu, I.M.; Gökce, B.; Barcikowski, S. Research trends in laser powder bed fusion of Al alloys within the last decade. Addit. Manuf. 2020, 36, 101489. [Google Scholar] [CrossRef]
- Yang, Y.; Chen, Y.; Zhang, J.; Gu, X.; Qin, P.; Dai, N.; Li, X.; Kruth, J.-P.; Zhang, L.-C. Improved corrosion behavior of ultrafine-grained eutectic Al-12Si alloy produced by selective laser melting. Mater. Des. 2018, 146, 239–248. [Google Scholar] [CrossRef]
- Liu, X.; Zhao, C.; Zhou, X.; Shen, Z.; Liu, W. Microstructure of selective laser melted AlSi10Mg alloy. Mater. Des. 2019, 168, 107677. [Google Scholar] [CrossRef]
- Zhou, Y.; Abbara, E.M.; Jiang, D.; Azizi, A.; Poliks, M.D.; Ning, F. High-cycle fatigue properties of curved-surface AlSi10Mg parts fabricated by powder bed fusion additive manufacturing. Rapid Prototyp. J. 2022, 28, 1346–1360. [Google Scholar] [CrossRef]
- Roth, C.C.; Tancogne-dejean, T.; Mohr, D. Plasticity and fracture of cast and SLM AlSi10Mg: High-throughput testing and modeling. Addit. Manuf. 2021, 43, 101998. [Google Scholar] [CrossRef]
- Suzuki, A.; Miyasaka, T.; Takata, N.; Kobashi, M.; Kato, M. Control of microstructural characteristics and mechanical properties of AlSi12 alloy by processing conditions of laser powder bed fusion. Addit. Manuf. 2021, 48, 102383. [Google Scholar] [CrossRef]
- Liu, Q.; Wu, H.; Paul, M.J.; He, P.; Peng, Z.; Gludovatz, B.; Kruzic, J.J.; Wang, C.H.; Li, X. Machine-learning assisted laser powder bed fusion process optimization for AlSi10Mg: New microstructure description indices and fracture mechanisms. Acta Mater. 2020, 201, 316–328. [Google Scholar] [CrossRef]
- Zhao, L.; Song, L.; Santos Macías, J.G.; Zhu, Y.; Huang, M.; Simar, A.; Li, Z. Review on the correlation between microstructure and mechanical performance for laser powder bed fusion AlSi10Mg. Addit. Manuf. 2022, 56, 102914. [Google Scholar] [CrossRef]
- Yi, M.; Zhang, P.; Yang, C.; Cheng, P.; Guo, S.; Liu, G.; Sun, J. Improving creep resistance of Al-12 wt.% Ce alloy by microalloying with Sc. Scr. Mater. 2021, 198, 113838. [Google Scholar] [CrossRef]
- Patel, M.N.; Qiu, D.; Wang, G.; Gibson, M.A.; Prasad, A.; StJohn, D.H.; Easton, M.A. Understanding the refinement of grains in laser surface remelted Al–Cu alloys. Scr. Mater. 2020, 178, 447–451. [Google Scholar] [CrossRef]
- Ekubaru, Y.; Gokcekaya, O.; Ishimoto, T.; Sato, K.; Manabe, K.; Wang, P.; Nakano, T. Excellent strength–ductility balance of Sc-Zr-modified Al–Mg alloy by tuning bimodal microstructure via hatch spacing in laser powder bed fusion. Mater. Des. 2022, 221, 110976. [Google Scholar] [CrossRef]
- Hunt, J.D.D. Steady state columnar and equiaxed growth of dendrites and eutectic. Mater. Sci. Eng. 1984, 65, 75–83. [Google Scholar] [CrossRef]
- Ding, X.; Koizumi, Y.; Aoyagi, K.; Kii, T.; Sasaki, N.; Hayasaka, Y.; Yamanaka, K.; Chiba, A. Microstructural control of alloy 718 fabricated by electron beam melting with expanded processing window by adaptive offset method. Mater. Sci. Eng. A 2019, 764, 138058. [Google Scholar] [CrossRef]
- Bontha, S.; Klingbeil, N.W.; Kobryn, P.A.; Fraser, H.L. Effects of process variables and size-scale on solidification microstructure in beam-based fabrication of bulky 3D structures. Mater. Sci. Eng. A 2009, 513–514, 311–318. [Google Scholar] [CrossRef]
- Schoinochoritis, B.; Chantzis, D.; Salonitis, K. Simulation of metallic powder bed additive manufacturing processes with the finite element method: A critical review. Proc. Inst. Mech. Eng. Part B J. Eng. Manuf. 2017, 231, 96–117. [Google Scholar] [CrossRef]
- Gockel, J.; Beuth, J. Understanding Ti-6Al-4V microstructure control in additive manufacturing via process maps. In 2013 International Solid Freeform Fabrication Symposium; University of Texas at Austin: Austin, TX, USA, 2013; pp. 666–674. [Google Scholar]
- Zhao, Y.; Koizumi, Y.; Aoyagi, K.; Wei, D.; Yamanaka, K.; Chiba, A. Molten pool behavior and effect of fluid flow on solidification conditions in selective electron beam melting (SEBM) of a biomedical Co-Cr-Mo alloy. Addit. Manuf. 2019, 26, 202–214. [Google Scholar] [CrossRef]
- Prasad, A.; Yuan, L.; Lee, P.; Patel, M.; Qiu, D.; Easton, M.; StJohn, D. Towards understanding grain nucleation under additive manufacturing solidification conditions. Acta Mater. 2020, 195, 392–403. [Google Scholar] [CrossRef]
- Miyata, Y.; Okugawa, M.; Koizumi, Y.; Nakano, T. Inverse columnar-equiaxed transition (CET) in 304 and 316L stainless steels melt by electron beam for additive manufacturing (AM). Crystals 2021, 11, 856. [Google Scholar] [CrossRef]
- Okugawa, M.; Ohigashi, Y.; Furushiro, Y.; Koizumi, Y.; Nakano, T. Equiaxed grain formation by intrinsic heterogeneous nucleation via rapid heating and cooling in additive manufacturing of aluminum-silicon hypoeutectic alloy. J. Alloys Compd. 2022, 919, 165812. [Google Scholar] [CrossRef]
- MICRostructure Evolution Simulation Software, Phase-Field Software Package. Available online: www.micress.de (accessed on 6 July 2022).
- Eiken, J.; Böttger, B.; Steinbach, I. Multiphase-field approach for multicomponent alloys with extrapolation scheme for numerical application. Phys. Rev. E Stat. Nonlinear Soft Matter Phys. 2006, 73, 066122. [Google Scholar] [CrossRef]
- Andersson, J.-O.; Helander, T.; Höglund, L.; Shi, P.; Sundman, B. Thermo-calc & DICTRA, computational tools for materials science. Calphad 2002, 26, 273–312. [Google Scholar] [CrossRef]
- Zhang, H.; Wang, Y.; Shang, S.L.; Ravi, C.; Wolverton, C.; Chen, L.Q.; Liu, Z.K. Solvus boundaries of (meta)stable phases in the Al-Mg-Si system: First-principles phonon calculations and thermodynamic modeling. Calphad 2010, 34, 20–25. [Google Scholar] [CrossRef]
- Eiken, J.; Apel, M.; Liang, S.M.; Schmid-Fetzer, R. Impact of P and Sr on solidification sequence and morphology of hypoeutectic Al-Si alloys: Combined thermodynamic computation and phase-field simulation. Acta Mater. 2015, 98, 152–163. [Google Scholar] [CrossRef]
- Eiken, J.; Apel, M. Eutectic morphology evolution and Sr-modification in Al-Si based alloys studied by 3D phase-field simulation coupled to calphad data. IOP Conf. Ser. Mater. Sci. Eng. 2015, 84, 012084. [Google Scholar] [CrossRef]
- Nomoto, S.; Minamoto, S.; Nakajima, K. Numerical simulation for grain refinement of aluminum alloy by multi-phase-field odel coupled with CALPHAD. ISIJ Int. 2009, 49, 1019–1023. [Google Scholar] [CrossRef]
- Khorasani, M.; Ghasemi, A.H.; Leary, M.; Sharabian, E.; Cordova, L.; Gibson, I.; Downing, D.; Bateman, S.; Brandt, M.; Rolfe, B. The effect of absorption ratio on meltpool features in laser-based powder bed fusion of IN718. Opt. Laser Technol. 2022, 153, 108263. [Google Scholar] [CrossRef]
- Watanabe, M.; Takahashi, Y.; Imaizumi, S.; Zhao, Y.; Adachi, M.; Ohtsuka, M.; Chiba, A.; Koizumi, Y.; Fukuyama, H. Thermophysical properties of liquid Co–Cr–Mo alloys measured by electromagnetic levitation in a static magnetic field. Thermochim. Acta 2022, 708, 179119. [Google Scholar] [CrossRef]
- Watanabe, M.; Watanabe, Y.; Koyama, C.; Ishikawa, T.; Imaizumi, S.; Adachi, M.; Ohtsuka, M.; Chiba, A.; Koizumi, Y.; Fukuyama, H. Density, surface tension, and viscosity of Co-Cr-Mo melts measured using electrostatic levitation technique. Thermochim. Acta 2022, 710, 179183. [Google Scholar] [CrossRef]


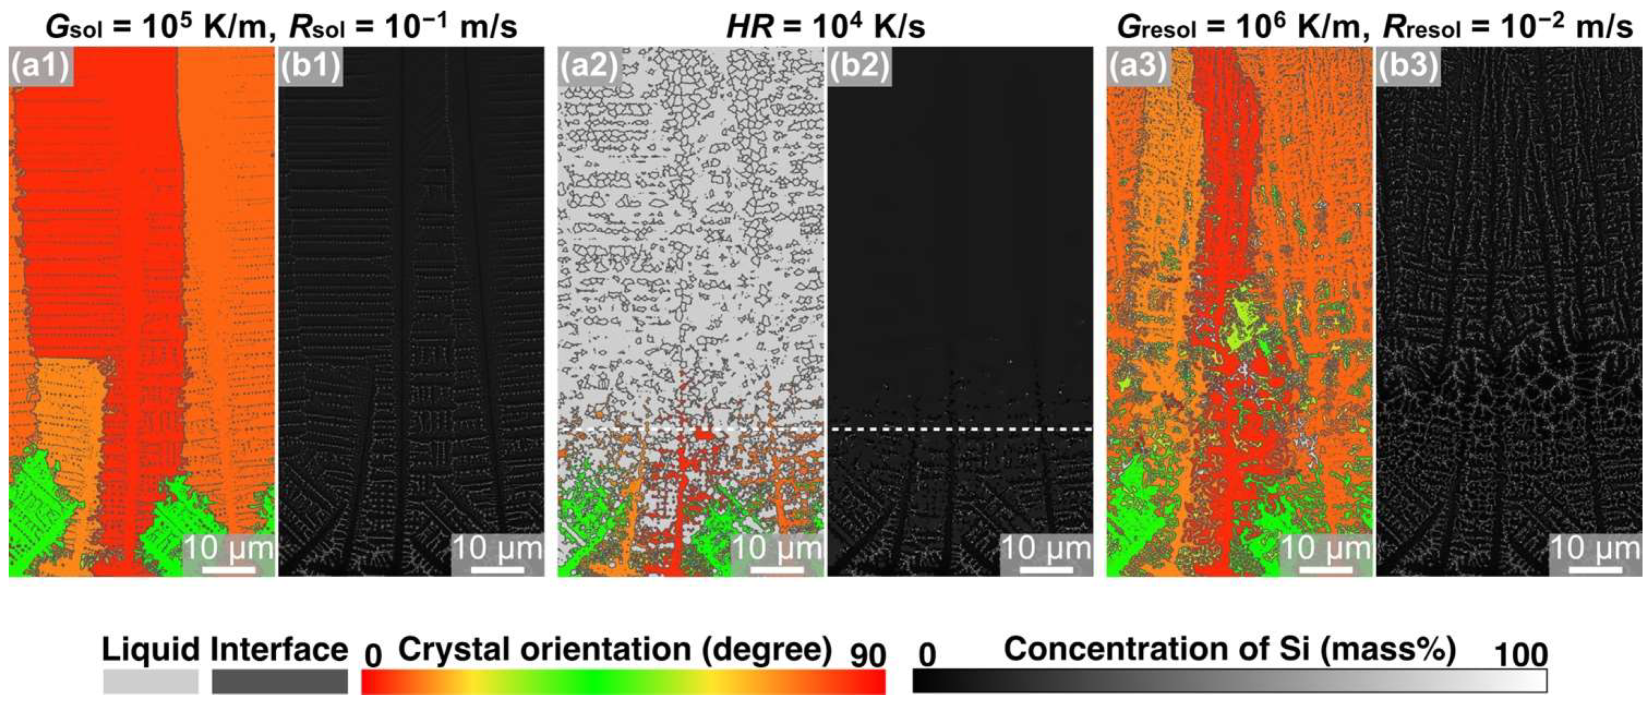
| Condition | Solidification | Remelting | Resolidification | ||
|---|---|---|---|---|---|
| Gsol (K/m) | Rsol (m/s) | HR (K/s) | Gresol (K/m) | Rresol (m/s) | |
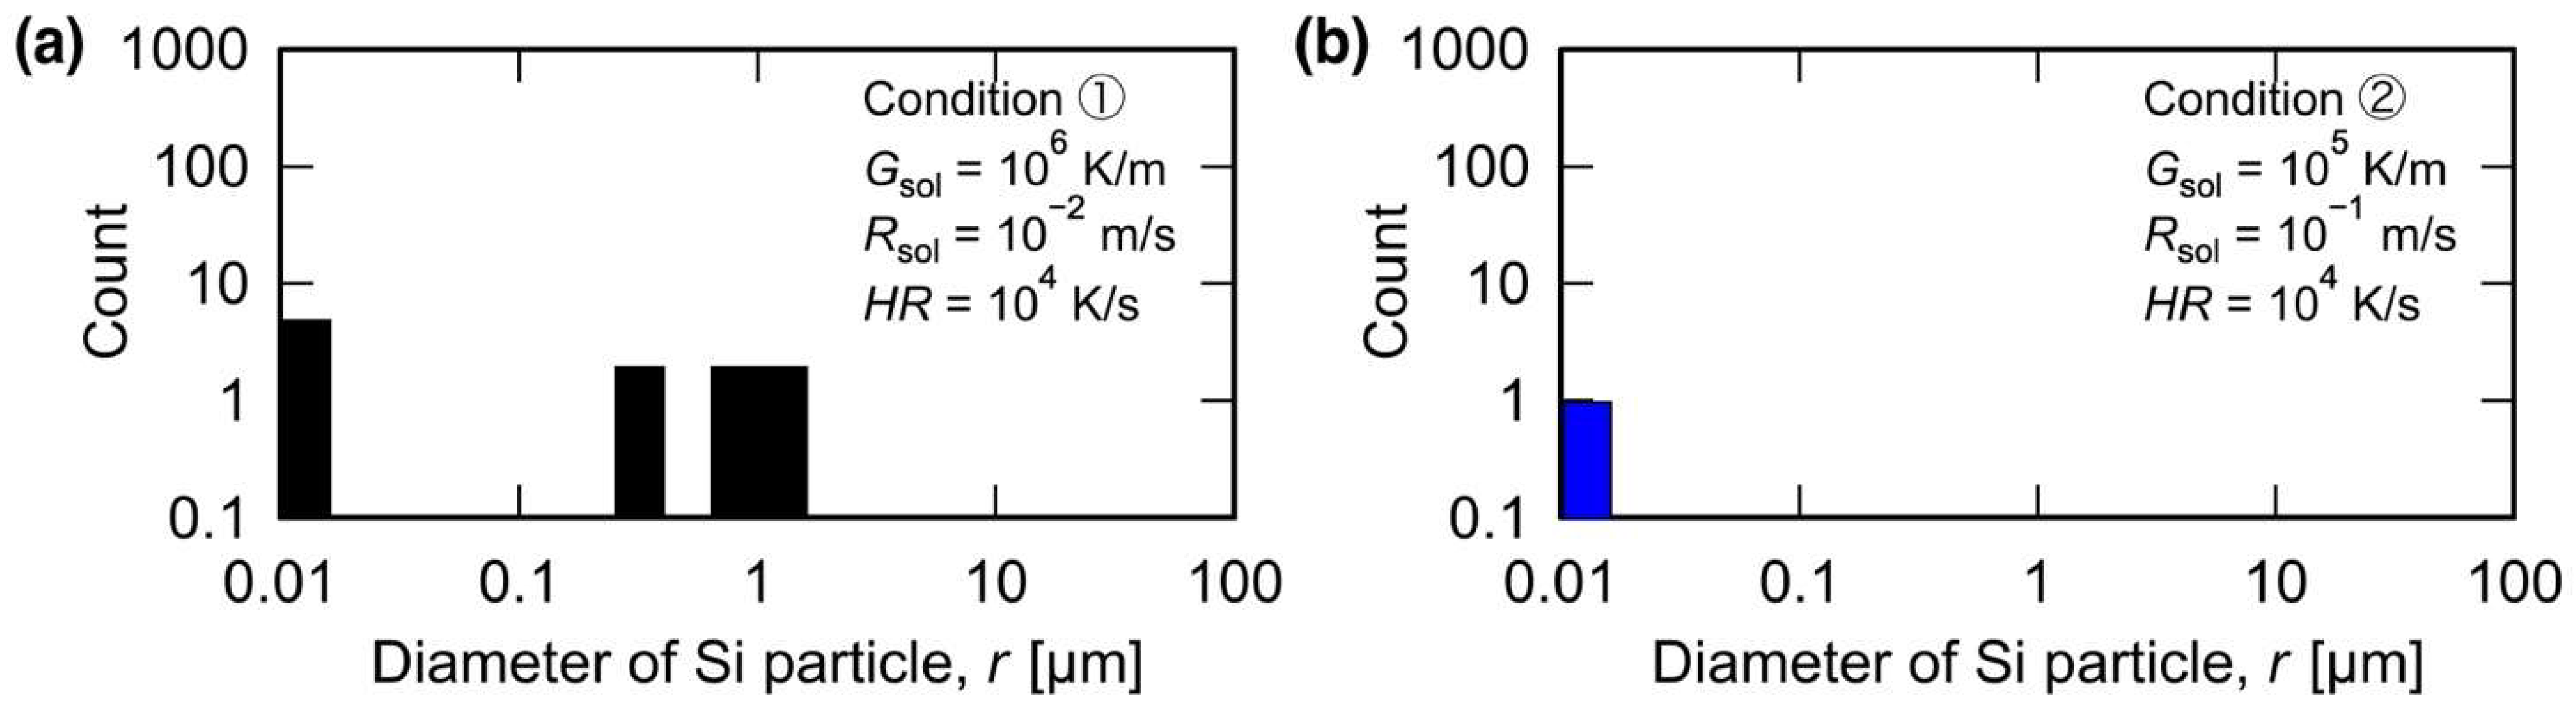
| ① | 106 | 10−2 | 104 | 106 | 10−2 |
| ② | 105 | 10−1 | 104 | 106 | 10−2 |
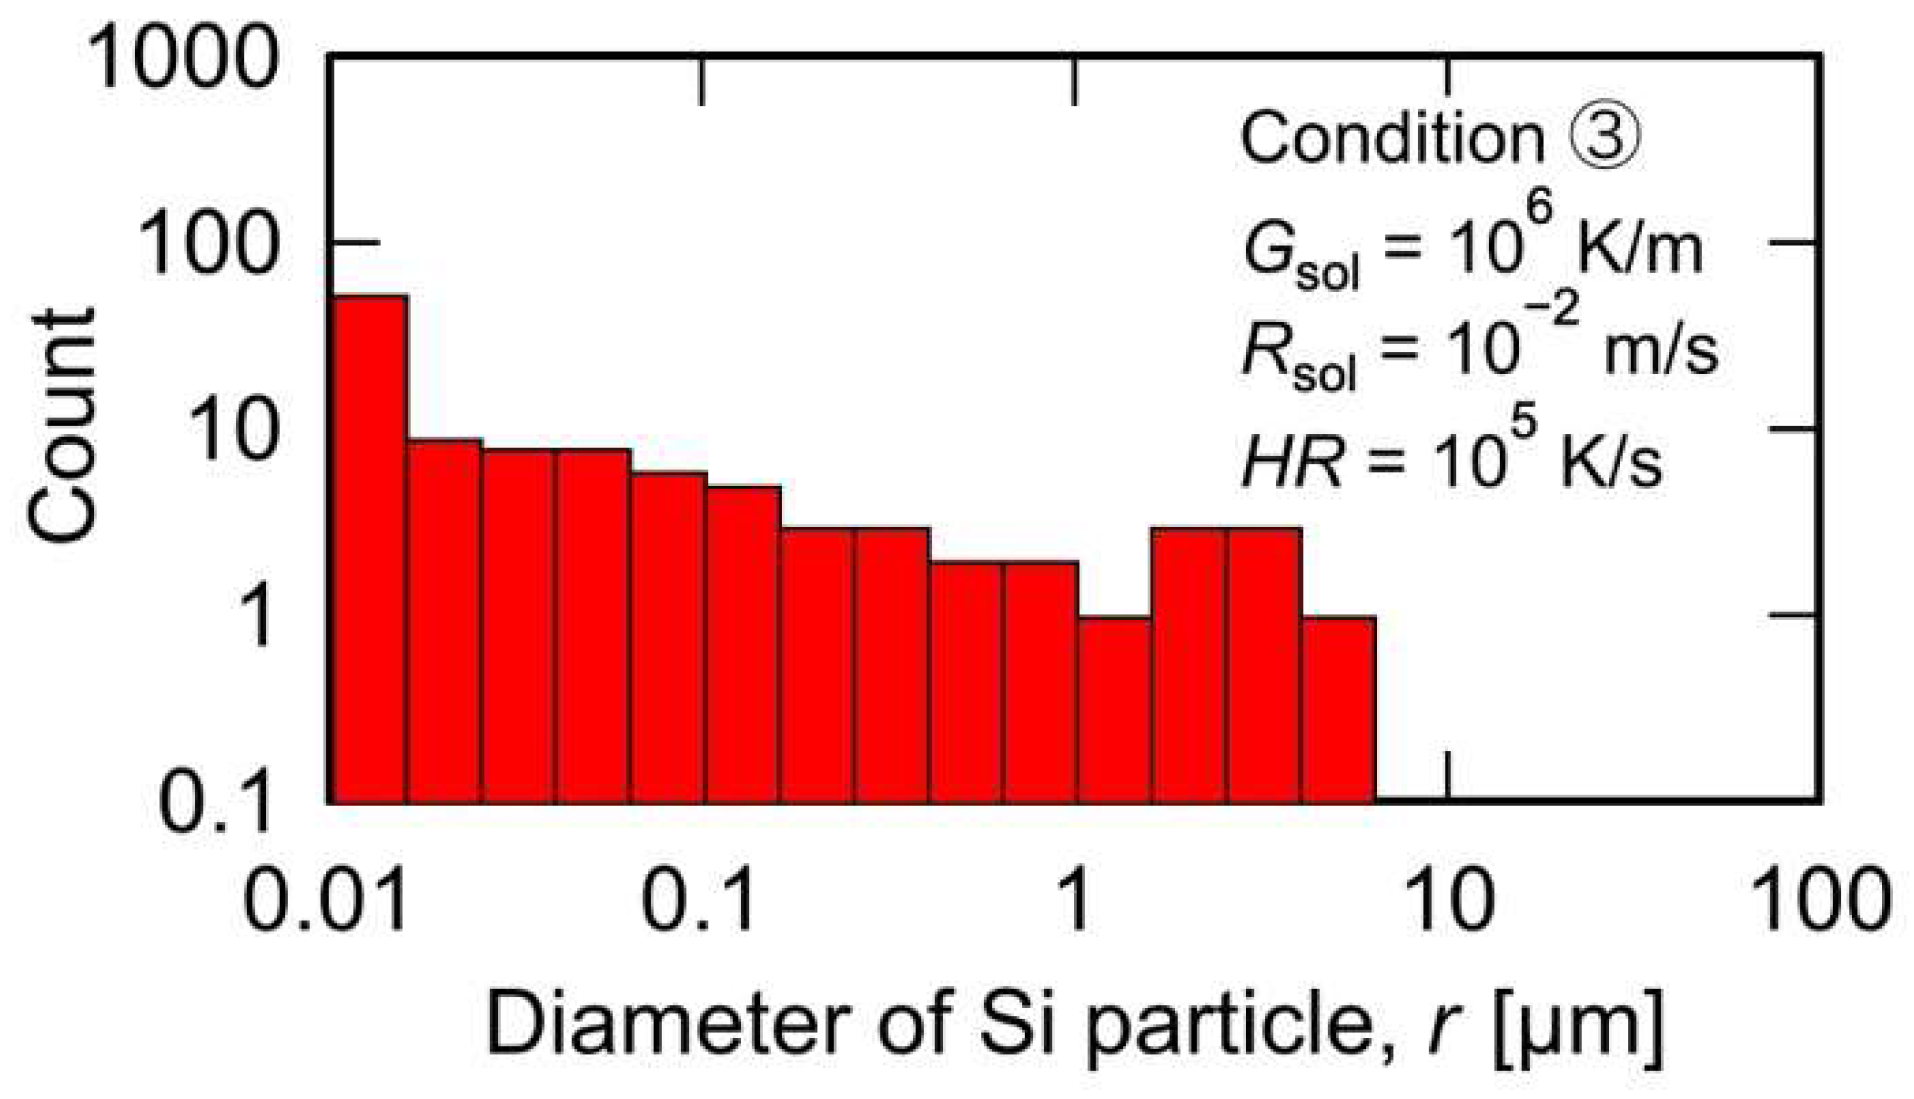
| ③ | 106 | 10−2 | 105 | 106 | 10−2 |
| ④ | 106 | 10−2 | 104 | 105 | 10−1 |
| ⑤ | 106 | 10−2 | 105 | 105 | 10−1 |
Publisher’s Note: MDPI stays neutral with regard to jurisdictional claims in published maps and institutional affiliations. |
© 2022 by the authors. Licensee MDPI, Basel, Switzerland. This article is an open access article distributed under the terms and conditions of the Creative Commons Attribution (CC BY) license (https://creativecommons.org/licenses/by/4.0/).
Share and Cite
Okugawa, M.; Furushiro, Y.; Koizumi, Y. Effect of Rapid Heating and Cooling Conditions on Microstructure Formation in Powder Bed Fusion of Al-Si Hypoeutectic Alloy: A Phase-Field Study. Materials 2022, 15, 6092. https://0-doi-org.brum.beds.ac.uk/10.3390/ma15176092
Okugawa M, Furushiro Y, Koizumi Y. Effect of Rapid Heating and Cooling Conditions on Microstructure Formation in Powder Bed Fusion of Al-Si Hypoeutectic Alloy: A Phase-Field Study. Materials. 2022; 15(17):6092. https://0-doi-org.brum.beds.ac.uk/10.3390/ma15176092
Chicago/Turabian StyleOkugawa, Masayuki, Yuya Furushiro, and Yuichiro Koizumi. 2022. "Effect of Rapid Heating and Cooling Conditions on Microstructure Formation in Powder Bed Fusion of Al-Si Hypoeutectic Alloy: A Phase-Field Study" Materials 15, no. 17: 6092. https://0-doi-org.brum.beds.ac.uk/10.3390/ma15176092