Article

CeFeO3–CeO2–Fe2O3 Systems: Synthesis by Solution Combustion Method and Catalytic Performance in CO2 Hydrogenation

by
Anna N. Matveyeva
1,
Shamil O. Omarov
1,
Marianna A. Gavrilova
1,2,
Dmitry A. Sladkovskiy
2 and
Dmitry Yu. Murzin
3,*
1
Laboratory of Materials and Processes for Hydrogen Energy, Ioffe Institute, Politekhnicheskaya ul. 28, 194021 St. Petersburg, Russia
2
Resource-Saving Department, St. Petersburg State Institute of Technology (Technical University), Moskovskiy pr. 26, 190013 St. Petersburg, Russia
3
Laboratory of Industrial Chemistry and Reaction Engineering, Åbo Akademi University, Henriksgatan 2, 20500 Turku, Finland
*
Author to whom correspondence should be addressed.
Submission received: 21 October 2022 / Revised: 7 November 2022 / Accepted: 9 November 2022 / Published: 11 November 2022
(This article belongs to the Special Issue Heterogeneous Catalysts Synthesis and Characterization)

Abstract

:
Rare-earth orthoferrites have found wide application in thermocatalytic reduction-oxidation processes. Much less attention has been paid, however, to the production of CeFeO3, as well as to the study of its physicochemical and catalytic properties, in particular, in the promising process of CO2 utilization by hydrogenation to CO and hydrocarbons. This study presents the results of a study on the synthesis of CeFeO3 by solution combustion synthesis (SCS) using various fuels, fuel-to-oxidizer ratios, and additives. The SCS products were characterized by XRD, FTIR, N2-physisorption, SEM, DTA–TGA, and H2-TPR. It has been established that glycine provides the best yield of CeFeO3, while the addition of NH4NO3 promotes an increase in the amount of CeFeO3 by 7–12 wt%. In addition, the synthesis of CeFeO3 with the participation of NH4NO3 makes it possible to surpass the activity of the CeO2–Fe2O3 system at low temperatures (300–400 °C), as well as to increase selectivity to hydrocarbons. The observed effects are due to the increased gas evolution and ejection of reactive FeOx nanoparticles on the surface of crystallites, and an increase in the surface defects. CeFeO3 obtained in this study allows for achieving higher CO2 conversion compared to LaFeO3 at 600 °C.

1. Introduction

The limited reserves of fossil crude oil, as well as global warming, and possible consequences for human and environmental safety, are the driving forces for the development of more environmentally friendly and sustainable processes [1]. Among the technological challenges requiring aspectual attention at present are the valorization of biomass, water splitting, CO2 reduction, abatement of exhaust gases, and production of renewable hydrogen [2,3], which has the potential to replace conventional fossil fuels as a clean energy carrier.
The key to solving and overcoming these challenges is catalysis in combination with solid-state chemistry, which is also used to develop tailor-made catalytic materials, and materials science to elucidate the structure-property relationships in defect solids [4]. Subsequently, many materials that have properties important for successful applications in electronics and other fields, such as crystallinity, particle size, porosity, structure defectiveness, and composition variability, can also be effective catalysts.
In particular, perovskites with their unique physical properties are among such materials that are attracting attention for many materials science applications [5], including rechargeable batteries [6], supercapacitors [7], photovoltaics [8], photocatalysts [9], and electrocatalysts [10]. Due to the wide range of ions and valences that this structure can contain, as well as the ability to fine-tune perovskites for specific catalytic requirements, these oxides can be successfully applied as catalytic materials [4].
The term perovskite is used to refer to any compound that has a formula ABX3 and for which the B ion is surrounded by an octahedron of X ions, while the original mineral (perovskite) has the chemical formula CaTiO3 [5].
Oxides with the perovskite structure have a cubic unit cell, where the A ion is at the center of the unit cell, the B ions are located at the corners, and the negative ions occupy the face-centered positions [5,11]. Therefore, “A” ions are large cations and usually belong to the group of alkali or rare earth metals that fit into the dodecahedral sites of the framework and provide structural stability, whereas “B” ions are smaller cations, typically 3d, 4d, or 5d transition metals, occupying octahedral positions of the framework and undergoing redox transformations [12,13]. Generally, in the perovskite framework, the B-site is the catalytically active site, while the A-site plays a major support role [12].
However, most perovskites are deformed due to steric constraints caused by differences in the ionic radii leading to the formation of oxygen/cationic vacancies and changing angles between cations and oxygen. The stability of perovskites relative to other structures is frequently defined in terms of the Goldschmidt tolerance factor (t), the value of which depends on the radii of the cations included in the structure [14,15]. A more detailed description of the structure of perovskites, their various deformations, as well as a definition of their stability, is given in [16,17,18,19,20].
One of the important groups of the perovskite family is rare-earth ferrites, which have recently attracted an increased interest due to the multifunctional properties of many representatives of this class, and the catalysts based on them, are currently used mainly in reduction-oxidation processes [12,13]. LaFeO3, among other ferrites, is the most investigated perovskite, which, due to the partially reduced state of near-surface Fe ions (Fe2+/Fe3+), selectively activates the C-H bond in methane to produce high-purity syngas [13]. For La ferrite, three different types of active iron sites were found, from the point of view of their different surroundings by surface oxygen ions and oxygen vacancies, which determine the completeness of CH4 oxidation. Unlike lanthanum, cerium ions are characterized by two charge states (Ce3+/Ce4+), which, in combination with Fe3+/Fe2+, suggests that the catalyst based on CeFeO3 can be more active in redox processes than LaFeO3.
Cerium ferrite is still one of the least investigated representatives of this class, although it has the highest abundance in nature among the lanthanide elements [21]. For CeFeO3, an orthorhombic structure of GdFeO3 type is usually expected, because t is 0.85 [20]. Cerium oxide in this perovskite has a possibility of reversible transformation between Ce3+ and Ce4+ [22]. Increasing the fraction of Ce4+ leads to a decrease in oxygen vacancies and in the oxidation state of Fe due to charge neutrality in CeFeO3. The presence of Ce4+ and Fe2+ slightly distorts the FeO6 octahedra and increases the tolerance factor to ca. 0.87.
Very few publications addressed the synthesis of CeFeO3, which was structurally described for the first time in [23] because the preparation of CeFeO3 is not as simple as that of other rare earth orthoferrites [24]. Initially, Ce orthoferrites were obtained by firing pressed tablets from a mixture of Fe2O3, CeO2, and metallic Fe (as a reducing agent) in a sealed evacuated quartz tube at 800–850 °C for 48 h [25], and under a controlled low partial pressure of O2 [26]. This method requires a long reaction time, high temperatures, and a complex experimental setup. However, due to the small ionic radius of the Ce3+ cation [21], therefore, CeFeO3 is poorly stable in the presence of oxygen and at elevated temperatures. Furthermore, cerium (III) compounds generally tend to oxidize easily to Ce(IV) species, mostly forming stable CeO2.
Other synthesis methods have also been proposed, including the co-precipitation method [22,27,28,29] and sol-gel technique [30,31], which are also complex and/or require high calcination temperatures (550–1000 °C) and long reaction time (3–48 h). At the same time, there are difficulties in the targeted synthesis of nanostructured CeFeO3 by these methods.
Thus, taking into account the conceptual difficulties to obtain CeFeO3, a feasible alternative is highly desirable. The solution combustion synthesis (SCS) method was explored in this study, as it exhibits such advantages as the short reaction time and the concomitant formation of an inert gas, which prevents oxidation of Ce (III). Overall, SCS is one of the simplest, fast, and most efficient methods for the synthesis of both simple and complex metal oxides [32,33] allowing the production of high-purity homogeneous powders [34].
SCS was proposed by Kingsley and Patil [35] as an alternative to self-propagating high-temperature synthesis (SHS) developed in 1967 by Merzhanov, Shkiro, and Borovinskaya [36]. Before the combustion process, the reactants (salts of metal and organic fuel) are brought into solution, ensuring their uniform distribution. The redox mixture, after evaporation of the solvent, ignites and eventually burns out in a self-sustaining and fast combustion reaction [37].
The fundamental possibility of obtaining CeFeO3 nanocrystals by SCS was shown in [21,24,37], where glycine or PVA/urea was used as fuel. However, only in some studies was it possible to obtain CeFeO3 without a noticeable amount of impurity phases. Quantitative phase analysis performed in [24] revealed that the product obtained using glycine-nitrate combustion (fuel-to-oxidizer ratio (φ) of 1.5) consisted of CeFeO3 with a minor amount of CeO2 (6.8 wt%). In [21], the optimal fuel-to-oxidizer ratio at which CeFeO3 is formed with the minimum amount of Fe2O3 (ca. 14 wt%) and CeO2 (ca. 30 wt%) was also found to be 1.5.
In this work, the possibility of CO2 hydrogenation using CeFeO3-containing catalysts prepared by SCS was investigated. CO2 hydrogenation to CO via the reverse water–gas shift reaction (RWGS, CO2 + H2 → CO + H2O) is one of the most promising processes of CO2 utilization because CO can be used in the downstream Fischer–Tropsch synthesis (FTS) and other applications [38,39,40,41]. The RWGS reaction is also of interest in the context of human missions to Mars, primarily because of its ability to produce water, which is a source of oxygen [42].
The effect of process conditions (fuel, fuel-to-oxidizer ratio, additives) on the physicochemical and catalytic properties of the synthesized materials was also investigated. To highlight the importance and potential of the synthesis method for perovskite-based catalysts, the catalytic efficiency was compared with the literature data.

2. Materials and Methods

2.1. Reagents

Ce(NO3)3·6H2O (99.8%, Chemcraft, Kaliningrad, Russia), Fe(NO3)3·9H2O (98.3%, Lenreactiv, St. Petersburg, Russia), NH4NO3 (98.5%, Russia), glycine (C2H5NO2, 99.2%, Lenreactiv, St. Petersburg, Russia), glucose (C6H12O6, 99.8%, Lenreactiv, St. Petersburg, Russia), urea ((NH2)2CO, 99.8%, Lenreactiv, St. Petersburg, Russia), and urotropine ((CH2)6N4, 99.5%, Russia) were used.

2.2. Synthetic Procedures

For the preparation of cerium orthoferrite CeFeO3, an appropriate amount of the fuel (glycine, glycine-glucose, urea, or urotropine) and the corresponding nitrates were dissolved in deionized water (1 mL of water per 1 g of the starting materials) in a 250 mL wide glass beaker. The weight of the reagents was taken to ensure the synthesis of 1 g of CeFeO3. Ammonium nitrate was used in the amounts of 1 g per 1 g of perovskite, while the molar ratio of glucose to glycine was 1:6. The fuel-to-oxidizer ratio (φ) was taken from 1 to 3.7 and calculated according to the following equation [34]:
φ = (−1)Σ(coeff.∙RV of fuel)/Σ(coeff.∙OV of nitrate),
where RV—the reducing valency, OV—the oxidizing valency.
In this method, metals, “C” and “H” are considered reducing elements with their corresponding valence, +4 for carbon and +1 for hydrogen. Oxygen and nitrogen are considered oxidizing agents with the valences −2 and 0, respectively [43].
For example, the reaction equation occurring in the process can be represented as:
4 Ce ( NO 3 ) 3 ( aq )   +   4 Fe ( NO 3 ) 3 ( aq )   +   20 C 2 H 5 NO 2   +   15 O 2 4 Ce Fe O 3   +   40 CO 2   +   22 N 2   +   ( 50 H 2 O )
According to this equation, the reducing valence of glycine (C2H5NO2) is +9 (RV = 4∙2 + 1∙5 + 0 – 2∙2), whereas the oxidizing valence of both Ce(NO3)3 and Fe(NO3)3 is equal to –15 (OV = 3 – 0 – 2∙3∙3), therefore φ is 1.5 (–1·9·20/(–15·4 + (–15)·4).
The obtained solution was heated to boiling on an electric plate (1 kW) and, after complete evaporation of water, was burned with the formation of a solid. Two-three batches of each material were made. Reaction equations for each synthesis are presented in the Supplementary Material.

2.3. Characterization

XRD analysis was done using a SmartLab 3 Diffractometer (Rigaku, Japan) equipped with Ni-filter (Rigaku, Japan) and 1D detector (DteX250, Rigaku, Japan) at the following conditions: CuKα radiation (λ = 1.54056 Å), 40 kV, 30 mA, a scan speed of 4°/min, and a step width of 0.01°. To determine the phase composition and the crystal structural parameters, the diffraction data were analyzed by the Rietveld method. PDWin software (v. 2.0, 2004) was used for the refinement. The structural parameters for CeFeO3 with the space group Pbnm, CeO2 with the space group Fm 3 - m, and Fe2O3 with the space group Fd 3 - mZ were taken using the ICDD PDF-2-2016 database (No. 93611, 193169, and 247036, respectively). The Pseudo-Voigt function was used for the simulation of the peak shape. The background was modeled by a Chebyshev polynomial. The mean crystallite size was calculated using the Scherrer equation.
An infrared transmission spectrum was determined using a IRTracer-100 spectrophotometer (Shimadzu, Japan). The IR spectra were recorded from 4000 to 350 cm−1. One-two mg of each solid sample was mixed with ca. 200 mg of vacuum-dried IR-grade KBr. The mixture was dispersed by grinding in an agate mortar, placed in a steel die 13 mm in diameter, and gradually subjected to a pressure of 12 tons under vacuum pumping.
N2-physisorption analysis was performed on ASAP 2020 (Micromeritics, Norcross, GA, USA) and Autosorb-6iSA (Quantachrome Instruments, Boynton Beach, FL, USA). Prior to the measurements, the samples were degassed at 200 °C under vacuum. The specific surface area and the total pore volume were determined from N2 adsorption isotherms applying the BET equation. The pore size distribution was calculated by the DFT (Density Functional Theory) method.
SEM was performed in SE mode using a VEGA 3 SBH microscope (TESCAN, Czech Republic) equipped with Oxford instruments INCAx–act for energy-dispersed X-ray spectroscopy (EDS).
H2-TPR was performed on Chemosorb (SOLO, Novosibirsk, Russia) with a thermal conductivity detector (TCD). Before H2-TPR, an SCS-product (ca. 60 mg) was pretreated in air to ca. 330–350 °C. The reduction was performed from 50–100 to 900 °C at a ramp rate of 10°/min under 10 vol. % H2 in Ar (99.998 vol. % purity) and a total gas flow of 20 mL/min. Isopropanol cooled in liquid nitrogen was used as a water trap. CuO was used to calibrate hydrogen consumption.
TGA and DTA were done on a simultaneous thermal analyzer DTG-60A (Shimadzu) by heating a sample in air or nitrogen to 800 °C with a rate of 10 °C/min. The weight measurement error was 1% for TGA and 1 μV for DTA.

2.4. Catalytic Tests

The experiments were carried out in a fixed-bed reactor at atmospheric pressure. Approximately 300 mg of the powder sample (the fraction below 100 μm) was placed on a diffuser grid made of SiO2 in the cylindrical quartz reactor (37 mm in length, 1.5 cm in inner diameter), which contained a thermocouple pocket with a diameter of 5 mm. The gases were fed into the reactor from top to bottom. The sample was initially heated in the air flow (30 mL/min) to 300 °C, then flushed with N2 (99.999 vol. % purity, 20 mL/min) up to 400 °C. Thereafter, 50 vol. % H2 in N2 was fed with a total flow of 40 mL/min for 1 h. After reduction, the sample was exposed to the reactants at a weight hourly space velocity (WHSV) of 10,000 mL·g–1·h–1 (30 mL/min H2, 10 mL/min CO2, and 10 mL/min N2) for 15 min consecutively at 300, 400, 500, and 600 °C. Nitrogen in the gas flow was used as the internal standard for gas chromatography, allowing the establishment of mass balance. In order to prevent water from entering the GC, the outlet pipe passed through a cooling trap.
For comparison, long-term tests were performed at an elevated WHSV (72,000 mL·g–1·h–1), and a stoichiometric H2/CO2 ratio was chosen to evaluate the CO2 utilization efficiency. After reduction, the sample was exposed to RWGS feed (40 mL/min H2, 40 mL/min CO2, and 40 mL/min N2) at 600 °C for 4 h.
The gas products were analyzed on a GC-2010 Plus chromatograph (Shimadzu) with a TCD (RT-Msieve 5A capillary column (30 m, dinner = 0.53 mm) and Rt-Q-BOND capillary column (30 m, dinner = 0.53 mm); temperature program: 30 °C–5 min; 30–60 °C with a heating rate 4°/min; 60–100 °C with a heating rate 15°/min; 100–150 °C with a heating rate 30°/min; 150 °C–3 min; 150–180 °C with a heating rate 5°/min; 180 °C–23.9 min).
Catalytic behavior was evaluated in terms of CO2 conversion (X, %), selectivity to CO and methane ( S C H 4 , mol%). The following equations were used for calculating:
X C O 2 = M o l a r   f l o w   C   f r o m   p r o d u c t s M o l a r   f l o w   C   f r o m   C O 2 + p r o d u c t s · 100 %
S i = M o l a r   f l o w   C   f r o m   i T o t a l   m o l a r   f l o w   C   f r o m   p r o d u c t s · 100 %
where i–CO, CH4, C2H4, C2H6, C3H8; molar flow C from i–molar flow of the product multiplied by the number of carbon atoms in the compound, mol/h; total molar flow C = n(CO) + n(CH4) + 2·n(C2H4) + 2·n(C2H6)+3·n(C3H8), mol/h.
The deactivation rate (kd) with time-on-stream (t) was calculated with the assumption that the deactivation follows first-order kinetics as follows:
k d = 1 t ( ln 1 ( X C O 2 ) t ( X C O 2 ) t ln 1 ( X C O 2 ) 0 ( X C O 2 ) 0 )
where ( X C O 2 ) 0 is the initial conversion of CO2; ( X C O 2 ) t –the conversion of CO2 at time t.
The rate of CO2 hydrogenation (r, mmol·s–1·g–1) was calculated using the following equation:
r = X C O 2 · F C O 2 m c a t
where F–the CO2 flow rate (mmol/s), mcat is the catalyst weight (g).

3. Results and Discussion

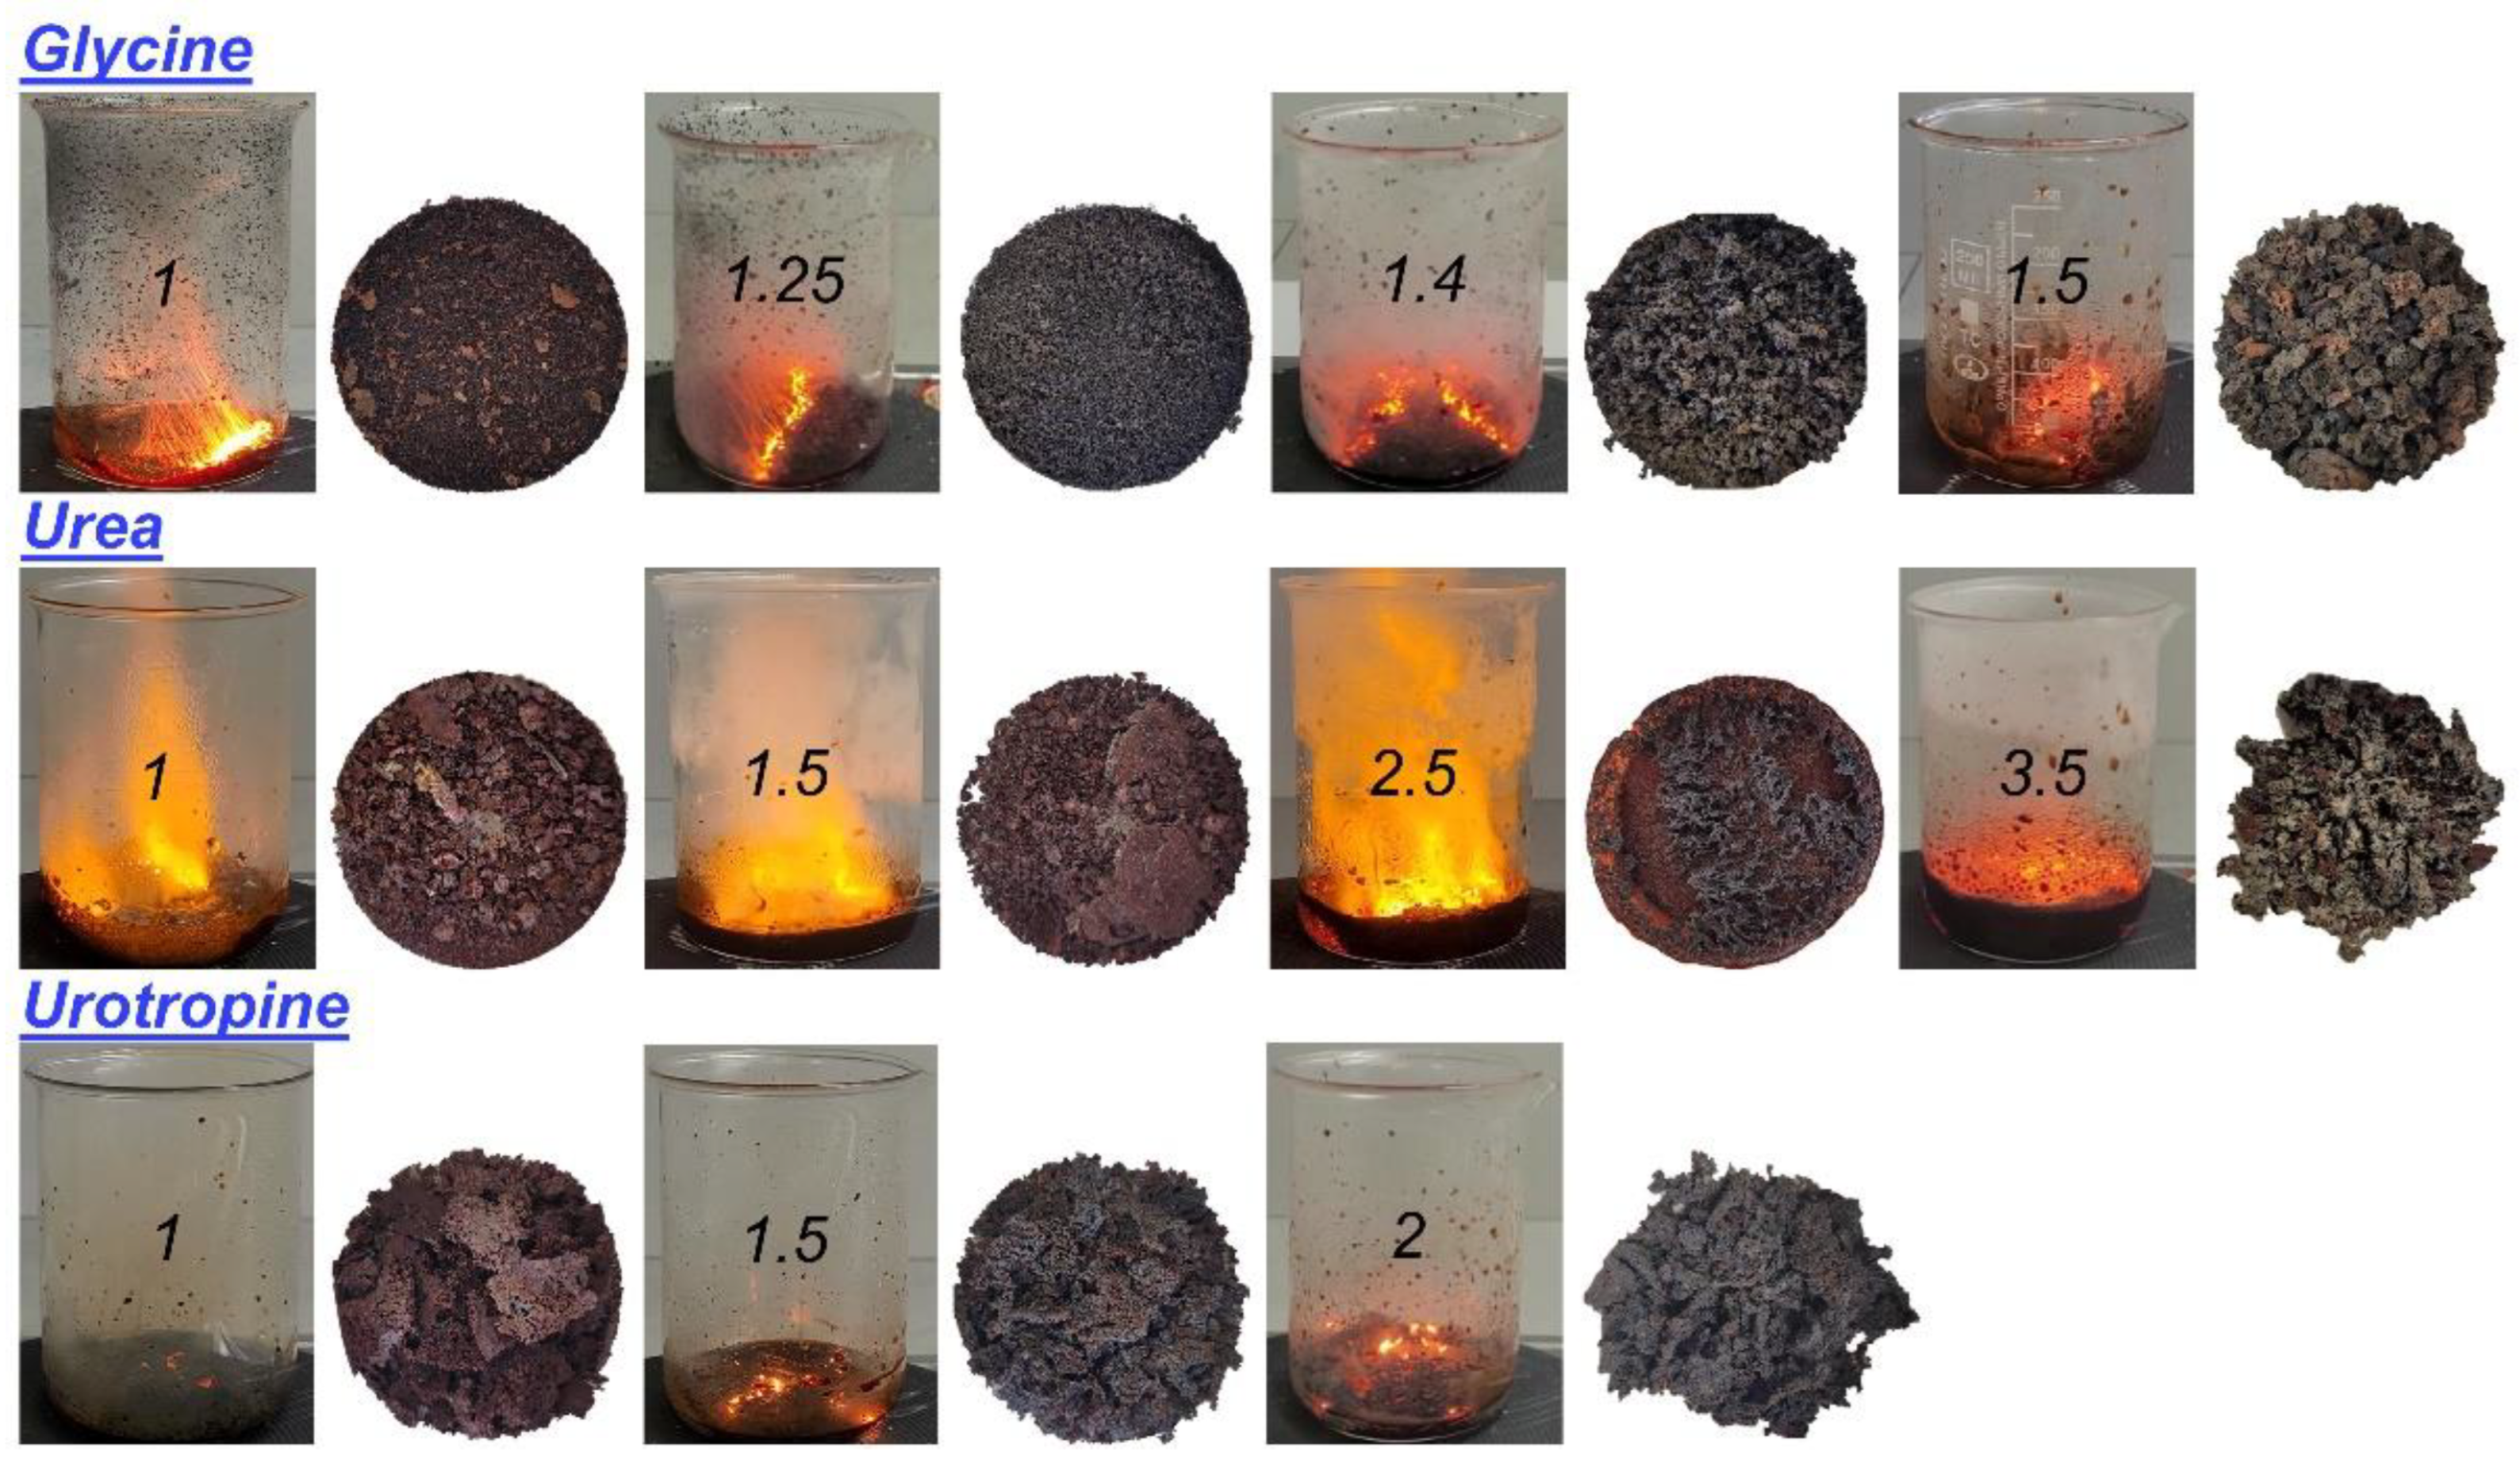
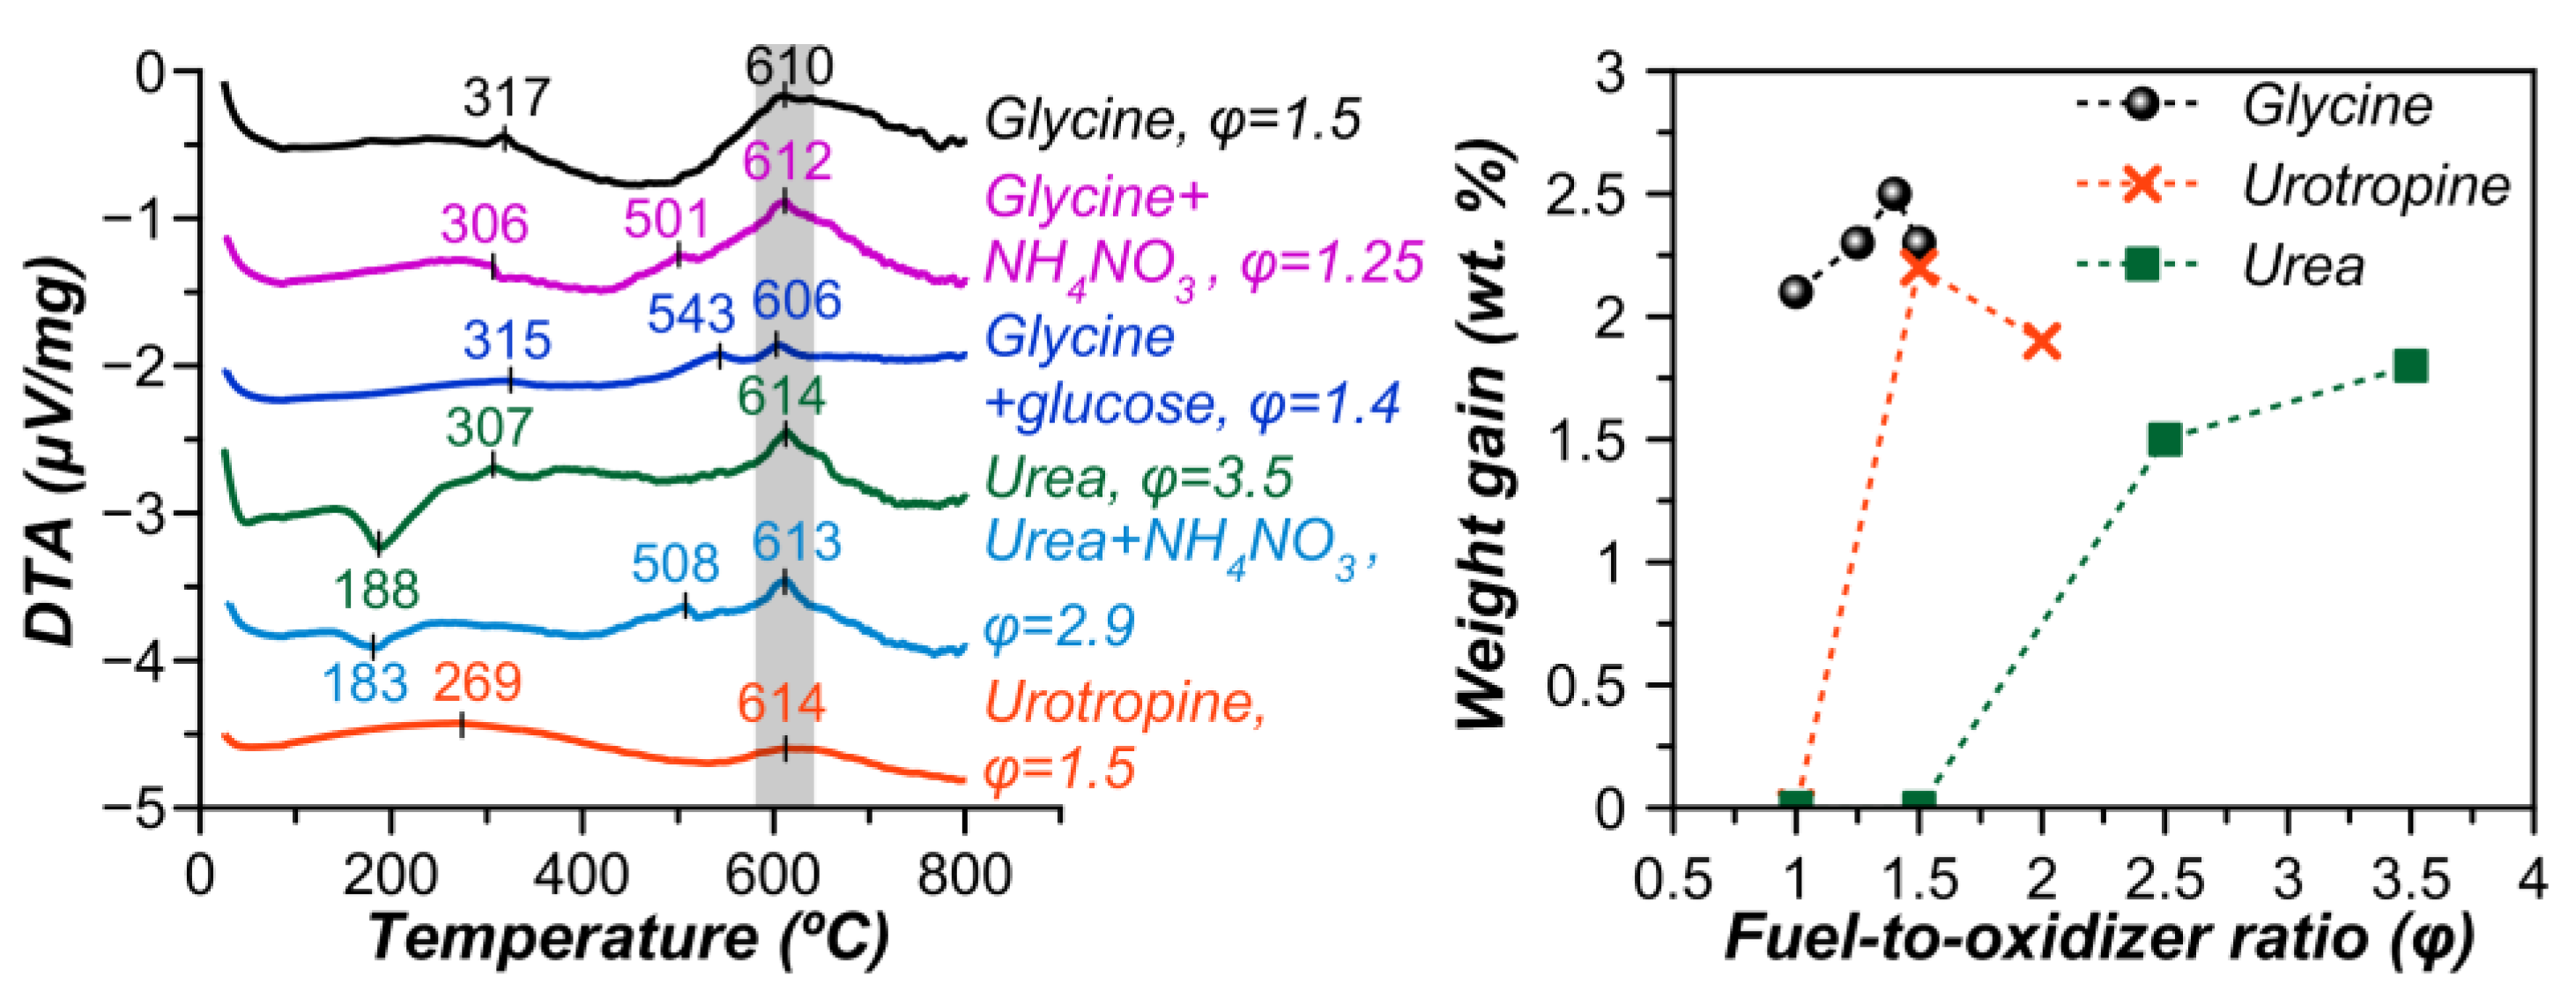
3.1. Synthesis Features and Phase Composition

Based on the previous studies on the synthesis of CeFeO3 with the solution combustion method [21,24], the first syntheses were carried out using glycine as fuel with a fuel-to-oxidizer ratio of 1–1.5. Figure 1 shows the visual course of the combustion and the macro morphology of the obtained SCS products.
It can be clearly seen from Figure 1 that combustion in the specified range of φ proceeds quite efficiently in a self-propagating mode. Abundant gas evolution leads to the formation of the fluffy powders. Despite incremental changes in the fuel-to-oxidizer ratio, the morphology and the color of the obtained solid products have changed significantly. Qualitatively, it is possible to predict the presence of the Fe3O4 (magnetite) phase in the samples in small amounts, judging by the dominance of the deep black color. The DTA curves (Figure 2), respectively, also indicate the presence of magnetite, which at ca. 300 °C turns into γ-Fe2O3, and the latter at ca. 600 °C undergoes a transformation into α-Fe2O3 (hematite) [44]. An increase in the mass of the samples upon heating in air in the range from 300 to 800 °C (Figure 2) indicates the presence of cerium orthoferrite, which undergoes oxidation according to the following reaction [45]: 6CeFeO3 + O2 = 6CeO2 + 2Fe3O4. The largest weight gain occurs when heating the sample obtained at a fuel (glycine)-to-oxidizer ratio of 1.4.
XRD measurements prove the successful synthesis of the rare earth orthoferrite CeFeO3 by glycine-nitrate solution combustion synthesis (Figure 3a). However, in all cases, there are side phases of γ-Fe2O3/Fe3O4, which are difficult to distinguish by XRD analysis, and cubic CeO2. It is believed that oxidation of a small amount of Ce(III) to Ce(IV) can occur before the ignition of the solution [24].
Compared to glycine, combustion in the presence of urea proceeds with an intensive flame both at a stoichiometric fuel-to-oxidizer ratio and upon an excess of urea φ = 2.5 (Figure 1). The extra heat from the urea combustion promoted sintering through enhanced diffusion. However, only at φ = 2.5 and more, was it possible to obtain the Ce orthoferrite phase (Figure 3b). According to the total weight change (Figure S1), despite the formation of orthoferrite, a very large amount of unburned fuel remained at φ = 3.5. This was also confirmed by IR spectroscopy showing intense bands of functional groups corresponding to the fuel (Figure 4, Table S1).
Unlike glycine and urea, urotropine (hexamethylenetetramine) with lower enthalpy of combustion [46,47] has not been previously used to obtain cerium orthoferrite. No obvious ignition was noticed and combustion proceeded in a smoldering mode (Figure 1). In the case of a stoichiometric ratio, a glass beaker could not resist a large heat release. Nevertheless, at φ = 1.5 and 2, it was possible to synthesize CeFeO3 perovskite, despite a higher content of impurity phases compared with the use of other fuels (Figure 3c), Table 1).
For the SCS products containing reflections of cerium orthoferrite, structural studies were carried out with refinement by the Rietveld method. The quantitative phase composition and the average crystallite size (D) are presented in Table 1. For some samples, the Rietveld method was not applicable to calculate the content of Fe2O3. This suggests that the Fe2O3 particles are very small and highly dispersed on the surface or the content of free Fe2O3 is below the detection limit of XRD. Similar data were obtained in [24], where iron oxide was also not taken into account in the composition. The phase composition was corrected considering amorphous iron oxide based on the CeO2 content obtained by the Rietveld method. Table S2 contains data to benchmark the reproducibility of the synthesis results from batch to batch. The composition and the size of the orthoferrite crystallites have good reproducibility (4.5 and 6.5%, respectively), while the crystallite size of oxide phases was less efficiently reproduced due to low content of these phases.
The largest amount of CeFeO3 (ca. 93 wt%) was obtained using glycine as a fuel at φ = 1.4, while urotropine, on the contrary, led to the lowest content of the target phase. The average size of CeFeO3 crystallites ranges from ca. 49 to 75 nm depending on the fuel and its amount, which directly affects the combustion temperature. A higher temperature of combustion during SCS generally results in a larger particle size, stronger agglomeration, and a lower specific surface area of the products. At the same time, higher amounts of released gases increase porosity and the specific surface area. Therefore, the pore structure is a compromise of the combustion temperature, as well as the type and amount of the gaseous products [48,49]. For example, with the same ratio of the fuel-to-oxidizer equal to 1.5, glycine, due to the lower combustion temperature and high gas evolution, afforded more dispersed particles of orthoferrite compared to urotropine (Table 1).
The influence of ammonium nitrate and glucose addition to the fuel on the purity of cerium orthoferrite was also studied (Table S3). Neat ammonium nitrate as a strong oxidizing agent supports and accelerates fuel combustion. It was observed that upon adding 1 g NH4NO3 to a mixture of glycine with metal nitrates, the amount of formed perovskite increased from ca. 82 (N.4, Table 1) to ca. 94 wt% (N.5). A similar situation occurs during firing with urea when the yield of perovskite increased from 80 to 87 (N.9 and 10, Table 1). This phenomenon can apparently be explained by an increase in the formation of gases that prevent the oxidation of orthoferrite. Such Ce orthoferrite content is the highest obtained by the SCS method among previously published studies (96 versus 93 wt% [24], excluding iron oxide).
Glucose, as a typical carbohydrate, being a large and bulky molecule, tends to leave large voids while burning. Combustion of glycine with glucose is accompanied by the ejection of the sample in the form of fragile filaments (see Table S3). Despite this, the Ce orthoferrite content is greatly reduced from 74 to 63 wt% (N.1 and 7, Table 1).
The size of crystallites in Ce-Fe oxide systems was also analyzed. Reflections of iron oxide are poorly detected (Figure S2), therefore the results in Table 2 are presented for only CeO2. The smallest size of ceria was obtained by using glycine and glucose at a high fuel-to-oxidizer ratio, but in this case, almost a third of the fuel was not burned (N.13, Table 2). Urea and urotropine at φ = 1 have led to approximately the same size of crystallites and weight losses.

3.2. Structural and Textural Properties

SEM images of the powders prepared using different types of fuel are shown in Figure 5. For all SCS products, micrographs reveal a porous foam-like network of agglomerated interconnected particles. As can be seen, when using glycine (Figure 5a–c), in contrast to urea (Figure 5d,e) and urotropine (Figure 5f), it is not possible to reveal pronounced grain boundaries in the samples, crystals of which have coalesced into each other. This can be attributed to a lower flame temperature reached for the reaction between glycine and nitrates [47].
Fuel type, as well as the fuel-to-oxidizer ratio, can strongly affect closed and open porosity, the average thickness of the pore wall, etc. The most porous sample, as expected, was prepared using glucose as an additive to glycine (Figure 5c). In turn, the dimensional restrictions of the pore walls (a neck) can affect the phase composition of the SCS products. Insufficient pore wall thickness for the formation of an orthoferrite phase stable under the given conditions can be the reason for the formation of more stable products (CeO2, Fe2O3) with smaller crystallites [21]. This explains a decrease in the content and diameter of cerium orthoferrite crystallites upon using glucose (Table 1).
To estimate the specific surface area (SBET) and the total pore volume (ΣVpore), low-temperature N2 adsorption-desorption was performed, the results of which are presented in Table 3 and Figure 6. SBET for samples with a high content of CeFeO3 (80–94 wt%) turned out to be extremely low (2–3 m2/g). A sample prepared using glucose as a second fuel allowed a slight increase in the specific surface area to ca. 8 m2/g compared to a sample with the same CeFeO3 content obtained by urotropine-nitrates combustion (N.12, Table 3). No positive effect of NH4NO3 on the porosity characteristics of the obtained materials has been found in this study, in contrast to [50], where the use of ammonium nitrate with a mixture of urea and metal nitrates increased the specific surface area of perovskite LaMnO3 from 4 to ca. 20 m2/g. The sample containing only iron and cerium oxides has a fairly large specific surface area of ca. 81 m2/g (N.15, Table 3), which is in fact larger than that of the Ce–Fe oxide system obtained by coprecipitation (14 m2/g, [51]).
All SCS products have an IUPAC type IV(a) isotherm [52], which is typical of a mesoporous structure. Apparently, small volumes of mesopores are formed due aggregation of small crystalline particles. The hysteresis loop is of the H4 type, often found in aggregated crystals. The pore size distribution for the perovskite-containing system (Figure 6a) is relatively wide, with maxima of ca. 20 and 30–40 nm compared to the Ce–Fe oxide system, which has a narrower pore size distribution with a maximum of ca. 4 nm (Figure 6b).

3.3. Reducibility

Because reducibility is an important factor influencing the catalytic efficiency of a perovskite, an H2-TPR analysis was performed. The reduction process leads to complex TPR profiles and depends on the phase composition, as can be seen in Figure 7. The corresponding amounts of hydrogen consumed in the various reduction steps, as well as the corresponding calculated amounts of hydrogen required for the reduction of Fe2O3 and CeO2, are summarized in Table 4.
For all samples, the presence of free iron oxide was noted, although in different amounts. It is well known that the reduction of Fe2O3 proceeds via Fe3O4 (magnetite) and FeO (wüstite) to iron [53,54,55]. The formation of FeO is often not observed since it is metastable and disproportionates into Fe3O4 and Fe below 620 °C [56]. According to the authors of [53], in the stepwise reduction of iron oxide, the experimental TPR profile of Fe2O3 contained two peaks at 394 and 545 °C, which correspond to Fe3O4 and FeO + Fe, respectively. The ratio of the area of the first peak to the area of the second peak should be close to 1:8.
Three reduction steps were observed on the reduction profiles of samples with a high CeFeO3 content (48–94 wt%) centered at: 399–441 °C (peak α); 511–613 °C (peak β); and above 650 °C (peak γ), which did not reach the end at 900 °C. The reduction of perovskite CeFeO3 mainly occurs at temperatures above 650 °C. In the case of a sample containing 94 wt% CeFeO3, the amount of hydrogen consumed in the first two steps is almost three times higher than expected. Thus, it cannot be excluded that surface iron ions from perovskite started to be reduced at lower temperatures. In addition, the ratio of the first two peaks is 0.8. This is due either to an increased amount of Fe2+ in free FeOx and the surface of CeFeO3, as well as the formation of oxygen-deficient CeOx, or the formation of cation-deficient CeFeO3. The first leads to an increase in the anion defectiveness of the system. In the second case, changing the number of A or B ions will initially lead to an increase in the charge of the corresponding B or A cations, similar to LaFeO3 with a deficiency of La [57]. However, at the stage of reductive activation, as well as during a catalytic process, their reduction and formation of additional oxygen vacancies are expected.
According to the literature [58], iron is mainly present in the +3-oxidation state in an AFeO3 perovskite (where A is a rare earth metal), therefore, the following reduction steps can be proposed [59,60]: (1) the partial reduction of Fe3+ (clustered and surface) to Fe2+; (2) complete reduction of Fe3+ (aggregated) to Fe2+, with a possible additional consumption of hydrogen for the surface reduction of Fe2+; (3) reduction of the remaining Fe2+ to Fe0 and obtaining individual phases of Ce2O3 and Fe.
CeO2–Fe2O3 and a sample with a low CeFeO3 content (33 wt%, N.6) exhibit similar, although more complex profiles, as two additional peaks δ and ε appear at ~288–346 °C and ~629–687 °C. These peaks can hardly be attributed to cerium oxide, despite its high content. For pure CeO2, two characteristic peaks are usually observed at ca. 500 and 800 °C [61,62], which are associated with the reduction of surface and bulk oxygen, respectively. However, the CeO2–Fe2O3 system has only a low-intensity CeO2 peak at ca. 800 °C (peak ζ), thus the low-temperature peak should also be of low intensity.
In the case of the Ce–Fe oxide system, CeO2 (002) reflection is also shifted toward larger diffraction angles, and the lattice parameters of cerium decrease to 5.376 Å (Table 4), which indicates the formation of a Ce1-xFexO2-d solid solution after the replacement of Ce4+ (0.97 Å) to Fe3+ with a smaller size (0.64 Å) inside the structure of the cubic phase of CeO2. This leads to the formation of oxygen vacancies owing to the charge balance [56,61]. It was shown in [56] that the reduction ability increases with the close interactions of Fe and Ce cations.
Therefore, Fe2O3 in the Ce–Fe oxide system undergoes a three-stage reduction of Fe2O3 to Fe3O4 (413 °C), Fe3O4 to FeO (ca. 550 °C), and then to Fe (629 °C), as can be confirmed by 2D XRD pattern recorded during H2-TPR for 70Ce−Fe [51]. Regarding the peak at ~288–346, it can be associated according to [63] with dispersed Fe.
In summary, the results of the characterization revealed that the phase transformation of the synthesized materials is strongly affected by the amount of perovskite. To evaluate the impact on catalytic properties, the samples with different amounts of CeFeO3 were tested in CO2 hydrogenation.

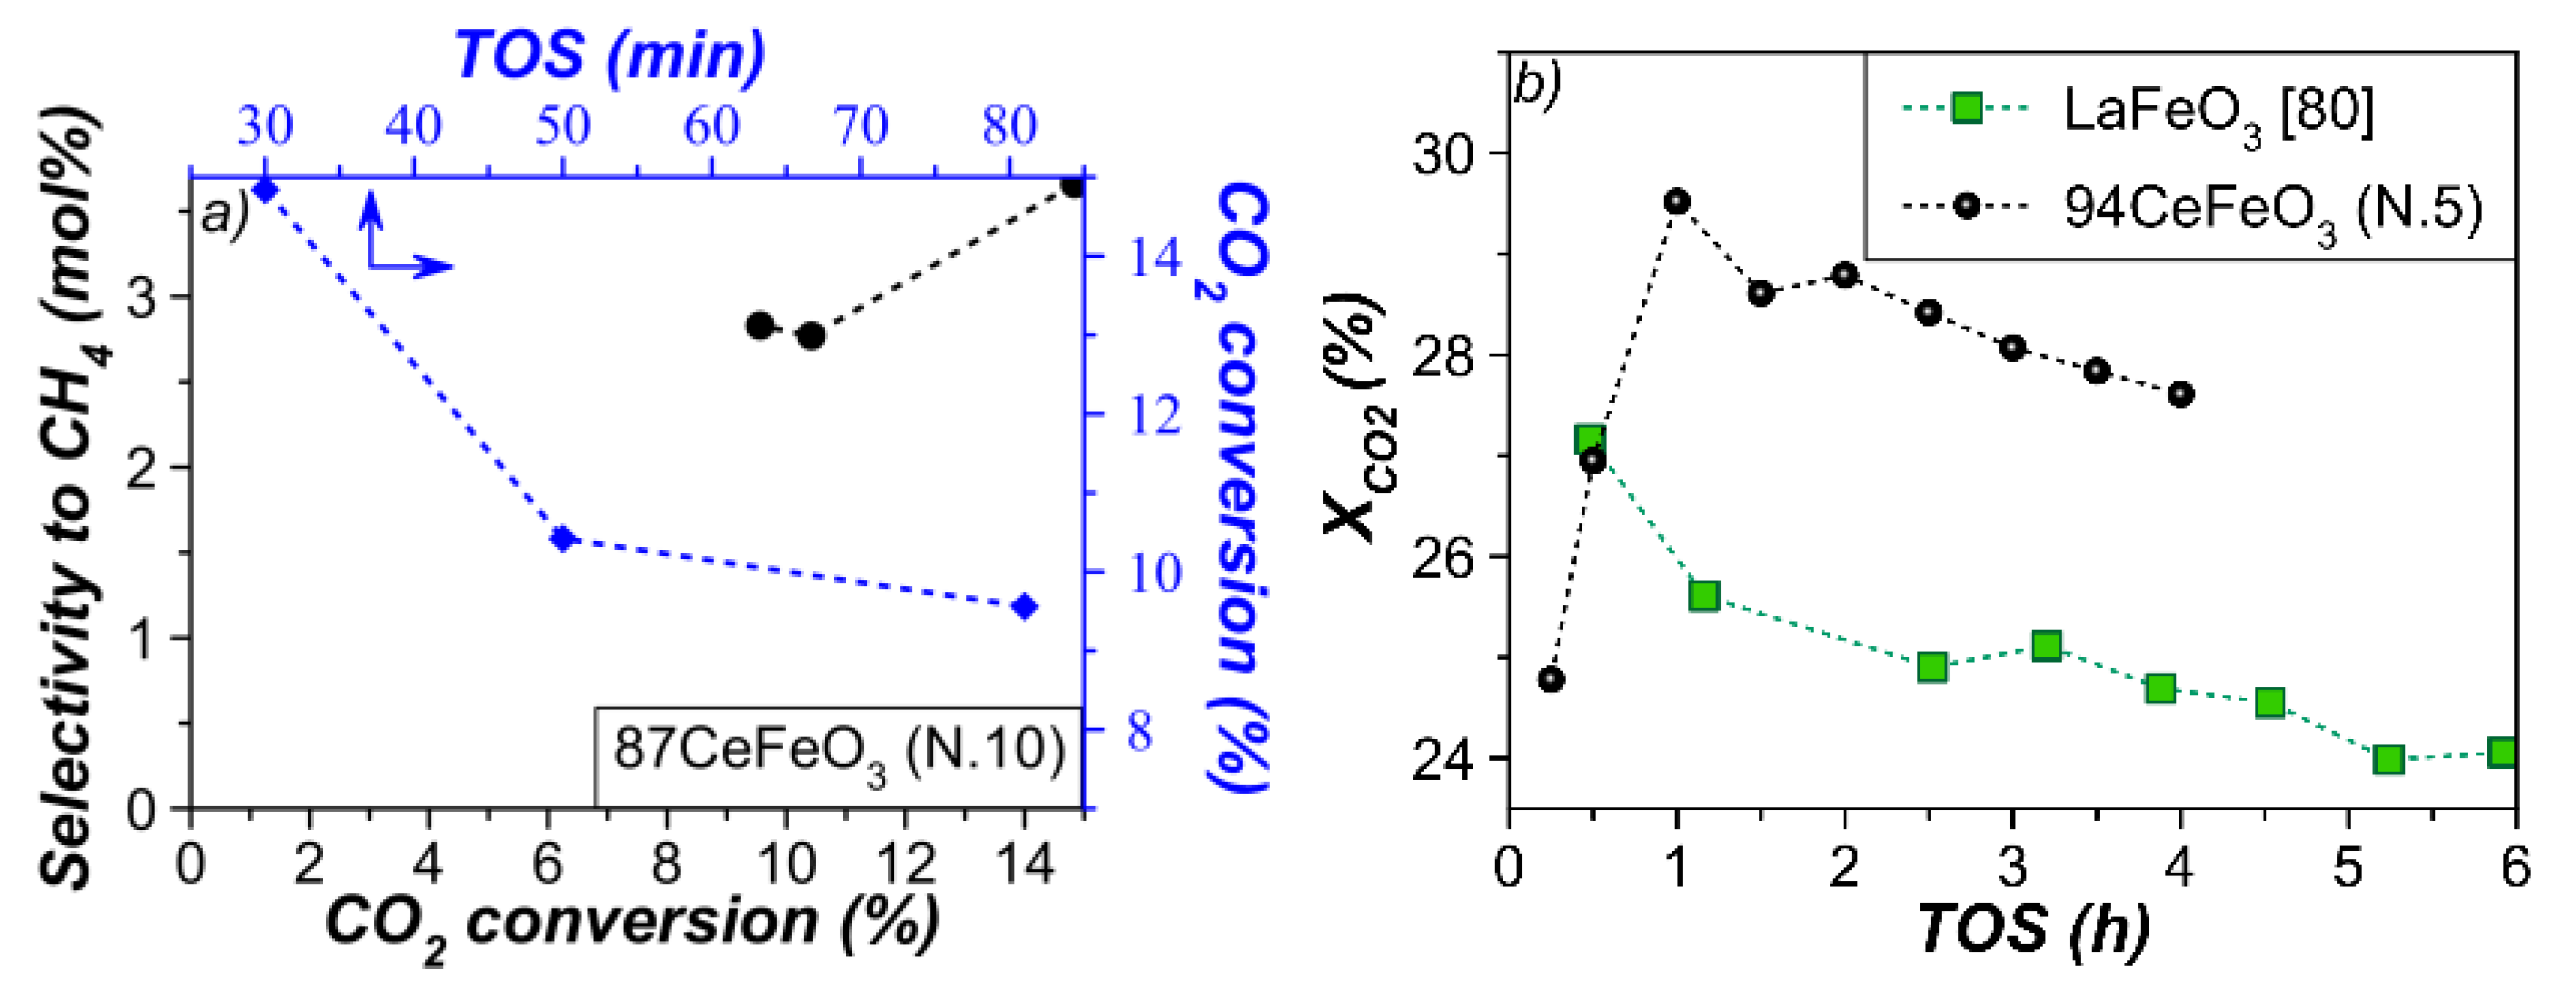
3.4. Catalytic Performance

Figure 8 shows the catalytic behavior of the samples as a function of reaction temperature and perovskite content. As expected, the temperature has a critical effect on CO2 conversion. Elevation of temperature resulted in lower apparent activation energy, which can be associated with a change in the kinetic regime through the regime of internal mass transfer limitations to the regime of limitations by external diffusion (Figure S3). It was found that some samples are more active at temperatures of 300–400 °C, while others are more active at 500–600 °C. The observed activation energy for CO2 hydrogenation in the range of 300–400 °C was determined to be 101 kJ/mol for the Ce–Fe oxide system (N.14), and 87 kJ/mol for the material containing CeFeO3 (N.5). These data generally correspond to the literature data, where the activation energy was reported to be 80 kJ/mol for Fe3O4 (327–427 °C), and 110 kJ/mol for an industrial catalyst Cu/ZnO/A12O3 (170–260 °C) [64].
With increasing the perovskite content no clear trends in conversion could be seen; therefore, it is quite probable that iron oxide, and not only perovskite, is also responsible for the activity of all samples. CO2 hydrogenation over Fe-based catalysts has been extensively investigated because they contain active sites necessary to realize the two catalytic reactions in this process: CO production by reverse water gas shift reaction (RWGS) and Fischer–Tropsch synthesis (FTS) with hydrocarbon formation [65].
The dominant product for all samples, and for many even the only one, is CO. For the three most active samples (N.5, 6, 10) at a low reaction temperature, the formation of C1–C3 hydrocarbons is observed (Figure 8). High RWGS activity and absence of FTS have been found earlier for Fe oxide phases that did not form carbides as a result of carburization under conditions of CO formation [66]. It has been established that FeCx species are formed by the conversion of surface layers of the Fe3O4 phase [67]. In addition, in the presence of a carburizing environment (CO2/H2), Fe0 species could be quickly transformed into hexagonal iron carbides [68,69]. Fe2O3 as well as Fe are not active in Fischer–Tropsch synthesis and hydrocarbon formation starts only after partial carburization [66,67,70]. Thus, the increased activity of some samples at low temperatures is indirect evidence of Fe3O4, Fe, and carbide phase formation during the reaction. It is stated in the literature that oxide and carbide nanoparticles of Fe located in close proximity to each other provide active sites for RWGS and FTS [71,72,73]. At the same time, CO2 conversion and selectivity to hydrocarbons depend on the ratio of Fe3O4 and Fe5C2 phases [74].
XRD did not detect iron carbide in the spent catalysts (Figure 9), which is probably due to its small amount, in line with low selectivity to hydrocarbons. The only new phase is metallic iron, which appeared in the XRD patterns of the samples tested at 500 °C and a high contact time (0.36 s). The Ce–Fe oxide system has the highest metallic iron content after the reaction. In [75], an increase in the amount of surface Fe0 species in the freshly reduced catalysts led to a linear decrease in methane yield.
On the other hand, a contribution to the increase in activity is also possible due to the presence of cerium. Compared to CeO2 and Fe2O3, mixed samples of CeO2–Fe2O3 displayed increased activity, especially 20 wt% CeO2 [51]. Moreover, a combination of both oxides efficiently suppresses the sintering and improves stability in CO2 reduction to CO by chemical looping. The effect of ceria can also be associated with the formation of a Ce–Fe oxide solid solution that increases the specific surface area and, possibly, increases the electron density on Fe atoms in active carbide phases, acting as a main electronegative promoter [76]. Therefore, the catalytic performance depends both on the activity of each active phase and on their spatial distribution, and close contact between them.
The samples that are most active at low temperatures have in common the utilization of ammonium nitrate as an additive to the oxidizer. The flash pyrolysis of NH4NO3 is known to yield N2, H2O, and O2, excluding a possibility of NOx formation [77]. An increased gas formation could push the oxide phases to the surface of ferrite and increase their reactivity.
Dependences of CO2 conversion on time-on-stream and CH4 selectivity on conversion for the material active in the FTS reaction are presented in Figure 10a. It can be seen that there is a synchronous decrease in conversion and selectivity. The main deactivation factor is usually considered to be coke deposits as a result of secondary reactions [78]. In addition, it is clearly seen from Figure 10a that non-zero selectivity to CH4 is anticipated at a very close to zero conversion of CO2, which implies that CO2 is directly (without intermediate CO formation) hydrogenated to CH4 [79].
To provide a final comparison of the samples obtained in this study with other perovskite-based catalysts previously applied for CO2 hydrogenation, their activity was compared under the same reaction conditions. In [80], LaFeO3 was tested at 600 °C, WHSV of 72,000 mL·g–1·h–1, and H2/CO2 ratio of 1. The sample containing 94 wt% CeFeO3 perovskite demonstrated a higher conversion with 100 mol% CO selectivity compared to LaFeO3 (Figure 10b). In the first hour of the reaction, an induction period of catalyst activation is observed, during which the activity increases from 24.8 to 29.5%, due to the residual reduction of iron oxides. The deactivation rate constant (kd) was the same as for LaFeO3 (0.02 h–1). In fact, in this case, deactivation is slower than in the case of a commercial catalyst (kd = ~0.13 h–1, 5 h of TOS [81]).
It was suggested that the activity of LaFeO3 is due to the abundance of oxygen vacancies, which contribute to CO2 activation [80]. For the CeFeO3 catalyst, the synergy between the phases is explained by the creation of a large amount of oxygen vacancies in the presence of CeFeO3 and CeO2 stimulating the migration of oxygen ions, while iron species on the surface promote a pathway of the oxygen spillover from subsurface to surface and improve lattice oxygen transfer [82,83]. CO2 adsorption and dissociation on CeO2 surface defects followed by the formation of carbonates and formates are also often considered as the reaction mechanism for the RWGS reaction over CeO2-supported catalysts [84,85]. The presence of a large amount of Fe0 in the Fe2O3–CeO2 composite and the oxygen deficiency of CeFeO3 obtained using NH4NO3 can contribute to a change in the reaction mechanism. Both systems are generally characterized by the redox mechanism; however, for defective CeFeO3, the role of associative mechanisms seems to also increase at 300–400 °C [85].
CO2 hydrogenation for the catalyst and some materials reported in the literature are presented in Table 5. The CeFeO3-based catalyst exhibited a similar or even higher CO2 hydrogenation rate compared to some other recently reported materials, including the commercial catalyst Cu/ZnO/Al2O3.
It was also considered how much carbon dioxide emissions are generated during the synthesis of the materials compared to the catalytic process. The mass balance is presented in Table S4. For the calculations, a reaction equation was used giving the maximum formation of perovskite, that is, the one corresponding to glycine and NH4NO3 as reagents. Excluding ammonium nitrate, the fuel-to-oxidizer ratio is 1.5, meaning that because of a slight excess of fuel more gases are released.
During the synthesis of 1 g of perovskite, ca. 0.9 L of CO2 is released. Therefore, there is less carbon dioxide per 300 and 100 mg of the catalyst (shown in Table S5). Based on the conditions of the experiments carried out in this study, the time to reach the conversion corresponding to released amounts of CO2 during the synthesis of the perovskite was calculated. Such time depends on conversion and WHSV. On the other hand, the catalyst can operate for a long time both with or without regeneration. Therefore, it can be concluded that the amount of reacted carbon dioxide through its hydrogenation exceeds the amount of CO2 formed during the synthesis of perovskites.

4. Conclusions

In this study, solution combustion synthesis has been successfully applied for the preparation of CeFeO3 perovskite-based catalysts, which were investigated for the first time in CO2 hydrogenation. Hydrogenation of CO2 from industrial exhaust gases via the reverse water–gas shift reaction (RWGS) to CO represents one of the most promising CO2 utilization processes because CO can be used in the downstream Fischer–Tropsch (FTS) reaction and other applications. The driving force for the development of new systems for this process is the low thermal stability of industrial copper-based catalysts at high temperatures and, therefore, their rapid deactivation because of sintering and reoxidation. CeFeO3, in turn, is highly stable under reducing conditions and, due to its defective structure, has the potential to be used in CO2 hydrogenation.
The solution combustion synthesis method represents an alternative to the traditional techniques due to its short synthesis time, low cost, and energy savings, while the main drawback is associated with the formation of pollutant gases, NH3 or NOx. In this respect, SCS is similar to other methods when nitrate precursors are used. To achieve the highest yield of cerium orthoferrite, several fuels were used, such as glycine, urea, and urotropine, as well as such additives as glucose and ammonium nitrate. NH4NO3 prevents oxidation of Ce(III) to Ce(IV), which is usually an undesirable side reaction. In combination with glycine, NH4NO3 makes it possible to obtain the highest yield of cerium orthoferrite (94 wt%). Depending on the synthesis conditions, the combustion products had different phase compositions, crystallinity, specific surface area, and reducibility, the effect of which was evaluated in CO2 hydrogenation.
Various CeFeO3–CeO2–Fe2O3 systems containing from 0 to 94 wt% CeFeO3 have shown that RWGS reaction is dominant in the CO2 hydrogenation process. At the same time, it was found that samples prepared using ammonium nitrate are more active at temperatures of 300–400 °C and form hydrocarbons (CH4, C2H4, C2H6, and C3H8) in addition to CO. The best catalytic performance in CO2 hydrogenation at low temperatures and the H2:CO2 ratio of 3:1 was obtained with a sample containing 33% CeFeO3 prepared using glycine and ammonium nitrate.
At 600 °C and the H2:CO2 ratio of 1:1, the CeFeO3-based catalyst exhibits higher activity than another member of the rare-earth orthoferrite class LaFeO3. Activity can be enhanced by the presence of unbound cerium and iron oxides, due to the fact that Ce–Fe perovskite and CeO2 phases can produce more oxygen vacancies and promote migration of the oxygen ion, while surface iron particles facilitate the oxygen spillover from subsurface to surface.

Supplementary Materials

The following supporting information can be downloaded at: https://0-www-mdpi-com.brum.beds.ac.uk/article/10.3390/ma15227970/s1, Figure S1: Total weight change during heating in air from 25 to 800 °C for the as-prepared samples produced by SCS using different fuels, additives and fuel-to-oxidizer ratios; Figure S2: XRD data for Ce–Fe oxide systems obtained by the SCS method using various types of fuel and fuel-to-oxidizer ratios; Figure S3: Dependence of the rate for a heterogeneous catalytic reaction on temperature; Table S1: Assignment of major absorption IR spectra peaks for the as-prepared samples produced by solution combustion synthesis using different fuels; Table S2 Data on the phase composition, crystallinity and reproducibility of the synthesized materials according to the refinement by the Rietveld method; Table S3: Influence of additions (glucose, NH4NO3) on glycine(or urea)-nitrate solution combustion process and the obtained SCS products; Table S4: The mass balance of combustion process; Table S5: Calculation of the volume of released CO2 and time for its conversion.

Author Contributions

Conceptualization, A.N.M.; methodology, A.N.M. and S.O.O.; investigation, A.N.M., S.O.O. and M.A.G.; resources, D.A.S.; data curation, A.N.M.; writing—original draft preparation, A.N.M.; writing—review and editing, D.Y.M. All authors have read and agreed to the published version of the manuscript.

Funding

This research was funded by the Russian Science Foundation (grant number 22–23–20094, https://rscf.ru/project/22-23-20094/, accessed on 20 October 2022) and the St. Petersburg Science Foundation (agreement number 26/2022 from 14 April 2022).

Institutional Review Board Statement

Not applicable.

Informed Consent Statement

Not applicable.

Acknowledgments

The authors would like to thank research Maria Chebanenko (Ioffe Institute) and engineer Maria Serazhim (St. Petersburg State Institute of Technology (Technical University)) for performing two N2 physisorption measurements.

Conflicts of Interest

The authors declare no conflict of interest.

References

  1. Rodríguez-Padró, D.; Puente-Santiago, A.R.; Balu, A.M.; Muñ Oz-Batista, M.J.; Luque, R. Environmental Catalysis: Present and Future. ChemCatChem 2019, 11, 18–38. [Google Scholar] [CrossRef]
  2. Dincer, I.; Acar, C. Review and Evaluation of Hydrogen Production Methods for Better Sustainability. Int. J. Hydrogen Energy 2015, 40, 11094–11111. [Google Scholar] [CrossRef]
  3. Abe, J.O.; Popoola, A.P.I.; Ajenifuja, E.; Popoola, O.M. Hydrogen Energy, Economy and Storage: Review and Recommendation. Int. J. Hydrogen Energy 2019, 44, 15072–15086. [Google Scholar] [CrossRef]
  4. Voorhoeve, R.J.H.; Johnson, D.W.; Remeika, J.P.; Gallagher, P.K. Perovskite Oxides: Materials Science in Catalysis. Science 1977, 195, 827–833. [Google Scholar] [CrossRef] [PubMed]
  5. Monama, G.R.; Ramohlola, K.E.; Iwuoha, E.I.; Modibane, K.D. Progress on Perovskite Materials for Energy Application. Results Chem. 2022, 4, 100321. [Google Scholar] [CrossRef]
  6. Yan, S.; Yim, C.-H.; Pankov, V.; Bauer, M.; Baranova, E.; Weck, A.; Merati, A.; Abu-Lebdeh, Y.; Gerbaldi, C. Perovskite Solid-State Electrolytes for Lithium Metal Batteries. Batteries 2021, 7, 75. [Google Scholar] [CrossRef]
  7. Cao, Y.; Liang, J.; Li, X.; Yue, L.; Liu, Q.; Lu, S.; Asiri, A.M.; Hu, J.; Luo, Y.; Sun, X. Recent Advances in Perovskite Oxides as Electrode Materials for Supercapacitors. Chem. Commun. 2021, 57, 2343–2355. [Google Scholar] [CrossRef]
  8. Xu, X.; Wang, Y.; Meng, H.; Zhu, T.; Yan, D.; Zhu, W.; Liu, S.; Zhao, Q. Perovskite-Perovskite Junctions for Optoelectronics: Fundamentals, Processing, and Applications. Matter 2022, 5, 2086–2118. [Google Scholar] [CrossRef]
  9. Dang, T.T.; Nguyen, T.L.A.; Ansari, K.B.; Nguyen, V.H.; Binh, N.T.; Phan, T.T.N.; Pham, T.H.; Hang, D.T.T.; Amaniampong, P.N.; Kwao-Boateng, E.; et al. Perovskite Materials as Photocatalysts: Current Status and Future Perspectives. In Nanostructured Photocatalysts: From Fundamental to Practical Applications; Elsevier: Amsterdam, The Netherlands, 2021; pp. 169–216. [Google Scholar] [CrossRef]
  10. Xu, X.; Pan, Y.; Ge, L.; Shao, Z. Perovskite Materials in Electrocatalysis. In Revolution of Perovskite: Synthesis, Properties and Applications; Arul, N.S., Nithya, V.D., Eds.; Springer: Singapore, 2020; pp. 209–250. ISBN 978-981-15-1267-4. [Google Scholar]
  11. Roth, R.S. Classification of Perovskite and Other ABO3-Type Compounds. J. Res. Natl. Bur. Stand. 1957, 58, 75–88. [Google Scholar] [CrossRef]
  12. Bhattar, S.; Abedin, M.A.; Kanitkar, S.; Spivey, J.J. A Review on Dry Reforming of Methane over Perovskite Derived Catalysts. Catal Today 2021, 365, 2–23. [Google Scholar] [CrossRef]
  13. Joshi, A.; Shah, V.; Mohapatra, P.; Kumar, S.; Joshi, R.K.; Kathe, M.; Qin, L.; Tong, A.; Fan, L.S. Chemical Looping-A Perspective on the next-Gen Technology for Efficient Fossil Fuel Utilization. Adv. Appl. Energy 2021, 3, 100044. [Google Scholar] [CrossRef]
  14. Goldschmidt, V.M. Die Gesetze Der Krystallochemie. Naturwissenschaften 1926, 14, 477–485. [Google Scholar] [CrossRef]
  15. Galasso, F.S. Structure of Perovskite-Type Compounds. In Structure, Properties and Preparation of Perovskite-Type Compounds; Pergamon: Oxford, UK, 1969; pp. 3–49. ISBN 978-0-08-012744-6. [Google Scholar]
  16. Park, N.G. Perovskite Solar Cells: An Emerging Photovoltaic Technology. Mat. Today 2015, 18, 65–72. [Google Scholar] [CrossRef]
  17. Vyshatko, N.P.; Kharton, V.; Shaula, A.L.; Naumovich, E.N.; Marques, F.M.B. Structural Characterization of Mixed Conducting Perovskites La(Ga,M)O3−δ (M = Mn, Fe, Co, Ni). Mater. Res. Bull. 2003, 38, 185–193. [Google Scholar] [CrossRef] [Green Version]
  18. Richter, J.; Holtappels, P.; Graule, T.; Nakamura, T.; Gauckler, L.J. Materials Design for Perovskite SOFC Cathodes. Mon. Chem.-Chem. Mon. 2009, 140, 985–999. [Google Scholar] [CrossRef] [Green Version]
  19. Fedorovskiy, A.E.; Drigo, N.A.; Nazeeruddin, M.K. The Role of Goldschmidt’s Tolerance Factor in the Formation of A2BX6 Double Halide Perovskites and Its Optimal Range. Small Methods 2020, 4, 1900426. [Google Scholar] [CrossRef]
  20. Inoue, I.H. Electrostatic Carrier Doping to Perovskite Transition-Metal Oxides. Semicond. Sci. Technol. 2005, 20, S112–S120. [Google Scholar] [CrossRef] [Green Version]
  21. Zaboeva, E.A.; Izotova, S.G.; Popkov, V.I. Glycine-Nitrate Combustion Synthesis of CeFeO3-Based Nanocrystalline Powders. Russ. J. Appl. Chem. 2016, 89, 1228–1236. [Google Scholar] [CrossRef]
  22. Choong, C.E.; Park, C.M.; Chang, Y.Y.; Yang, J.K.; Kim, J.R.; Oh, S.E.; Jeon, B.H.; Choi, E.H.; Yoon, Y.; Jang, M. Interfacial Coupling Perovskite CeFeO3 on Layered Graphitic Carbon Nitride as a Multifunctional Z-Scheme Photocatalyst for Boosting Nitrogen Fixation and Organic Pollutants Demineralization. Chem. Eng. J. 2022, 427, 131406. [Google Scholar] [CrossRef]
  23. Bertaut, F.; Forrat, F. Sur Les Déformations Dans Les Pérovskites à Base de Terres Rares et d’éléments de Transition Trivalents. J. Phys. Radium 1956, 17, 129–131. [Google Scholar] [CrossRef]
  24. Petschnig, L.L.; Fuhrmann, G.; Schildhammer, D.; Tribus, M.; Schottenberger, H.; Huppertz, H. Solution Combustion Synthesis of CeFeO3 under Ambient Atmosphere. Ceram. Int. 2016, 42, 4262–4267. [Google Scholar] [CrossRef]
  25. Robbins, M.; Wertheim, G.K.; Menth, A.; Sherwood, R.C. Preparation and Properties of Polycrystalline Cerium Orthoferrite (CeFeO3). J. Phys. Chem. Solids 1969, 30, 1823–1825. [Google Scholar] [CrossRef]
  26. Kitayama, K.; Nojiri, K.; Sugihara, T.; Katsura, T. Phase Equilibria in the CeO and CeFeO Systems. J. Solid State Chem. 1985, 56, 1–11. [Google Scholar] [CrossRef]
  27. Ameta, J.; Kumar, A.; Ameta, R.; Sharma, V.K.; Ameta, S.C. Synthesis and Characterization of CeFeO3 Photocatalyst Used in Photocatalytic Bleaching of Gentian Violet. J. Iran. Chem. Soc. 2009, 6, 293–299. [Google Scholar] [CrossRef]
  28. Pandya, H.N.; Kulkarni, R.G.; Parsania, P.H. Study of Cerium Orthoferrite Prepared by Wet Chemical Method. Mater. Res. Bull. 1990, 25, 1073–1077. [Google Scholar] [CrossRef]
  29. Selvam, K.; Jeeva, S.; Mani, G. Structural, Magnetic and Optical Properties of Cr Doped CeFeO3 Nanoparticles Synthesized by Co-Precipitation Method. JETIR 2019, 6, 951–958. [Google Scholar]
  30. Surendran, A.; Gupta, N.K.; Aziz, F.; Kushwaha, K.K. Synthesis and Characterization of Ce-Fe Composite Nanoparticles via Sol-Gel Method. J. Nano-Electron. Phys. 2020, 12, 01025. [Google Scholar] [CrossRef]
  31. Opuchovic, O.; Kreiza, G.; Senvaitiene, J.; Kazlauskas, K.; Beganskiene, A.; Kareiva, A. Sol-Gel Synthesis, Characterization and Application of Selected Sub-Microsized Lanthanide (Ce, Pr, Nd, Tb) Ferrites. Dye. Pigment. 2015, 118, 176–182. [Google Scholar] [CrossRef]
  32. Matveyeva, A.N.; Omarov, S.O.; Nashchekin, A.V.; Popkov, V.I.; Murzin, D.Y. Catalyst Supports Based on ZnO–ZnAl2O4 Nanocomposites with Enhanced Selectivity and Coking Resistance in Isobutane Dehydrogenation. Dalton Trans. 2022, 51, 12213–12224. [Google Scholar] [CrossRef]
  33. Omarov, S.O.; Martinson, K.D.; Matveyeva, A.N.; Chebanenko, M.I.; Nevedomskiy, V.N.; Popkov, V.I. Renewable Hydrogen Production via Glycerol Steam Reforming over Ni/CeO2 Catalysts Obtained by Solution Combustion Method: The Effect of Ni Loading. Fuel Process. Technol. 2022, 236, 107429. [Google Scholar] [CrossRef]
  34. Deganello, F.; Tyagi, A.K. Solution Combustion Synthesis, Energy and Environment: Best Parameters for Better Materials. Prog. Cryst. Growth Charact. Mater. 2018, 64, 23–61. [Google Scholar] [CrossRef]
  35. Kingsley, J.J.; Patil, K.C. A Novel Combustion Process for the Synthesis of Fine Particle α-Alumina and Related Oxide Materials. Mater. Lett. 1988, 6, 427–432. [Google Scholar] [CrossRef]
  36. Merzhanov, A.G.; Borovinskaya, I.P. Historical Retrospective of SHS: An Autoreview. Int. J. Self-Propagating High-Temp. Synth. 2008, 17, 242–265. [Google Scholar] [CrossRef]
  37. Tang, P.; Zhang, J.; Fu, M.; Cao, F.; Lv, C. Characterization and Preparation Nanosized CeFeO3 by a Microwave Process. Integr. Ferroelectr. 2013, 146, 99–104. [Google Scholar] [CrossRef]
  38. Chen, X.; Chen, Y.; Song, C.; Ji, P.; Wang, N.; Wang, W.; Cui, L. Recent Advances in Supported Metal Catalysts and Oxide Catalysts for the Reverse Water-Gas Shift Reaction. Front. Chem. 2020, 8, 709. [Google Scholar] [CrossRef]
  39. Zhu, M.; Ge, Q.; Zhu, X. Catalytic Reduction of CO2 to CO via Reverse Water Gas Shift Reaction: Recent Advances in the Design of Active and Selective Supported Metal Catalysts. Trans. Tianjin Univ. 1234, 26, 172–187. [Google Scholar] [CrossRef] [Green Version]
  40. González-Castaño, M.; Dorneanu, B.; Arellano-García, H. The Reverse Water Gas Shift Reaction: A Process Systems Engineering Perspective. React. Chem. Eng. 2021, 6, 954–976. [Google Scholar] [CrossRef]
  41. Daza, Y.A.; Kuhn, J.N. CO2 Conversion by Reverse Water Gas Shift Catalysis: Comparison of Catalysts, Mechanisms and Their Consequences for CO2 Conversion to Liquid Fuels. RSC Adv. 2016, 6, 49675–49691. [Google Scholar] [CrossRef]
  42. Jia, C.; Gao, J.; Dai, Y.; Zhang, J.; Yang, Y. The Thermodynamics Analysis and Experimental Validation for Complicated Systems in CO2 Hydrogenation Process. J. Energy Chem. 2016, 25, 1027–1037. [Google Scholar] [CrossRef]
  43. González-Cortés, S.L.; Imbert, F.E. Fundamentals, Properties and Applications of Solid Catalysts Prepared by Solution Combustion Synthesis (SCS). Appl. Catal. A Gen. 2013, 452, 117–131. [Google Scholar] [CrossRef]
  44. Gheith, M.A. Differential Thermal Analysis of Certain Iron Oxides and Oxide Hydrates. Am. J. Sci. 1952, 250, 677–695. [Google Scholar] [CrossRef]
  45. Tretyakov, Y.D.; Sorokin, V.V.; Kaul, A.R.; Erastova, A.P. Phase Equilibria and Thermodynamics of Coexisting Phases in Rare-Earth Element-Iron-Oxygen Systems. I. The Cerium-Iron-Oxygen System. J. Solid State Chem. 1976, 18, 253–261. [Google Scholar] [CrossRef]
  46. Cam, T.S.; Vishnievskaia, T.A.; Popkov, V.I. Catalytic Oxidation of CO over CuO/CeO2 Nanocomposites Synthesized via Solution Combustion Method: Effect of Fuels. Rev. Adv. Mater. Sci. 2020, 59, 131–143. [Google Scholar] [CrossRef]
  47. Novitskaya, E.; Kelly, J.P.; Bhaduri, S.; Graeve, O.A. A Review of Solution Combustion Synthesis: An Analysis of Parameters Controlling Powder Characteristics. Int. Mater. Rev. 2021, 66, 188–214. [Google Scholar] [CrossRef]
  48. Pourgolmohammad, B.; Masoudpanah, S.M.; Aboutalebi, M.R. Effects of the Fuel Type and Fuel Content on the Specific Surface Area and Magnetic Properties of Solution Combusted CoFe2O4 Nanoparticles. Ceram. Int. 2017, 43, 8262–8268. [Google Scholar] [CrossRef]
  49. Varma, A.; Mukasyan, A.S.; Rogachev, A.S.; Manukyan, K.V. Solution Combustion Synthesis of Nanoscale Materials. Chem. Rev. 2016, 116, 14493–14586. [Google Scholar] [CrossRef] [PubMed]
  50. Civera, A.; Pavese, M.; Saracco, G.; Specchia, V. Combustion Synthesis of Perovskite-Type Catalysts for Natural Gas Combustion. Catal. Today 2003, 83, 199–211. [Google Scholar] [CrossRef]
  51. Galvita, V.V.; Poelman, H.; Bliznuk, V.; Detavernier, C.; Marin, G.B. CeO2-Modified Fe2O3 for CO2 Utilization via Chemical Looping. Ind. Eng. Chem. Res. 2013, 52, 8416–8426. [Google Scholar] [CrossRef]
  52. Thommes, M.; Kaneko, K.; Neimark, A.V.; Olivier, J.P.; Rodriguez-Reinoso, F.; Rouquerol, J.; Sing, K.S.W. Physisorption of Gases, with Special Reference to the Evaluation of Surface Area and Pore Size Distribution (IUPAC Technical Report). Pure Appl. Chem. 2015, 87, 1051–1069. [Google Scholar] [CrossRef] [Green Version]
  53. Liang, M.; Kang, W.; Xie, K. Comparison of Reduction Behavior of Fe2O3, ZnO and ZnFe2O4 by TPR Technique. J. Nat. Gas Chem. 2009, 18, 110–113. [Google Scholar] [CrossRef]
  54. Wei, X.; Zhou, Y.; Li, Y.; Shen, W. Polymorphous Transformation of Rod-Shaped Iron Oxides and Their Catalytic Properties in Selective Reduction of NO by NH3. RSC Adv. 2015, 5, 66141–66146. [Google Scholar] [CrossRef]
  55. Saharuddin, T.S.; Samsuri, A.; Salleh, F.; Othaman, R.; Kassim, M.; Hisham, M.W.; Yarmo, M.A. The Reduction Behaviour of Cerium Doped Iron Oxide in Hydrogen and Carbon Monoxide Atmosphere. In Materials Science Forum; Trans Tech Publications Ltd.: Wallerau, Switzerland, 2016; Volume 840, pp. 381–385. [Google Scholar]
  56. Perez-Alonso, F.J.; Melián-Cabrera, I.; López Granados, M.; Kapteijn, F.; Fierro, J.L.G. Synergy of FexCe1−xO2 Mixed Oxides for N2O Decomposition. J. Catal. 2006, 239, 340–346. [Google Scholar] [CrossRef] [Green Version]
  57. Mutter, D.; Schierholz, R.; Urban, D.F.; Heuer, S.A.; Ohlerth, T.; Kungl, H.; Elsässer, C.; Eichel, R.-A. Defects and phase formation in non-stoichiometric LaFeO3: A combined theoretical and experimental study. Chem. Mater. 2021, 33, 9473–9485. [Google Scholar] [CrossRef]
  58. Mihai, O.; Chen, D.; Holmen, A. Chemical Looping Methane Partial Oxidation: The Effect of the Crystal Size and O Content of LaFeO3. J. Catal. 2012, 293, 175–185. [Google Scholar] [CrossRef]
  59. Faye, J.; Baylet, A.; Trentesaux, M.; Royer, S.; Dumeignil, F.; Duprez, D.; Valange, S.; Tatibouët, J.M. Influence of Lanthanum Stoichiometry in La1−xFeO3−δ Perovskites on Their Structure and Catalytic Performance in CH4 Total Oxidation. Appl. Catal. B Env. 2012, 126, 134–143. [Google Scholar] [CrossRef]
  60. Heidinger, B.; Royer, S.; Alamdari, H.; Giraudon, J.-M.; Lamonier, J.-F. Reactive Grinding Synthesis of LaBO3 (B: Mn, Fe) Perovskite; Properties for Toluene Total Oxidation. Catalysts 2019, 9, 633. [Google Scholar] [CrossRef] [Green Version]
  61. Qiao, D.; Lu, G.; Liu, X.; Guo, Y.; Wang, Y.; Guo, Y. Preparation of Ce12xFexO2 Solid Solution and Its Catalytic Performance for Oxidation of CH4 and CO. J. Mat. Sci. 2011, 46, 3500–3506. [Google Scholar] [CrossRef]
  62. He, J.; Zhang, H.; Wang, W.; Yao, P.; Jiao, Y.; Wang, J.; Chen, Y. Soot Combustion over CeO2 Catalyst: The Influence of Biodiesel Impurities (Na, K, Ca, P) on Surface Chemical Properties. Environ. Sci. Pollut. Res. 2021, 28, 26018–26029. [Google Scholar] [CrossRef]
  63. Cheng, X.; Zhang, X.; Su, D.; Wang, Z.; Chang, J.; Ma, C. NO Reduction by CO over Copper Catalyst Supported on Mixed CeO2 and Fe2O3: Catalyst Design and Activity Test. Appl. Catal. B 2018, 239, 485–501. [Google Scholar] [CrossRef]
  64. Spencer, M.S. On the Activation Energies of the Forward and Reverse Water-Gas Shift Reaction. Cat. Lett. 1995, 32, 9–13. [Google Scholar] [CrossRef]
  65. Landau, M.V.; Meiri, N.; Utsis, N.; Vidruk Nehemya, R.; Herskowitz, M. Conversion of CO2, CO, and H2 in CO2 Hydrogenation to Fungible Liquid Fuels on Fe-Based Catalysts. Ind. Eng. Chem. Res. 2017, 56, 13334–13355. [Google Scholar] [CrossRef]
  66. Utsis, N.; Vidruk-Nehemya, R.; Landau, M.V.; Herskowitz, M. Novel Bifunctional Catalysts Based on Crystalline Multi-Oxide Matrices Containing Iron Ions for CO2 Hydrogenation to Liquid Fuels and Chemicals. Faraday Discuss. 2016, 188, 545–563. [Google Scholar] [CrossRef]
  67. Li, S.; Ding, W.; Meitzner, G.D.; Iglesia, E. Spectroscopic and Transient Kinetic Studies of Site Requirements in Iron-Catalyzed Fischer−Tropsch Synthesis. J. Phys. Chem. B 2001, 106, 85–91. [Google Scholar] [CrossRef] [Green Version]
  68. de Smit, E.; Weckhuysen, B.M. The Renaissance of Iron-Based Fischer-Tropsch Synthesis: On the Multifaceted Catalyst Deactivation Behaviour. Chem. Soc. Rev. 2008, 37, 2758–2781. [Google Scholar] [CrossRef]
  69. Wezendonk, T.A.; Sun, X.; Dugulan, A.I.; van Hoof, A.J.F.; Hensen, E.J.M.; Kapteijn, F.; Gascon, J. Controlled Formation of Iron Carbides and Their Performance in Fischer-Tropsch Synthesis. J. Catal. 2018, 362, 106–117. [Google Scholar] [CrossRef]
  70. Riedel, T.; Claeys, M.; Schulz, H.; Schaub, G.; Nam, S.S.; Jun, K.W.; Choi, M.J.; Kishan, G.; Lee, K.W. Comparative Study of Fischer–Tropsch Synthesis with H2/CO and H2/CO2 Syngas Using Fe- and Co-Based Catalysts. Appl. Catal. A Gen. 1999, 186, 201–213. [Google Scholar] [CrossRef]
  71. Landau, M.V.; Vidruk, R.; Herskowitz, M. Sustainable Production of Green Feed from Carbon Dioxide and Hydrogen. ChemSusChem 2014, 7, 785–794. [Google Scholar] [CrossRef]
  72. Cui, X.; Xu, J.; Zhang, C.; Yang, Y.; Gao, P.; Wu, B.; Li, Y. Effect of Pretreatment on Precipitated Fe–Mo Fischer–Tropsch Catalysts: Morphology, Carburization, and Catalytic Performance. J. Catal. 2011, 282, 35–46. [Google Scholar] [CrossRef]
  73. Ding, M.; Yang, Y.; Wu, B.; Wang, T.; Ma, L.; Xiang, H.; Li, Y. Transformation of Carbonaceous Species and Its Influence on Catalytic Performance for Iron-Based Fischer–Tropsch Synthesis Catalyst. J. Mol. Catal. A Chem. 2011, 351, 165–173. [Google Scholar] [CrossRef]
  74. Liu, J.; Li, K.; Song, Y.; Song, C.; Guo, X. Selective Hydrogenation of CO2 to Hydrocarbons: Effects of Fe3O4 Particle Size on Reduction, Carburization, and Catalytic Performance. Energy Fuels 2021, 35, 10703–10709. [Google Scholar] [CrossRef]
  75. De la Rosa-Priego, F.A.; Gutierrez-López, E.D.; Zepeda, T.A.; Acosta-Alejandro, M.; Venezia, A.M.; Fuentes-Moyado, S.; Pawelec, B.; Noé Díaz-de-León, J. Enhanced CO2 Hydrogenation to C2+ Hydrocarbons over Mesoporous X%Fe2O3–Al2O3 Catalysts. Ind. Eng. Chem. Res. 2021, 60, 18660–18671. [Google Scholar] [CrossRef]
  76. Pérez-Alonso, F.J.; López Granados, M.; Ojeda, M.; Terreros, P.; Rojas, S.; Herranz, T.; Fierro, J.L.G.; Gracia, M.; Gancedo, J.R. Chemical Structures of Coprecipitated Fe−Ce Mixed Oxides. Chem. Mater. 2005, 17, 2329–2339. [Google Scholar] [CrossRef]
  77. Pathak, L.C.; Singh, T.B.; Das, S.; Verma, A.K.; Ramachandrarao, P. Effect of PH on the Combustion Synthesis of Nano-Crystalline Alumina Powder. Mater. Lett. 2002, 57, 380–385. [Google Scholar] [CrossRef]
  78. Lee, S.C.; Kim, J.S.; Shin, W.C.; Choi, M.J.; Choung, S.J. Catalyst Deactivation during Hydrogenation of Carbon Dioxide: Effect of Catalyst Position in the Packed Bed Reactor. J. Mol. Catal. A Chem. 2009, 301, 98–105. [Google Scholar] [CrossRef]
  79. Albrecht, M.; Rodemerck, U.; Schneider, M.; Bröring, M.; Baabe, D.; Kondratenko, E.V. Unexpectedly Efficient CO2 Hydrogenation to Higher Hydrocarbons over Non-Doped Fe2O3. Appl. Catal. B 2017, 204, 119–126. [Google Scholar] [CrossRef]
  80. Zhang, J.; Wang, Y.; Tian, J.; Yan, B. Cu/LaFeO3 as an Efficient and Stable Catalyst for CO2 Reduction: Exploring Synergistic Effect between Cu and LaFeO3. AIChE J. 2022, 68, e17640. [Google Scholar] [CrossRef]
  81. Bahmanpour, A.M.; Héroguel, F.; Kılıç, M.; Baranowski, C.J.; Artiglia, L.; Röthlisberger, U.; Luterbacher, J.S.; Kröcher, O. Cu–Al Spinel as a Highly Active and Stable Catalyst for the Reverse Water Gas Shift Reaction. ACS Catal. 2019, 9, 6243–6251. [Google Scholar] [CrossRef]
  82. Wei, G.; Zhou, H.; Huang, Z.; Zheng, A.; Zhao, K.; Lin, Y.; Chang, G.; Zhao, Z.; Li, H.; Fang, Y. Reaction Performance of Ce-Enhanced Hematite Oxygen Carrier in Chemical Looping Reforming of Biomass Pyrolyzed Gas Coupled with CO2 Splitting. Energy 2021, 215, 119044. [Google Scholar] [CrossRef]
  83. Li, K.; Haneda, M.; Ning, P.; Wang, H.; Ozawa, M. Microstructure and Oxygen Evolution of Fe–Ce Mixed Oxides by Redox Treatment. Appl. Surf. Sci. 2014, 289, 378–383. [Google Scholar] [CrossRef]
  84. Goguet, A.; Meunier, F.C.; Tibiletti, D.; Breen, J.P.; Burch, R. Spectrokinetic Investigation of Reverse Water-Gas-Shift Reaction Intermediates over a Pt/CeO2 Catalyst. J. Phys. Chem. B 2004, 108, 20240–20246. [Google Scholar] [CrossRef]
  85. Ebrahimi, P.; Kumar, A.; Khraisheh, M. A Review of CeO2 Supported Catalysts for CO2 Reduction to CO through the Reverse Water Gas Shift Reaction. Catalysts 2022, 12, 1101. [Google Scholar] [CrossRef]
  86. Chen, C.S.; Cheng, W.H.; Lin, S.S. Study of Iron-Promoted Cu/SiO2 Catalyst on High Temperature Reverse Water Gas Shift Reaction. Appl. Catal. A Gen. 2004, 257, 97–106. [Google Scholar] [CrossRef]
  87. Lin, L.; Yao, S.; Rui, N.; Han, L.; Zhang, F.; Gerlak, C.A.; Liu, Z.; Cen, J.; Song, L.; Senanayake, S.D.; et al. Conversion of CO2 on a Highly Active and Stable Cu/FeOx/CeO2 Catalyst: Tuning Catalytic Performance by Oxide-Oxide Interactions. Catal. Sci. Technol. 2019, 9, 3735–3742. [Google Scholar] [CrossRef]
Figure 1. The course of the fuel-nitrate solution combustion and the macro morphology of the SCS products obtained at various fuel-to-oxidizer ratios.
Materials 15 07970 g001
Figure 2. Differential thermal curves and weight gain during heating in air for the as-prepared samples produced by SCS using different fuels, additives, and fuel-to-oxidizer ratios.
Materials 15 07970 g002
Figure 3. XRD patterns of synthesized materials by (a) glycine-nitrate; (b) urea-nitrate; and (c) urotropine-nitrate combustion at the various fuel-to-oxidizer ratios (φ) (where o-CeFeO3–orthorhombic perovskite CeFeO3 (JCPDS card no. 00-022-0166); c-CeO2–cubic CeO2 (JCPDS card no. 01-075-8371); γ-Fe2O3–cubic Fe2O3 (JCPDS card no. 00-039-1346)).
Materials 15 07970 g003
Figure 4. IR spectra of the as-prepared samples produced by solution combustion synthesis using different fuels, additives, and fuel-to-oxidizer ratios (φ).
Materials 15 07970 g004
Figure 5. SEM images of the SCS products obtained using different fuels and additives (the upper-right inset shows the corresponding high magnification image): (a) glycine, φ = 1.4; (b) glycine and NH4NO3, φ = 1.25; (c) glycine and glucose, φ = 1.4; (d) urea, φ = 3.5; (e) urea and NH4NO3, φ = 2.9; (f) urotropine, φ = 2.
Materials 15 07970 g005
Figure 6. N2 adsorption-desorption isotherms and pore size distribution for (a) the as-prepared CeFeO3–CeO2–Fe2O3 and (b) CeO2–Fe2O3 systems produced by SCS using different fuels, additives, and fuel-to-oxidizer ratios (φ).
Materials 15 07970 g006
Figure 7. Temperature-programmed reduction (TPR) spectra of the SCS-products calcined at 330–350 °C.
Materials 15 07970 g007
Figure 8. Dependence of CO2 conversion and selectivity to hydrocarbons on temperature at H2:CO2:N2 = 3:1:1, WHSV = 10 000 mL·g–1·h–1. CO selectivity is 100 mol%, except for samples additionally generating hydrocarbons (N. 5, 6, 10).
Materials 15 07970 g008
Figure 9. X-ray diffraction patterns of spent catalysts (the legend indicates the tested temperature, residence time, and TOS). ●–o-CeFeO3 (JCPDS card no. 00-022-0166); □–cubic CeO2 (JCPDS card no. 01-075-8371); ◆–γ-Fe2O3 (JCPDS card no. 00-039-1346).
Materials 15 07970 g009
Figure 10. Dependence of CO2 conversion and selectivity to CH4 on time-on-stream (TOS) at (a) 400 °C, H2:CO2:N2 = 3:1:1, WHSV = 10,000 mL·g–1·h–1; and (b) 600 °C, H2:CO2:N2 = 1:1:1, WHSV = 72,000 mL·g–1·h–1.
Materials 15 07970 g010
Table 1. Data on the phase composition and crystallinity of the synthesized materials according to the refinement by the Rietveld method.
Sample
N
Fueln(AN)/
n(MeN)
φPhase Composition According
Rietveld/Corrected 1, wt%
D (1), nmD (2), nmD (3), nmRwp/Re
CeFeO3CeO2Fe2O3
1Glycine181/7419/180/867.54.7
2Glycine1.2578121066.07.56.71.14
3Glycine1.495/935/50/261.325.01.16
4Glycine1.587/8213/120/656.89.0
5Glycine1.51.2596/944/40/269.115.61.13
6Glycine1.51.7533472032.714.814.71.03
7Glycine +
glucose
1.463231452.019.414.3
8Urea2.552282068.65.84.0
9Urea3.58013772.04.76.31.09
10Urea1.52.991/879/70/466.522.01.17
11Urotropine1.548331975.122.115.8
12Urotropine261231660.016.47.11.09
1 Taking into account amorphous iron oxide according to the equation wt%(Fe2O3) = wt%(CeO2)/2.156, where 2.156 is CeO2/Fe2O3 ratio obtained at oxidation of CeFeO3; AN–ammonium nitrate; MeN–cerium and iron nitrates; φ–the fuel-to-oxidizer ratio; D–the mean crystallite size; 1–CeFeO3; 2–CeO2; 3–γ-Fe2O3; Rwp/Re characterizes goodness of fit, if the squared value is equal to one or constant the refinement procedure is complete.
Table 2. The mean size of CeO2 crystallites (D) and total weight loss for Ce-Fe oxide systems obtained by the SCS method using various types of fuel and the fuel-to-oxidizer ratio.
Sample
N.
FuelφD (CeO2), nmTotal Weight Loss According to DTA, wt%
13Glycine + glucose2.21.929.6
14Urea15.74.6
15Urea1.55.04.4
16Urotropine16.55.5
17Urotropine64.7
Table 3. Textural characteristics of the as-prepared samples produced by solution combustion synthesis using different fuels, additives, and fuel-to-oxidizer ratios (φ).
Sample N.Fuel, Additive, φMass Fraction of CeFeO3SBET, m2/gΣVpore, cm3/gAverage Pore Size, nm
3Glycine, 1.40.9330.0116.5
5Glycine, NH4NO3, 1.250.9420.0115.0
7Glycine, glucose, 1.40.6380.1260.5
9Urea, 3.50.8030.0559.0
12Urotropine, 20.6140.0547.5
15Urea, 1.50810.136.3
Table 4. H2-TPR results and cell parameters for studied in TPR samples.
SampleUnit-Cell Volume (CeFeO3), Å3Lattice
Parameter (CeO2), Å
Theoretical H2
Uptake 1, mmol/g
H2 Uptake According to TPR, mmol/g
CeO2Fe2O3TotalArea 1
(α + ε)
Area 2
(β + δ)
Area 3
(γ + ζ)
Total
N.155.3762.056.158.203.775.420.79.89
N.6240.1205.4061.373.765.121.374.491.987.84
N.11239.8335.4080.963.574.531.132.822.826.77
N.4239.5115.4020.351.131.480.731.295.237.25
N.5239.9305.3960.120.380.490.620.785.697.09
1 Assuming a complete reduction up to Ce2O3 and Fe0, respectively.
Table 5. Comparison of catalyst selectivity and CO2 conversion rate, P = 1 atm, T = 600 °C.
CatalystH2:CO2WHSV, mL·g–1·h–1CO Selectivity, %Rate (mmol CO2/(gcat·s))Ref.
94CeFeO3–CeO2–Fe2O31:172,0001000.064This work
5Cu/LaFeO31:172,0001000.10[80]
Commercial Cu/ZnO/Al2O32:1300,0001000.076[81]
CuAl2O42:1300,0001000.005[81]
Cu−Fe/SiO21:1120,000no data0.037[86]
5Fe/CeO21:1600,000no data0.389[87]
Publisher’s Note: MDPI stays neutral with regard to jurisdictional claims in published maps and institutional affiliations.

