
Synthesis and Oxygen Storage Capacities of Yttrium-Doped CeO2 with a Cubic Fluorite Structure


1
Laboratory for Functional Materials, School of New Energy Materials and Chemistry, Leshan Normal University, Leshan 614004, China
2
National Engineering Research Center for Magnesium Alloys, College of Materials Science and Engineering, Chongqing University, Chongqing 400044, China
3
College of Materials Science and Engineering, Sichuan University, Chengdu 610065, China
4
Leshan West Silicon Materials Photovoltaic and New Energy Industry Technology Research Institute, Leshan 614000, China
*
Author to whom correspondence should be addressed.
Materials 2022, 15(24), 8971; https://0-doi-org.brum.beds.ac.uk/10.3390/ma15248971
Submission received: 24 November 2022
/
Revised: 10 December 2022
/
Accepted: 13 December 2022
/
Published: 15 December 2022
(This article belongs to the Special Issue Advanced Energy Storage Materials: Preparation, Characterization and Applications)
Abstract
:Doping CeO2 with Y cations was achieved in this study using three strategies: doping only during the hydrothermal process (H-Y-doped CeO2), doping only during the impregnation process (I-Y-doped CeO2), and doping during both the hydrothermal and impregnation processes (H/I-Y-doped CeO2). During the three synthesis strategies of Y-doped CeO2, these Y ions could be incorporated into the CeO2 lattice in the +3 state while holding the cubic fluorite structure, and no impurity phases were detected. Pure CeO2 crystal itself contained a certain number of intrinsic VO defects, and Y-doping was beneficial for the creation of extrinsic VO defects. The relative concentrations of VO defects were quantified by the values of A592/A464 obtained from Raman spectra, which were 1.47, 0.93, and 1.16 for the H-Y-, I-Y-, and H/I-Y-doped CeO2, respectively, and were higher than that of the undoped one (0.67). Moreover, the OSCs of the three Y-doped CeO2 were enhanced, and the sequence of OSCs was: H-Y-doped CeO2 (0.372 mmol/g) > H/I-Y-doped CeO2 (0.353 mmol/g) > I-Y-doped CeO2 (0.248 mmol/g) > Undoped CeO2 (0.153 mmol/g); this result was in good agreement with the Raman spectroscopy results.
1. Introduction
With the continuous development of science and technology, the development and utilization of energy and resources have become a hot topic [1,2,3]. Rare-earth elements, known as “industrial monosodium glutamate”, “industrial vitamin”, and “mother of new materials”, are precious strategic metal resources. Cerium (Ce) is the most abundant rare-earth element in the Earth’s crust. Its common valence states are +3 and +4, and the corresponding oxides are cerium sesquioxide (Ce2O3) and cerium dioxide (CeO2) [4,5,6]. Ce2O3 is unstable in air and easily oxidizes to CeO2. Interestingly, there are not only Ce4+ ions in CeO2 crystals but also trace amounts of Ce3+ ions. The oxidation/reduction cycle composed of Ce3+ and Ce4+ states (Ce3+↔Ce4+) enables CeO2 to store and release oxygen, referred to as oxygen storage capability (OSC). In other words, CeO2 can release oxygen under reducing conditions, forming nonstoichiometric oxides CeO2−x, and the CeO2−x can store oxygen by filling oxygen vacancies under oxidizing conditions [7,8]. In the atmosphere or an oxygen-rich environment, CeO2 can store some oxygen in its own lattice, and these stored oxygen atoms can be released quickly when the partial pressure of ambient oxygen decreases. Precisely because of this ability, CeO2 is considered an excellent catalyst in CO2 methanation [9,10], hydrodeoxygenation of xylitol and fatty acids [11,12], NOx conversion [13,14], and so on.
Doping the CeO2 lattice with other metallic elements has been proven to be an effective method to improve the OSC of CeO2. These include rare-earth elements (Sm [15], La, Pr, Nd, and Pm [16]), transition-metal elements (Fe [17], Ni [18], Co [19], Mn, and Cu [20]), earth-alkaline elements (Be, Mg, Ba, and Sr [21]), and noble-metal elements [22]. Among many impurity elements, the incorporation of rare-earth elements into the CeO2 lattice should be relatively easy because the impurity rare-earth metallic ions and Ce ions have a similar ionic size and electronic structure. To date, numerous methods have been used to synthesize rare-earth-doped CeO2, including the co-precipitation method [23], metalorganic chemical vapor deposition (MOCVD) [24], the solid-state reaction (SSR) method [25], the sol–gel method [26], and flame spray pyrolysis [27]. Among the many methods for doping CeO2, the hydrothermal method is considered to be one of the most effective. A Teflon-lined stainless-steel autoclave is employed in the hydrothermal synthesis process, and the closed reaction environment can breed a high-pressure environment under the action of heating, which is conducive to integrating impurity ions into the lattice of CeO2 or cerium precursor [28,29]. In addition, the impregnation method also has attracted an increasing amount of attention recently because the operation of this technique is simple and efficient, especially for doping onto the CeO2 surface [30,31].
In this work, the Y element was introduced into the CeO2 lattice by three routes in the same system, using the same cerium source (Ce(NO3)3∙6H2O) and dopant (Y(NO3)3∙6H2O). The first route involved the incorporation of Y ions during only the hydrothermal process, whereas the second route involved the incorporation of Y ions during only the impregnation process, and the third route involved the incorporation of Y ions during both the hydrothermal and impregnation processes. The characterizations of the phase composition, lattice parameters, quantitative concentration of Ce3+, and oxygen vacancy of these as-synthesized Y-doped CeO2 were investigated and discussed in detail. Moreover, a comparative analysis was also performed. Subsequently, the OSC of CeO2 was examined and quantified using O2 temperature-programmed desorption (O2-TPD) measurements.
2. Experimental Section
2.1. Starting Materials
Ce(NO3)3∙6H2O (99.95%) and Y(NO3)3∙6H2O (99.99%) were supplied by Aladdin Co., Ltd. (Shanghai, China) and Maclin Biochemical Technology Co., Ltd. (Shanghai, China), respectively. Ethylene glycol (EG, 99.5%) and acid orange 7 (AO7, 97.0%) were supplied by Chengdu Kelong Chemical Co., Ltd. (Chengdu, China) and Tokyo Chemical Industry Co., Ltd. (Tokyo, Japan), respectively. Distilled water was used in all experiments. All major chemicals were used as received without further purification.
2.2. Synthesis of Y-Doped CeO2 Powders
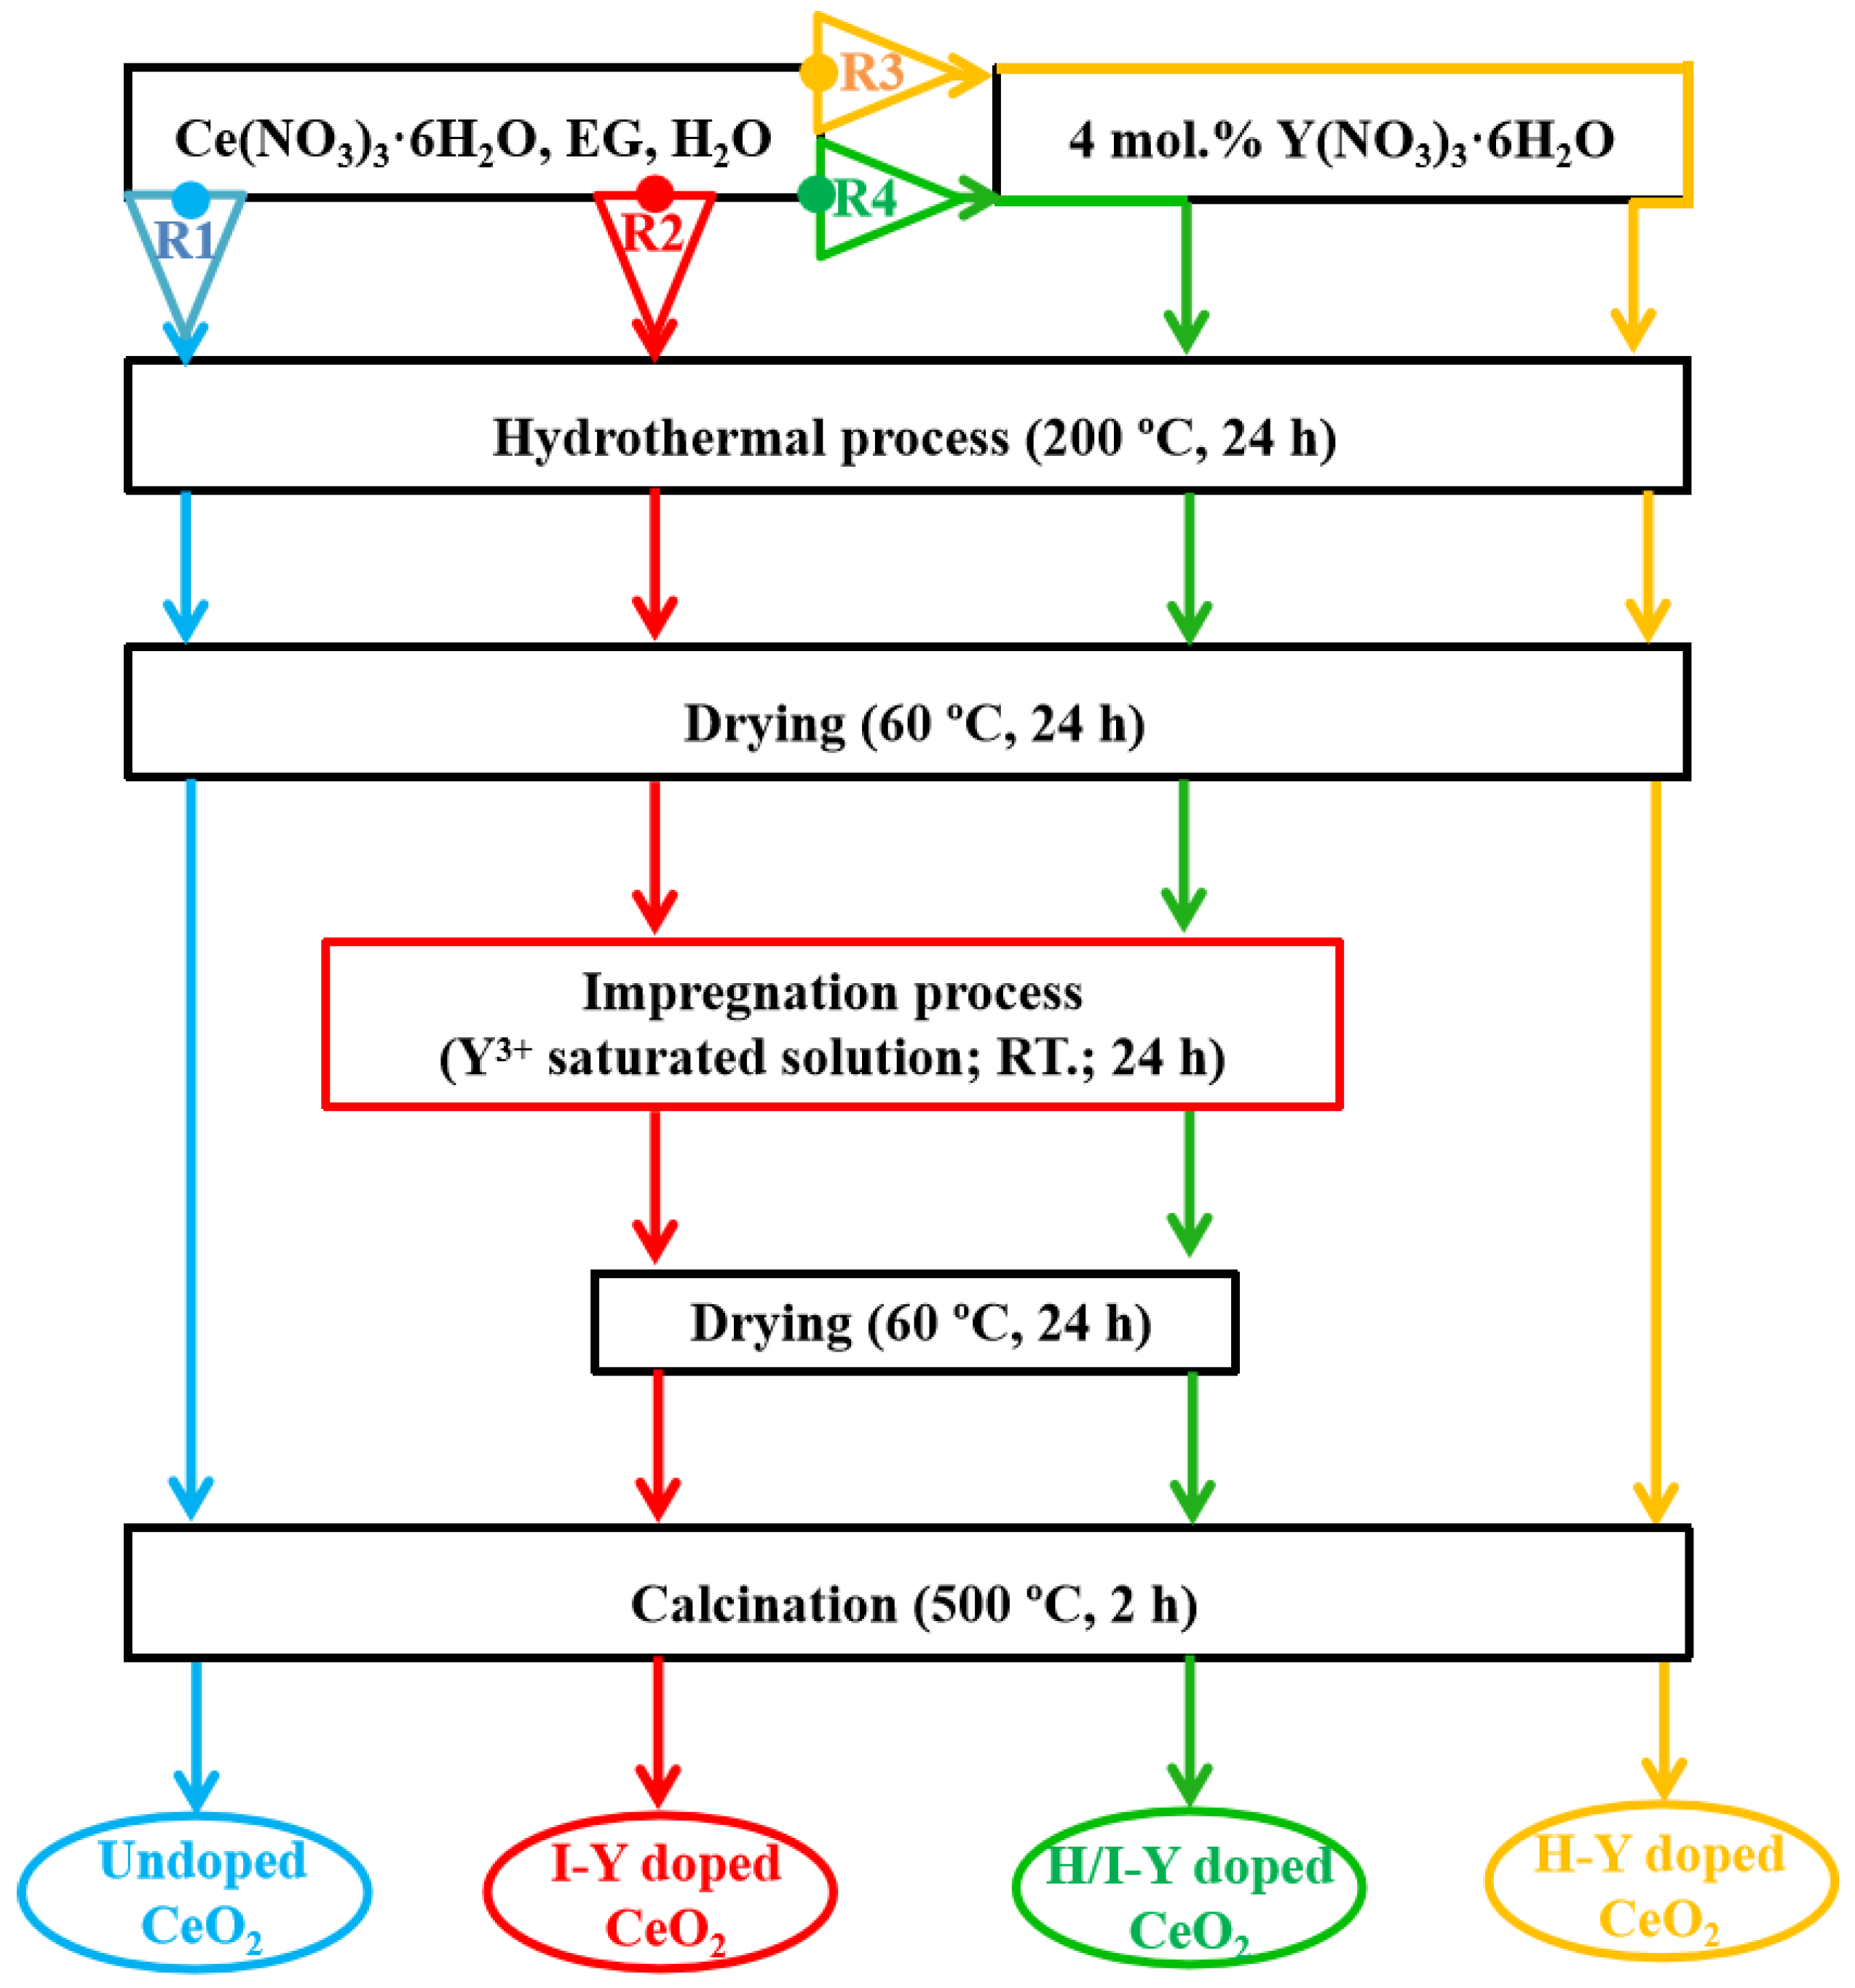
A flow chart of the synthesis procedures employed for the undoped and Y-doped CeO2 samples is shown in Figure 1. The reference CeO2 without Pr-doping was prepared by the hydrothermal process using Route 1 (R1), as shown in Figure 1, denoted as Undoped CeO2. The CeO2 samples doped with Pr cations during only the impregnation process or the hydrothermal process were synthesized as shown in Route 2 (R2) and Route 3 (R3) of Figure 1, denoted as I-Y-doped CeO2 and H-Y-doped CeO2, respectively, while the one doped during both the impregnation and hydrothermal processes was synthesized as shown in Route 4 (R4) of Figure 1, denoted as H/I-Y-doped CeO2.
Undoped CeO2 was synthesized using R1: 4.0 mmol Ce(NO3)3∙6H2O, 25 mL EG, and 5 mL distilled water were added into a 50 mL Teflon-lined stainless-steel autoclave and sealed at 200 °C for 24 h. Afterward, the Ce precursor was collected, washed, and dried in turn. Finally, Undoped CeO2 was obtained by subsequent calcination in air at 500 °C for 2 h.
I-Y-doped CeO2 was synthesized using R2: the Ce precursor synthesized in R1 was impregnated into a saturated solution of Y3+ ions at room temperature for 24 h. After filtration and drying, the I-Y-doped CeO2 was obtained by subsequent calcination in air at 500 °C for 2 h.
H-Y-doped CeO2 was synthesized using R3: 3.84 mmol Ce(NO3)3∙6H2O, 0.16 mmol Y(NO3)3∙6H2O, 25 mL EG, and 5 mL distilled water were added into a 50 mL Teflon-lined stainless-steel autoclave and sealed at 200 °C for 24 h. Afterward, the Ce/Y precursor was collected, washed, and dried in turn. Finally, H-Y CeO2 was obtained by subsequent calcination in air at 500 °C for 2 h.
H/I-Y-doped CeO2 was synthesized using R4: the Ce/Y precursor synthesized in R3 was impregnated into a saturated solution of Y3+ ions at room temperature for 24 h. After filtration and drying, the H/I-Y-doped CeO2 was obtained by subsequent calcination in air at 500 °C for 2 h.
2.3. Characterization
The crystallographic phases of the samples were characterized by X-ray diffraction (XRD, DX-2700). The surface composition and binding energy of the CeO2 samples were determined by X-ray photoelectron spectroscopy (XPS, ESCALAB 250Xi, Thermo Scientific, Waltham, MA, USA). The oxygen vacancy (VO) defects of the CeO2 samples were characterized using a Raman spectrometer (LabRAM Aramis, Horiba Jobin-Yvon, Paris, France) with a He–Cd laser of 325 nm, and the exposure time for the measurement set was 60 s.
2.4. OSC
The OSC of CeO2 was estimated using O2 temperature-programmed desorption (O2-TPD) measurements, which were carried out in a plug-flow microreactor system (TP5000) with a thermal conductivity detector, and the amount of O2 desorption during the process was measured by the thermal conductivity detector. About 0.1 g of CeO2 powder was activated using an air stream at 400 °C for 30 min, then moved into He and cooled, then exposed to an air stream for 30 min at 120 °C, followed by purging with a He stream to remove the excess O2. Finally, the surface oxygen desorption was conducted at a flow rate of He (10 mL/min) while the temperature was raised to ~900 °C (10 °C/min).
3. Results and Discussion
XRD was employed to characterize the phase composition of the as-synthesized undoped and Y-doped samples. Figure 2 shows the XRD patterns of the Undoped CeO2 and H-Y-, I-Y-, and H/I-Y-doped CeO2 powders. For the XRD pattern of the Undoped CeO2, eight well-resolved peaks were observed, which could be indexed to the (111), (200), (220), (311), (222), (400), (331), and (420) planes of cubic CeO2 (JCPDS no. 34-0394; fluorite). No additional phases were detected, suggesting pure CeO2 had been obtained by the hydrothermal process using route R1 in Figure 1. After the introduction of Y cations in the synthesis process, the XRD patterns of the H-Y-, I-Y-, and H/I-Y-doped CeO2 samples exhibited a similar profile to that of the Undoped CeO2. However, no peaks for impurity phases such as Y2O3 were detected, which could be explained as follows: the impurities in Y-doped CeO2 samples might exist as highly dispersed or amorphous surface species, or the amount of the Y impurity was low. Another possibility is that the Y cations partially substituted the Ce ions to form a solid solution. The inset in Figure 2 shows that the (111) reflection shifts toward lower 2θ values with the incorporation of Y ions, and it can be found that the shift exhibited by the H-Y-doped CeO2 sample was the greatest. Moreover, the lattice parameters of CeO2 were estimated using Bragg’s equation and summarized in Table 1. It was found that the calculated lattice parameters for H-Y- (5.4242 Å), I-Y- (5.4190 Å), and H/I-Y-doped (5.4227 Å) CeO2 were greater than that of the undoped sample (5.4117 Å). These findings implied that the large Y ions (1.02 Å) partially substituted the Ce4+ ions (0.97 Å [32]) to form a CeO2-based solid solution while holding the cubic fluorite structure of CeO2.
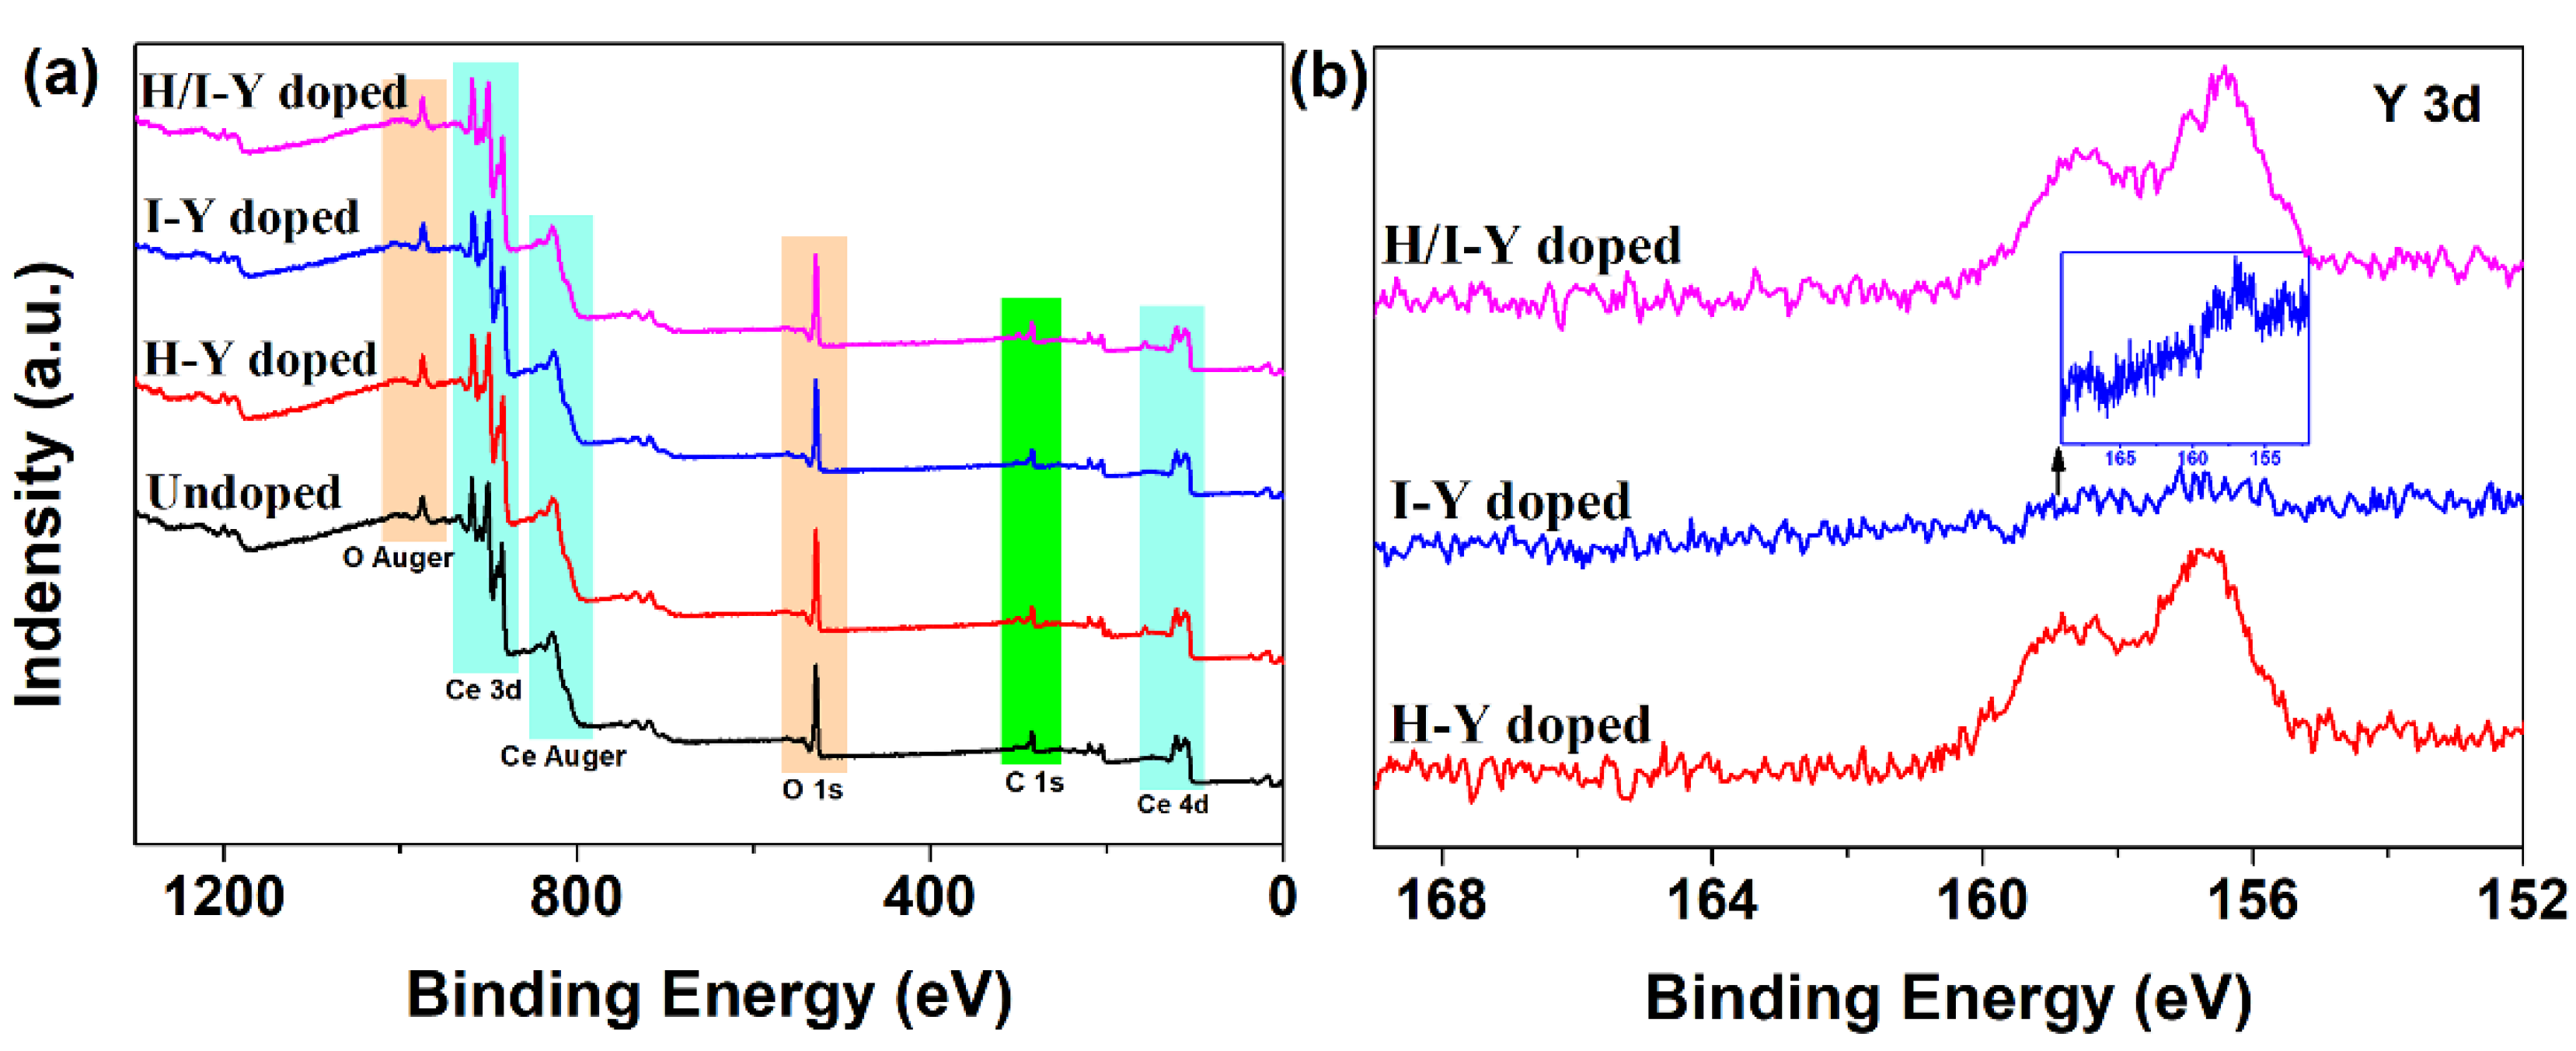
In order to probe the possibility of the presence of the Y element in CeO2, as well as the chemical state of its presence, XPS was employed to study the Undoped CeO2 and Y-doped CeO2. Figure 3a shows the wide-scan XPS spectra of the Undoped CeO2 and H-Y-, I-Y-, and H/I-Y-doped CeO2 powders. As observed in Figure 3a, the XPS profiles of all the samples were similar, dominated by the signals of Ce, O, and C elements, in accordance with a previous report for pure and Y-doped CeO2 [33]. However, there was no sign of the Y element at first sight from the wide-scan XPS spectra of the H-Y-, I-Y-, and H/I-Y-doped CeO2. To ascertain whether the CeO2 contained the Y cations and the Y-doping was real, the corresponding Y 3d XPS regions of the H-Y-, I-Y-, and H/I-Y-doped CeO2 were recorded. For the Y 3d XPS regions of the H-Y- and H/I-Y-doped CeO2, we could cleanly identify the Y 3d signal and its unique contour, which is assigned to the trivalent Y ions. However, the Y signal was weak from the Y 3d XPS regions of the I-Y-doped CeO2, yet its signal peak of Y 3d could still be identified in graphing alone (inset in Figure 3b).
In order to understand the effect of Y-doping on Ce ions in CeO2 crystals, the Ce 3d XPS regions of the Undoped CeO2 and H-Y-, I-Y-, and H/I-Y-doped CeO2 were recorded and fitted, as shown in Figure 4. The Ce 3d core-level XPS of all CeO2 samples could be fitted into eight peaks, referring to the 3d5/2 and 3d3/2 spin-orbit doublet of Ce cations (including Ce3+ and Ce4+ ions). The bonds labeled as v2 and u2 belong to the spin-doublet term of the Ce3+ state, and the bands labeled as v4, v3, and v1 (and those for u) are due to the case of the Ce4+ state [34]. A quantitative analysis of the concentration of Ce3+ ions based on the measured Ce 3d XPS spectra, labeled as [Ce3+]XPS, could be performed using Equation (1), and the results are summarized in Table 1. The [Ce3+]XPS values of the H-Y-, I-Y-, and H/I-Y-doped CeO2 were 12.60%, 8.95%, and 11.37%, respectively. These were higher than that of the Undoped CeO2 (6.54%), indicating that pure CeO2 crystal itself contains a certain number of Ce3+ ions and that Y-doping could promote the formation of Ce3+ species, especially H-Y-doped CeO2, which exhibited the highest [Ce3+]XPS values. The Ce3+ species in pure CeO2 contributed to the OSC of CeO2 through the oxidation/reduction cycle composed of Ce3+ and Ce4+ states (Ce3+↔Ce4+).
where Ai is the integrated area of the ith fitting peak from Ce 3d XPS spectra.
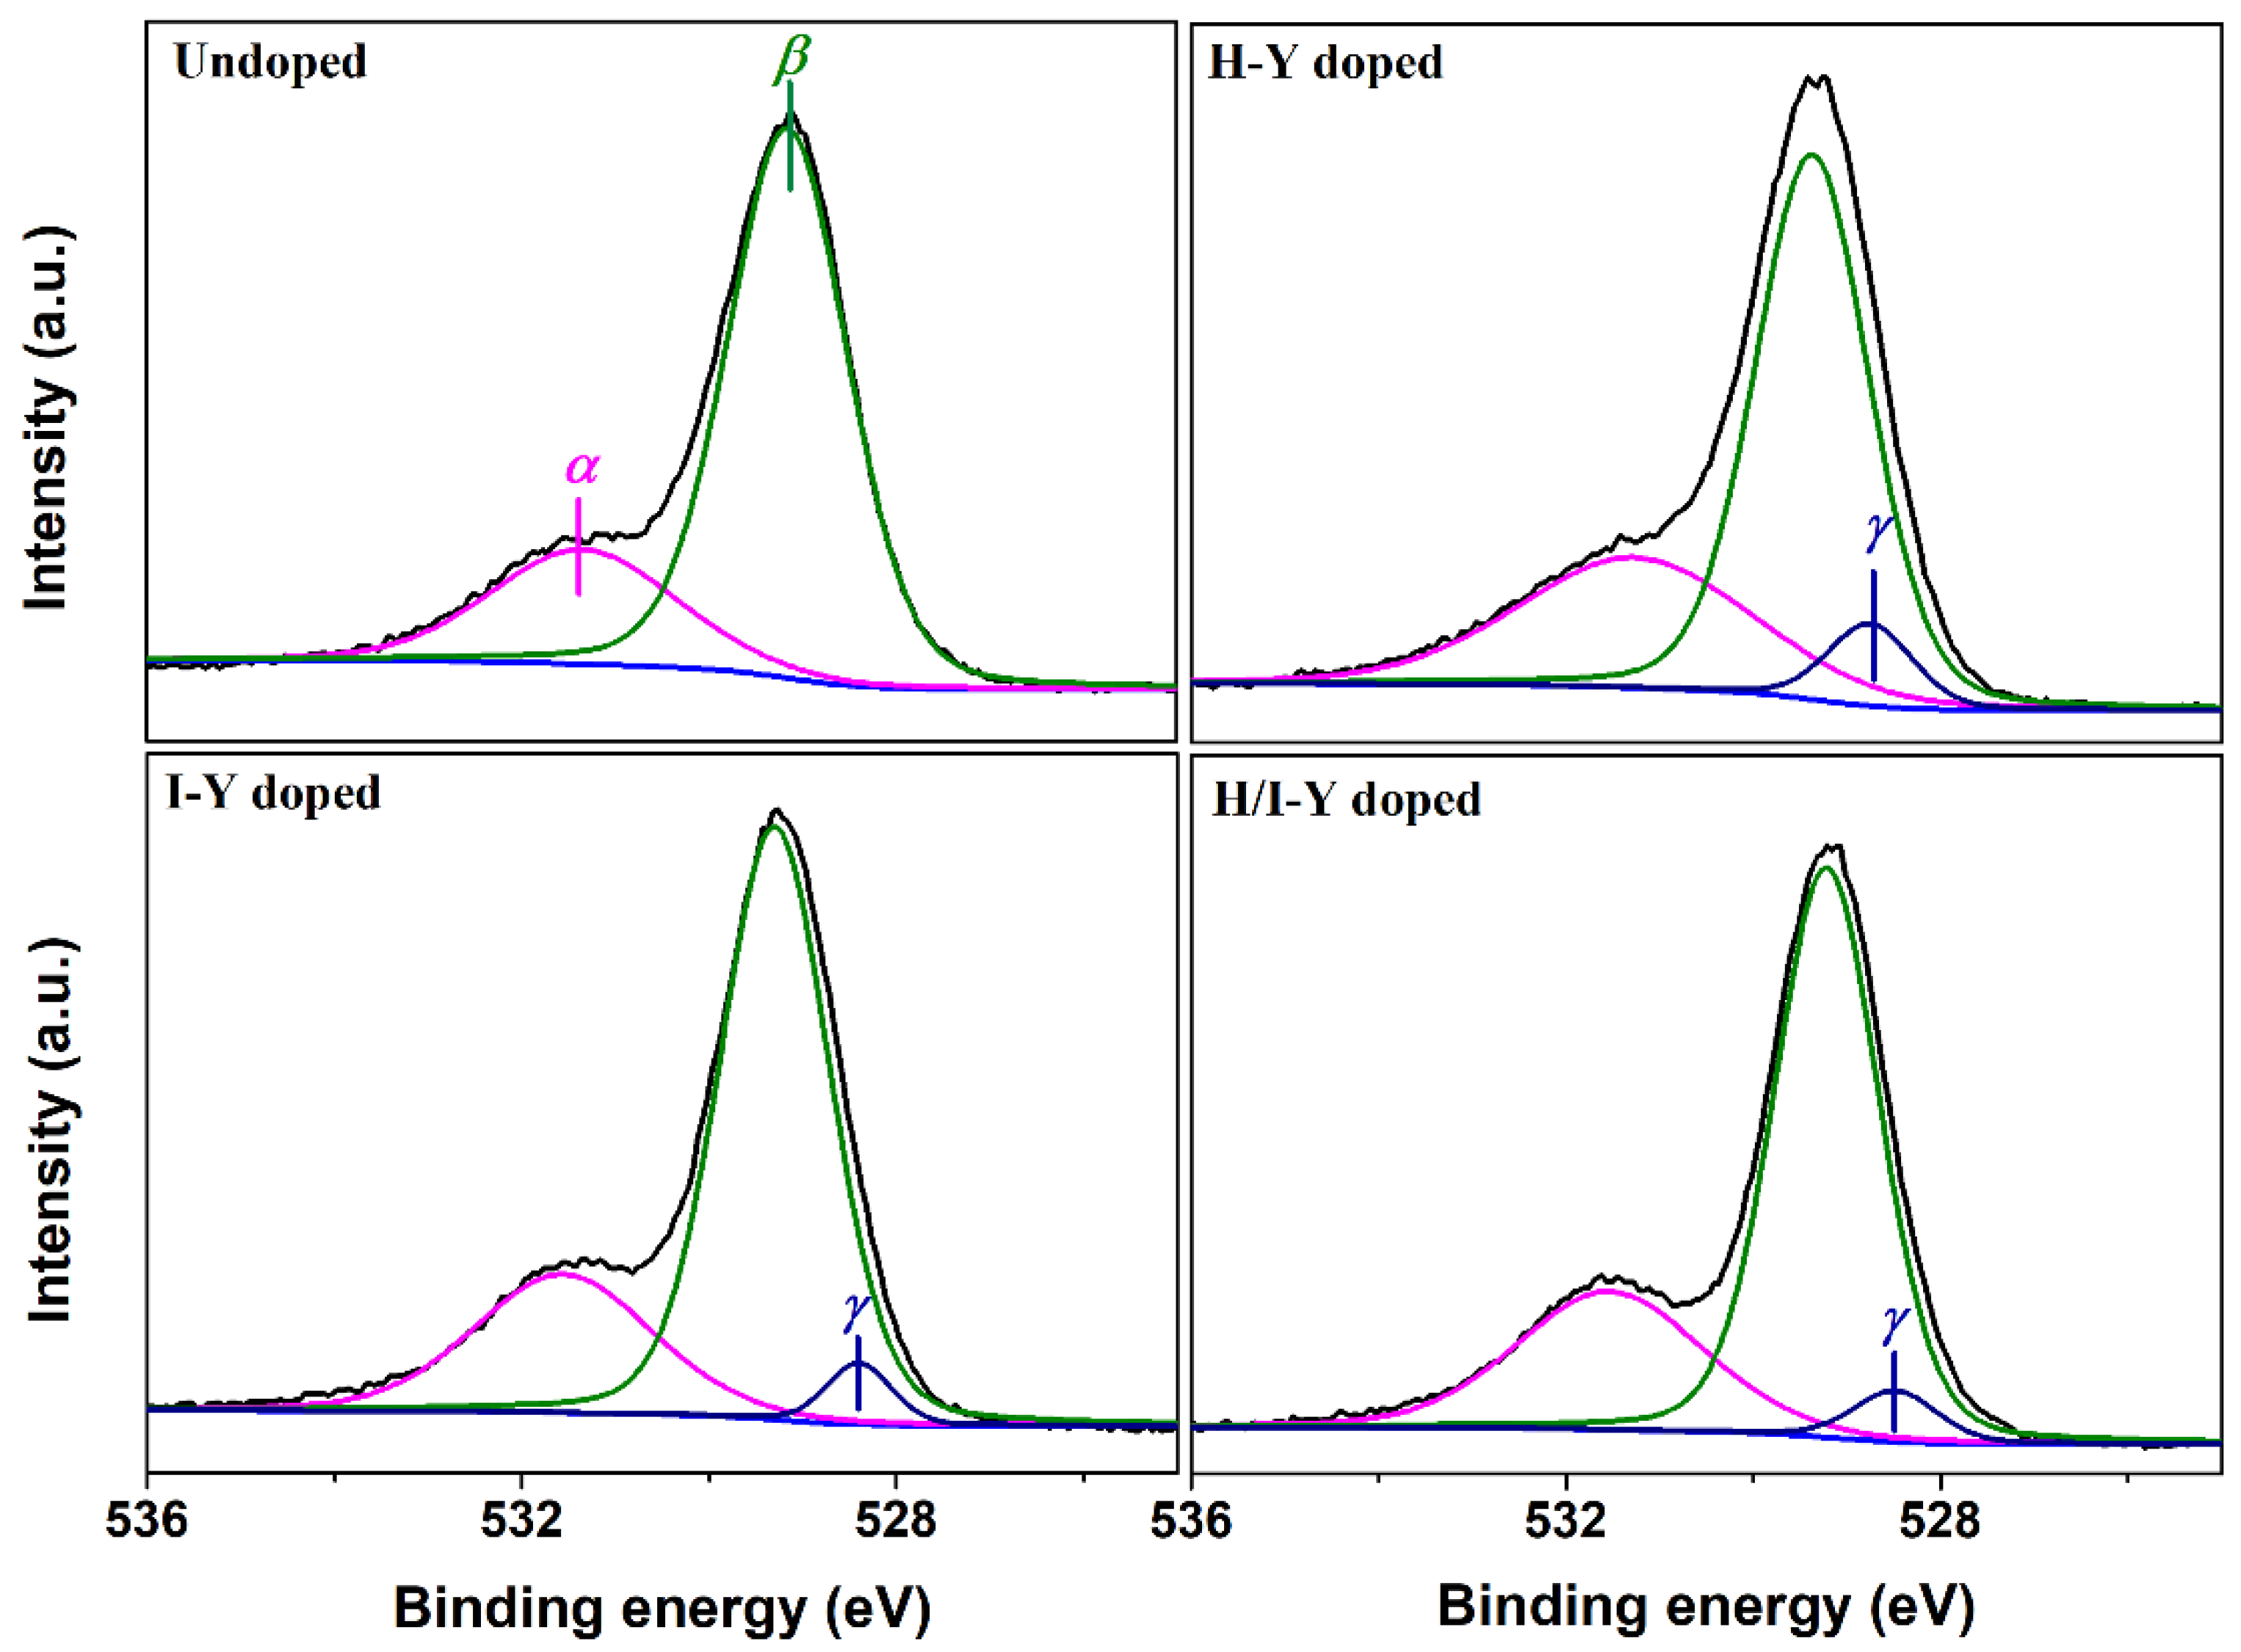
In order to understand the effect of Y-doping on oxygen ions in CeO2 crystals, the O 1s XPS regions of the Undoped CeO2 and H-Y-, I-Y-, and H/I-Y-doped CeO2 were recorded and fitted, as shown in Figure 5. The O 1s XPS spectrum of the Undoped CeO2 was curve-fitted into two peaks: one peak, labeled as α, at ~529.2 eV, could be attributable to the lattice oxygen species; the other peak, labeled as β, at ~531.4 eV, could be attributable to the chemisorbed oxygen species and/or weakly bonded oxygen species related to the oxygen vacancy (VO) defects. For the O 1s spectra of the H-Y-, I-Y-, and H/I-Y-doped CeO2, a new peak labeled as γ, at~528.5 eV, was curve-fitted, which could be assigned to the O-Y species. In addition, the relative oxygen vacancies ratio (labeled as [VO]XPS) could be quantified using Equation (2), and the results are shown in Table 1.
where Ai is the integrated area of the ith fitting peak from O 1s XPS spectra. As observed in Table 1, the [VO]XPS values of the H-Y-, I-Y-, and H/I-Y-doped CeO2 were 30.65%, 26.32%, and 28.72%, respectively, which are higher than that of the undoped sample (24.36%). The results indicate that pure CeO2 crystal itself contained a certain number of VO species (namely intrinsic VO defects) and that Y-doping was beneficial for the creation of VO defects, especially H-Y-doped CeO2, which exhibited the highest [VO]XPS values.
To further investigate the VO defects, Raman spectra of CeO2 were obtained. Raman spectroscopy is a powerful tool for the structural characterization of metal oxides due to its sensitivity to structural changes, such as VO defects. Figure 6 shows the Raman spectra of the Undoped and H-Y-, I-Y-, and H/I-Y-doped CeO2. For the Undoped CeO2, the spectral envelope in the 200~1000 cm−1 range displayed a strong band at 464 cm−1 associated with the triply degenerate F2g vibrational mode of CeO2 [35,36], while the band located at 592 cm−1 was associated with the optical LO mode of substoichiometric CeO2−x units, underscoring an increase in VO defects [37,38]. Upon Y-doping, increases in the intensity of the bands located at 464 and 592 cm−1 were observed for the H-Y-, I-Y-, and H/I-Y-doped CeO2, which were associated with the presence of substoichiometric CeO2-x, underscoring an increase in VO defects. However, the Y3+-doping into the CeO2 lattice increased its lattice distortion and hence interfered with the vibrations of CeO2. Therefore, the Raman band intensities of the Y-doped CeO2 were clearly affected by the incorporation of Y3+ into the CeO2 lattice. Consequently, an alternative approach to estimate the relative concentration of VO defects can be adopted by calculating the ratio of the integrated area of the Raman band at 592 cm−1 to that of 464 cm−1 (labeled [VO]Raman) [39,40]. The values of A592/A464, that is, the relative concentration of oxygen vacancies ([VO]Raman), are shown in Table 1. It can be seen that the [VO]Raman values of the H-Y-, I-Y-, and H/I-Y-doped CeO2 were 1.47, 0.93, and 1.16, respectively, which are higher than that of the undoped sample (0.67).
According to the Ce 3d XPS analyses in Figure 4, it can be seen that pure CeO2 had a certain number of Ce3+ ions, contributing to the OSC of CeO2 with the formation and filling of intrinsic VO defects, which could be expressed by Equation (3) and written using Kroger and Vink notations as in Equation (4). In the synthesis of CeO2, Y ions were introduced and doped into the CeO2 lattice, and a substoichiometric CeO2-x unit was formed with an increase in VO defects. The creation of extrinsic VO defects could be expressed by Equations (5) and (6). The vacancy compensation mechanism has been suggested for the increased concentration of VO for Y-doping into CeO2. As shown in Equations (3) and (4), besides the intrinsic VO in CeO2, there are two additional kinds of VO: one VO is created to balance the charge when two adjacent Ce4+ cations are substituted by two Y3+ cations, as shown in Equation (5); and substitution of one Ce4+ by one Y3+ gives rise to the formation of one VO with the adjacent Ce4+ reduced to Ce3+, as shown in Equation (6).
where represents a Y3+ cation occupying the site of a Ce4+ cation and represents a Ce3+ cation occupying the site of a Ce4+ cation. and represent an oxygen vacancy defect and one with two positive charges, respectively, which are produced via the vacancy compensation mechanism; and is a lattice oxygen atom. From the O 1s XPS analysis in Figure 5 and the Raman analysis in Figure 6, it can be seen that pure CeO2 crystal itself contained a certain number of VO species (namely intrinsic VO defects), which exhibited a large deviation from stoichiometry in the atmosphere, forming nonstoichiometric oxide CeO2−x. After doping with Y3+ cations, CeO2 could still retain its fluorite crystal structure (see Figure 2), accompanied by the loss of oxygen from its lattice and the consequent formation of a large number of extrinsic VO defects (see Table 1, Figure 5 and Figure 6).
Table 2 shows the lattice parameters, [Ce3+]XPS, [VO]XPS, and [VO]Raman of undoped and Y-doped CeO2 from recent literature [41,42,43]. By comparing these data of undoped and Y-doped CeO2, we could find that the lattice expansion occurred upon the incorporation of Y3+ into the CeO2 lattice, accompanied by the presence of Ce3+ ions and more VO defects, which were consistent with our results, despite different methods of quantification. However, the relative content for Ce3+ ions ([Ce3+]XPS) decreased with the doping of Y3+ in the report [44], and the authors attributed this to the substitution of Y3+ for Ce3+.
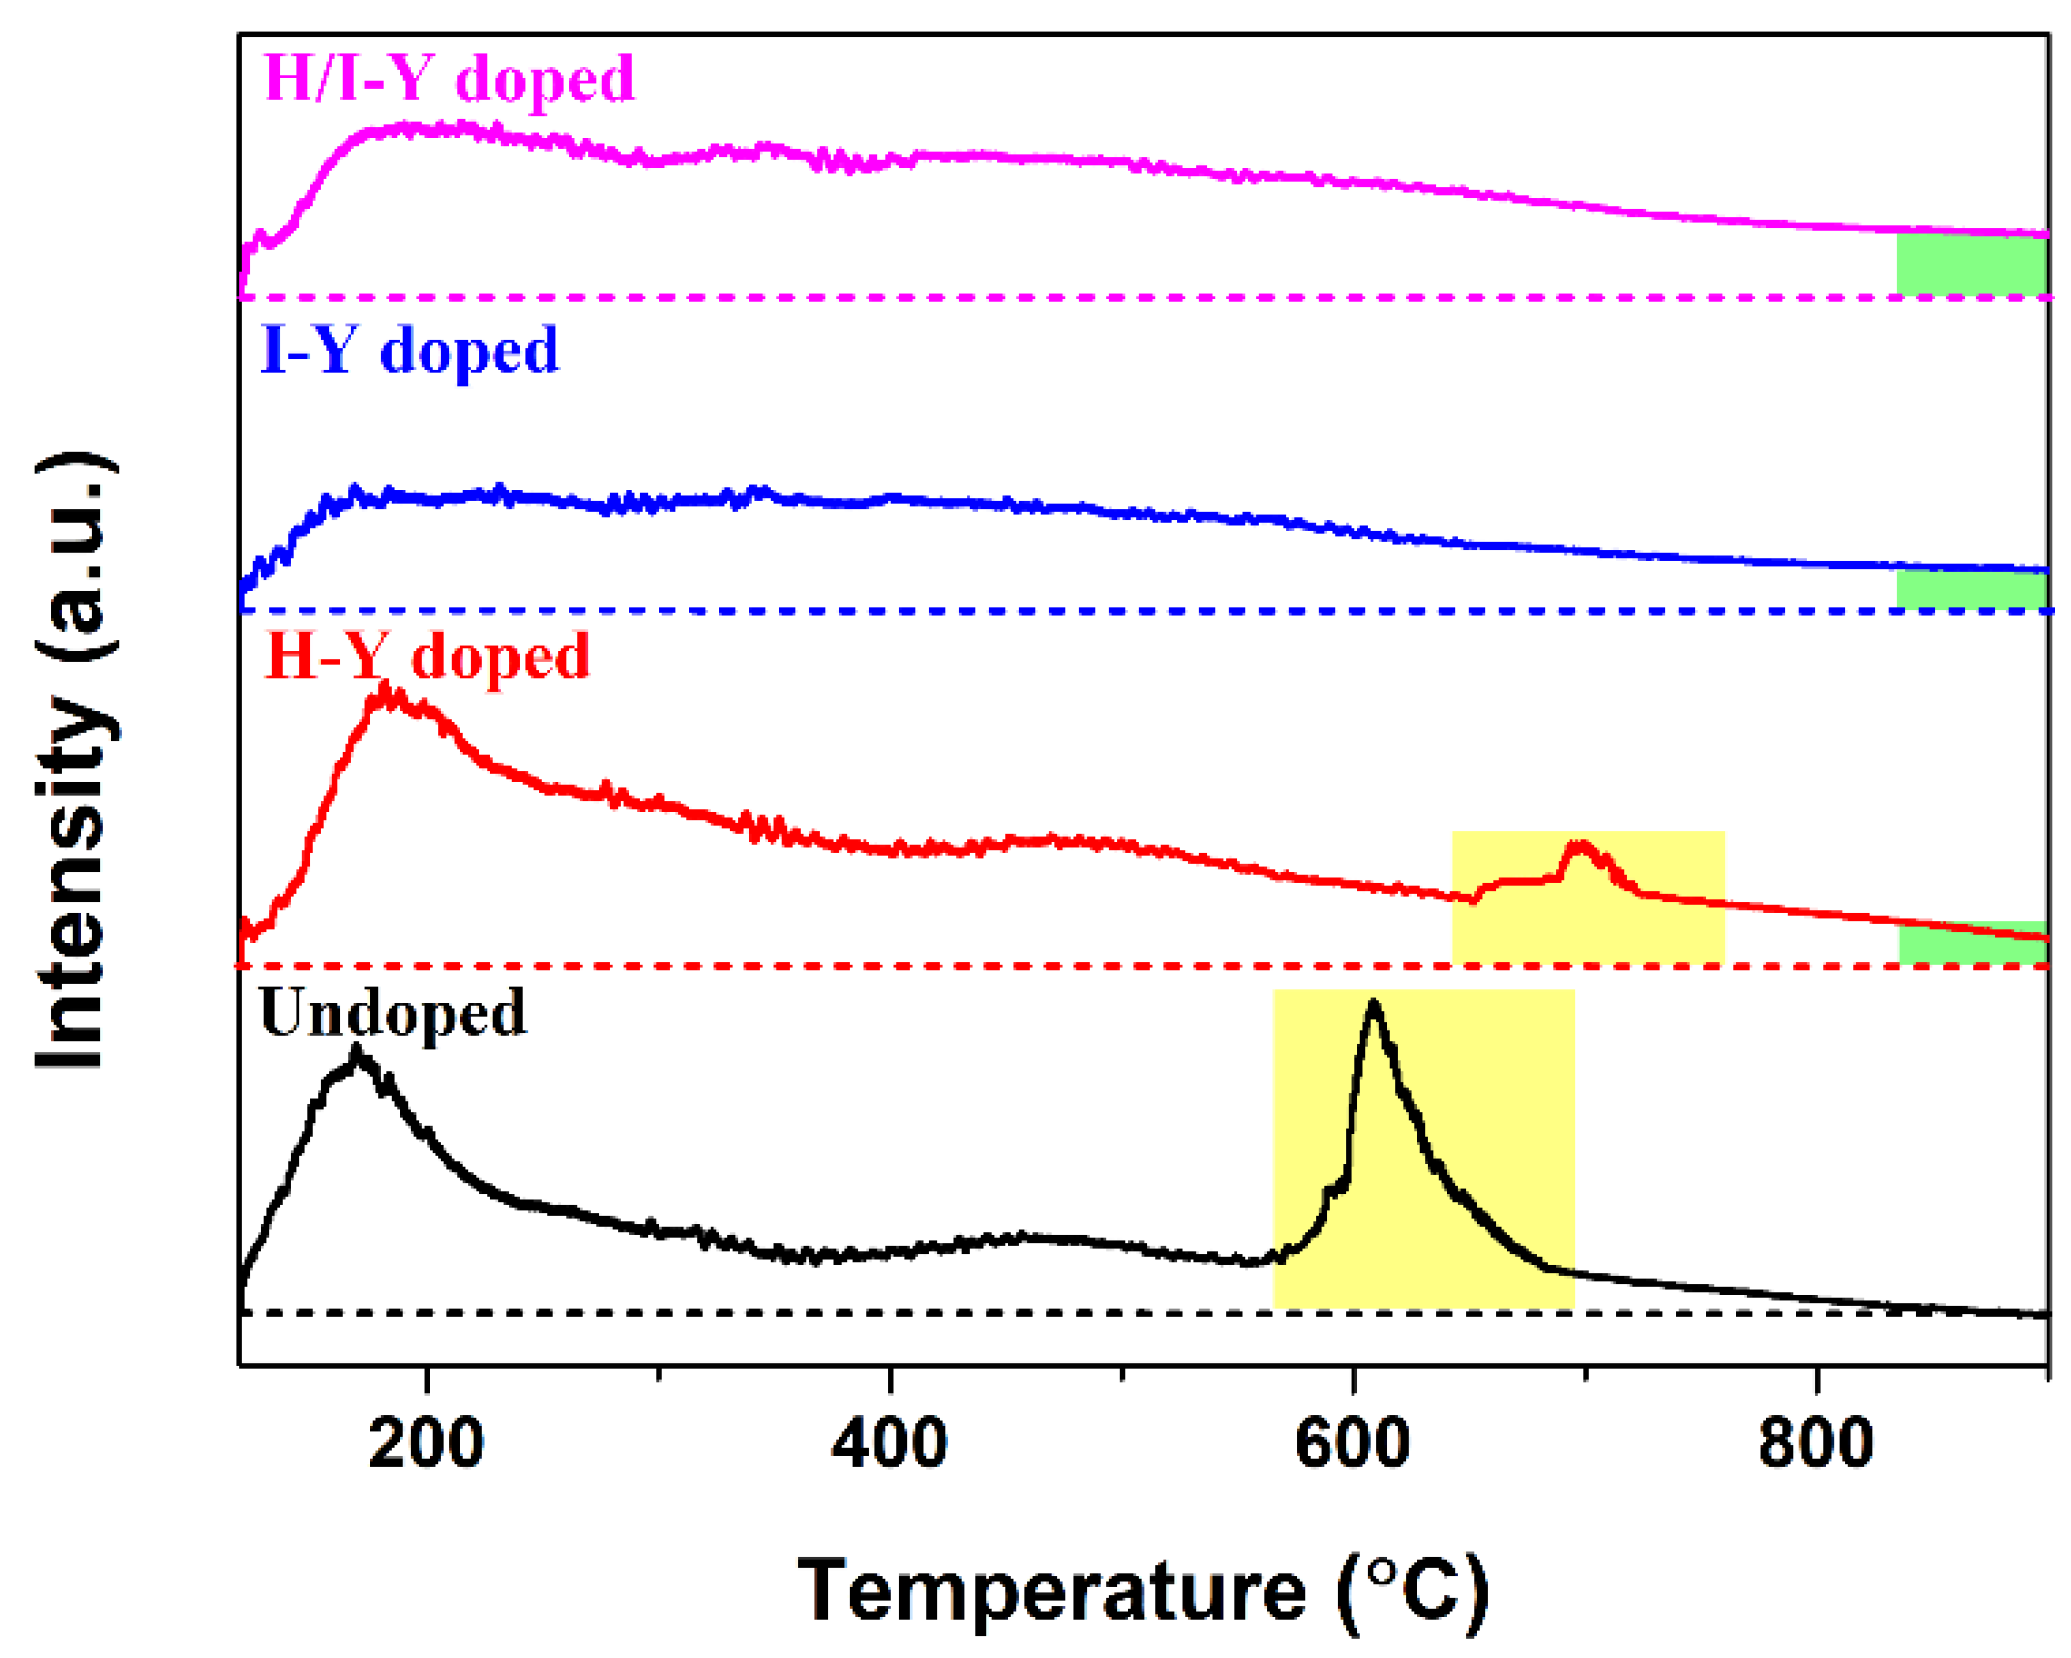
OSC is the basic characteristic of CeO2 and the premise of numerous applications. Therefore, the O2-TPD experiment was employed to evaluate the OSC of CeO2. Figure 7 shows the O2-TPD spectra of the Undoped and H-Y-, I-Y-, and H/I-Y-doped CeO2 powders. For the Undoped CeO2, the asymmetrical peak of either the low temperature at ~170 °C or the high temperature at ~600 °C (light yellow area) implied the existence of at least two kinds of oxygen species at various coordination environments. The oxygen desorption at low temperatures could be attributed to the release of surface/subsurface lattice oxygen, while the oxygen desorption at high temperatures could be ascribed to the release of bulk lattice oxygen, which was consistent with the reported results [45]. Moreover, it could be clearly observed that the oxygen desorption was rapid at the early stages of the process (120~170 °C), suggesting that there were large amounts of adsorbed oxygen on CeO2, which could emigrate quickly at low temperatures. After the temperature reached ~170 °C, the oxygen desorption started to decrease quickly until a temperature of ~350 °C was reached, and then basically maintained a steady release of oxygen until ~570 °C. Subsequently, the Undoped CeO2 experienced the second oxygen release from 570 to 820 °C. Remarkably, the O2-TPD curve coincided with the baseline after 820 °C, suggesting that there was little release of oxygen for Undoped CeO2 after 820 °C. For the H-Y-doped CeO2, the O2-TPD profile was similar to that of the Undoped CeO2. However, the desorption bands at high temperatures occurred at higher temperatures, indicating that the partial substitution of Ce4+ ions (0.97 Å) with the large Y ions (1.02 Å) improved the stability of the CeO2 lattice. For the O2-TPD profiles of I-Y- and H/I-Y-doped CeO2, the asymmetrical peak at high temperatures was displaced by a smooth descent peak, indicating that the oxygen desorption mainly occurred on the surface and subsurface of the I-Y- and H/I-Y-doped CeO2 samples. Furthermore, for the O2-TPD profiles of the H-Y-, I-Y-, and H/I-Y-doped CeO2 after 820 °C, there were still some distances to the baseline (light green area), indicating sustaining oxygen desorption, which could be attributed to the formation of extrinsic VO defects in the interior of the CeO2 lattice caused by Y-doping.
For comparison purposes, the OSC was quantified by the amount of O2 desorption per gram of CeO2 sample by measuring the corresponding peak areas of O2-TPD profiles. The quantified OSC values (labeled as [OSC]) of the Undoped and H-Y-, I-Y-, and H/I-Y-doped CeO2 in the full temperature range are shown in Table 1. Compared with the OSC value of the Undoped CeO2, all of the Y-doped CeO2 samples were enhanced, and the sequence of [OSC] was as follows: H-Y-doped CeO2 (0.372 mmol/g) > H/I-Y-doped CeO2 (0.353 mmol/g) > I-Y-doped CeO2 (0.248 mmol/g) > Undoped CeO2 (0.153 mmol/g). The OSC of the H-Y-, I-Y-, and H/I-Y-doped CeO2 were increased by 143.1%, 62.1%, and 130.7%, respectively, compared with that of the Undoped CeO2. The enhanced OSC of all the Y-doped CeO2 could be explained as follows: when Y3+ ions were doped into the CeO2 lattice to substitute Ce4+ ions, the extrinsic VO defects were formed to keep the electric neutrality of their fluorite structure, accompanied by the increase in the number of oxidation/reduction cycles composed of Ce3+ and Ce4+ states (Ce3+↔Ce4+). Y-doping of CeO2 possesses both intrinsic and extrinsic VO defects, as well as the oxidation/reduction cycle of Ce3+↔Ce4+, which could determine the transfer of oxygen ions and OSC.
4. Conclusions
In summary, three various routes were adopted to successfully synthesize Y-doped CeO2 solid solutions. The large Y cations were incorporated into the CeO2 lattice with normal trivalence and formed a Y-doped CeO2 solid solution while holding the cubic fluorite structure of CeO2. The results of O 1s XPS and Raman spectroscopy indicated that pure CeO2 crystal itself contained a certain number of intrinsic VO defects. With the substitution of Ce4+ ions with Y3+ ions in the CeO2 lattice, local lattice expansion of CeO2 crystal occurred, extrinsic VO defects were formed, and there was an increase in the number of oxidation/reduction cycles composed of Ce3+ and Ce4+ states. Moreover, the relative concentrations of VO defects were quantified by the A592/A464 values obtained from Raman spectra, which were 1.47, 0.93, and 1.16 for the H-Y-, I-Y-, and H/I-Y-doped CeO2, respectively, and were higher than that of the undoped one (0.67). There were large amounts of adsorbed oxygen on CeO2, which could emigrate quickly at low temperatures, and the OSCs of the H-Y-, I-Y-, and H/I-Y-doped CeO2 were increased by 143.1%, 62.1%, and 130.7%, respectively, compared with that of the Undoped CeO2 (0.153 mmol O2/g CeO2). Both the intrinsic and extrinsic VO defects, as well as the oxidation/reduction cycle of Ce3+↔Ce4+, could determine the enhanced OSC of Y-doped CeO2. The CeO2 with doping during only the hydrothermal process exhibited the maximum values of OSC, suggesting the effectiveness of the doping.
Author Contributions
Conceptualization, Y.X.; Software, Y.X.; Investigation, Y.X.; Resources, Y.X.; Data curation, Y.X.; Writing—original draft, Y.X.; Writing—review & editing, L.G.; Supervision, L.G. and Z.D.; Project administration, Z.D.; Funding acquisition, Z.D. All authors have read and agreed to the published version of the manuscript.
Funding
This research was funded by the Opening Project of Crystalline Silicon Photovoltaic New Energy Research Institute, China (2022CHXK002) and Fundamental Research Funds for the Central Universities (2022CDJXY-010).
Institutional Review Board Statement
Not applicable.
Informed Consent Statement
Not applicable.
Data Availability Statement
Not applicable.
Acknowledgments
This study was financially supported by the Opening Project of Crystalline Silicon Photovoltaic New Energy Research Institute, China (2022CHXK002) and Fundamental Research Funds for the Central Universities (2022CDJXY-010).
Conflicts of Interest
The authors declare no conflict of interest.
References
- Wang, A.; Gao, X. China’s energy and important mineral resources demand perspective. Bull. Chin. Acad. Sci. 2020, 35, 338–344. [Google Scholar] [CrossRef]
- Usman, M.; Jahanger, A.; Makhdum, M.; Balsalobre-Lorente, D.; Bashir, A. How do financial development, energy consumption, natural resources, and globalization affect arctic countries’ economic growth and environmental quality? An advanced panel data simulation. Energy 2022, 241, 122515. [Google Scholar] [CrossRef]
- Sarkodie, S.A. Winners and losers of energy sustainability-global assessment of the sustainable development goals. Sci. Total Environ. 2022, 831, 154945. [Google Scholar] [CrossRef] [PubMed]
- Mishra, S.; Khan, F.; Panigrahi, S.K. A crystal plasticity based approach to establish role of grain size and crystallographic texture in the Tension-Compression yield asymmetry and strain hardening behavior of a Magnesium-Silver-Rare Earth alloy. J. Magnes. Alloys 2022, 10, 2546–2562. [Google Scholar] [CrossRef]
- Yang, Q.; Lv, S.; Yan, Z.; Xie, Z.; Qiu, X. Exceptional reversed yield strength asymmetry in a rare-earth free Mg alloy containing quasicrystal precipitates. J. Magnes. Alloys 2022, in press. [Google Scholar] [CrossRef]
- Yu, Z.; Xu, X.; Shi, K.; Du, B.; Han, X.; Xiao, T.; Li, S.; Liu, K.; Du, W. Development and characteristics of a low rare-earth containing magnesium alloy with high strength-ductility synergy. J. Magnes. Alloys 2022, in press. [Google Scholar] [CrossRef]
- Skorodumova, N.V.; Simak, S.I.; Lundqvist, B.I.; Abrikosov, I.A.; Johansson, B. Quantum origin of the oxygen storage capability of ceria. Phys. Rev. Lett. 2002, 89, 222–227. [Google Scholar] [CrossRef]
- Sayle, D.C.; Maicaneanu, S.A.; Watson, G.W. Atomistic models for CeO2 (111), (110), and (100) nanoparticles, supported on yttrium-stabilized zirconia. J. Am. Chem. Soc. 2002, 124, 11429–11439. [Google Scholar] [CrossRef]
- Sharma, S.K.; Paul, B.; Pal, R.S.; Bhanja, P.; Banerjee, A.; Samanta, C.; Bal, R. Influence of Indium as a Promoter on the Stability and Selectivity of the Nanocrystalline Cu/CeO2 Catalyst for CO2 Hydrogenation to Methanol. ACS Appl. Mater. Inter. 2021, 13, 28201–28213. [Google Scholar] [CrossRef]
- Zhang, T.; Wang, W.; Gu, F.; Xu, W.; Zhang, J.; Li, Z.; Zhu, T.; Xu, G.; Zhong, Z.; Su, F. Enhancing the low-temperature CO2 methanation over Ni/La-CeO2 catalyst: The effects of surface oxygen vacancy and basic site on the catalytic performance. Appl. Catal. B-Environ. 2022, 312, 121385. [Google Scholar] [CrossRef]
- MacQueen, B.; Royko, M.; Crandall, B.S.; Heyden, A.; Pagán-Torres, Y.J.; Lauterbach, J. Kinetics Study of the Hydrodeoxygenation of Xylitol over a ReOx-Pd/CeO2 Catalyst. Catalysts 2021, 11, 108. [Google Scholar] [CrossRef]
- Cao, X.; Long, F.; Zhai, Q.; Zhao, J.; Xu, J.; Jiang, J. Heterogeneous Ni and MoOx co-loaded CeO2 catalyst for the hydrogenation of fatty acids to fatty alcohols under mild reaction conditions. Fuel 2021, 298, 120829. [Google Scholar] [CrossRef]
- Wang, H.; Qu, Z.; Liu, L.; Dong, S.; Qiao, Y. Promotion of NH3-SCR activity by sulfate-modification over mesoporous Fe doped CeO2 catalyst: Structure and mechanism. J. Hazard. Mater. 2021, 414, 125565. [Google Scholar] [CrossRef] [PubMed]
- Zhao, W.; Rong, J.; Luo, W.; Long, L.; Yao, X. Enhancing the k-poisoning resistance of CeO2-SnO2 catalyst by hydrothermal method for NH3-SCR reaction. Appl. Surf. Sci. 2022, 579, 152176. [Google Scholar] [CrossRef]
- Duarte, R.B.; Damyanova, S.; de Oliveira, D.C.; Marques, C.M.P.; Bueno, J.M.C. Study of Sm2O3-doped CeO2-Al2O3-supported Pt catalysts for partial CH4 oxidation. Appl. Catal. A-Gen. 2011, 399, 134–145. [Google Scholar] [CrossRef]
- Singhania, A. High Surface Area M (M = La, Pr, Nd, and Pm)-Doped Ceria Nanoparticles: Synthesis, Characterization, and Activity Comparison for CO Oxidation. Ind. Eng. Chem. Res. 2017, 56, 13594–13601. [Google Scholar] [CrossRef]
- Wang, H.; Tsilomelekis, G. Catalytic Performance and Stability of Fe-Doped CeO2 in Propane Oxidative Dehydrogenation Using Carbon Dioxide as Oxidant. Catal. Sci. Technol. 2020, 10, 4362–4372. [Google Scholar] [CrossRef]
- Li, G.; Wang, Q.; Zhao, B.; Zhou, R. Promoting effect of synthesis method on the property of nickel oxide doped CeO2-ZrO2 and the catalytic behaviour of Pd-only three-way catalyst. Appl. Catal. B-Environ. 2011, 105, 151–162. [Google Scholar] [CrossRef]
- Tan, Q.; Zhu, H.; Guo, S.; Chen, Y.; Jiang, T.; Shu, C.; Chong, S.; Hultman, B.; Liu, Y.; Wu, G. Quasi-zero-dimensional cobalt-doped CeO2 dots on Pd catalysts for alcohol electro-oxidation with enhanced poisoning-tolerance. Nanoscale 2017, 9, 12565–12572. [Google Scholar] [CrossRef]
- Zhai, Z.; Cui, D.; Zhang, Y.; Hou, Y.; Wang, H. Effects of loading transition metal (Mn, Cr, Fe, Cu) oxides on oxygenstorage/release properties of CeO2-ZrO2 solid solution. J. Rare Earth. 2019, 38, 274–280. [Google Scholar] [CrossRef]
- Kehoe, A.B.; Scanlon, D.O.; Watson, G.W. Role of Lattice Distortions in the Oxygen Storage Capacity of Divalently Doped CeO2. Chem. Mater. 2011, 23, 4464–4468. [Google Scholar] [CrossRef]
- Gupta, A.; Waghmare, U.V.; Hegde, M.S. Correlation of Oxygen Storage Capacity and Structural Distortion in Transition-Metal-, Noble-Metal-, and Rare-Earth-Ion-Substituted CeO2 from First Principles Calculation. Chem. Mater. 2010, 22, 5184–5198. [Google Scholar] [CrossRef]
- Swathi, S.; Yuvakkumar, R.; Kumar, P.S.; Ravi, G.; Thambidurai, M.; Dang, C.; Velauthapillai, D. Gadolinium doped CeO2 for efficient oxygen and hydrogen evolution reaction. Fuel 2022, 310, 122319. [Google Scholar] [CrossRef]
- Sawka, A.; Kwatera, A. Low temperature synthesis of Y2O3-doped CeO2 layers using mocvd. Mater. Sci. Eng. B-Adv 2022, 276, 115580. [Google Scholar] [CrossRef]
- Hou, H.; Yamada, H.; Nitta, A.; Murakami, Y.; Saito, N. Efficient Separation of Photoexcited Charge at Interface between Pure CeO2 and Y3+-Doped CeO2 with Heterogonous Doping Structure for Photocatalytic Overall Water Splitting. Materials 2021, 14, 350. [Google Scholar] [CrossRef]
- Polychronopoulou, K.; AlKhoori, A.A.; Efstathiou, A.M.; Jaoude, M.A.; Damaskinos, C.M.; Baker, M.A.; Almutama, A.; Anjum, D.H.; Vasiliades, M.A.; Belabbes, A.; et al. Design Aspects of Doped CeO2 for Low-Temperature Catalytic CO Oxidation: Transient Kinetics and DFT Approach. ACS Appl. Mater. Interfaces 2021, 13, 22391–22415. [Google Scholar] [CrossRef]
- Muravev, V.; Spezzati, G.; Su, Y.-Q.; Parastaev, A.; Chiang, F.-K.; Longo, A.; Escudero, C.; Kosinov, N.; Hensen, E.J.M. Interface dynamics of Pd-CeO2 single-atom catalysts during CO oxidation. Nat. Catal. 2021, 4, 469–478. [Google Scholar] [CrossRef]
- Chen, A.; Wang, S.; Pan, J.; Wang, T.; Chen, Y. Development of Zr- and Gd-doped porous ceria (pCeO2) abrasives for achieving high-quality and high-efficiency oxide chemical mechanical polishing, Ceram. Int. 2022, 48, 14039–14049. [Google Scholar] [CrossRef]
- Gnanam, S.; Gajendiran, J.; Ramana Ramya, J.; Ramachandran, K.; Gokul Raj, S. Glycine-assisted Hydrothermal Synthesis of Pure and Europium Doped CeO2 Nanoparticles and their Structural, Optical, Photoluminescence, Photocatalytic and Antibacterial Properties. Chem. Phys. Lett. 2021, 763, 138217. [Google Scholar] [CrossRef]
- Zhang, L.; Gao, J.; Liu, M.; Xia, C. Effect of impregnation of Sm-doped CeO2 in NiO/YSZ anode substrate prepared by gelcasting for tubular solid oxide fuel cell. J. Alloys Compd. 2009, 482, 168–172. [Google Scholar] [CrossRef]
- Channei, D.; Jannoey, P.; Nakaruk, A.; Phanichphant, S. Photocatalytic Activity of Cu-Doped Cerium Dioxide Nanoparticles. Key Eng. Mater. 2017, 751, 801–806. [Google Scholar] [CrossRef]
- Shannon, R.T. Revised effective ionic radii and systematic studies of interatomic distances in halides and chalcogenides. Acta Crystallogr. A 1976, 32, 751–767. [Google Scholar] [CrossRef]
- Lu, W.; Wang, H.; Guo, W.; He, P. Fabrication of Y2O3-doped CeO2 ultrathin film by newly developed component-controllable Langmuir-Blodgett method. J. Mater. Sci. Lett. 2001, 20, 423–425. [Google Scholar] [CrossRef]
- Burroughs, P.; Hamnett, A.; Orchard, A.F.; Thornton, G. Satellite structure in the X-ray photoelectron spectra of some binary and mixed oxides of lanthanum and cerium. J. Chem. Soc. 1976, 1686–1698. [Google Scholar] [CrossRef]
- Penkala, B.; Aubert, D.; Kaper, H.; Tardivat, C.; Conder, K.; Paulus, W. The role of lattice oxygen in CO oxidation over Ce18O2-based catalysts revealed under operando conditions. Catal. Sci. Technol. 2015, 5, 4839–4848. [Google Scholar] [CrossRef]
- Lin, X.M.; Li, L.P.; Li, G.S.; Su, W.H. Transport property and Raman spectra of nanocrystalline solid solutions Ce0.8Nd0.2O2-δ with different particle size. Mater. Chem. Phys. 2001, 69, 236–240. [Google Scholar] [CrossRef]
- Fernández-García, M.; Wang, X.Q.; Belver, C.; Iglesias-Juez, A.; Hanson, J.C.; Rodriguez, J. Ca Doping of Nanosize Ce-Zr and Ce-Tb Solid Solutions: Structural and Electronic Effects. Chem. Mater. 2005, 17, 4181–4193. [Google Scholar] [CrossRef]
- Huang, W.; Gao, Y. Morphology-dependent surface chemistry and catalysis of CeO2 nanocrystals. Catal. Sci. Technol. 2014, 4, 3772–3784. [Google Scholar] [CrossRef]
- Ridwan, M.; Tamarany, R.; Han, J.; Nam, S.W.; Ham, H.C.; Kim, J.Y.; Choi, S.H.; Jang, S.C.; Yoon, C.W. Atomically dispersed Cu on Ce1-xRExO2-δ nanocubes (RE = La and Pr) for water gas shift: Influence of OSC on catalysis. RSC Adv. 2015, 5, 89478–89481. [Google Scholar] [CrossRef]
- Pu, Z.Y.; Lu, J.Q.; Luo, M.F.; Xie, Y.L. Study of Oxygen Vacancies In Ce0.9Pr0.1O2-δ Solid Solution By In Situ X-Ray Diffraction and In Situ Raman Spectroscopy. J. Phys. Chem. C 2007, 111, 18695–18702. [Google Scholar] [CrossRef]
- Xu, B.; Zhang, Q.; Yuan, S.; Liu, S.; Zhang, M.; Ohno, T. Synthesis and photocatalytic performance of yttrium-doped CeO2 with a hollow sphere structure. Catal. Today 2017, 281, 135–143. [Google Scholar] [CrossRef] [Green Version]
- Chahal, S.; Rani, N.; Kumar, A.; Kumar, P. UV-irradiated photocatalytic performance of yttrium doped ceria for hazardous Rose Bengal dye. Appl. Surf. Sci. 2019, 493, 87–93. [Google Scholar] [CrossRef]
- Yang, H.; Xu, B.; Yuan, S.; Zhang, Q.; Zhang, M.; Ohno, T. Synthesis of Y-doped CeO2/PCN nanocomposited photocatalyst with promoted photoredox performance. Appl. Catal. B-Environ. 2019, 243, 513–521. [Google Scholar] [CrossRef]
- Liyanage, A.D.; Perera, S.D.; Tan, K.; Chabal, Y.; Balkus, K.J. Synthesis, Characterization, and Photocatalytic Activity of Y-Doped CeO2 Nanorods. ACS Catal. 2014, 4, 577–584. [Google Scholar] [CrossRef]
- Li, K.; Wang, H.; Wei, Y.; Liu, M. Catalytic performance of cerium iron complex oxides for partial oxidation of methane to synthesis gas. J. Rare Earth. 2008, 26, 705–710. [Google Scholar] [CrossRef]
Figure 1.
Schematic illustration of the synthesis of undoped and Y-doped CeO2 using three routes.

Figure 2.
XRD patterns of Undoped and H-Y-, I-Y-, and H/I-Y-doped CeO2 powders (the inset shows the (111) reflection shifts using a smaller scan speed of 0.01°/min).
Figure 2.
XRD patterns of Undoped and H-Y-, I-Y-, and H/I-Y-doped CeO2 powders (the inset shows the (111) reflection shifts using a smaller scan speed of 0.01°/min).

Figure 3.
(a) Wide-scan XPS spectra of Undoped and H-Y-, I-Y-, and H/I-Y-doped CeO2 and (b) the corresponding XPS regions of Y 3d for H-Y-, I-Y-, and H/I-Y-doped CeO2 (the inset in Figure 3b is an independent drawing of the Y 3d XPS region for I-Y-doped CeO2).
Figure 3.
(a) Wide-scan XPS spectra of Undoped and H-Y-, I-Y-, and H/I-Y-doped CeO2 and (b) the corresponding XPS regions of Y 3d for H-Y-, I-Y-, and H/I-Y-doped CeO2 (the inset in Figure 3b is an independent drawing of the Y 3d XPS region for I-Y-doped CeO2).

Figure 4.
Ce 3d XPS spectra of Undoped and H-Y-, I-Y-, and H/I-Y-doped CeO2.

Figure 5.
O 1s core-level XPS spectra of Undoped and H-Y-, I-Y-, and H/I-Y-doped CeO2.

Figure 6.
Raman spectra of Undoped and H-Y-, I-Y-, and H/I-Y-doped CeO2.

Figure 7.
O2-TPD profiles of Undoped and H-Y-, I-Y-, and H/I-Y-doped CeO2 powders.


Table 1.
Phase, lattice parameters, [Ce3+]XPS, [VO]XPS, [VO]Raman, and [OSC] of Undoped and H-Y-, I-Y-, and H/I-Y-doped CeO2.
Table 1.
Phase, lattice parameters, [Ce3+]XPS, [VO]XPS, [VO]Raman, and [OSC] of Undoped and H-Y-, I-Y-, and H/I-Y-doped CeO2.
| Parameter Sample Name | Undoped | H-Y Doped | I-Y Doped | H/I-Y Doped |
|---|---|---|---|---|
| Phase from XRD | CeO2 | CeO2 | CeO2 | CeO2 |
| Lattice parameters (Å) | 5.4117 | 5.4242 | 5.4190 | 5.4227 |
| [Ce3+]XPS (%) | 6.54 | 12.60 | 8.95 | 11.37 |
| [VO]XPS (%) | 24.36 | 30.65 | 26.32 | 28.72 |
| [VO]Raman | 0.67 | 1.47 | 0.93 | 1.16 |
| [OSC] (mmol O2/g CeO2) | 0.153 | 0.372 | 0.248 | 0.353 |
Table 2.
Recent literature on the lattice parameters, [Ce3+]XPS, [VO]XPS, and [VO]Raman of undoped and Y-doped CeO2.
Table 2.
Recent literature on the lattice parameters, [Ce3+]XPS, [VO]XPS, and [VO]Raman of undoped and Y-doped CeO2.
| Authors | Lattice Parameters (Å) | [Ce3+]XPS (%) | [VO]XPS (%) | [VO]Raman |
|---|---|---|---|---|
| Xu et al. [41] | 5.4178 (CeO2); 5.4217 (Y-doped) | 12.60 (CeO2); 21.38 (Y-doped) | 28.53 (CeO2); 33.81 (Y-doped) | 1.1 (CeO2); 4.9 (Y-doped) |
| Chahal et al. [42] | 5.413 (CeO2-δ); 5.416 (Ce0.97Y0.03O2-δ) | 26.6% (CeO2-δ); 35.3% (Ce0.97Y0.03O2-δ) | 46.9% (CeO2-δ); 52.6% (Ce0.97Y0.03O2-δ) | 1.9 (CeO2-δ); 2.9 (Ce0.97Y0.03O2-δ) |
| Yang et al. [43] | 5.4129 (CeO2); 5.4325 (Y-doped) | 18.13% (CeO2); 22.88% (Y-doped) | / | / |
| Liyanage et al. [44] | / | 11.40 (CeO2); 10.07 (Ce0.89Y0.11O1.94) | / | / |
Publisher’s Note: MDPI stays neutral with regard to jurisdictional claims in published maps and institutional affiliations. |
© 2022 by the authors. Licensee MDPI, Basel, Switzerland. This article is an open access article distributed under the terms and conditions of the Creative Commons Attribution (CC BY) license (https://creativecommons.org/licenses/by/4.0/).
Share and Cite
MDPI and ACS Style
Xu, Y.; Gao, L.; Ding, Z. Synthesis and Oxygen Storage Capacities of Yttrium-Doped CeO2 with a Cubic Fluorite Structure. Materials 2022, 15, 8971. https://0-doi-org.brum.beds.ac.uk/10.3390/ma15248971
AMA Style
Xu Y, Gao L, Ding Z. Synthesis and Oxygen Storage Capacities of Yttrium-Doped CeO2 with a Cubic Fluorite Structure. Materials. 2022; 15(24):8971. https://0-doi-org.brum.beds.ac.uk/10.3390/ma15248971
Chicago/Turabian StyleXu, Yaohui, Liangjuan Gao, and Zhao Ding. 2022. "Synthesis and Oxygen Storage Capacities of Yttrium-Doped CeO2 with a Cubic Fluorite Structure" Materials 15, no. 24: 8971. https://0-doi-org.brum.beds.ac.uk/10.3390/ma15248971
Note that from the first issue of 2016, this journal uses article numbers instead of page numbers. See further details here.