

Carbonation Resistance and Pore Structure of Mixed-Fiber-Reinforced Concrete Containing Fine Aggregates of Iron Ore Tailings
Abstract
:1. Introduction
2. Materials and Methods
2.1. Materials
2.1.1. Cementitious Materials
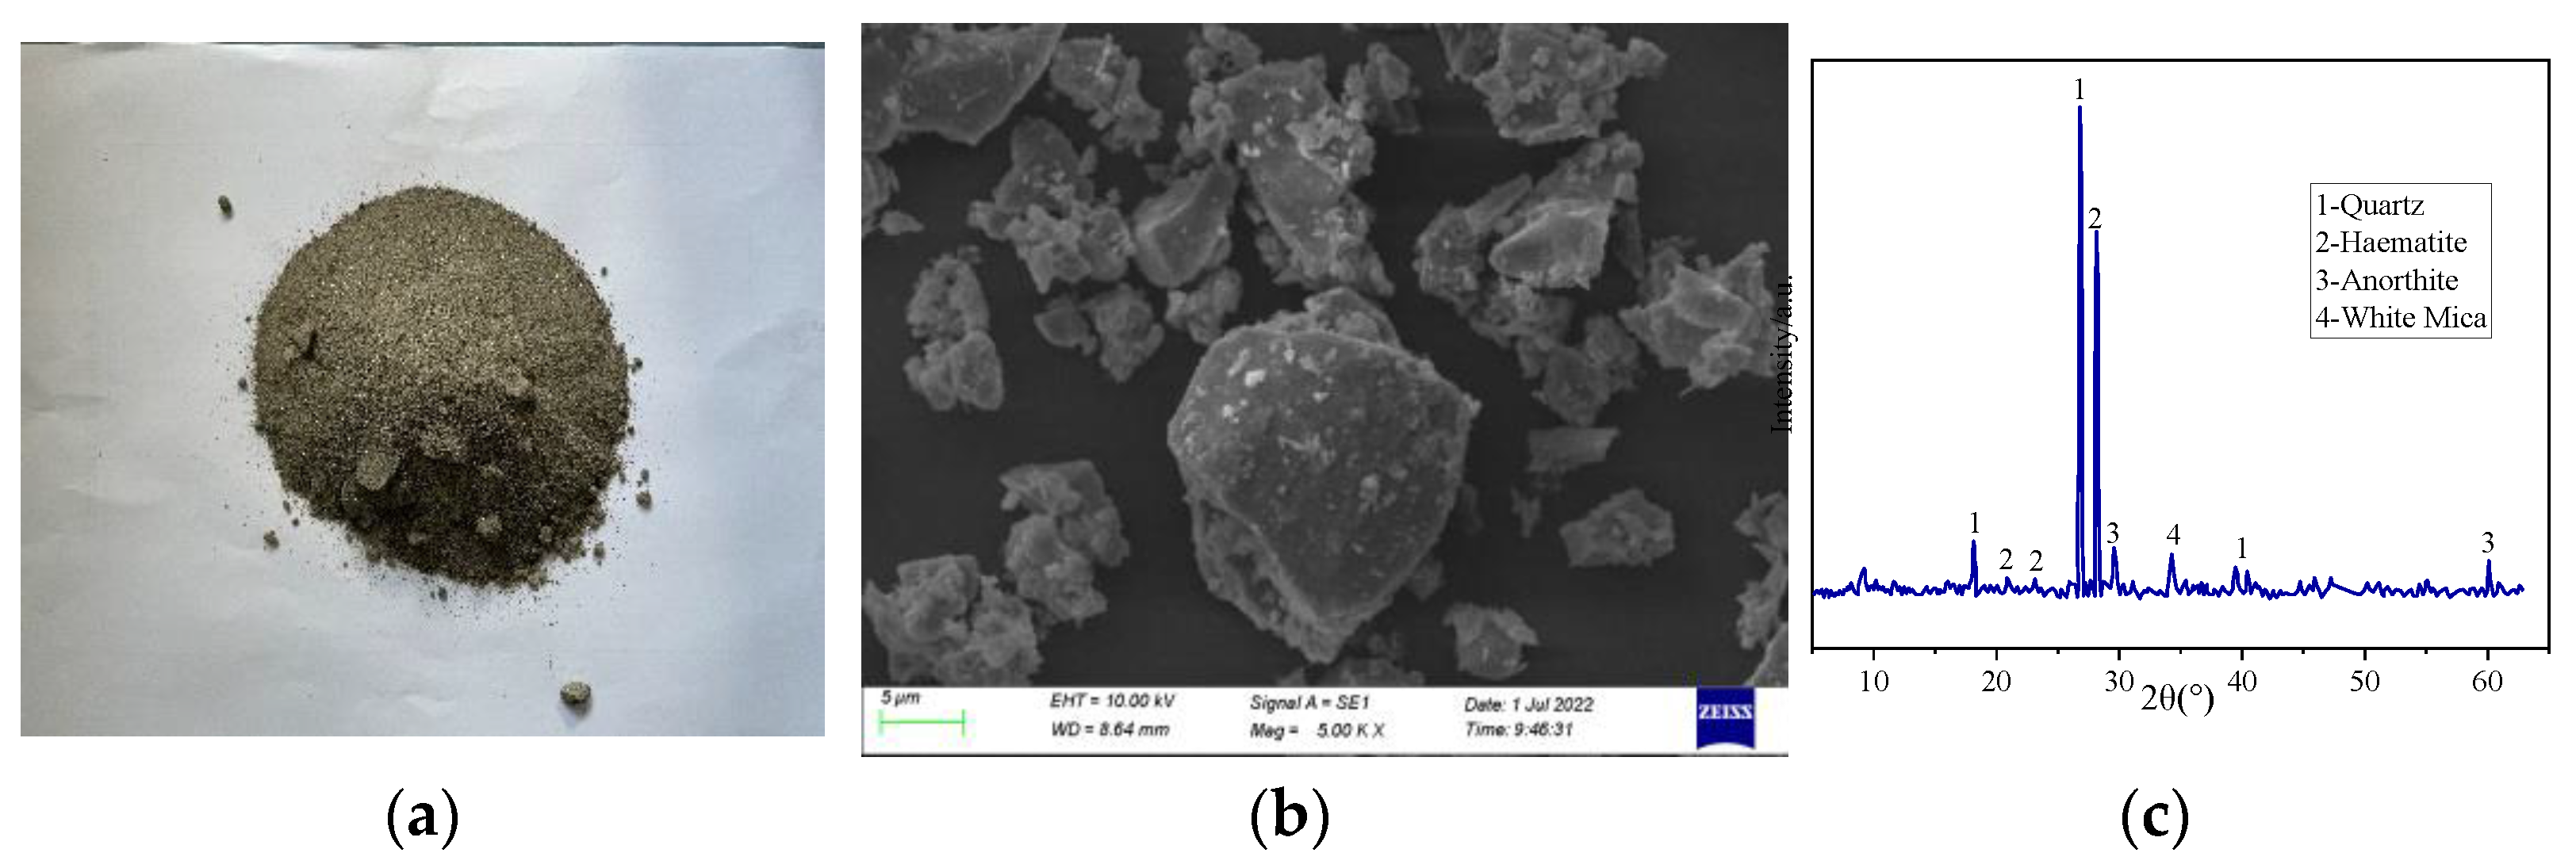
2.1.2. Aggregates
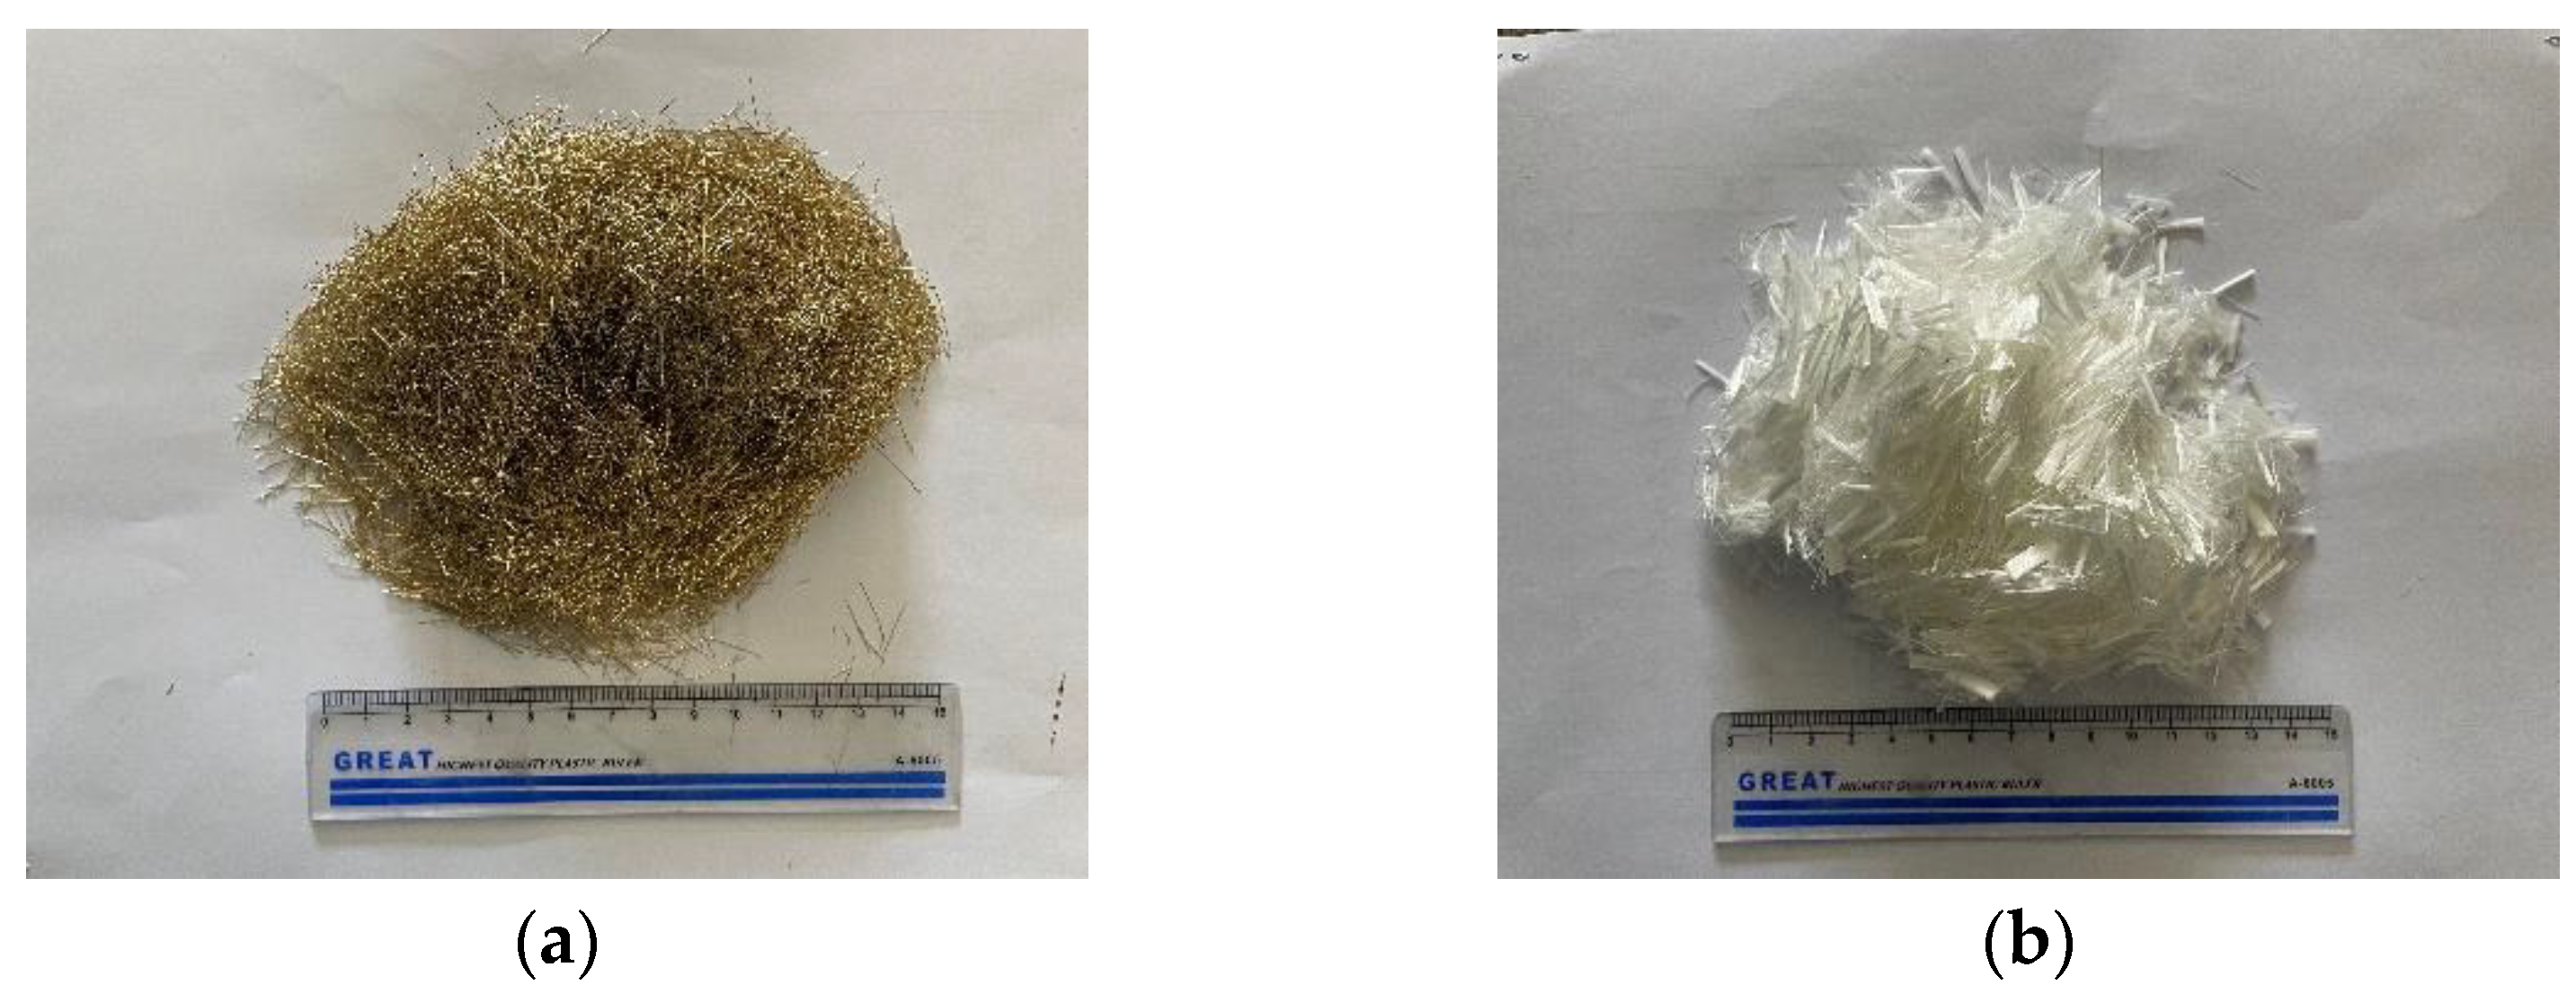
2.1.3. Fibers
2.2. Mix Ratio
2.3. Preparation of Specimens
2.4. Analysis Procedure
2.4.1. Mechanical Property Testing
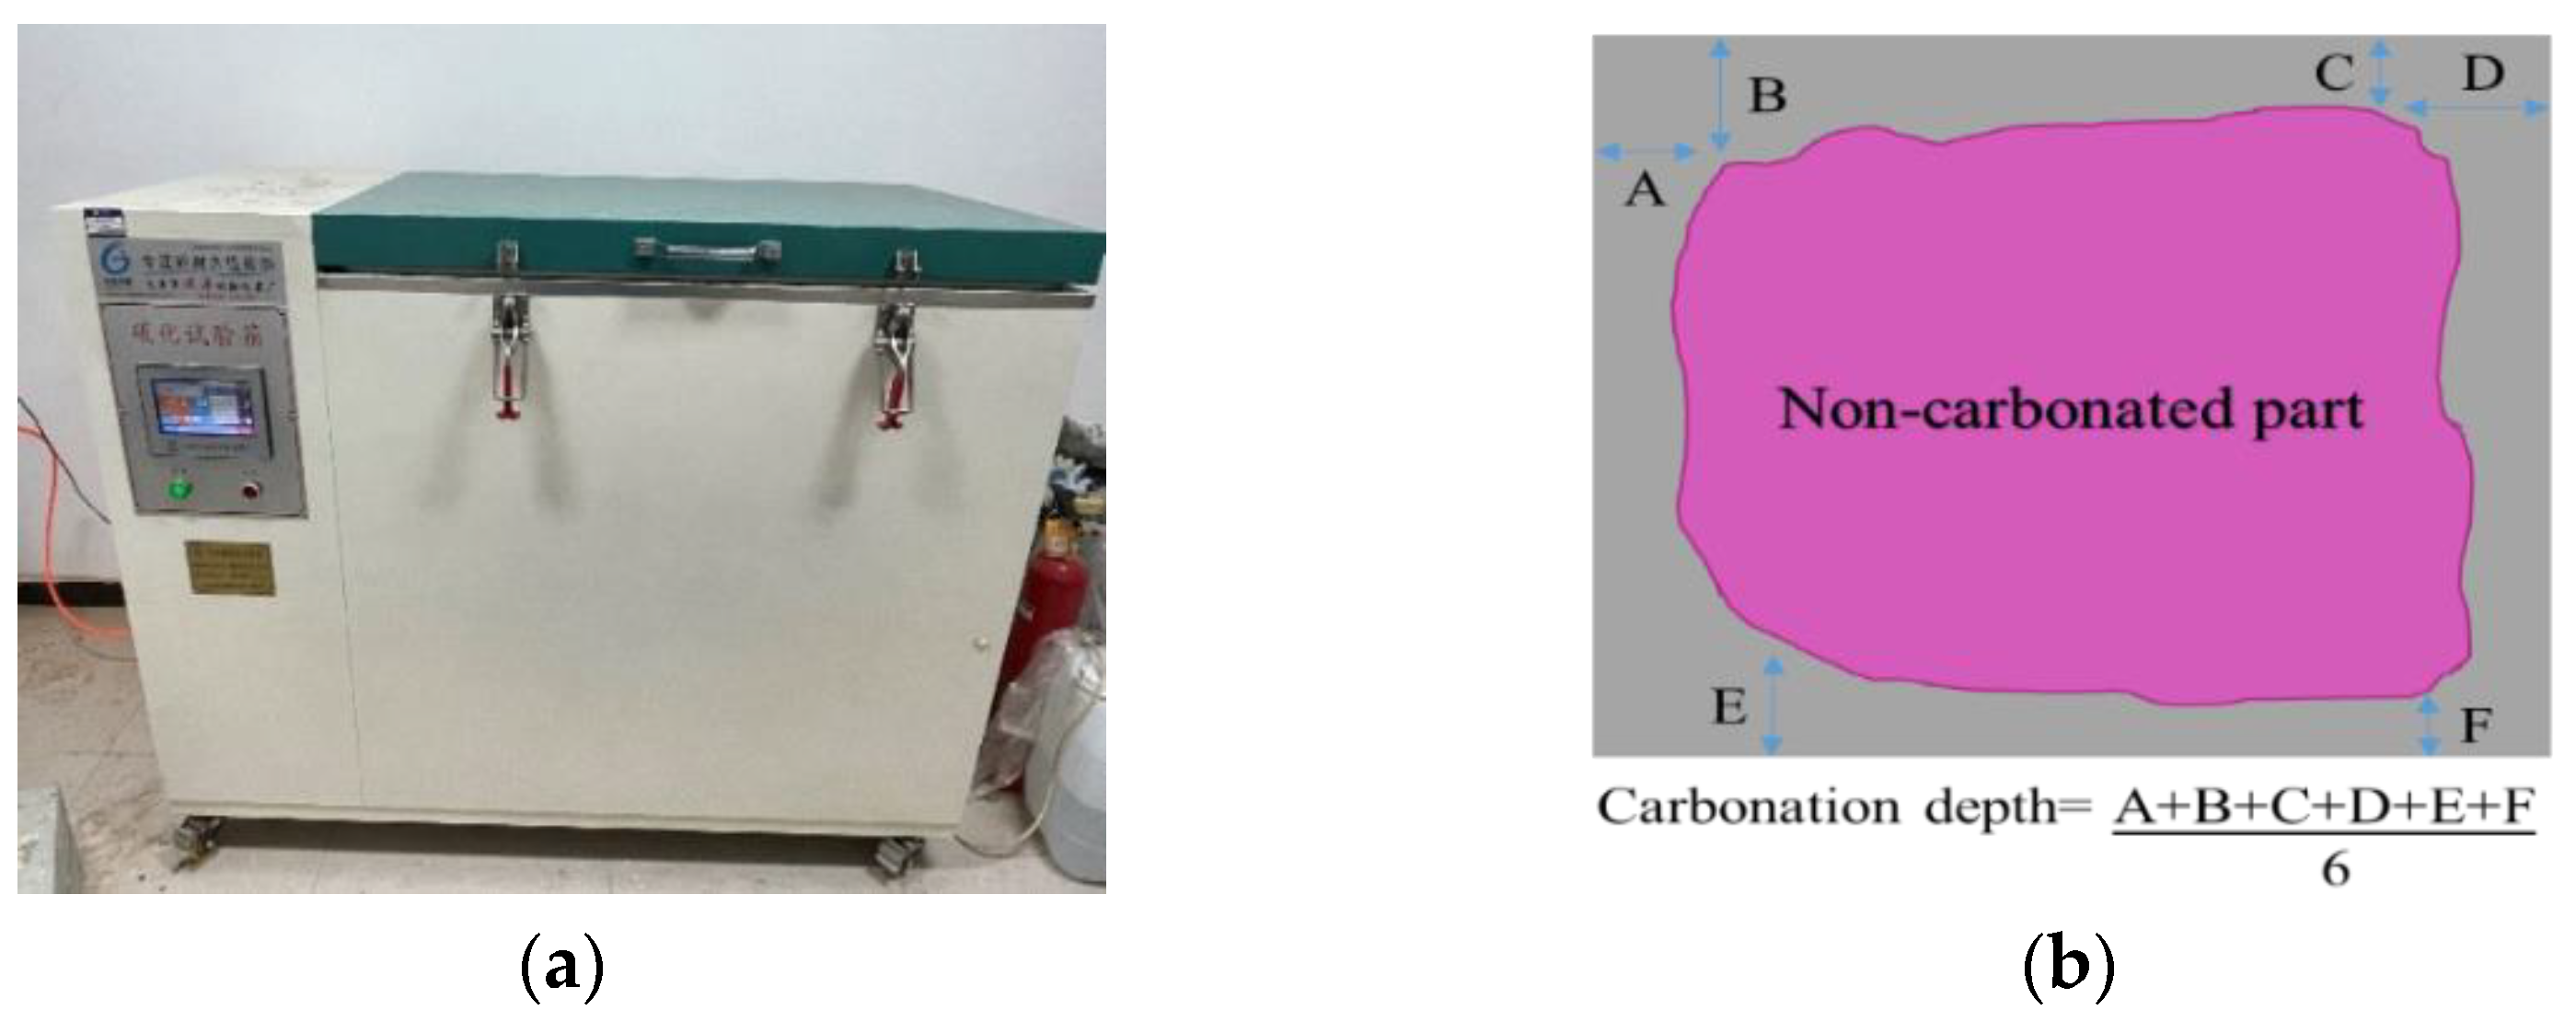
2.4.2. Carbonation Testing
2.4.3. Nuclear Magnetic Resonance Studies
2.4.4. SEM Observations
3. Results and Discussion
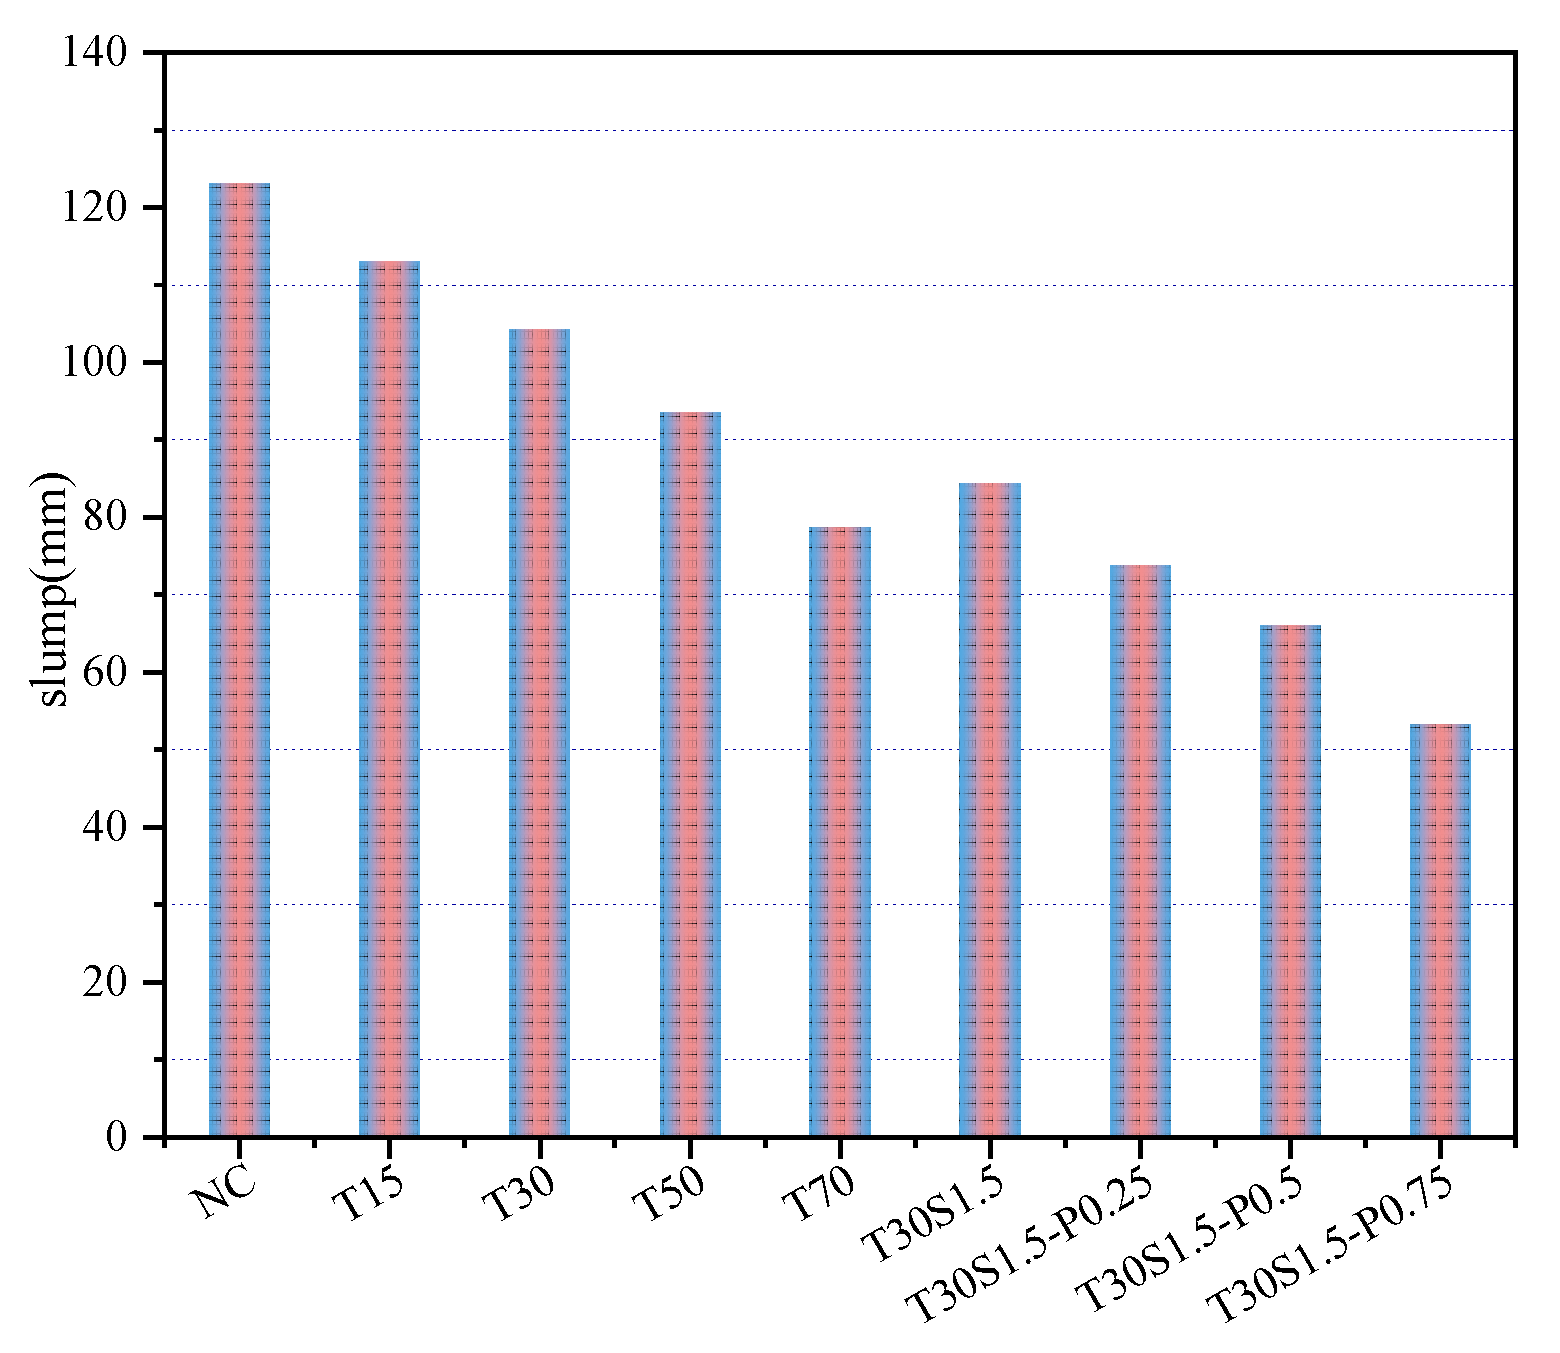
3.1. Working Performance
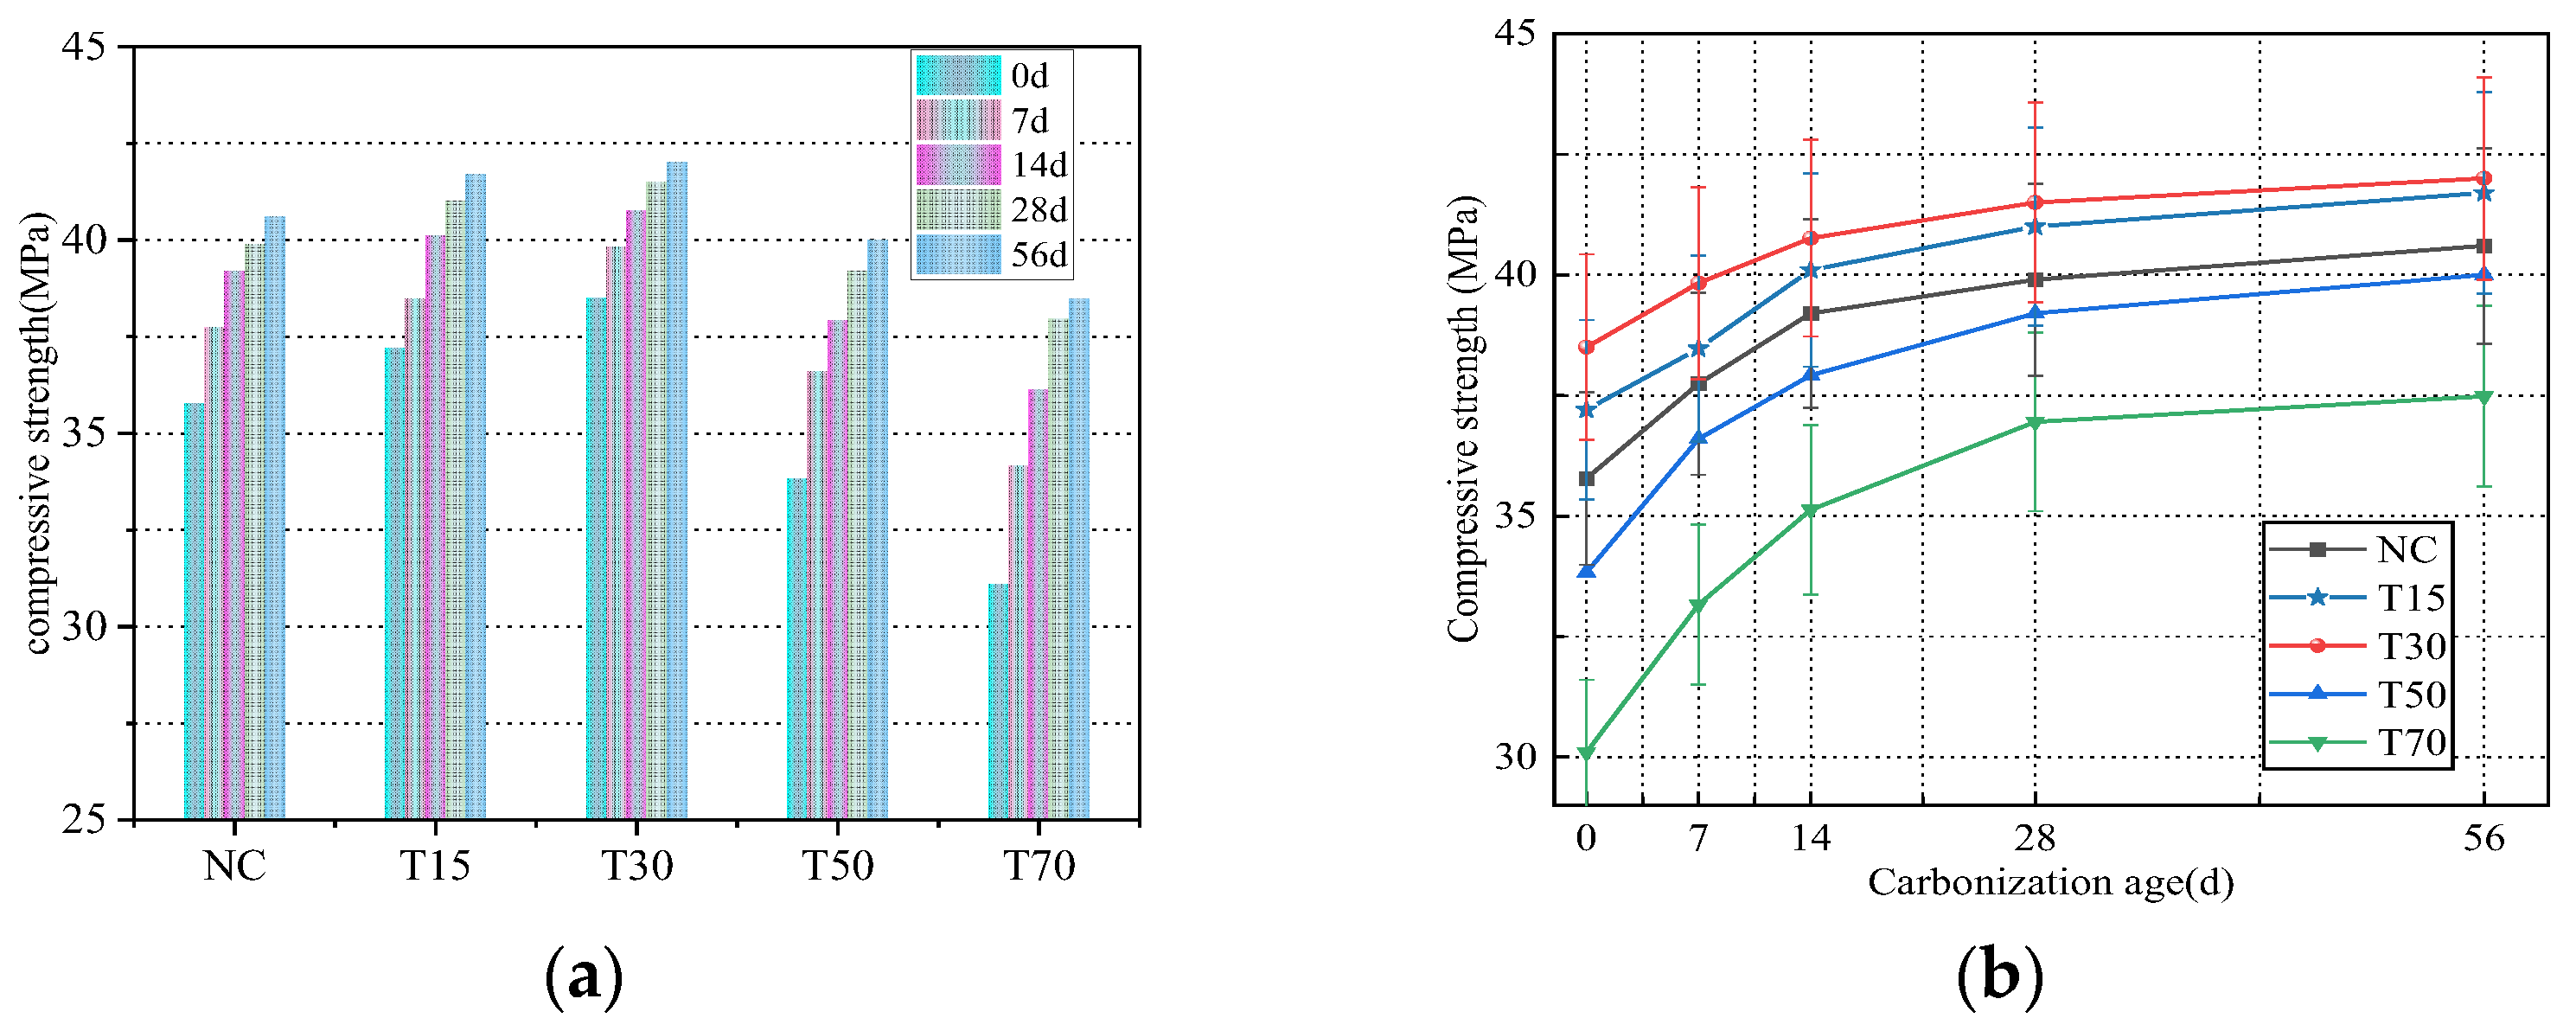
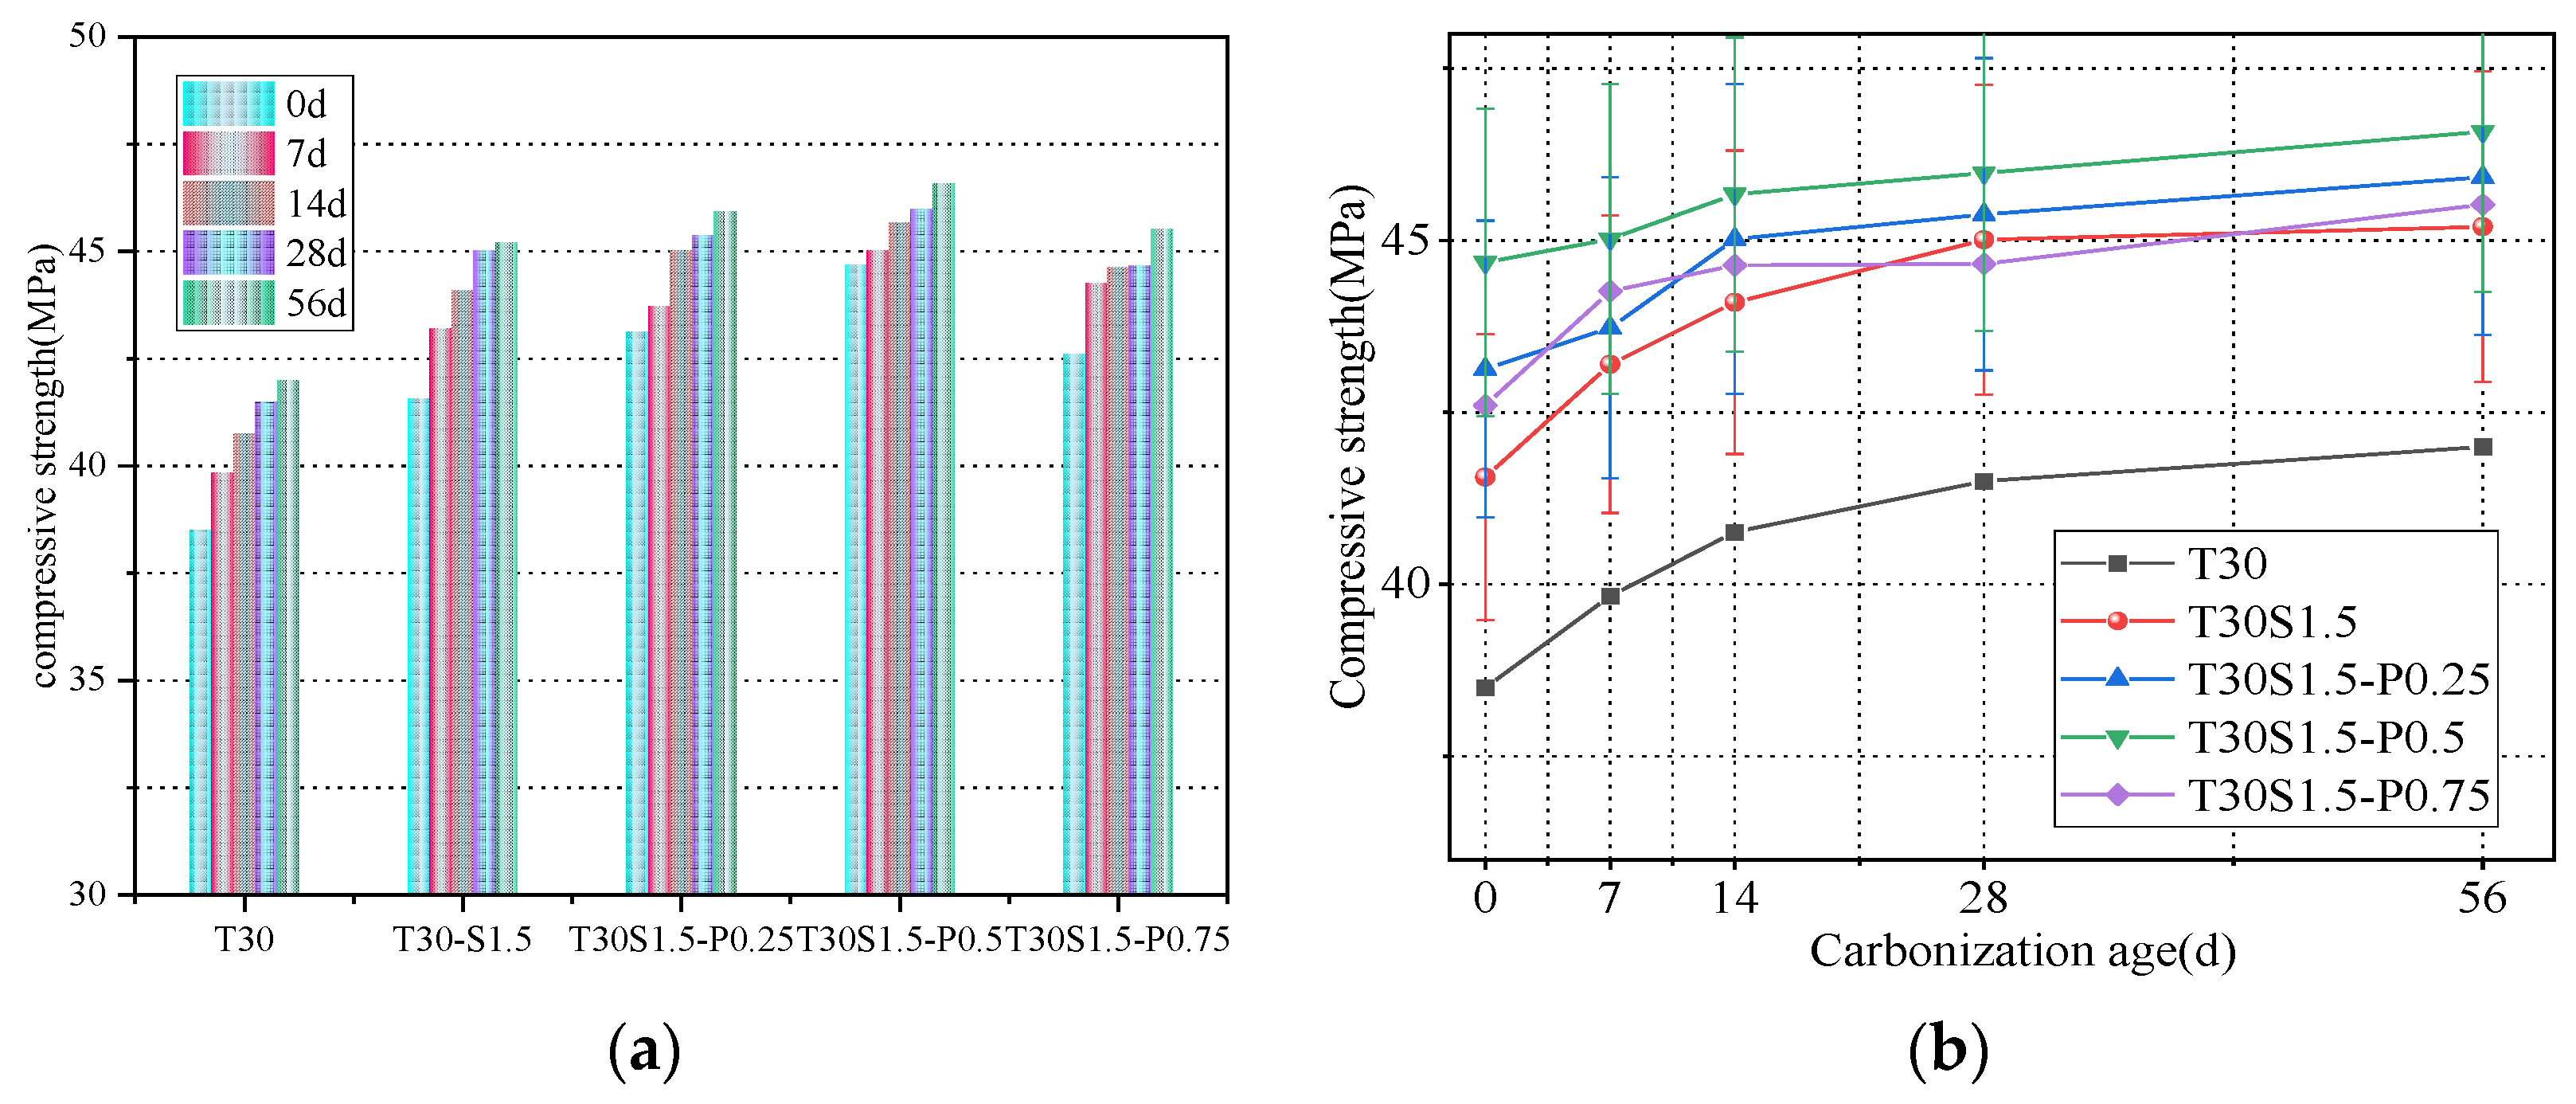
3.2. Cube Compressive Strength
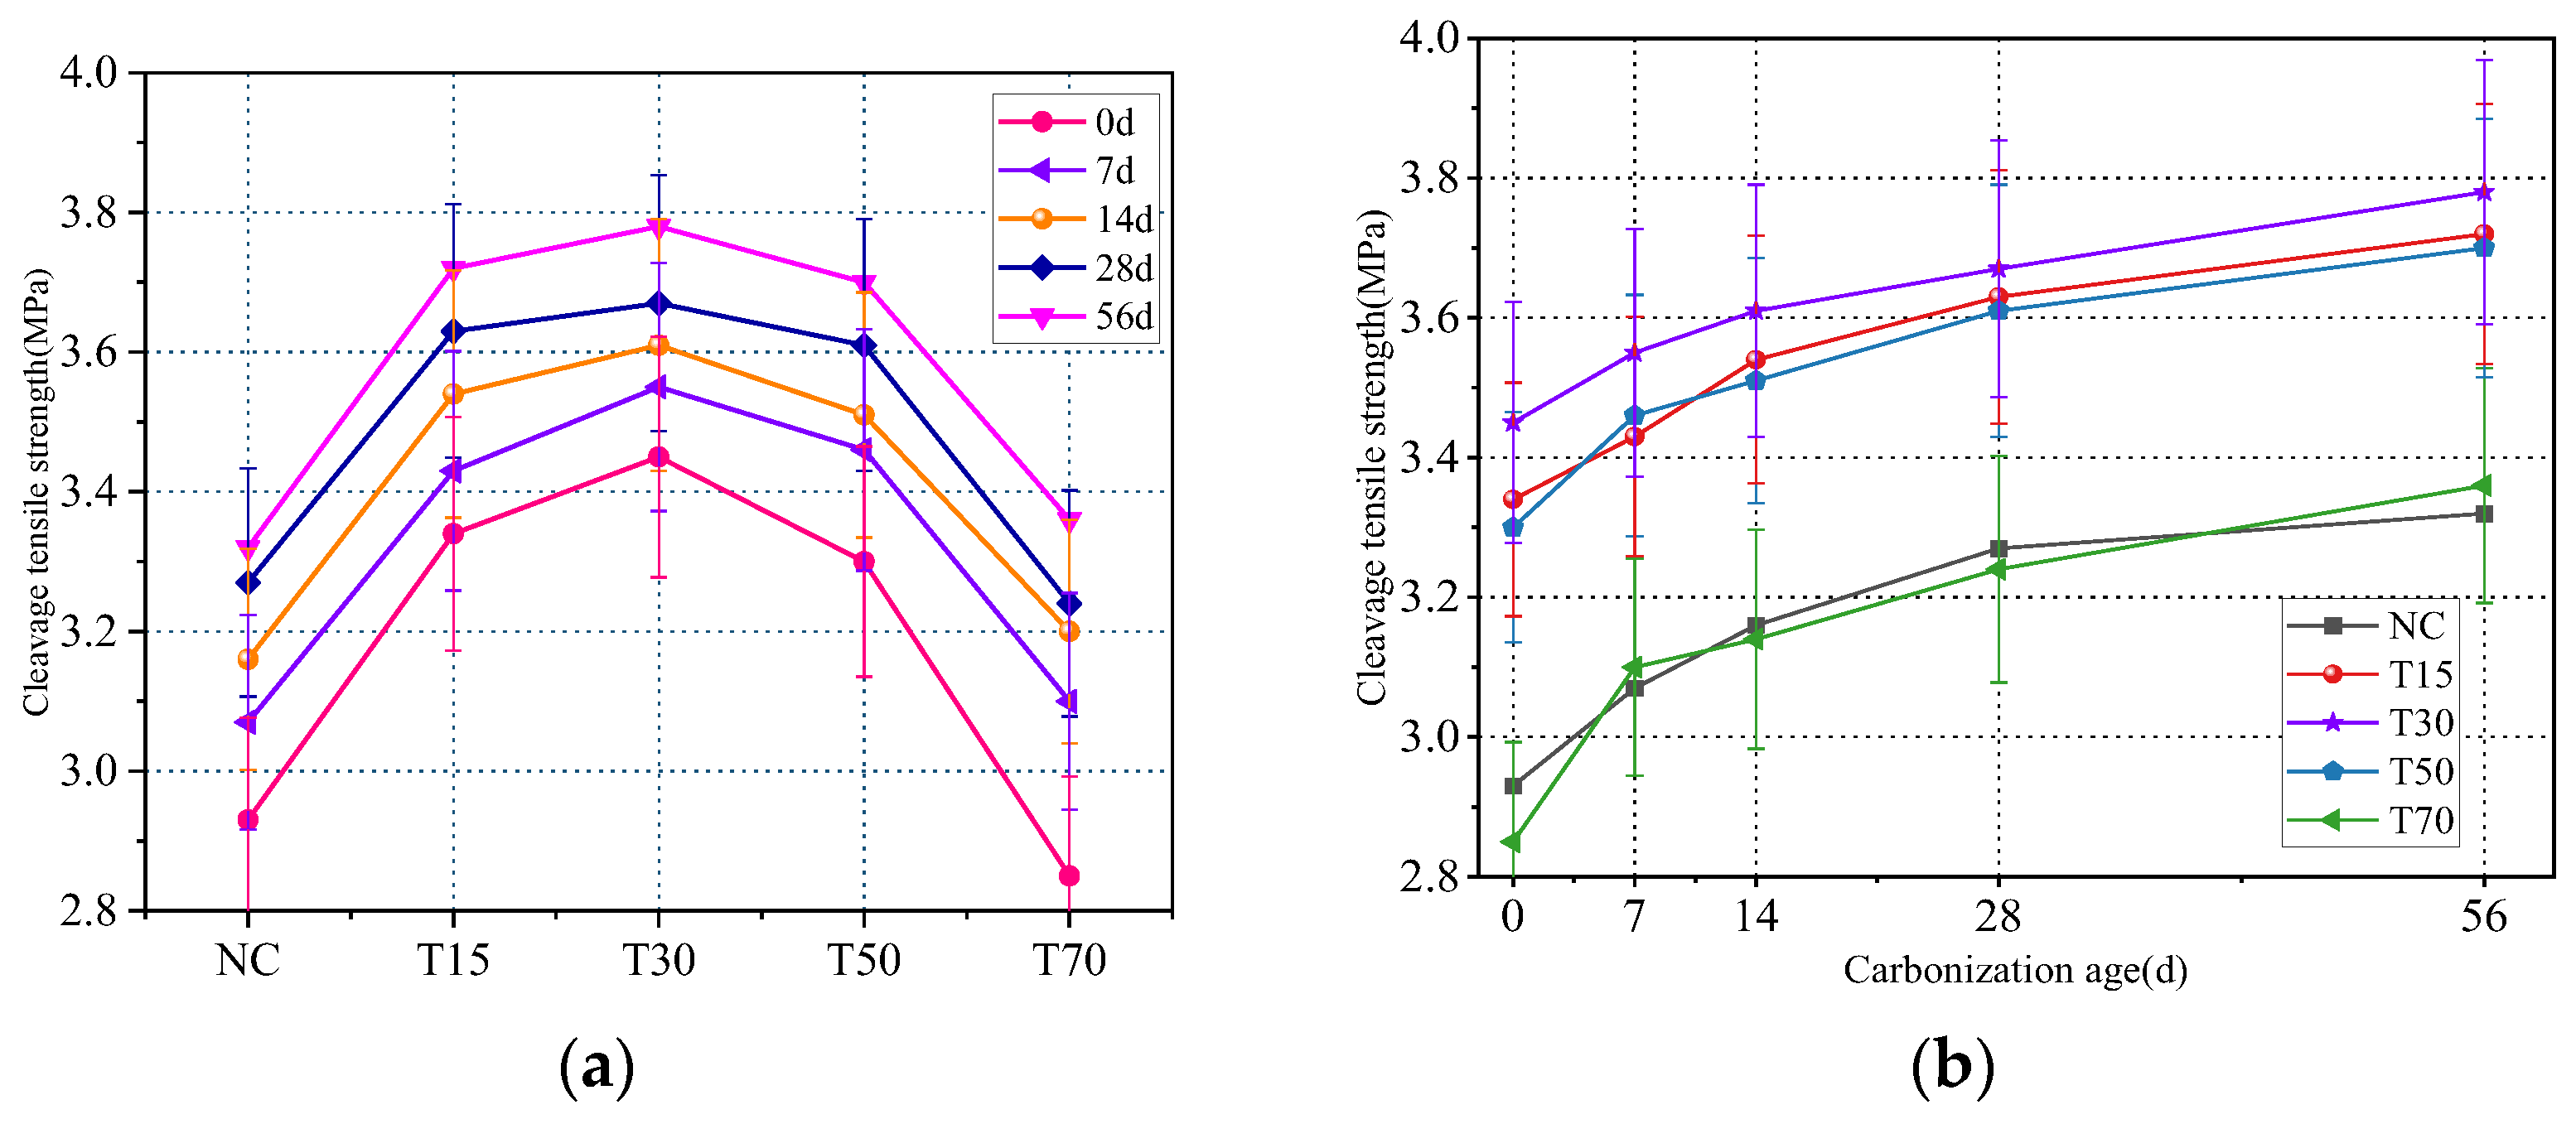
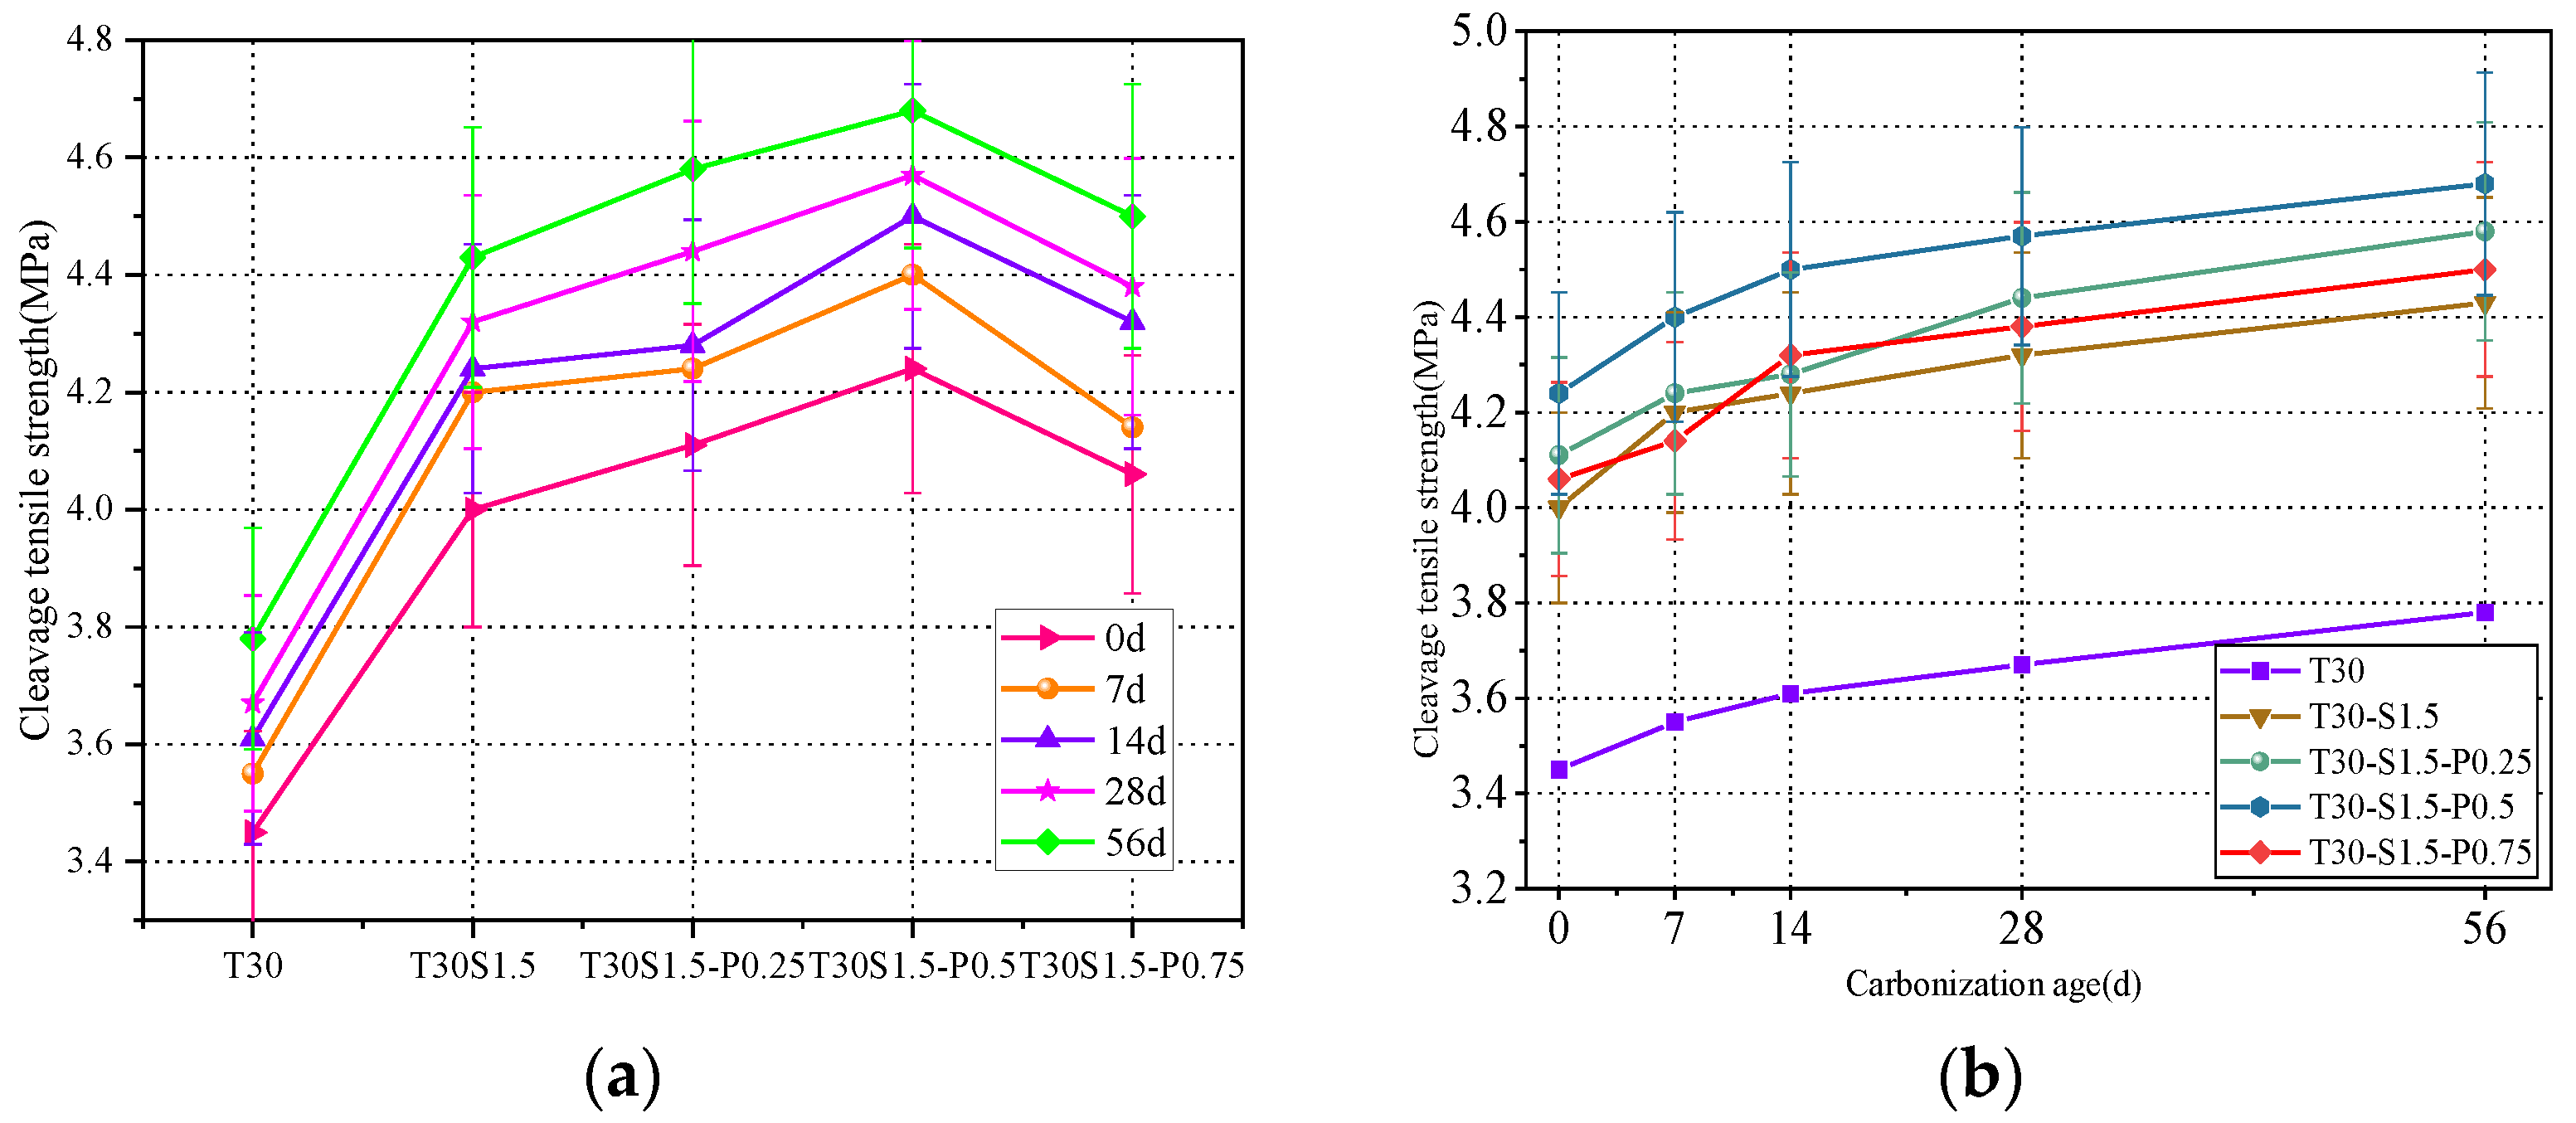
3.3. Cube Splitting Tensile Strength
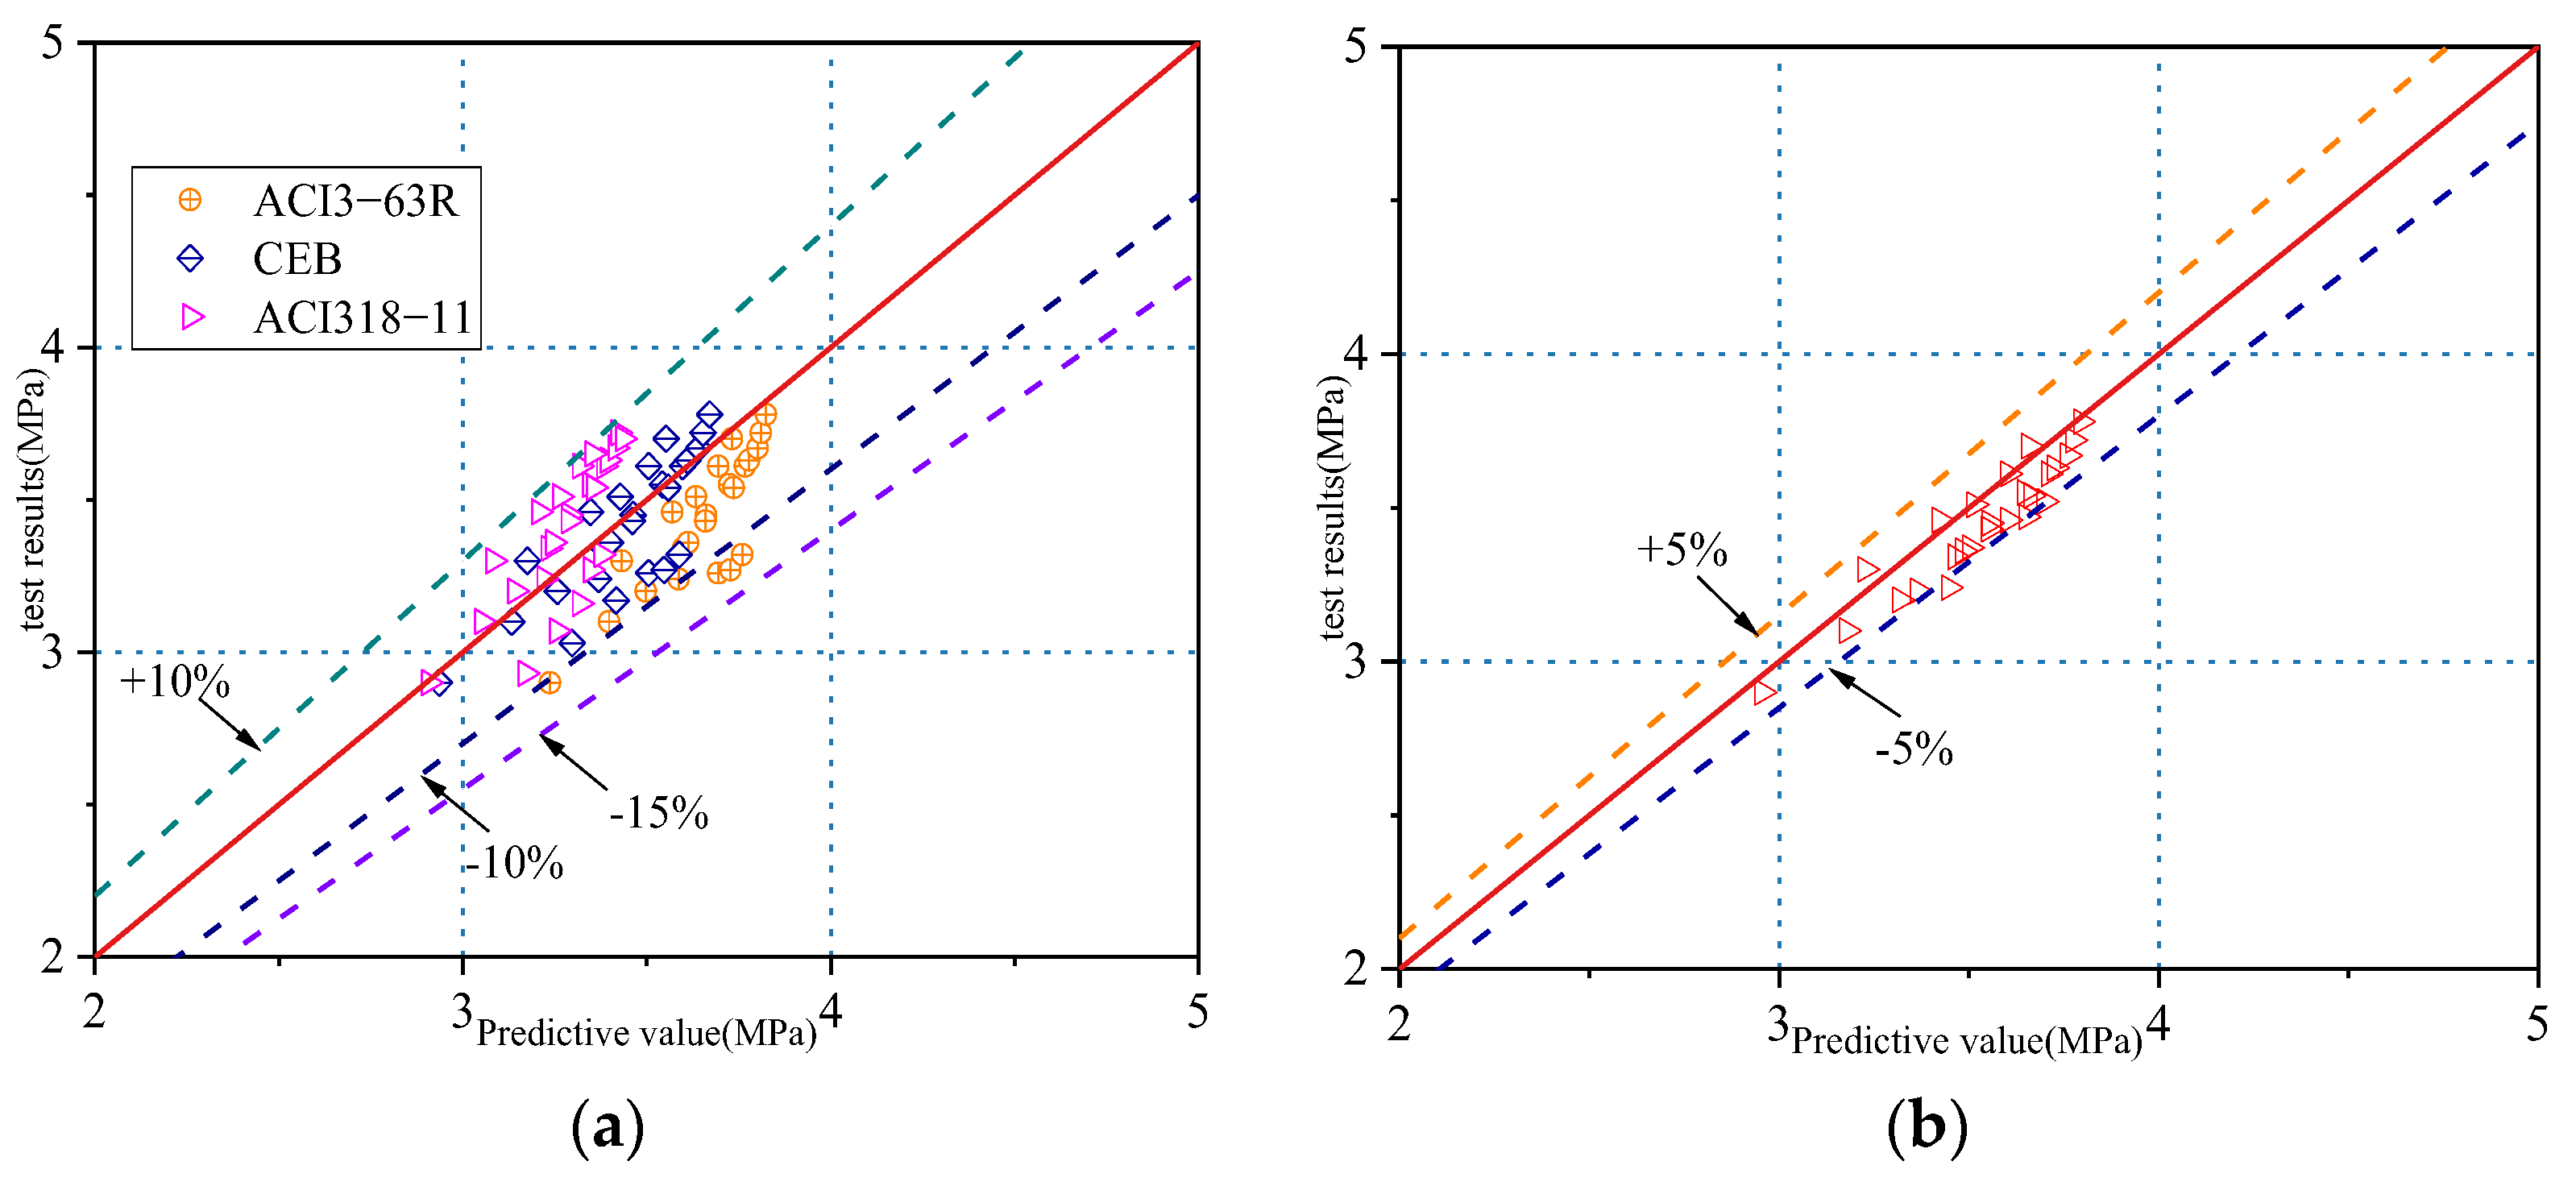
3.4. Axial Compressive Strength
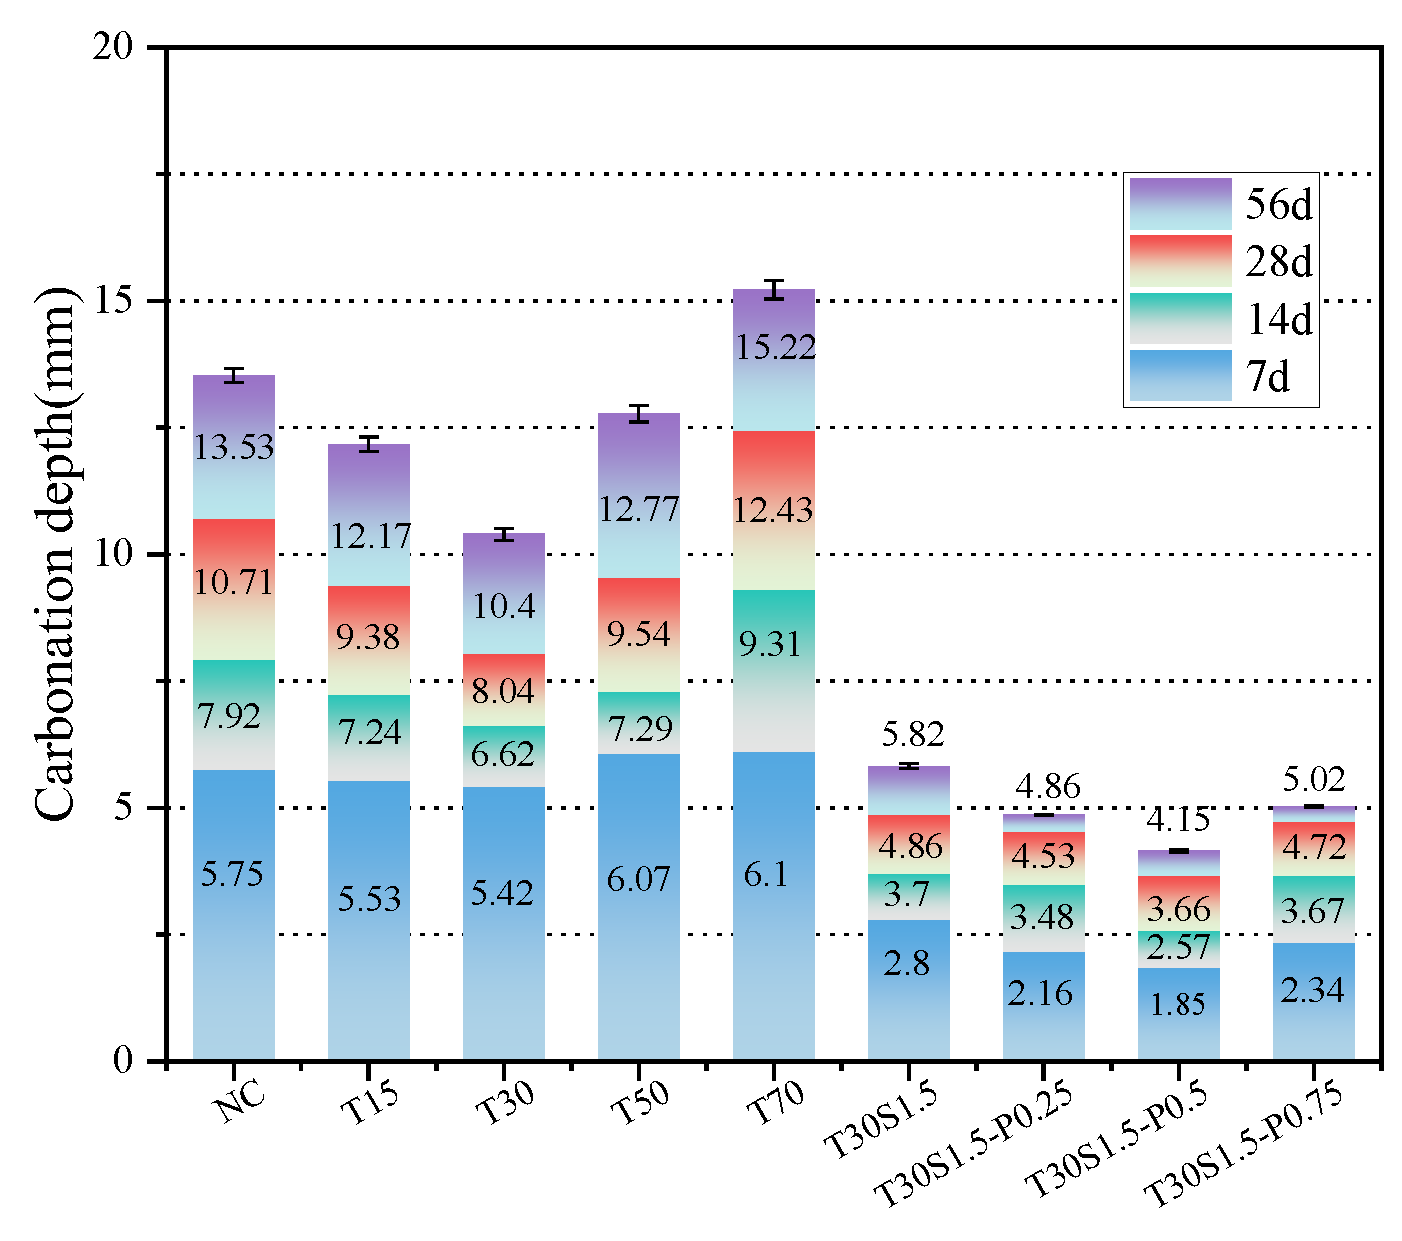
3.5. Carbonation Depth
3.6. Derivation of A Carbonation Model
- fu1: compressive strength of the iron tailings concrete before carbonation, MPa;
- fu2: compressive strength of the steel–PVA fiber iron tailings concrete before carbonation, MPa;
- t: carbonation time;
- C: CO2 concentration;
- β(ρ1): influence coefficient of iron tailings, which is a function of their replacement rate (ρ1);
- β(ρ2): influence coefficient of steel–PVA fiber iron tailings, which is a function of the PVA fiber content (ρ2).
3.7. NMR Analysis
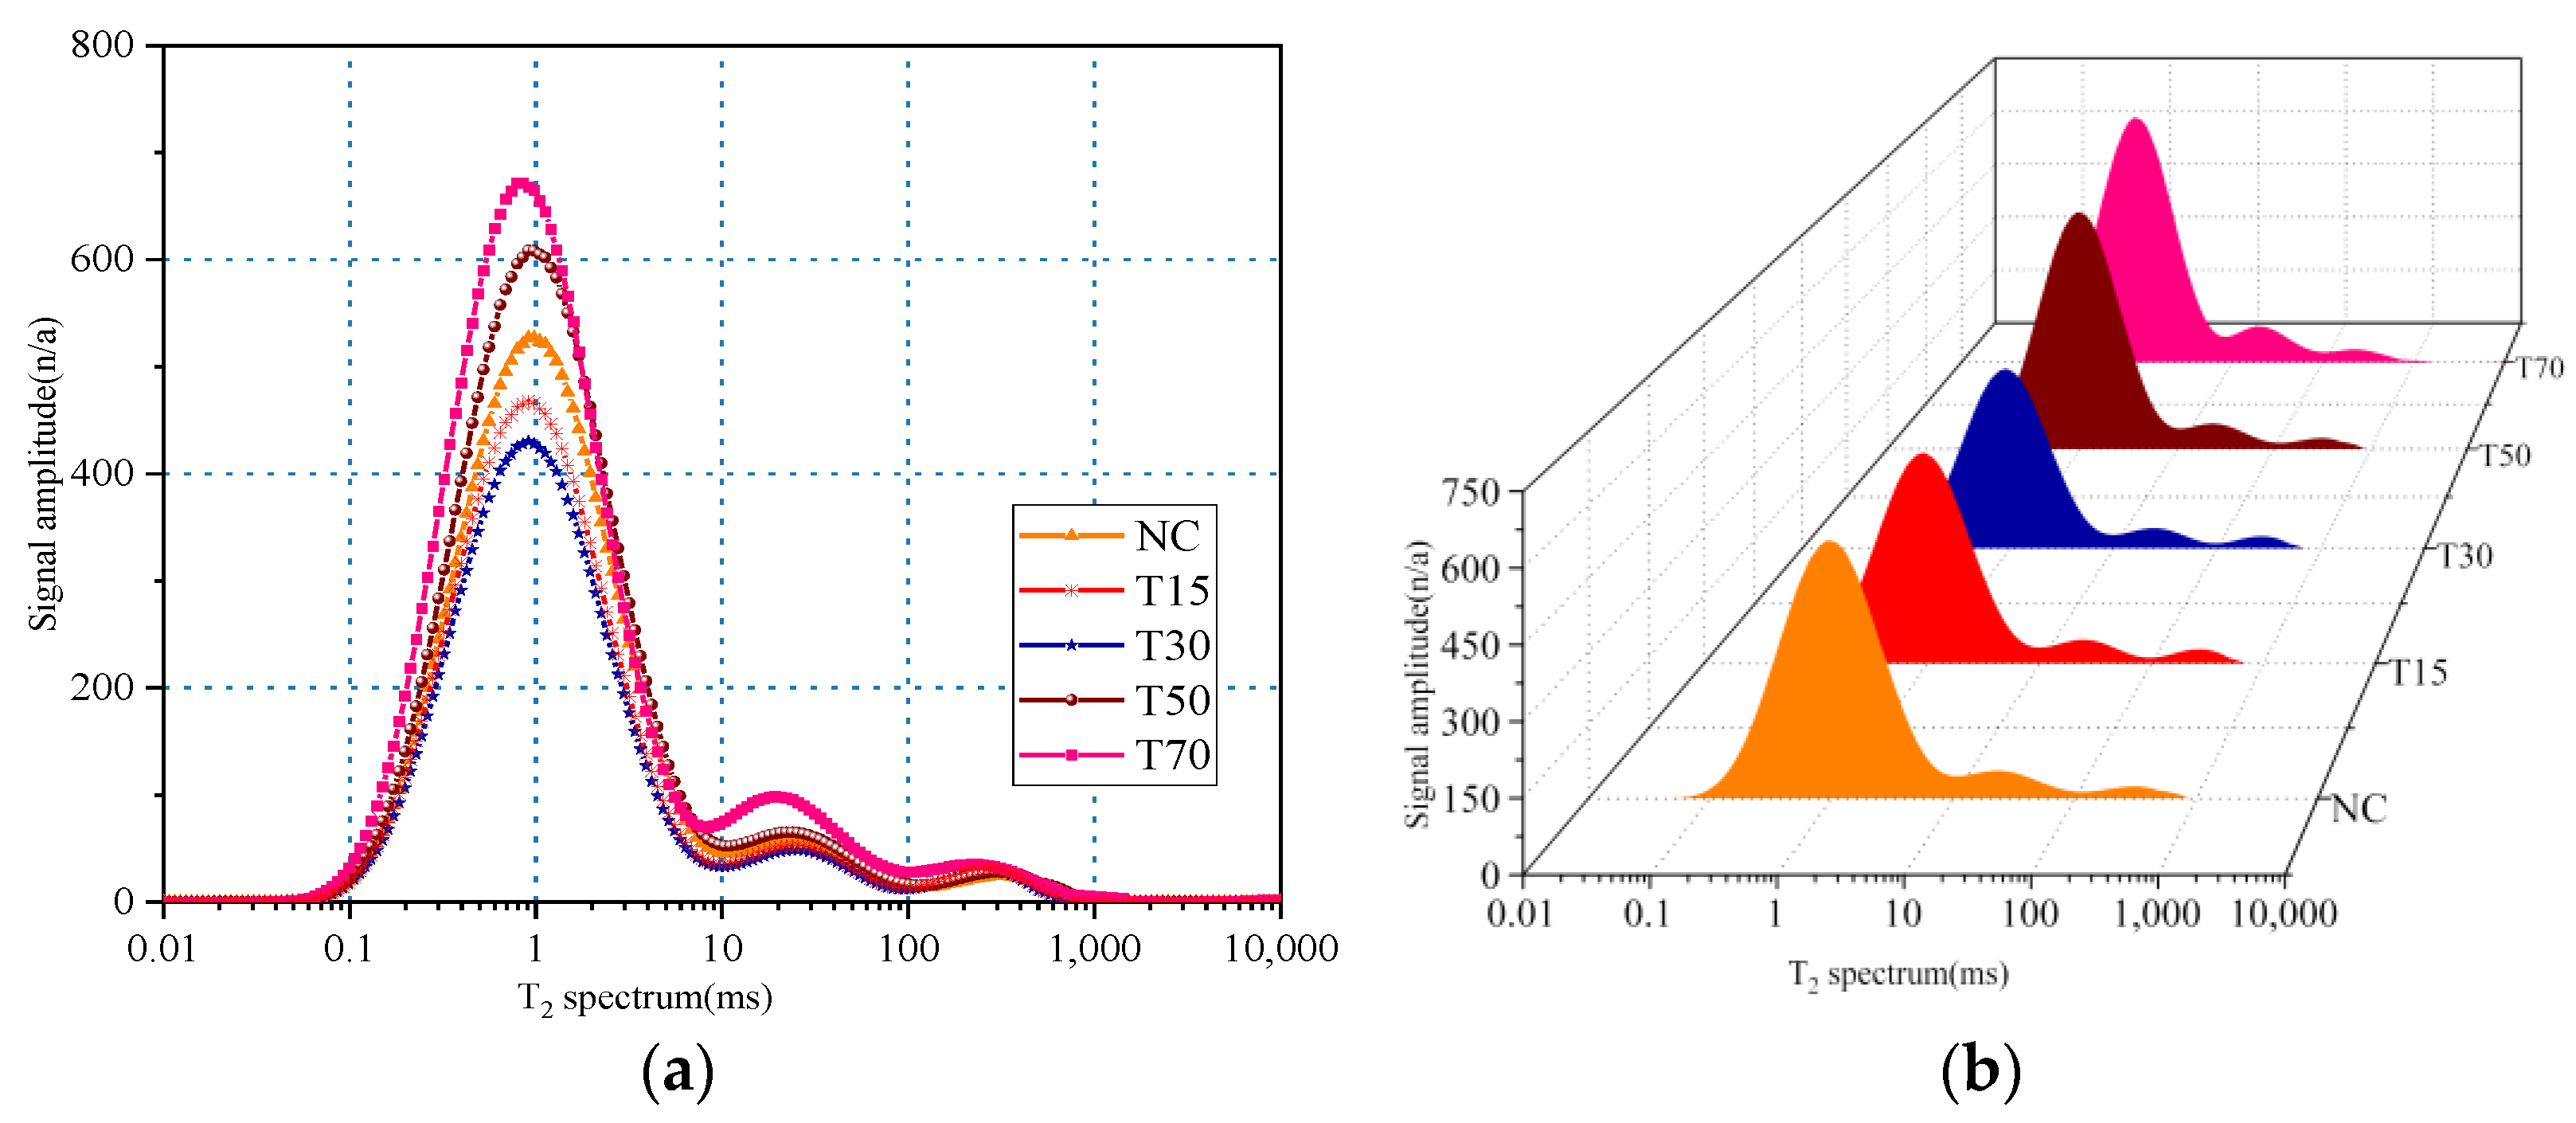
3.7.1. Before Carbonation
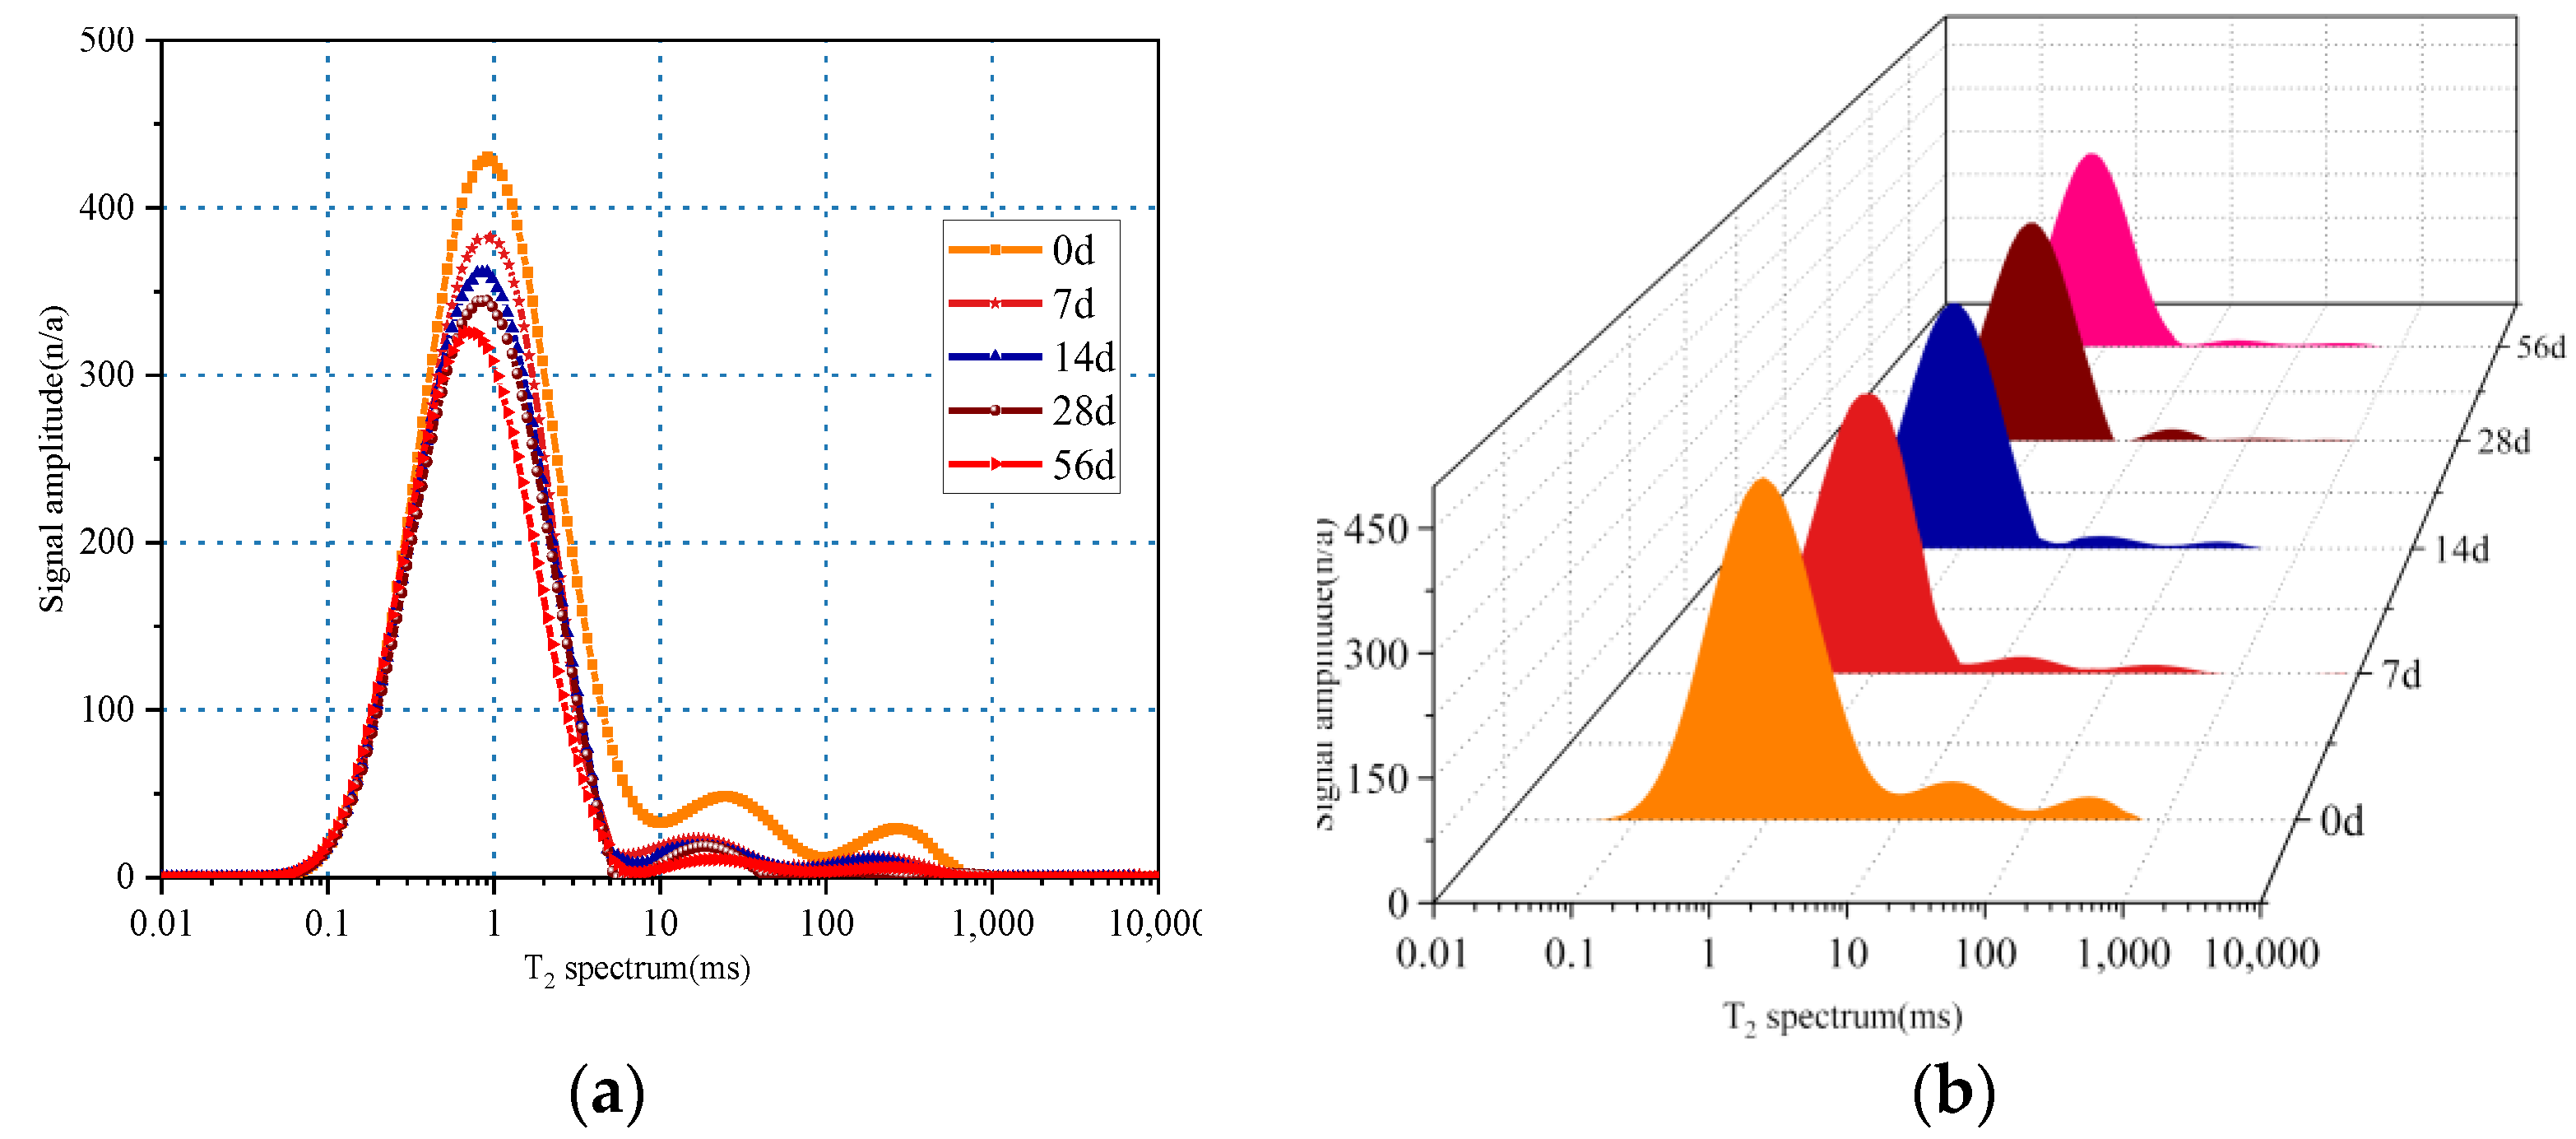
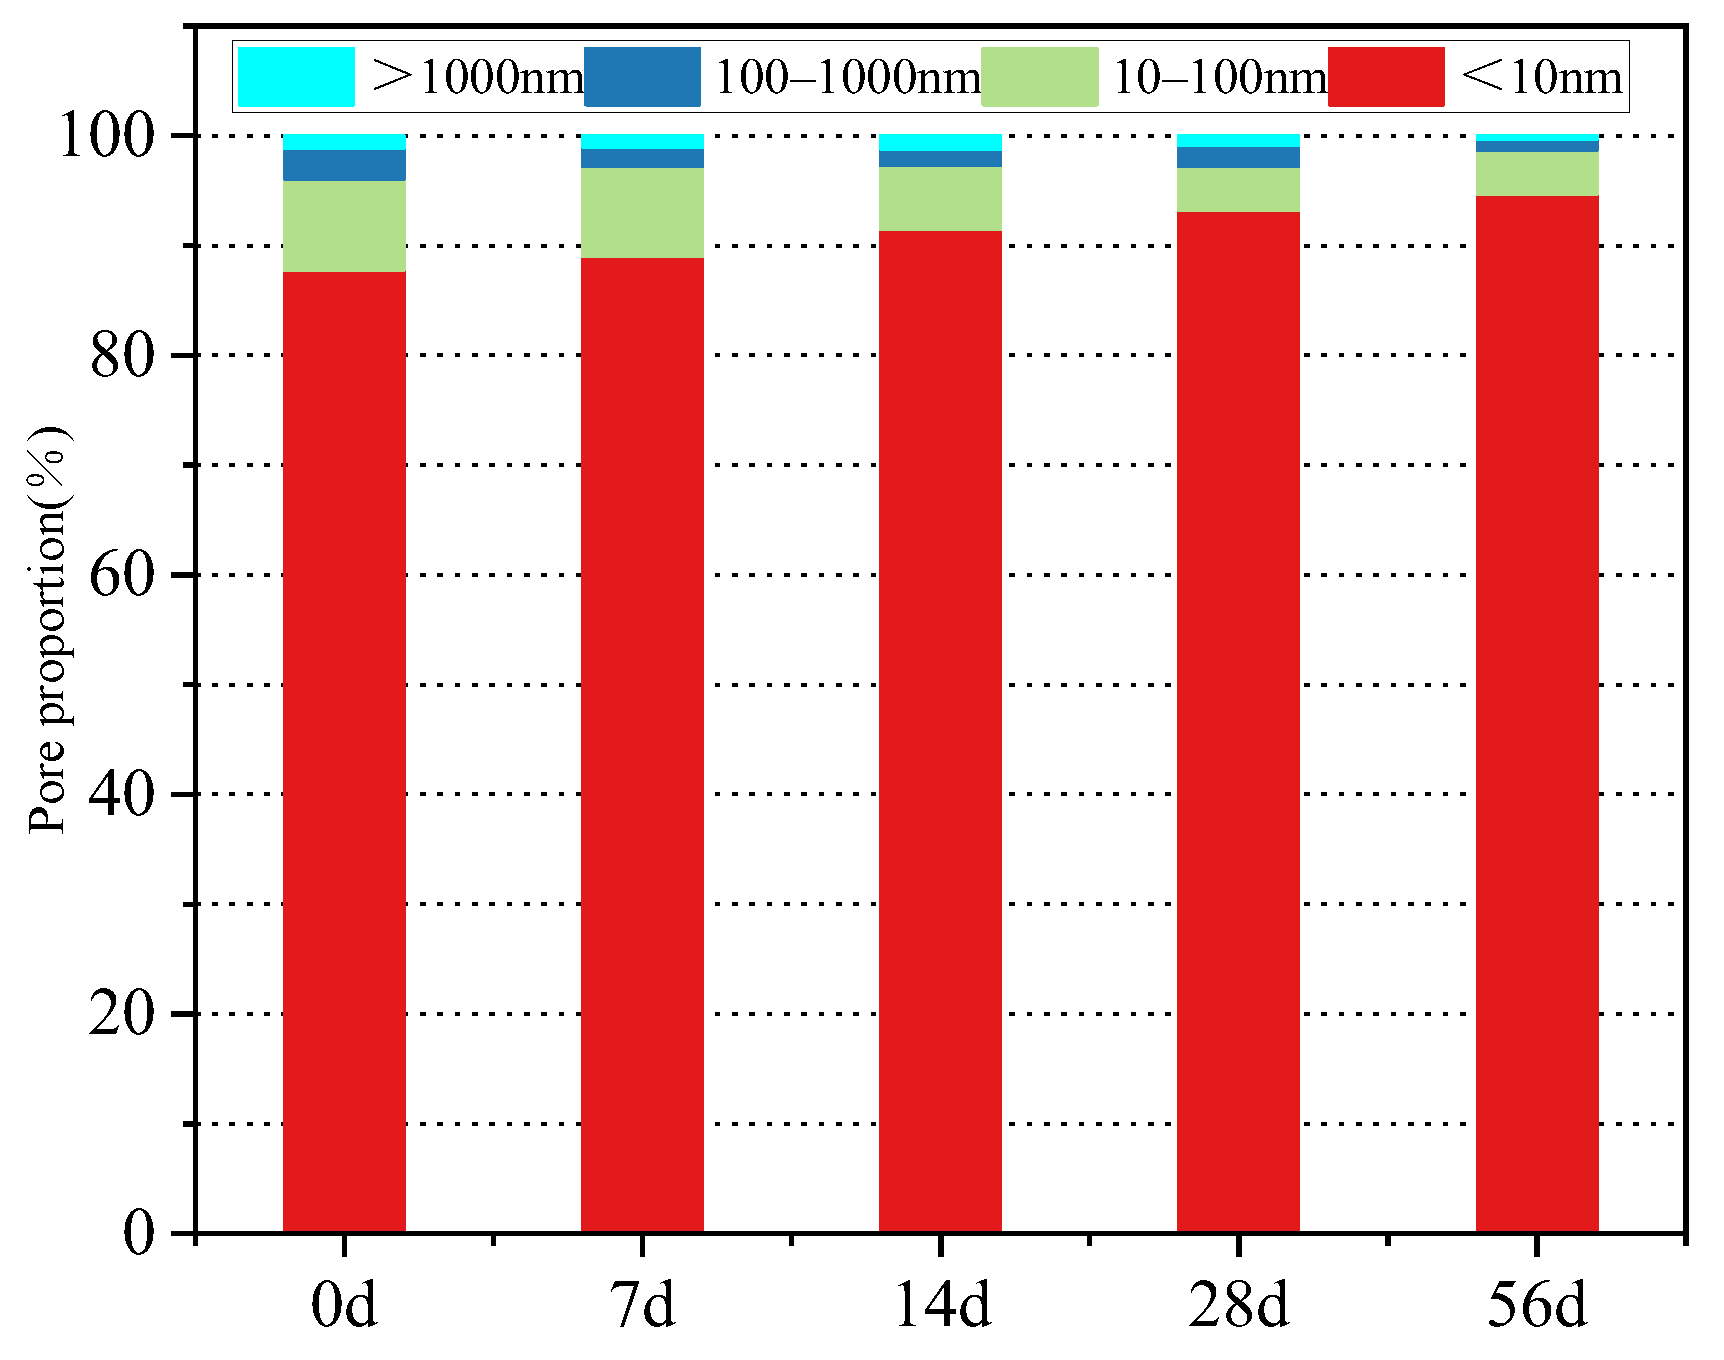
3.7.2. After Carbonation
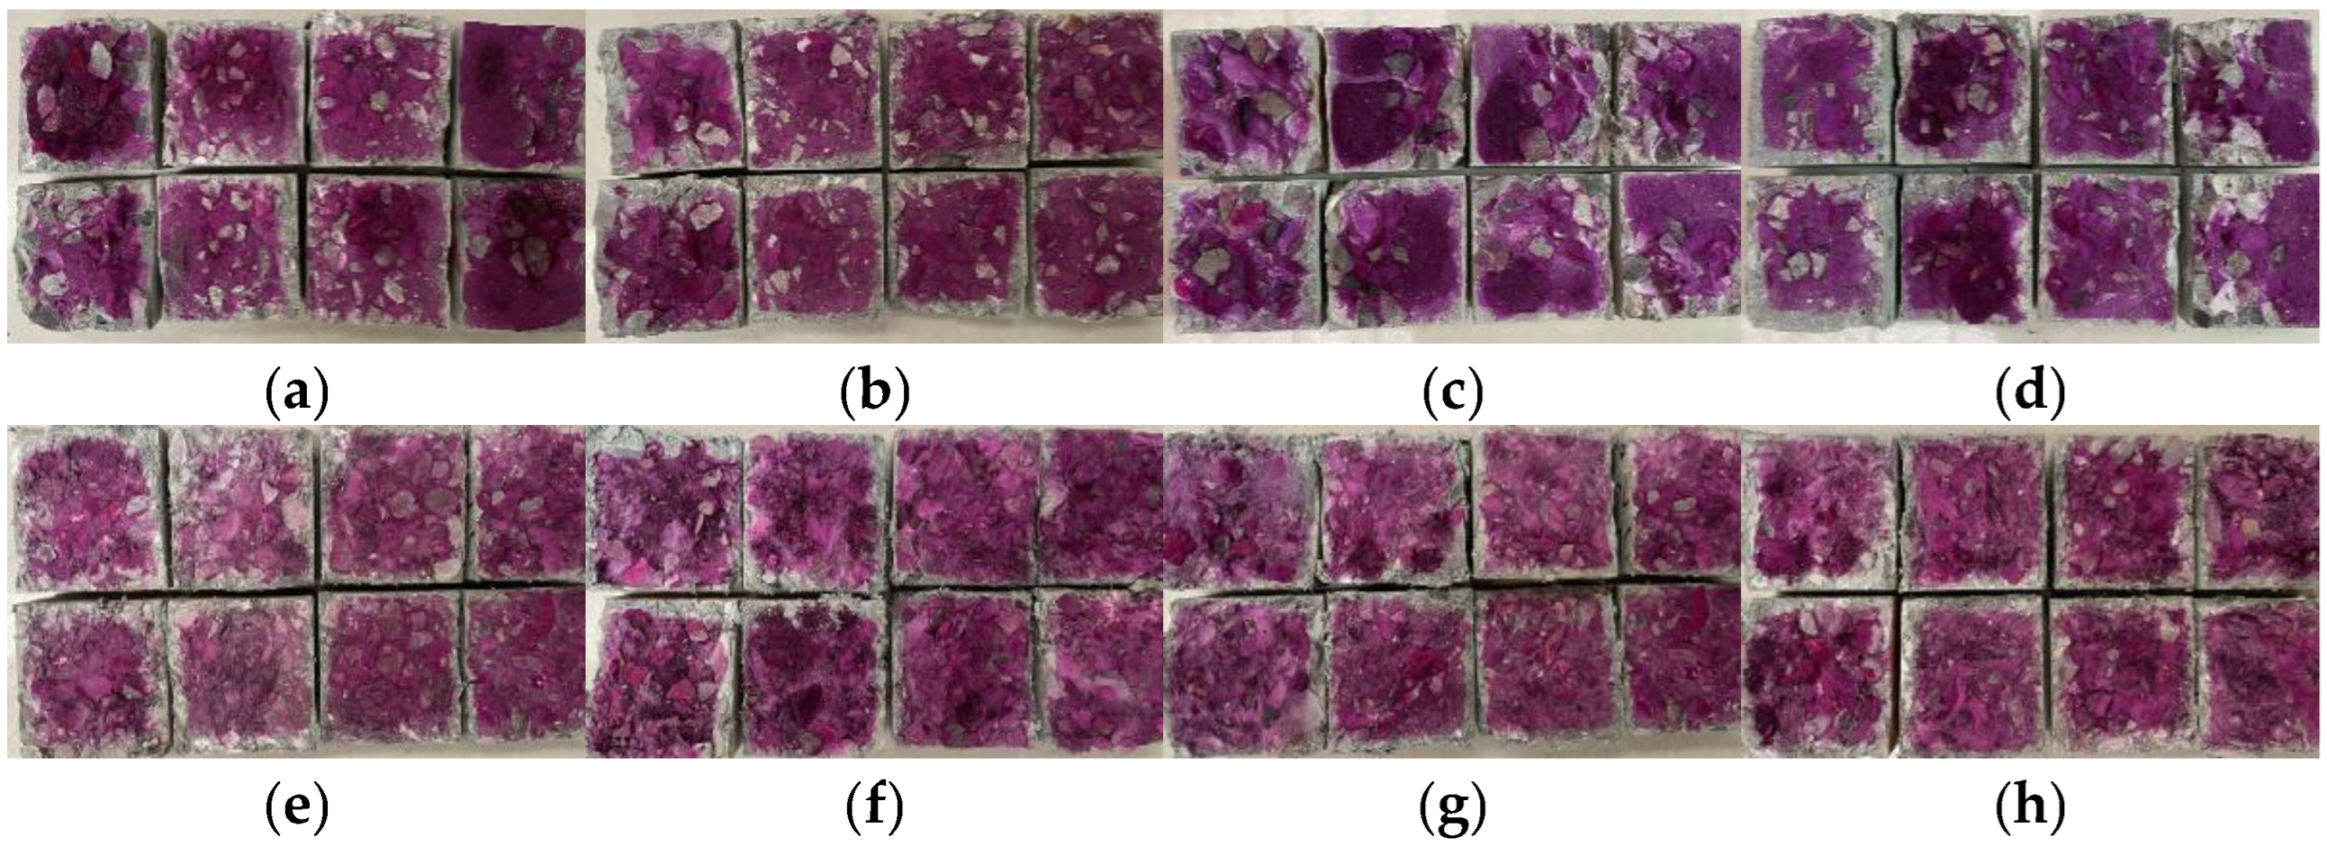
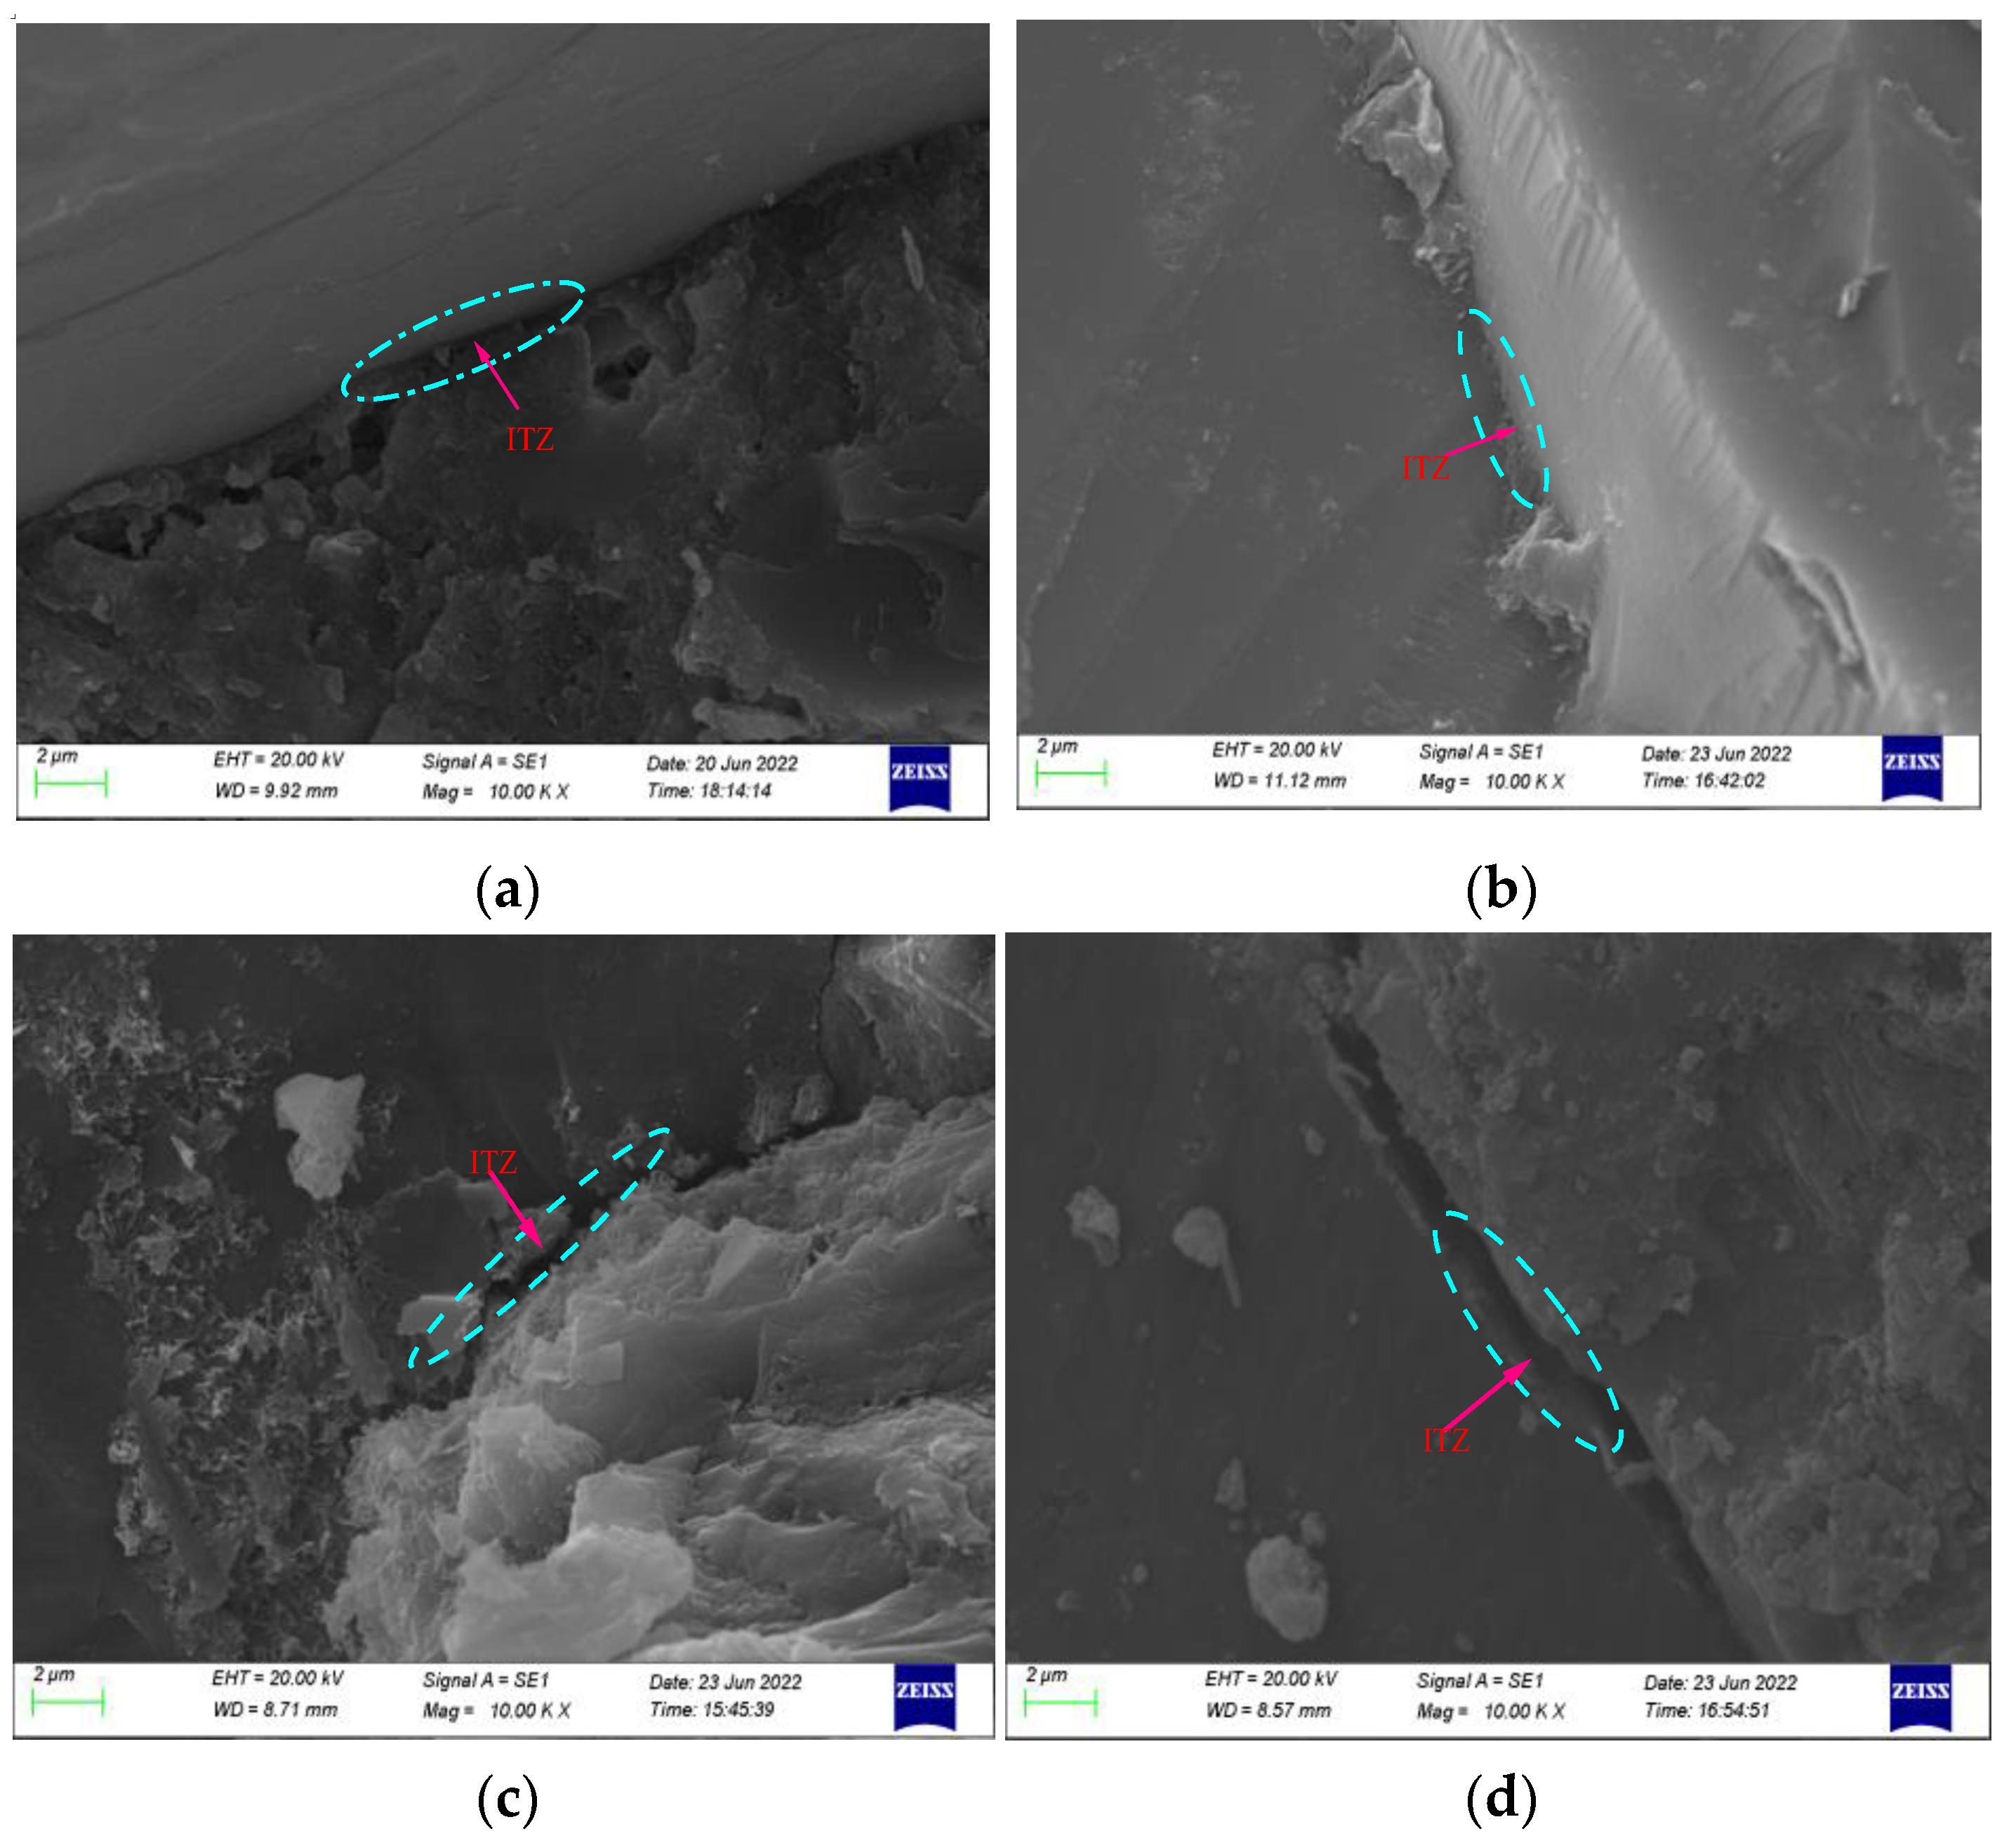
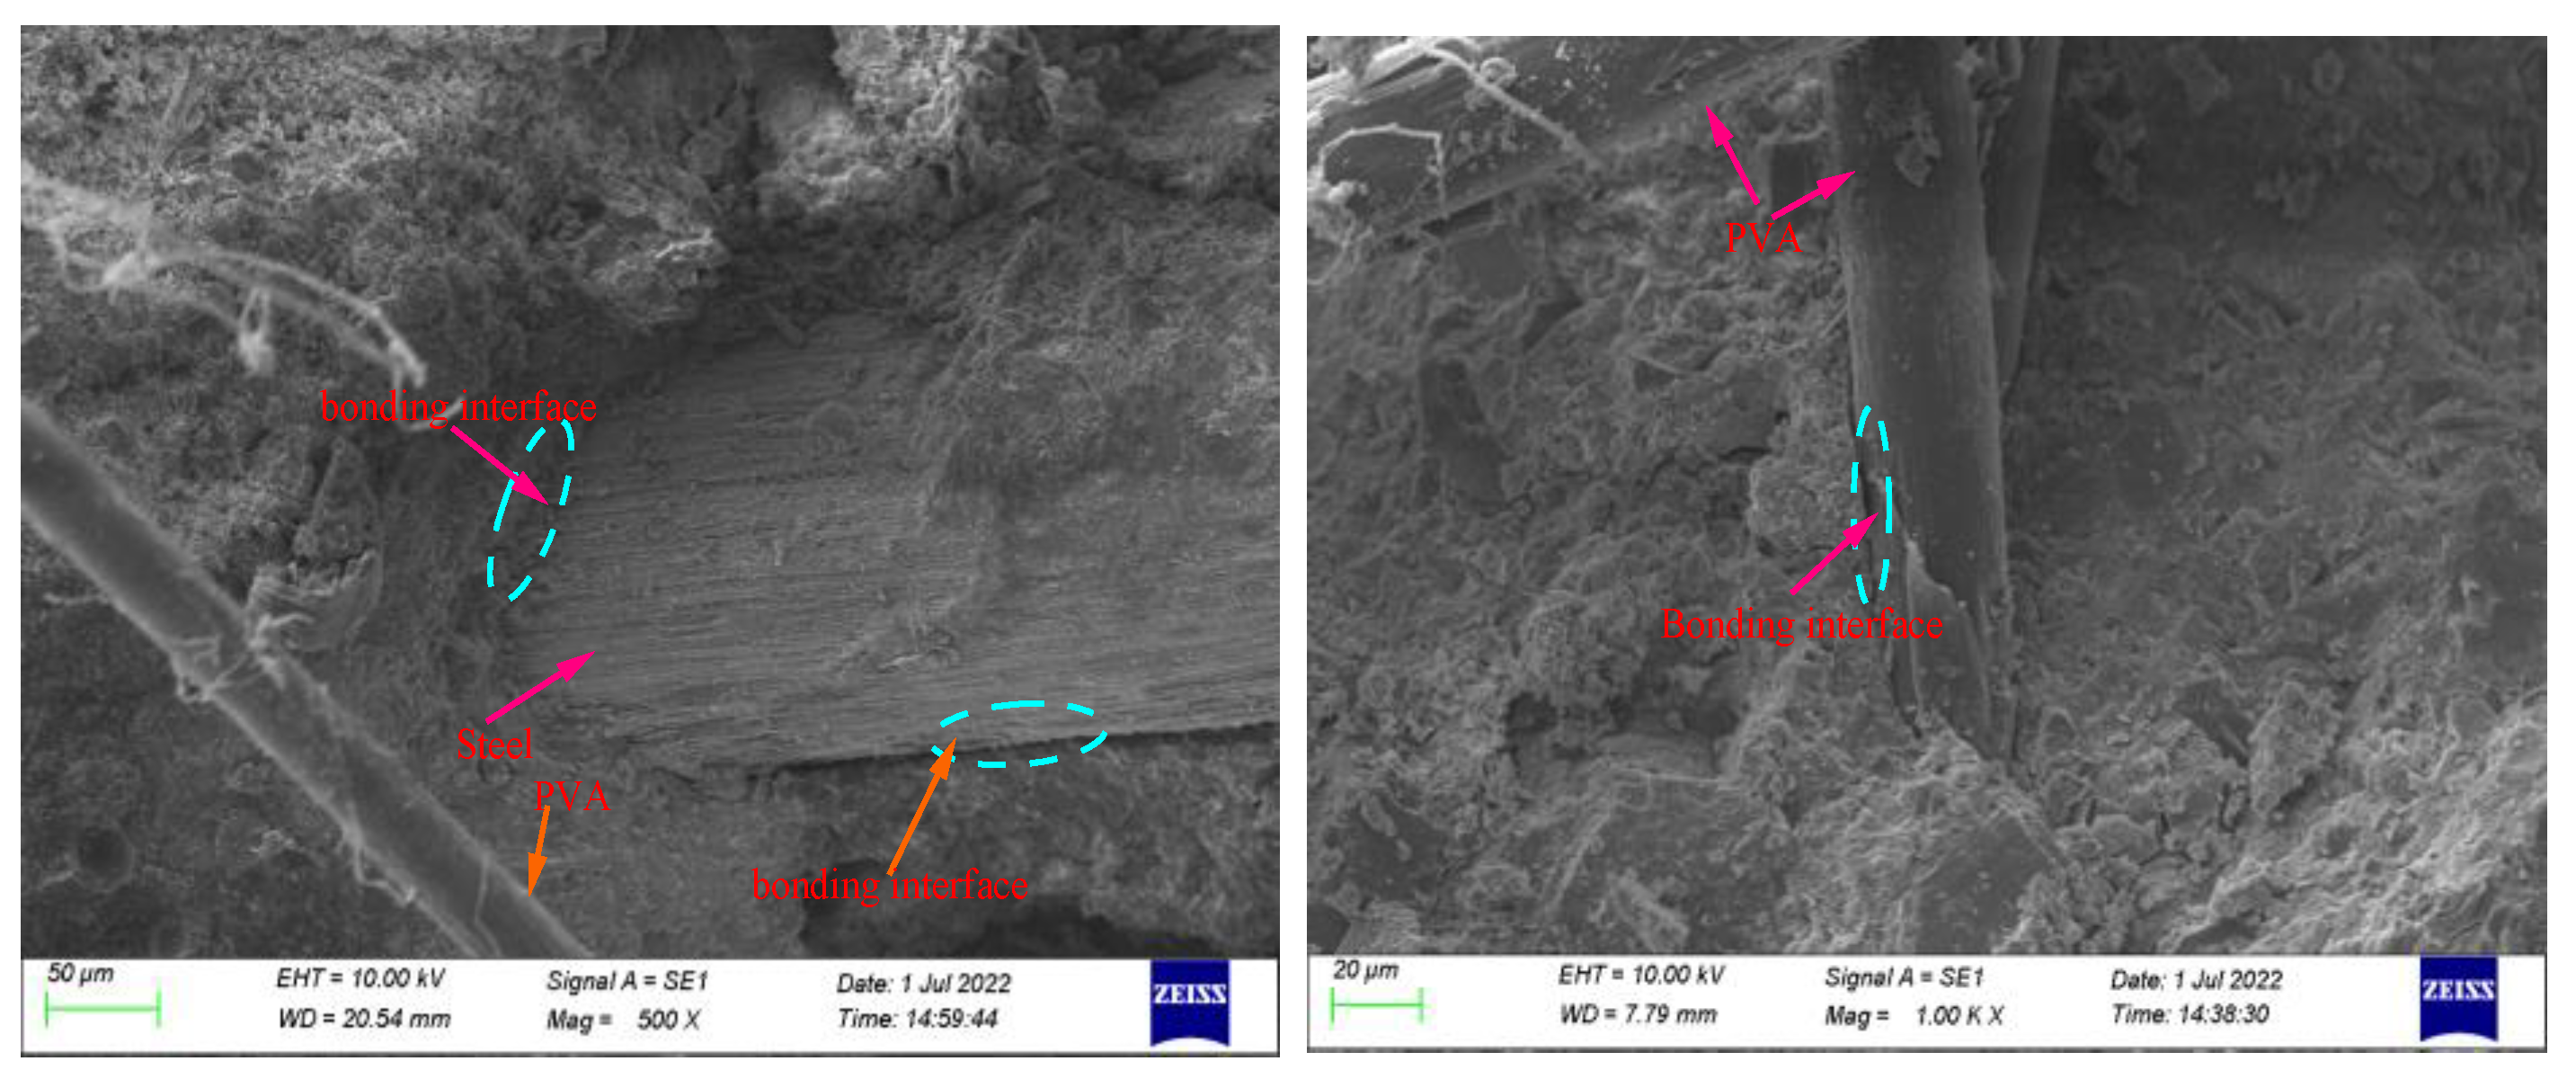
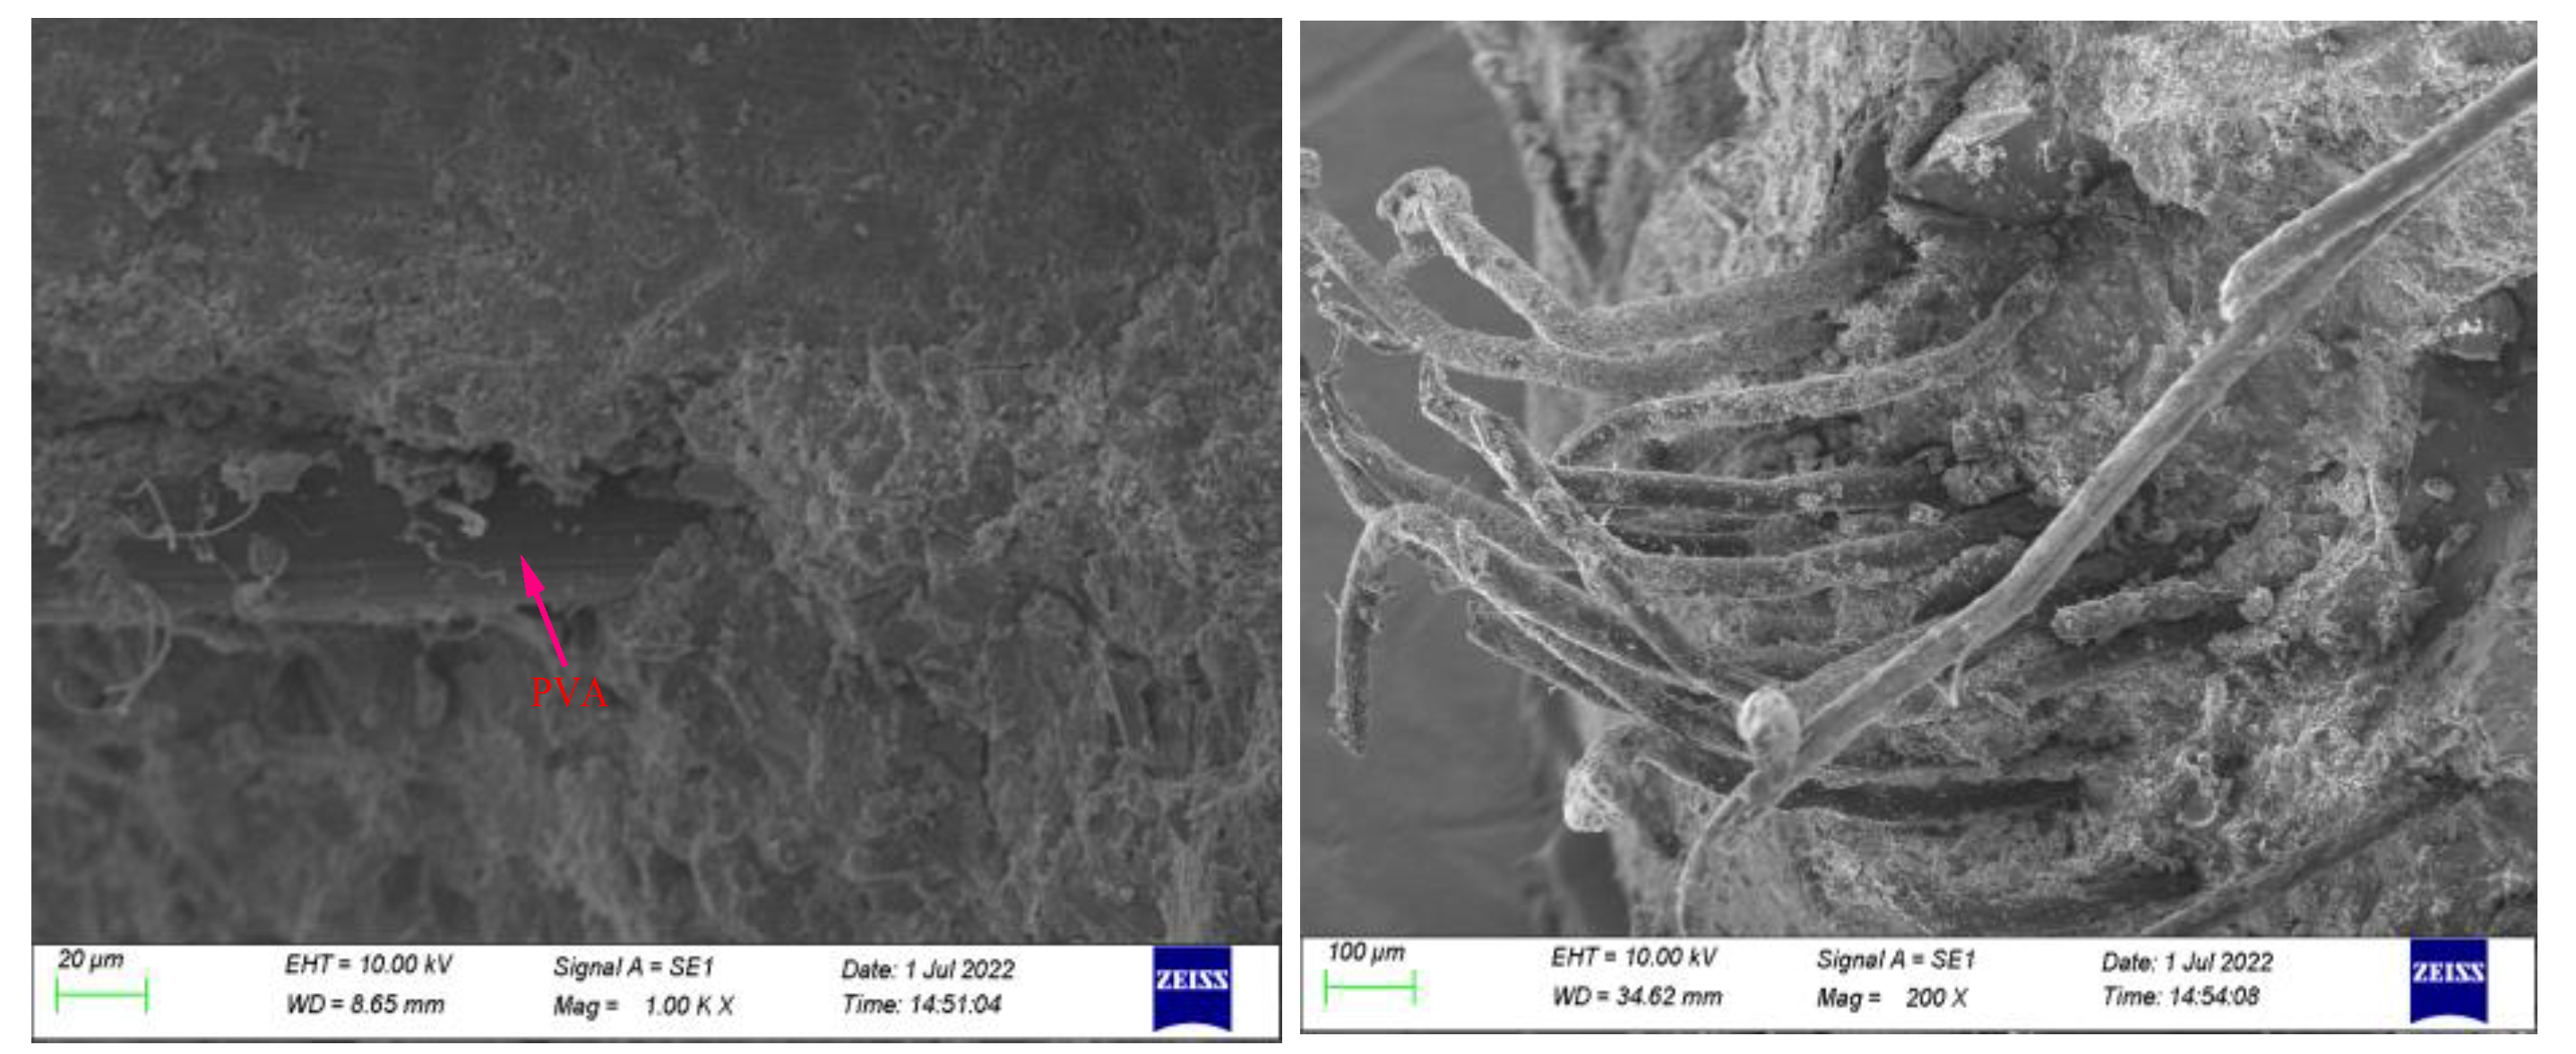
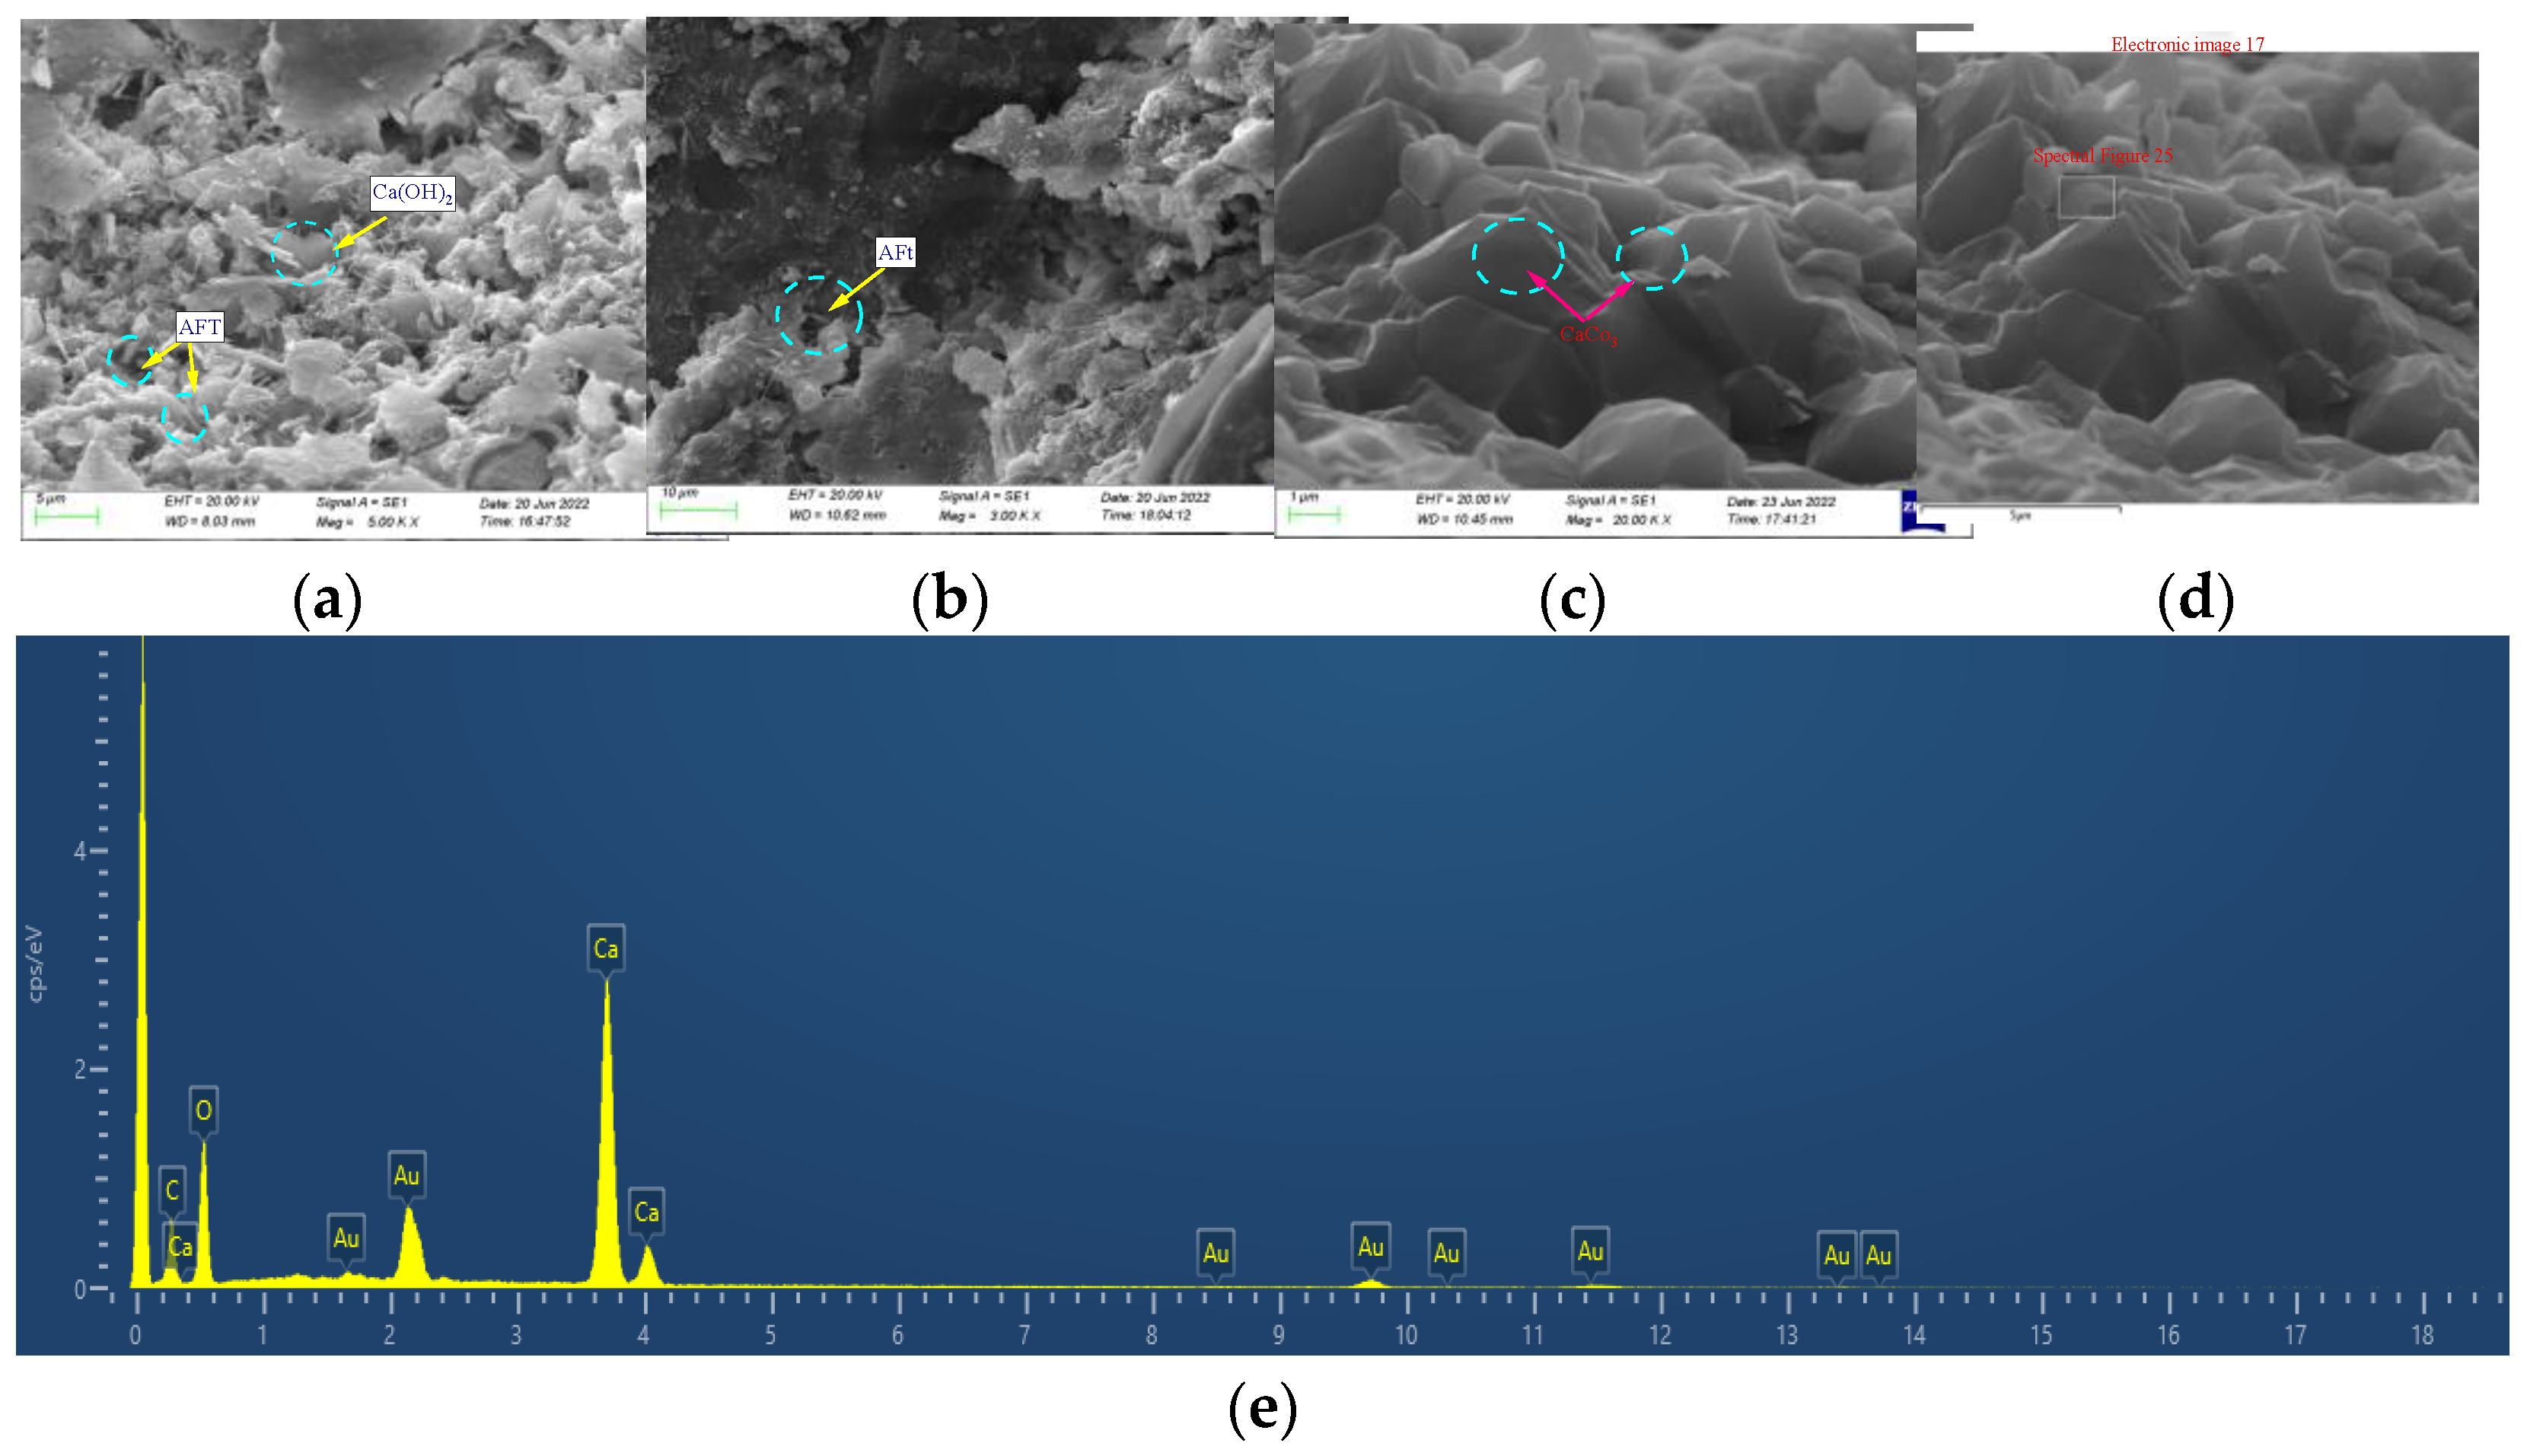
3.8. SEM Observations
4. Conclusions
- (1)
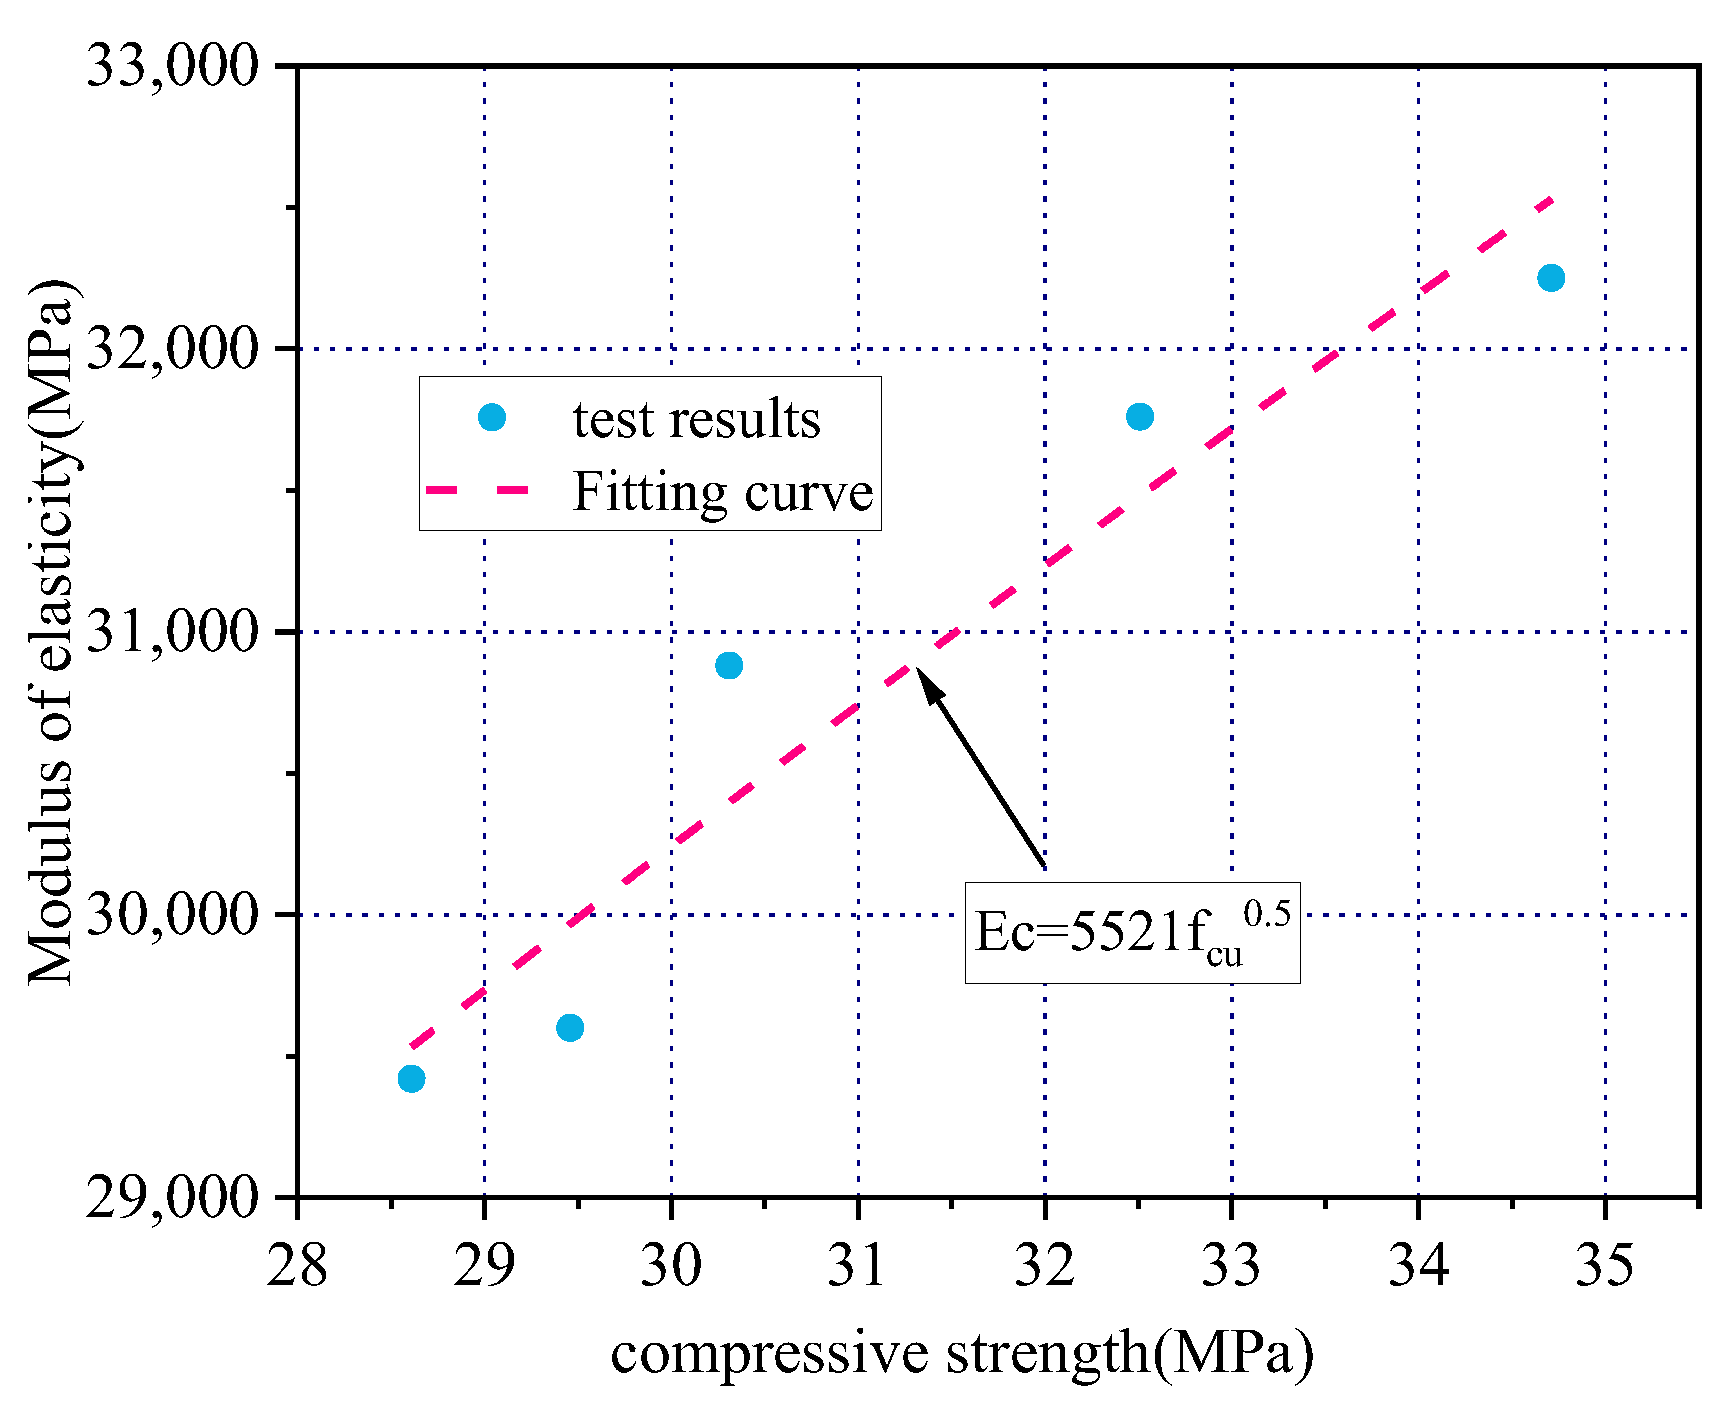
- After adding iron tailings to the concrete matrix, its compressive strength, splitting tensile strength, axial compressive strength, and elastic modulus increased. The compressive strength, splitting tensile strength, and axial compressive strength of the T30 iron tailings concrete were 7.6%, 17.7%, and 14.7% higher than those of ordinary concrete, respectively.
- (2)
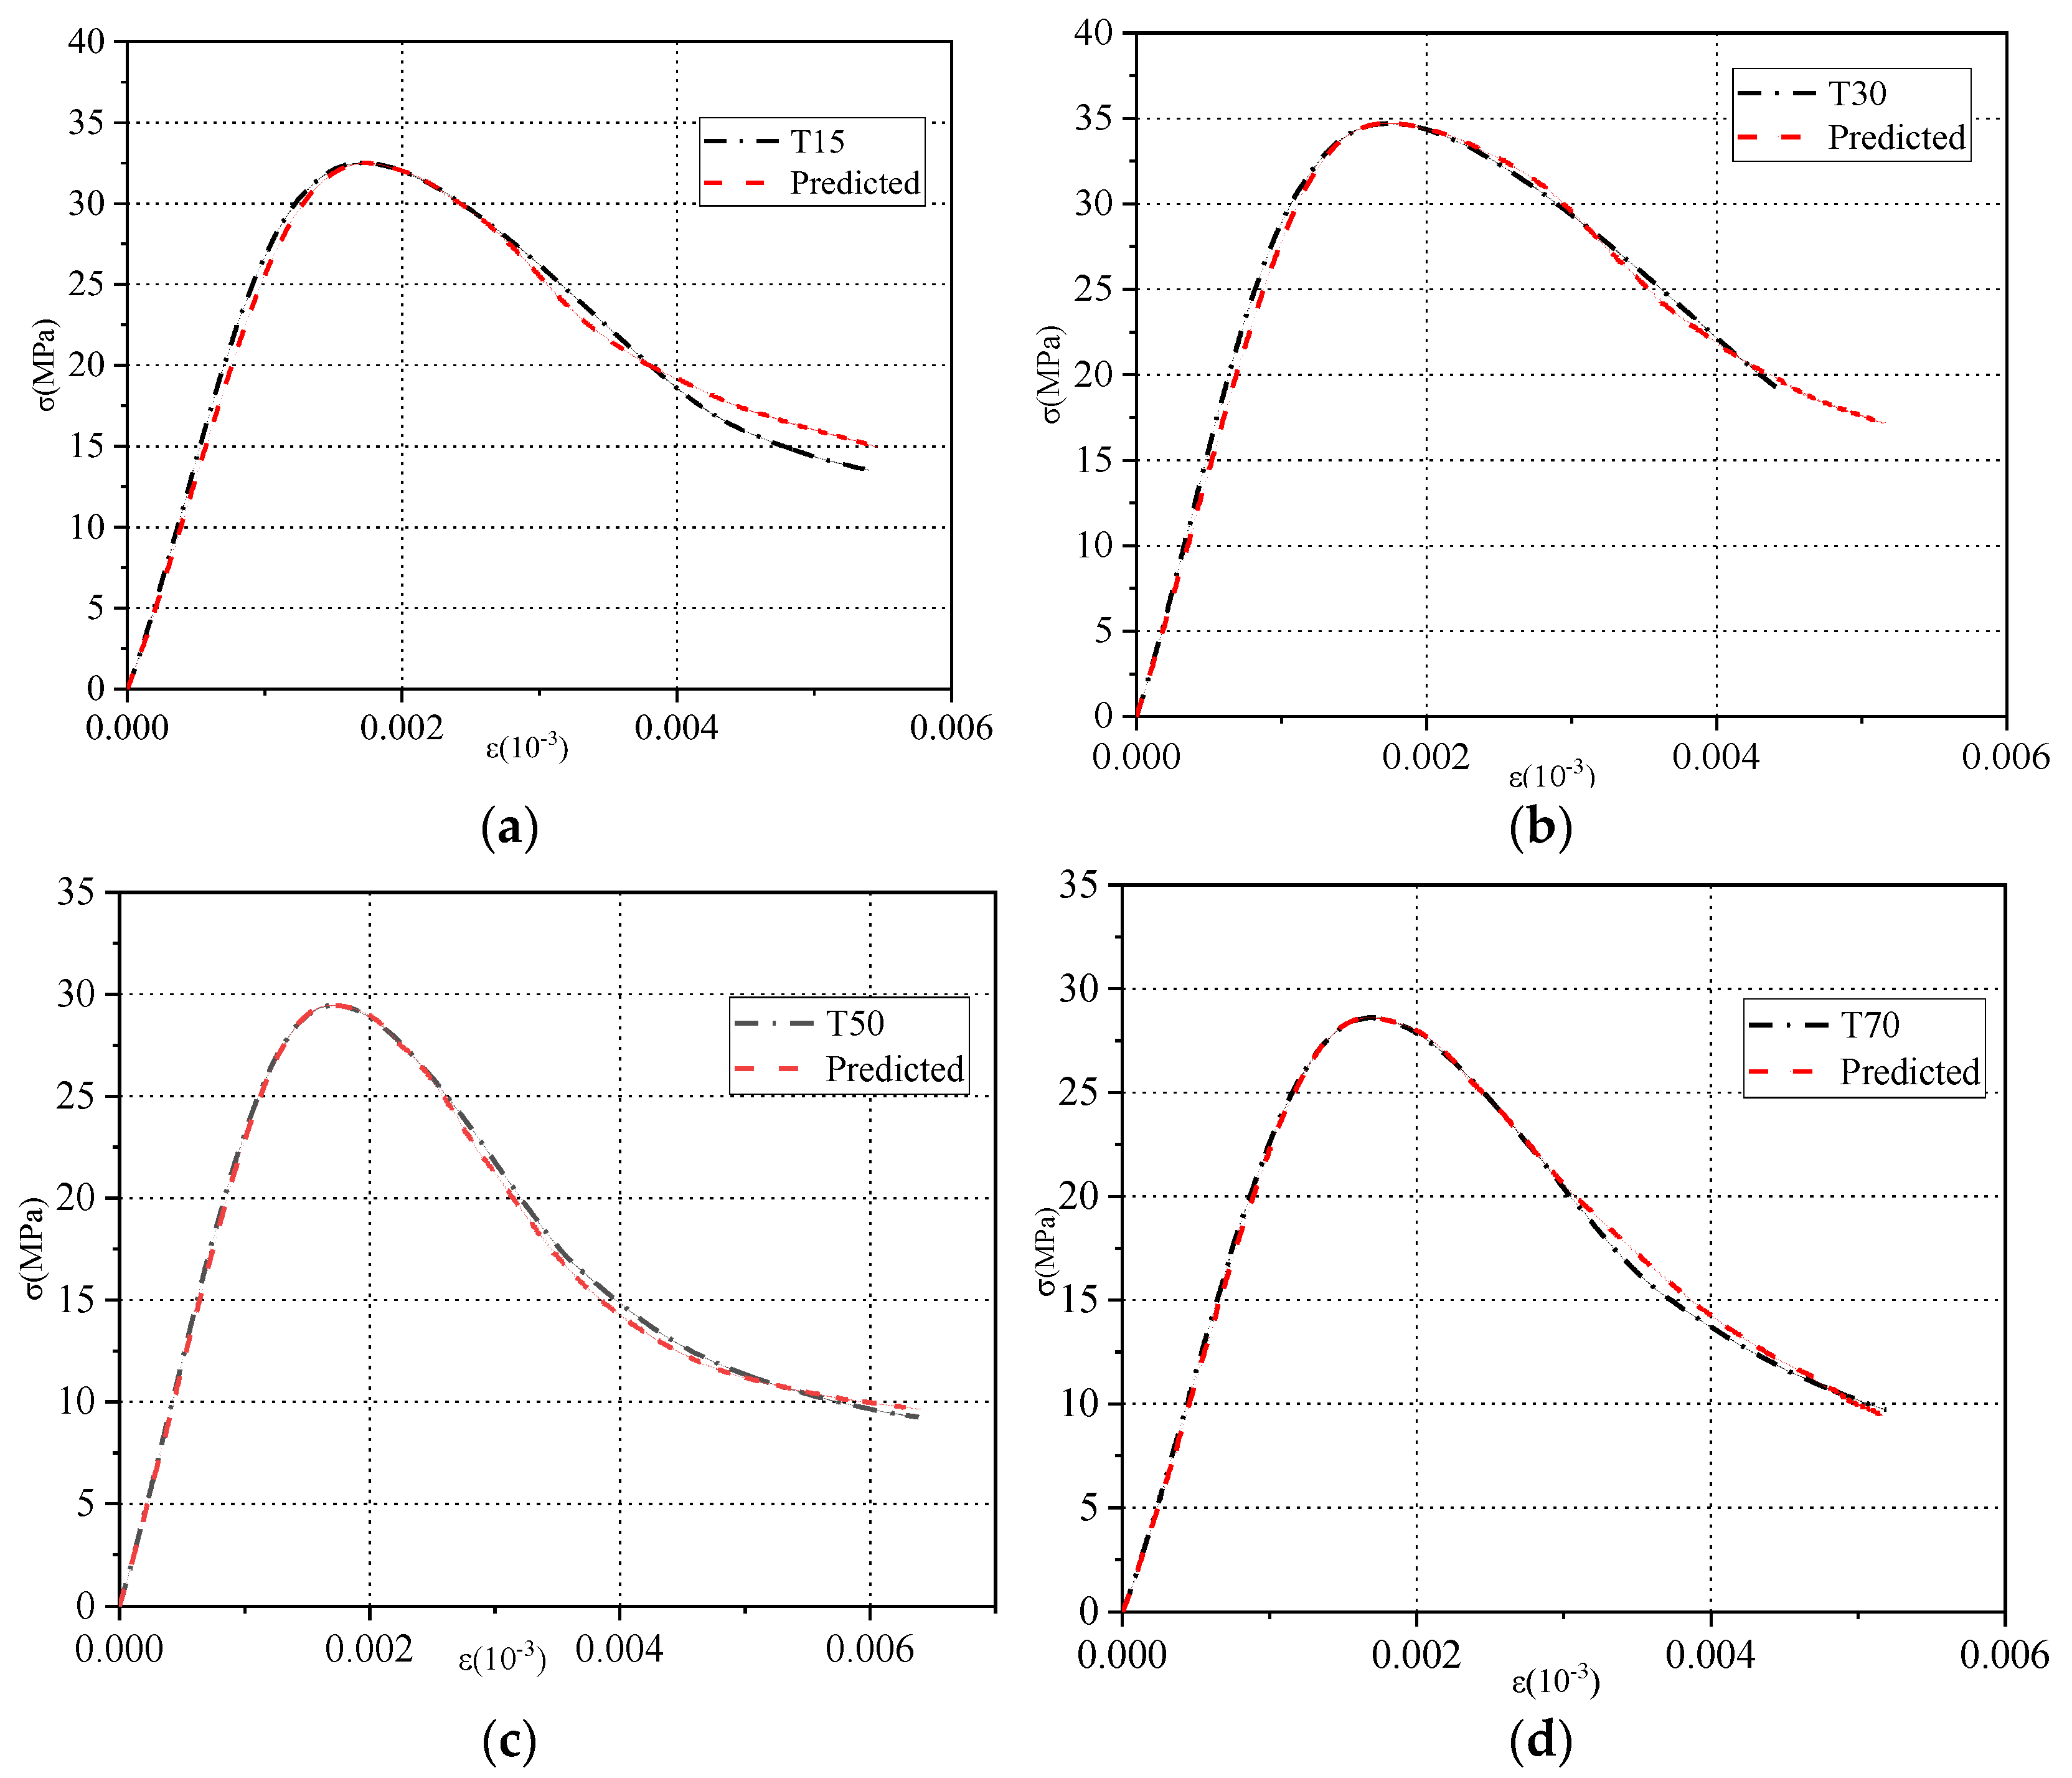
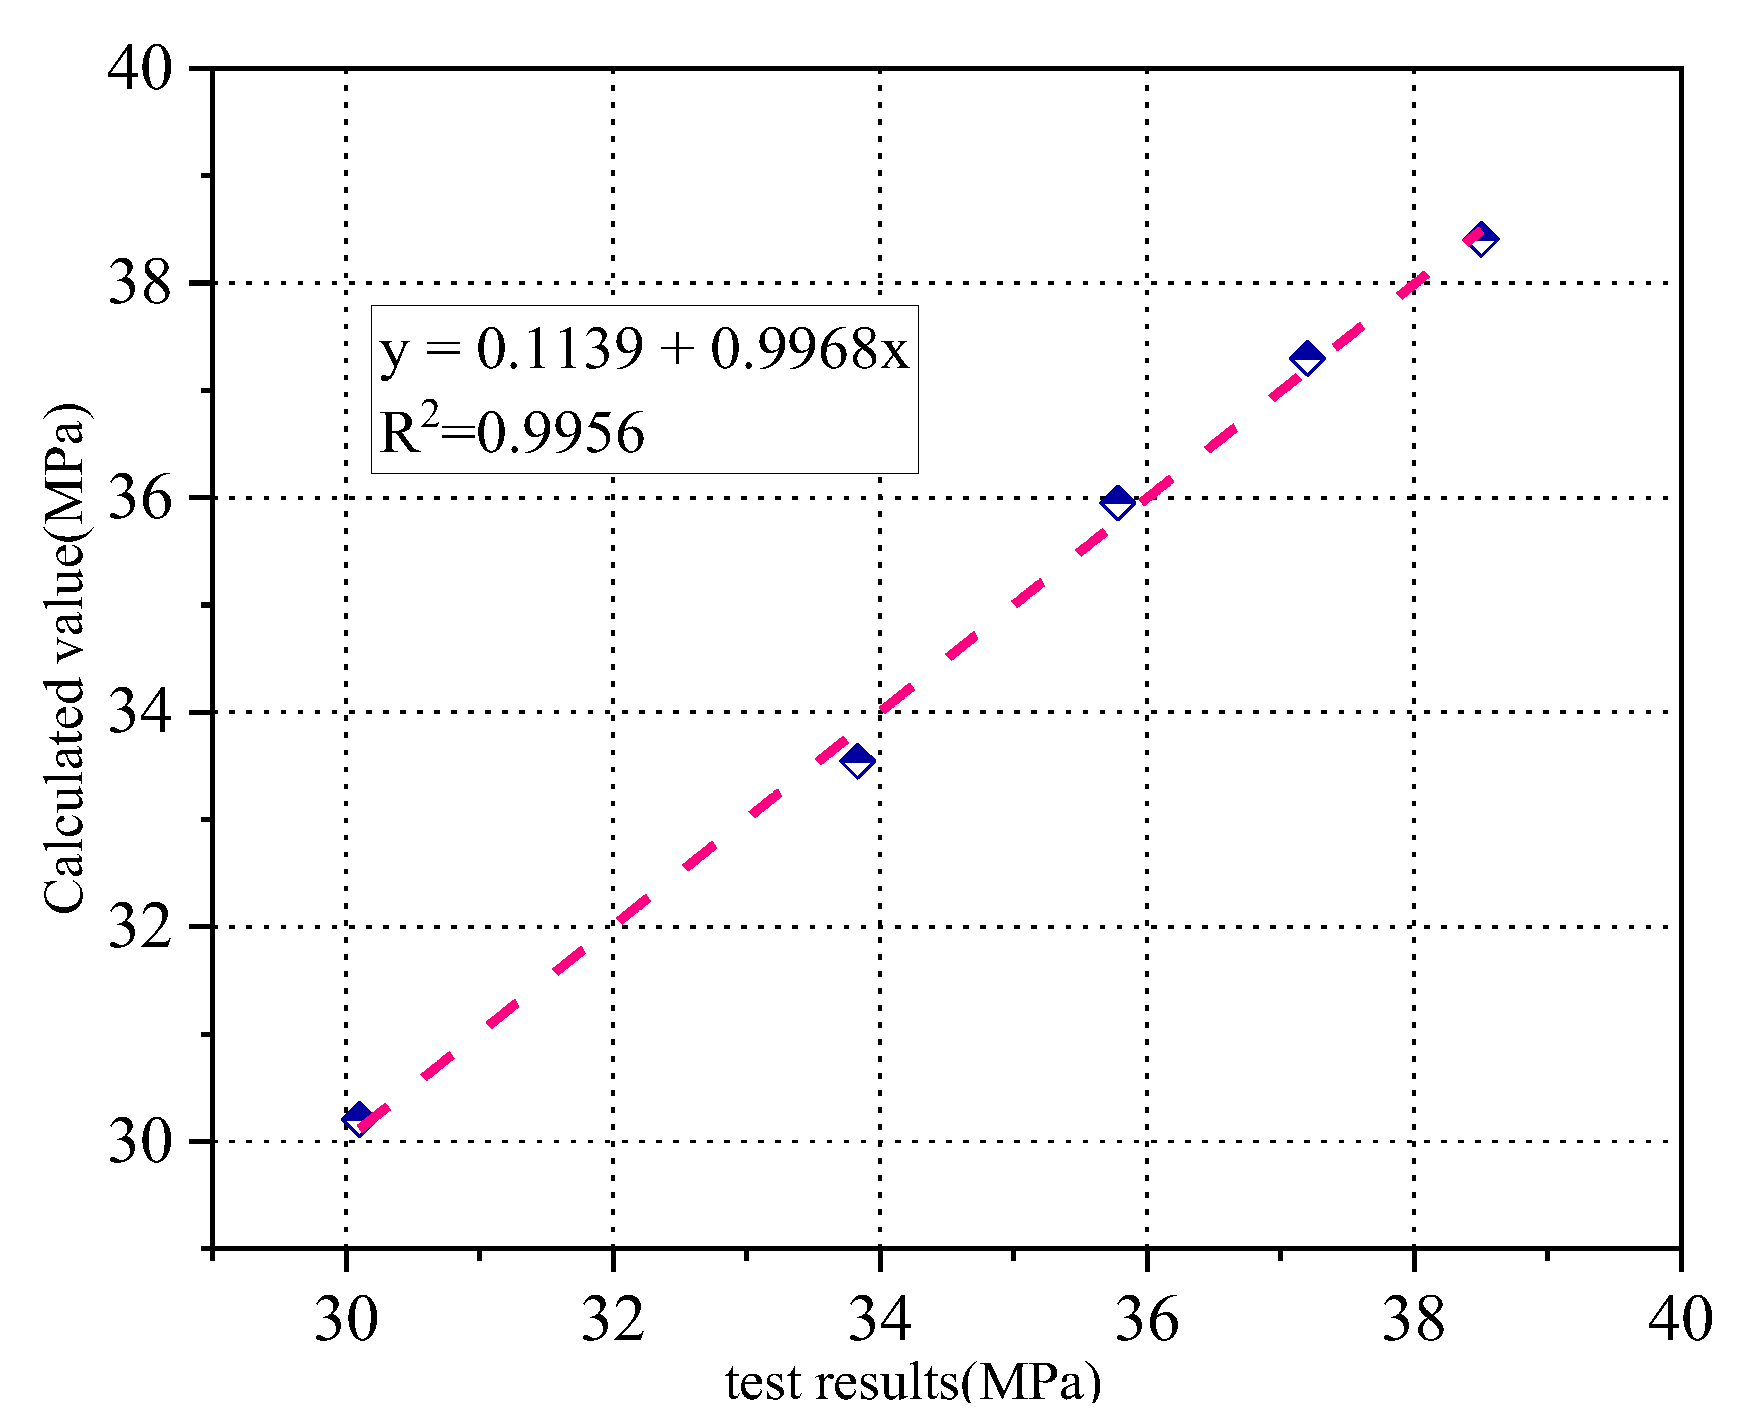
- The addition of fibers further improved the mechanical and carbonation properties of the iron tailings concrete, and the effect of the steel–PVA fiber mixture was stronger than that of the single-doped steel fibers. With an increase in the PVA fiber content, the mechanical properties of the concrete deteriorated, and its carbonation depth decreased. Based on the obtained test results, a mathematical expression was derived for the stress–strain curve of the iron tailings concrete under compression, and the calculated values were in good agreement with the experimental data.
- (3)
- With an increase in the carbonation age, the compressive strength, splitting tensile strength, and axial compressive strength of the concrete increased. From the results of the carbonation test and a carbonation depth prediction model previously developed for ordinary concrete, a carbonation depth prediction model for the fiber-reinforced iron tailings concrete was established.
- (4)
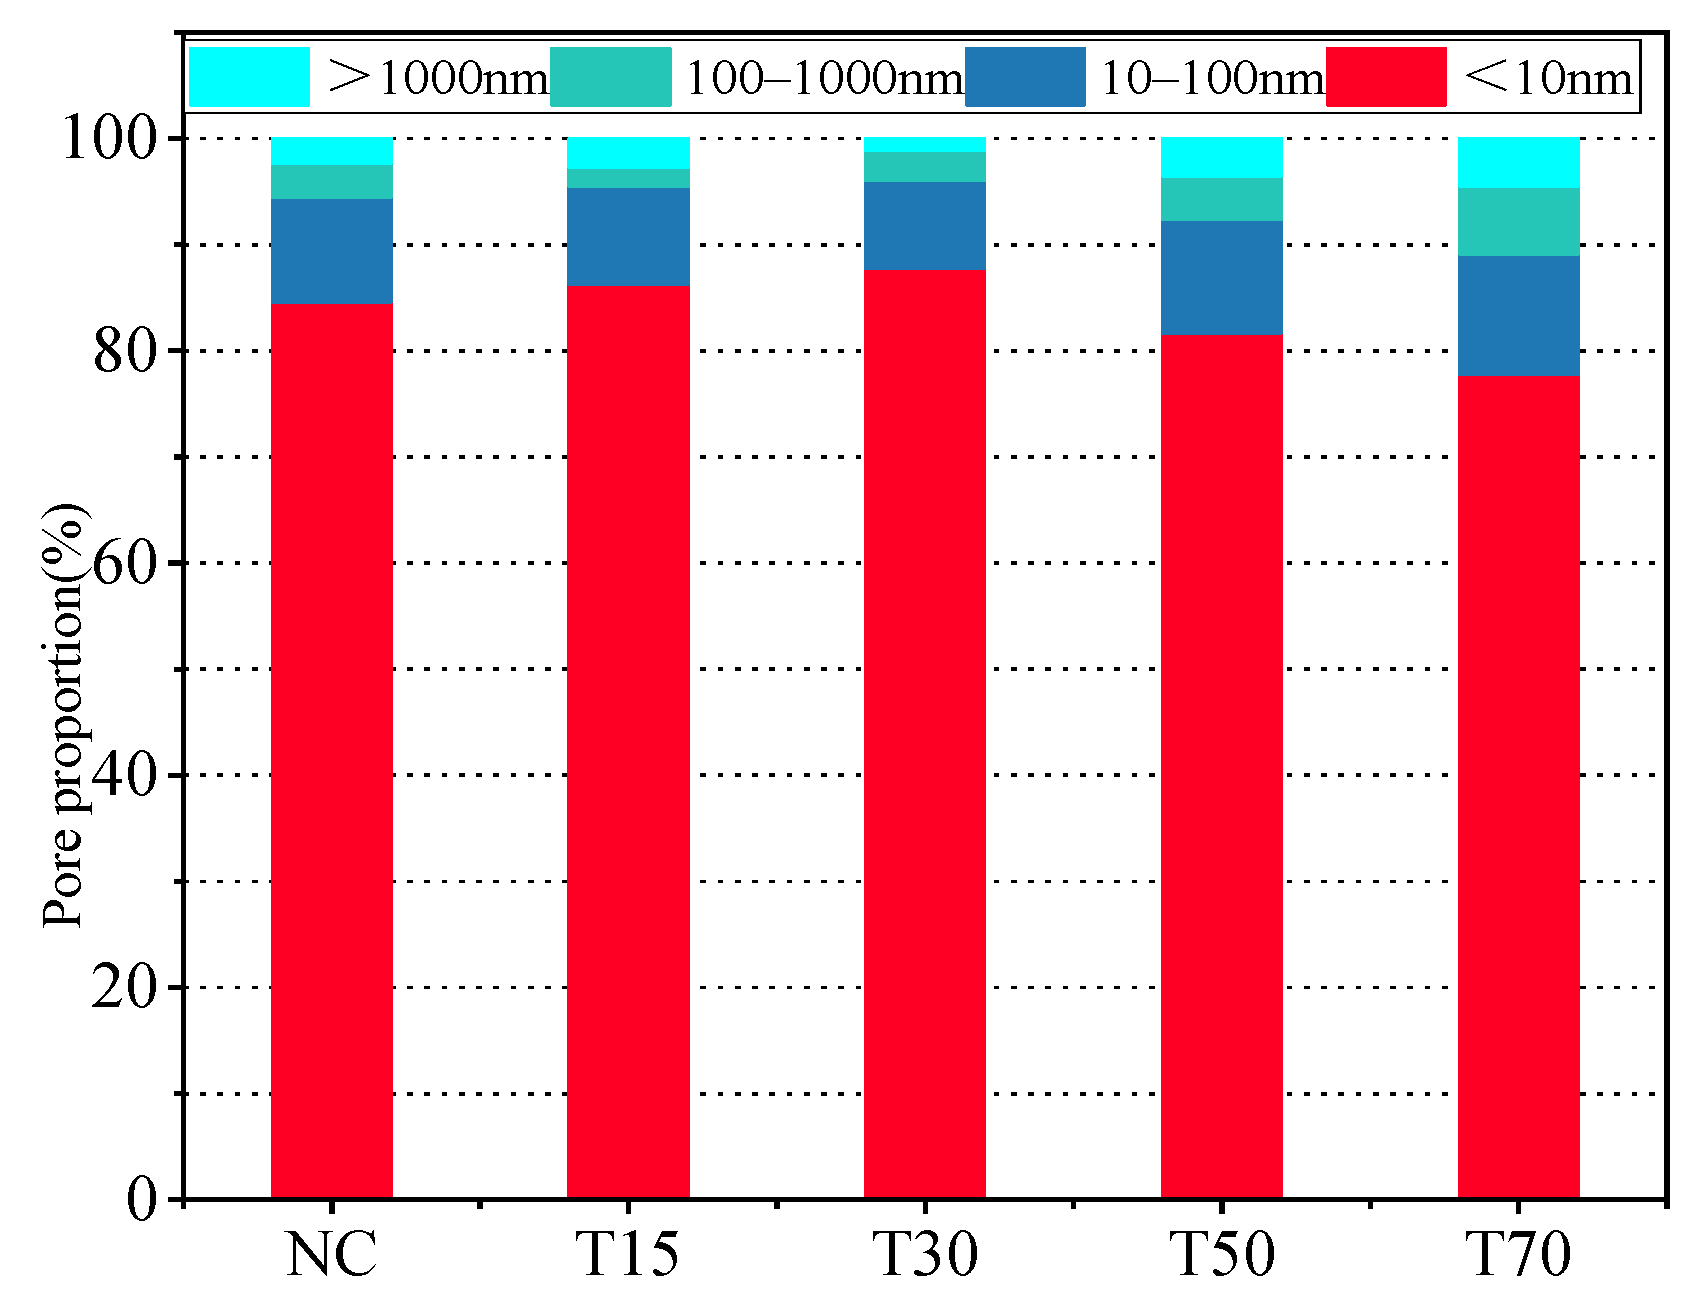
- The replacement rate of iron tailings produced a significant impact on the concrete pore structure. When the replacement rate of iron tailings was 30%, the smallest intensity of the main peak in the T2 NMR spectrum was obtained, and the T2 spectral area decreased by 8.9%. The lowest total concrete porosity was achieved at this replacement rate, and its value was negatively correlated with the compressive strength.
- (5)
- With an increase in the carbonation age, the porosity of various concrete specimens decreased by 7.6%, 10.9%, 13.4%, and 15.1%, and the pore size decreased as well. Considering the existing pore size–compressive strength model, a pore size–compressive strength model was established by conducting a regression analysis of the NMR data.
- (6)
- The main purpose of this experiment was to explore the influence of the iron tailings replacement rate and the fiber content on the mechanical properties and carbonation properties of concrete. The test focused on the material properties, and the components are still unclear. In addition, the microstructure of this experiment was only tested by nuclear magnetic resonance and scanning electron microscopy. More advanced and more accurate instruments should be used to comprehensively explore the microstructure of hybrid fiber iron tailings concrete from different levels and angles, such as energy spectrum tests, CT scan tests, thermal analysis tests, etc.
Author Contributions
Funding
Institutional Review Board Statement
Informed Consent Statement
Data Availability Statement
Conflicts of Interest
References
- Ministry of Natural Resources, PRC. China Mineral Resources; Geological Publishing House: Beijing, China, 2020. [Google Scholar]
- Zhao, J.S.; Ni, K.; Su, Y.P. An evaluation of iron ore tailings characteristics and iron ore tailings concrete properties. Constr. Build. Mater. 2021, 286, 122968. [Google Scholar] [CrossRef]
- Gayana, B.C.; Ram, C.K. Experimental and Statistical Evaluations of Strength Properties of Concrete with Iron Ore Tailings as Fine Aggregate. J. Hazard. Toxic Radioact. Waste 2019, 24, 04019038. [Google Scholar] [CrossRef]
- Yao, G.; Qiang, W.; Su, Y.W. Mechanical activation as an innovative approach for the preparation of pozzolan from iron ore tailings. Miner. Eng. 2020, 145, 10606. [Google Scholar] [CrossRef]
- Han, F.H.; Li, L.; Song, S.M. Early-age hydration characteristics of composite binder containing iron tailing powder. Powder Technol. 2017, 315, 322–331. [Google Scholar] [CrossRef]
- Shettima, A.U.; Hussin, M.W.; Ahmad, Y.; Mirza, J. Evaluation of iron ore tailings as replacement for fine aggregate in concrete. Constr. Build. Mater. 2016, 120, 72–79. [Google Scholar] [CrossRef]
- Francis, A.K.; Sanjay, K.S.; Daryoush, H. Utilisation of iron ore tailings as aggregates in concrete. Cogent Eng. 2015, 2, 1083137. [Google Scholar]
- Lv, X.D.; Lin, Y.Q.; Chen, X. Environmental impact, durability performance, and interfacial transition zone of iron ore tailings utilized as dam concrete aggregates. J. Clean. Prod. 2021, 292, 126068. [Google Scholar] [CrossRef]
- Cheng, Y.H.; Huang, F.; Qi, S.S. Durability of concrete incorporated with siliceous iron tailings. Constr. Build. Mater. 2020, 242, 118147. [Google Scholar] [CrossRef]
- Sun, L.Z.; Hao, Q.; Zhao, J.L. Stress strain behavior of hybrid steel-PVA fiber reinforced cementitious composites under uniaxial compression. Constr. Build. Mater. 2018, 188, 349–360. [Google Scholar] [CrossRef]
- Ding, Y.J. Experimental Study on Dynamic Properties of Steel-PVA Hybrid Fiber-Reinforced Cement Matrix Composites under Impact Compression; South China University of Technology: Guangzhou, China, 2014. [Google Scholar]
- Liu, F.Y.; Xu, K.; Ding, W.Q. Microstructural characteristics and their impact on mechanical properties of steel-PVA fiber reinforced concrete. Cem. Concr. Compos. 2021, 123, 104196. [Google Scholar] [CrossRef]
- Yu, J.; Chen, Y.X.; Christopher, K.Y.L. Mechanical performance of Strain-Hardening Cementitious Composites (SHCC) with hybrid polyvinyl alcohol and steel fibers. Compos. Struct. 2019, 226, 111198. [Google Scholar] [CrossRef]
- Liu, F.Y.; Ding, W.Q.; Qiao, Y.F. Experimental investigation on the tensile behavior of hybrid steel-PVA fiber reinforced concrete containing fly ash and slag powder. Constr. Build. Mater. 2020, 241, 118000. [Google Scholar] [CrossRef]
- Li, Y.; Su, Y.Q.; Tan, K.H. Pore structure and splitting tensile strength of hybrid Basalt–Polypropylene fiber reinforced concrete subjected to carbonation. Constr. Build. Mater. 2021, 297, 123779. [Google Scholar] [CrossRef]
- Kong, L.J.; Han, M.D.; Yang, X.C. Evaluation on relationship between accelerated carbonation and deterioration of concrete subjected to a high-concentrated sewage environment. Constr. Build. Mater. 2020, 237, 117650. [Google Scholar] [CrossRef]
- Vivian, W.T.; Anthony, B.; Khoa, N.L. Mechanical properties of CO2 concrete utilising practical carbonation variables. J. Clean. Prod. 2021, 294, 126307. [Google Scholar]
- ACI Committee 544 R-. Guide for Specifying, Proportioning, and Production of Fibre Reinforced Concrete; American Concrete Institute: Farmington Hills, MI, USA, 2008. [Google Scholar]
- Wafa, F.F.; Ashour, S.A. Mechanical properties of high-strength fiber reinforced concrete. ACI Mater. J. 1992, 89, 449–455. [Google Scholar]
- Hsu, L.S.; Hsu, C.T. Stress-strain behavior of steel-fiber high-strength concrete under compression. ACI Struct. J. 1994, 91, 448–457. [Google Scholar]
- JGJ55-2011; Specification for Mix Proportion Design of Ordinary Concrete. China Construction Industry Press: Beijing, China, 2011.
- GB/T50081-2019; Standard for Test Methods of Concrete Physical and Mechanical Properties. China Architecture and Building Press: Beijing, China, 2019.
- CESC13-2009; Test Method Standard for Fiber-Reinforced Concrete. China Planning Press: Beijing, China, 2009.
- Gou, M.; Zhou, L.; Then, N.W.Y. Utilization of tailings in cement and concrete: A review. Sci. Eng. Compos. Mater. 2019, 26, 449–464. [Google Scholar] [CrossRef]
- Zhao, S.; Fan, J.; Sun, W. Utilization of iron ore tailings as fine aggregate in ultra-high performance concrete. Constr. Build. Mater. 2014, 50, 540–548. [Google Scholar] [CrossRef]
- Zhong, X.T.; Zeng, H.Z.; Chun, Q.D. Experimental Study on the Properties of Concrete Mixed with Iron Ore Tailings. Adv. Mater. Sci. Eng. 2016, 2016, 8606505. [Google Scholar]
- Wang, Y.; Hughes, P.; Niu, H. A new method to improve the properties of recycled aggregate concrete: Composite addition of basalt fiber and nano-silica. J. Clean. Prod. 2019, 236, 117602. [Google Scholar] [CrossRef]
- Sunil, B.M.; Manjunatha, L.S.; Ravi, L. Potential use of mine tailings and fly ash in concrete. Adv. Concr. Construct. 2015, 3, 55–69. [Google Scholar] [CrossRef]
- Qu, L.H. Experimental Study of the Mechanical Properties of Tailings Steel Fiber Reinforced Concrete; Shenyang University of Technology: Shenyang, China, 2014. [Google Scholar]
- Zheng, H. Experimental Study on Mechanical Properties of Steel-PVA Fiber Reinforced Concrete; Hubei University of Technology: Wuhan, China, 2020. [Google Scholar]
- Gao, S.; Cui, X.W.; Kang, S.B. Sustainable applications for utilizing molybdenum tailings in concrete. J. Clean. Prod. 2020, 266, 122020. [Google Scholar] [CrossRef]
- Quan, X.Y.; Wang, S.L.; Liu, K.N. Influence of molybdenum tailings by-products as fine aggregates on mechanical properties and microstructure of concrete. J. Build. Eng. 2022, 54, 104677. [Google Scholar] [CrossRef]
- Kang, H.Z.; Zhang, K.; Ma, W.H. Experimental study on full stress–strain curve of iron tailings concrete under axial compression. J. Build. Struct. 2015, S2, 6. [Google Scholar] [CrossRef]
- Guo, Z.H. Strength and Constitutive Relationship of Concrete—Principle and Application; China Architecture and Building Press: Beijing, China, 2004; pp. 78–82. [Google Scholar]
- Cheng, Y.H.; Huang, F.; Qi, S.S. High silicon iron tailings on concrete carbonation and sulfate resistance. J. Northeast. Univ. (Nat. Sci.) 2019, 40, 1. [Google Scholar] [CrossRef]
- Cheng, Y.H.; Huang, F.; Li, W.C. Test research on the effects of mechanochemically activated iron tailings on the compressive strength of concrete. Constr. Build. Mater. 2016, 118, 164–170. [Google Scholar] [CrossRef]
- Luo, Z.B. Study on Effect of PVA Fiber Modification on Carbonation Resistance of Concrete; Huazhong University of Science and Technology: Wuhan, China, 2016. [Google Scholar]
- Xiao, K.T.; Li, J.Z.; Yang, H.Q. Study of Crack Resistance Property of Polyvinyl Alcohol Fiber Reinforced Concrete. Adv. Mater. Res. 2011, 287, 178–182. [Google Scholar] [CrossRef]
- Guo, Y.H.; Pan, H.M.; Li, Z.Y. Study on carbonation properties of steel fiber reinforced concrete. Concrete 2007, 2, 3. [Google Scholar] [CrossRef]
- Liu, P.; Yu, Z.W.; Chen, Y. Carbonation depth model and carbonated acceleration rate of concrete under different environment. Cem. Concr. Compos. 2020, 114, 103736. [Google Scholar] [CrossRef]
- Liu, L.; He, Z.; Cai, X.H. Application of Low-Field NMR to the Pore Structure of Concrete. Appl. Magn. Reson. 2021, 52, 1–17. [Google Scholar] [CrossRef]
- Ma, B.G.; Cai, L.X.; Li, X.G. Utilization of iron tailings as substitute in autoclaved aerated concrete: Physico-mechanical and microstructure of hydration products. J. Clean. Prod. 2016, 127, 162–171. [Google Scholar] [CrossRef]
- Jiang, C.H.; Fan, K.; Wu, F. Experimental study on the mechanical properties and microstructure of chopped basalt fiber reinforced concrete. Mater. Des. 2014, 58, 187–193. [Google Scholar] [CrossRef]
- Li, H.; Chen, Y.D.; Li, T.D. Microstructure and bonding behavior of fiber-mortar interface in fiber-reinforced concrete. Constr. Build. Mater. 2020, 232, 117235. [Google Scholar]
- Cui, H.Z.; Tang, W.H.; Liu, W. Experimental study on effects of CO2 concentrations on concrete carbonation and diffusion mechanisms. Constr. Build. Mater. 2015, 93, 522–527. [Google Scholar] [CrossRef]
- Ramezanianpour, A.A.; Ghahari, S.A.; Esmaeili, M. Effect of combined carbonation and chloride ion ingress by an accelerated test method on microscopic and mechanical properties of concrete. Constr. Build. Mater. 2014, 58, 138–146. [Google Scholar] [CrossRef]


| Al2O3 | SiO2 | MgO | CaO | TiO2 | Fe2O3 | SO3 | Other | |
|---|---|---|---|---|---|---|---|---|
| cement | 42.5 | 55.7 | / | 0.4 | 0.9 | 0.3 | / | 0.2 |
| fly ash | 29.96 | 52.97 | 1.52 | 3.66 | / | 7.98 | 0.65 | 3.26 |
| Moisture | Water Demand Ratio | Loss on Ignition | Density (g/cm3) | Fineness (45 μm Square Hole Sieve Allowance) |
|---|---|---|---|---|
| 0.29 | 93 | 3.52 | 2.11 | 12 |
| Aggregate Type | Loose Packing (kg/m3) | Apparent Area (kg/m3) | Water Absorption (%) | Void Ratio (%) | Crush Indicator (%) | Mud Content (%) |
|---|---|---|---|---|---|---|
| Gravel | 1543 | 2769 | 0.63 | 40.10 | 10.30 | 0.59 |
| River sand | 1655 | 2689 | 0.5 | / | / | 3.1 |
| Iron tailings sand | 1824 | 2745 | 2.9 | 8.7 | / | 19.53 |
| Fiber Type | Diameter (mm) | Length (mm) | Density (g/cm3) | Aspect Ratio | Elastic Modulus (GPa) | Tensile Strength (MPa) |
|---|---|---|---|---|---|---|
| SF | 0.22 | 16 | 7.8 | 72.73 | 210 | 2500 |
| PVA | 0.024 | 12 | 0.97–0.98 | 500 | 160 | 3000 |
| Block Coding | Fly Ash | Cement | Stone | River Sand | Iron Tailings Sand | SF | PV | Water | Water Reducer |
|---|---|---|---|---|---|---|---|---|---|
| NC | 110 | 440 | 1103 | 656 | 0 | 0 | 0 | 220 | 2.2 |
| T15 | 110 | 440 | 1103 | 557.6 | 98.4 | 0 | 0 | 220 | 2.2 |
| T30 | 110 | 440 | 1103 | 459.2 | 196.8 | 0 | 0 | 220 | 2.2 |
| T50 | 110 | 440 | 1103 | 328 | 328 | 0 | 0 | 220 | 2.2 |
| T70 | 110 | 440 | 1103 | 459.2 | 196.8 | 0 | 0 | 220 | 2.2 |
| T30-S1.5 | 110 | 440 | 1103 | 459.2 | 196.8 | 117 | 0 | 220 | 2.2 |
| T30-S1.5P0.25 | 110 | 440 | 1103 | 459.2 | 196.8 | 117 | 2.45 | 220 | 2.2 |
| T30-S1.5P0.5 | 110 | 440 | 1103 | 459.2 | 196.8 | 117 | 4.9 | 220 | 2.2 |
| T30-S1.5P0.75 | 110 | 440 | 1103 | 459.2 | 196.8 | 117 | 7.35 | 220 | 2.2 |
| Block Coding | Compressive Strength at Different Carbonization Ages | Ec (MPa) | σp (10−3) | ||||
|---|---|---|---|---|---|---|---|
| fcu | 7d | 14d | 28d | 56d | |||
| NC | 30.31 | 32.19 | 34.77 | 35.16 | 36.54 | 30,880 | 1.7 |
| T15 | 32.51 | 34.46 | 36 | 37.15 | 37.65 | 31,760 | 1.72 |
| T30 | 34.71 | 36.49 | 37.25 | 37.86 | 38.69 | 32,250 | 1.73 |
| T50 | 29.46 | 32.86 | 34.04 | 34.25 | 35.67 | 29,600 | 1.68 |
| T70 | 28.61 | 31.82 | 32.61 | 33.74 | 35.12 | 29,420 | 1.67 |
| T30S1.5 | 37.4 | 39.31 | 40.52 | 42.55 | 43.49 | 33,460 | 2.21 |
| T30S1.5-P0.25 | 38.53 | 39.86 | 42.06 | 43.18 | 44.54 | 35,220 | 2.54 |
| T30S1.5-P0.5 | 39.82 | 41.77 | 42.83 | 43.86 | 45.29 | 36,050 | 2.93 |
| T30S1.5-P0.75 | 37.94 | 40.56 | 41.32 | 42.03 | 43.97 | 34,830 | 2.61 |
| Equation (6) | ACI318-11 | ACI363R | |
|---|---|---|---|
| error rate | −0.37–1.57% | 19.9–22.1% | 15.8–18.7% |
| Block Coding | Fitting Equation | β |
|---|---|---|
| NC | X = 1.93 | 25.57 |
| T15 | X = 1.74 | 23.04 |
| T30 | X = 1.52 | 20.14 |
| T50 | X = 1.80 | 23.85 |
| T70 | X = 2.33 | 30.48 |
| T30S1.5 | X = 0.86 | 12.62 |
| T30S1.5-P0.25 | X = 0.75 | 11 |
| T30S1.5-P0.5 | X = 0.69 | 10.12 |
| T30S1.5-P0.75 | X = 0.79 | 11.59 |
| Block Coding | 7d | 14d | 28d | 56d |
|---|---|---|---|---|
| NC | 0.84 | 0.84 | 0.86 | 0.94 |
| T15 | 0.87 | 0.93 | 0.99 | 1.05 |
| T30 | 0.89 | 1.02 | 1.17 | 1.25 |
| T50 | 0.79 | 0.92 | 0.97 | 1.00 |
| T70 | 0.98 | 0.98 | 1.01 | 0.96 |
| T30S1.5 | 0.80 | 0.85 | 0.91 | 1.06 |
| T30S1.5-P0.25 | 1.04 | 0.90 | 0.98 | 1.18 |
| T30S1.5-P0.5 | 1.21 | 1.23 | 1.21 | 1.11 |
| T30S1.5-P0.75 | 0.96 | 0.86 | 0.94 | 1.23 |
| Block Coding | T2 Spectrum Area | Peak1 | Peak2 | Peak3 | |||
|---|---|---|---|---|---|---|---|
| Area | Proportion | Area | Proportion | Area | Proportion | ||
| NC | 6055.7 | 5273.9 | 87.1 | 593.4 | 9.8 | 187.7 | 3.1 |
| T15 | 5670.5 | 5000.9 | 88.2 | 544.3 | 9.6 | 124.7 | 2.2 |
| T30 | 5517.7 | 4943.2 | 89.6 | 502 | 9.1 | 71.7 | 1.3 |
| T50 | 6960.6 | 6027.4 | 86.6 | 703 | 10.1 | 229.7 | 3.3 |
| T70 | 8001.7 | 6856.9 | 85.7 | 856.1 | 10.7 | 288 | 3.6 |
| Age | T2 Spectrum Area | Peak1 | Peak2 | Peak3 | |||
|---|---|---|---|---|---|---|---|
| Area | Proportion | Area | Proportion | Area | Proportion | ||
| 0 | 5517.7 | 4943.2 | 89.6 | 502 | 9.1 | 71.7 | 1.3 |
| 7 | 5266.1 | 4860.6 | 92.3 | 352.8 | 6.7 | 52.7 | 1 |
| 14 | 5088.6 | 4661.1 | 91.6 | 366.4 | 7.2 | 61.1 | 1.2 |
| 28 | 4970.3 | 4632.3 | 93.2 | 318.1 | 6.4 | 19.9 | 0.4 |
| 56 | 4911.1 | 4650.8 | 94.7 | 255.4 | 5.2 | 4.9 | 0.1 |
| Model [41] | Fitting Equation | R2 |
|---|---|---|
| Balshin model | σc = 78.78(1−p) − 0.91 | 0.93516 |
| Hasselman model | σc = 53.72 − 12.89p | 0.94613 |
| Ryshkewitch model | σc = 59.79exp(−0.37p) | 0.94108 |
| Schiller model | σc = 18.86ln (9.19/p) | 0.9452 |
Publisher’s Note: MDPI stays neutral with regard to jurisdictional claims in published maps and institutional affiliations. |
© 2022 by the authors. Licensee MDPI, Basel, Switzerland. This article is an open access article distributed under the terms and conditions of the Creative Commons Attribution (CC BY) license (https://creativecommons.org/licenses/by/4.0/).
Share and Cite
Zheng, W.; Wang, S.; Quan, X.; Qu, Y.; Mo, Z.; Lin, C. Carbonation Resistance and Pore Structure of Mixed-Fiber-Reinforced Concrete Containing Fine Aggregates of Iron Ore Tailings. Materials 2022, 15, 8992. https://0-doi-org.brum.beds.ac.uk/10.3390/ma15248992
Zheng W, Wang S, Quan X, Qu Y, Mo Z, Lin C. Carbonation Resistance and Pore Structure of Mixed-Fiber-Reinforced Concrete Containing Fine Aggregates of Iron Ore Tailings. Materials. 2022; 15(24):8992. https://0-doi-org.brum.beds.ac.uk/10.3390/ma15248992
Chicago/Turabian StyleZheng, Wenbo, Sheliang Wang, Xiaoyi Quan, Yang Qu, Zhikai Mo, and Changjun Lin. 2022. "Carbonation Resistance and Pore Structure of Mixed-Fiber-Reinforced Concrete Containing Fine Aggregates of Iron Ore Tailings" Materials 15, no. 24: 8992. https://0-doi-org.brum.beds.ac.uk/10.3390/ma15248992