
Multi-Technique Diagnostic Analysis of Plasters and Mortars from the Church of the Annunciation (Tortorici, Sicily)

 ,
,  ,
,  ,
,  , , and
Abstract
:1. Introduction
2. Materials and Methods
2.1. Site Description
2.2. Materials
2.3. Methods
3. Results and Discussion
3.1. Plasters
3.2. Mortars
4. Conclusions
Author Contributions
Funding
Institutional Review Board Statement
Informed Consent Statement
Data Availability Statement
Acknowledgments
Conflicts of Interest
References
- Liritzis, I.; Laskaris, N.; Vafiadou, A.; Karapanagiotis, I.; Volonakis, P.; Papageorgopoulou, C.; Bratitsi, M. Archaeometry: An Overview. Sci. Cult. 2020, 6, 49–98. [Google Scholar] [CrossRef]
- Dussubieux, L.; Deraisme, A.; Frot, G.; Stevenson, C.; Creech, A.; Bienvenu, Y. Recent Advances in Laser Ablation ICP-MS for Archaeology. Archaeometry 2008, 50, 643–657. [Google Scholar] [CrossRef]
- Crupi, V.; La Russa, M.F.; Venuti, V.; Ruffolo, S.A.; Ricca, M.; Paladini, G.; Albini, R.; Macchia, A.; Denaro, L.; Birarda, G.; et al. A combined SR-based Raman and InfraRed investigation of pigmenting matter used in wall paintings: The San Gennaro and San Gaudioso Catacombs (Naples, Italy) case. Eur. Phys. J. Plus 2018, 133, 369. [Google Scholar] [CrossRef]
- Miliani, M.; Rosi, F.; Brunetti, B.G.; Sgamellotti, A. In Situ Noninvasive Study of Artworks: The Molab Mul-titechnique Approach. Acc. Chem. Res. 2010, 43, 728–738. [Google Scholar] [CrossRef] [PubMed]
- Attanasio, D.; Bultrini, G.; Ingo, G.M. The Possibility Of Provenancing A Series Of Bronze Punic Coins Found At Tharros (Western Sardinia) Using The Literature Lead Isotope Database. Archaeometry 2001, 43, 529–547. [Google Scholar] [CrossRef]
- Shackley, M.S. X-ray Fluorescence Spectrometry (XRF) in Geoarchaeology, 1st ed.; Springer: New York, NY, USA, 2011. [Google Scholar]
- Vandenabeele, P. Applications of Raman spectroscopy in Cultural Heritage research. In Raman Spectroscopy Applied to Earth Sciences and Cultural Heritage; EMU Notes in Mineralogy; Dubessy, J., Caumon, M.-C., Rull, F., Eds.; European Mineralogical Union: London, UK, 2012; pp. 491–500. [Google Scholar]
- Leary, P.E.; Crocombe, R.A.; Kammrath, B.W. Introduction to portable spectroscopy. In Portable Spectroscopy and Spectrometry 1: Technologies and Instrumentation, 1st ed.; Crocombe, R.A., Leary, P.E., Kammrath, B.W., Eds.; John Wiley & Sons Ltd.: Hoboken, NJ, USA, 2021; pp. 1–13. [Google Scholar]
- Romani, A.; Clementi, C.; Miliani, C.; Brunetti, B.G.; Sgamellotti, A.; Favaro, G. Portable equipment for luminescence lifetime measurements on surfaces. Appl. Spectrosc. 2008, 62, 1395–1399. [Google Scholar] [CrossRef]
- Gigante, G.E.; Ricciardi, P.; Ridolfi, S. Areas and limits of employment of portable EDXRF equipment for in situ investigations. Archeosciences 2005, 29, 51–59. [Google Scholar] [CrossRef]
- Vandenabeele, P.; Donais, M.K. Mobile Spectroscopic Instrumentation in Archaeometry Research. Appl. Spectrosc. 2016, 70, 27–41. [Google Scholar] [CrossRef]
- Del-Solar-Velarde, N.; Kinis, S.; Chapoulie, R.; Joannes-Boyau, R.; Castillo, L.J. Characterization of pre-Columbian artefacts in situ through handheld portable X-ray fluorescence spectrometry: The case of ceramics from the Mochica site of San José de Moro (Peru). Herit. Sci. 2016, 4, 37. [Google Scholar] [CrossRef] [Green Version]
- Artioli, G.; Oberti, R. The Contribution of Mineralogy to Cultural Heritage; Mineralogical Society of Great Britain and Ireland: London, UK, 2019. [Google Scholar]
- D’Amato, M.; Sulla, R. Investigations of masonry churches seismic performance with numerical models: Application to a case study. Arch. Civ. Mech. Eng. 2021, 21, 161. [Google Scholar] [CrossRef]
- Asteris, P.; Chronopoulos, M.; Chrysostomou, M.; Varum, H.; Plevris, V.; Kyriakides, N.; Silva, V. Seismic vulnerability assessment of historical masonry structural systems. Eng. Struct. 2014, 62–63, 118–134. [Google Scholar] [CrossRef]
- Warr, L. IMA–CNMNC approved mineral symbols. Mineral. Mag. 2021, 85, 291–320. [Google Scholar] [CrossRef]
- Vagnini, M.; Vivani, R.; Viscuso, E.; Favazza, M.; Brunetti, B.; Sgamellotti, A.; Miliani, C. Investigation on the process of lead white blackening by Raman spectroscopy, XRD and other methods: Study of Cimabue’s paintings in Assisi. Vib. Spectrosc. 2018, 98, 41–49. [Google Scholar] [CrossRef]
- Smith, G.; Derbyshire, A.; Clark, R. In situ Spectroscopic Detection of Lead Sulphide on a Blackened Manuscript Illumination by Raman Microscopy. Stud. Conserv. 2002, 47, 250–256. [Google Scholar]
- Li, Y.-S.; Church, J.S.; Woodhead, A.L. Infrared and Raman spectroscopic studies on iron oxide magnetic nano-particles and their surface modifications. J. Magn. Magn. Mater. 2012, 324, 1543–1550. [Google Scholar] [CrossRef]
- Krishnamurti, D. The raman spectrum of calcite and its interpretation. Proc. Indian Acad. Sci.—Sect. A 1957, 46, 183–202. [Google Scholar] [CrossRef]
- De La Pierre, M.; Carteret, C.; Maschio, L.; André, E.; Orlando, R.; Dovesi, R. The Raman spectrum of CaCO3 polymorphs calcite and aragonite: A combined experimental and computational study. J. Chem. Phys. 2014, 140, 164509. [Google Scholar] [CrossRef] [Green Version]
- Rutt, H.N.; Nicola, J.H. Raman spectra of carbonates of calcite structure. J. Phys. C Solid State Phys. 1974, 7, 4522–4528. [Google Scholar] [CrossRef]
- Puech, P.; Kandara, M.; Paredes, G.; Moulin, L.; Weiss-Hortala, E.; Kundu, A.; Ratel-Ramond, N.; Plewa, J.-M.; Pellenq, R.; Monthioux, M. Analyzing the Raman Spectra of Graphenic Carbon Materials from Kerogens to Nanotubes: What Type of Information Can Be Extracted from Defect Bands? C—J. Carbon Res. 2019, 5, 69. [Google Scholar] [CrossRef] [Green Version]
- Maruccia, G.; Beeby, A.; Parker, A.W.; Nicholson, C.E. Raman spectroscopic library of medieval pigments collected with five different wavelengths for investigation of illuminated manuscripts. Anal. Methods 2018, 10, 1219–1236. [Google Scholar] [CrossRef] [Green Version]
- Hanesch, M. Raman spectroscopy of iron oxides and (oxy)hydroxides at low laser power and possible applications in environmental magnetic studies. Geophys. J. Int. 2009, 177, 941–948. [Google Scholar] [CrossRef]
- De Faria, D.L.A.; Venâncio Silva, S.; de Oliveira, M.T. Raman microspectroscopy of some iron oxides and oxyhydroxides. J. Raman Spectrosc. 1997, 28, 873–878. [Google Scholar] [CrossRef]
- Froment, F.; Tournié, A.; Colomban, P. Raman identification of natural red to yellow pigments: Ochre and iron-containing ores. J. Raman Spectrosc. 2008, 39, 560–568. [Google Scholar] [CrossRef]
- Gila, M.; Carvalho, M.L.; Seruya, A.; Candeias, A.E.; Mirão, J.; Queralt, I. Yellow and red ochre pigments from southern Portugal: Elemental composition and characterization by WDXRF and XRD. Nucl. Instrum. Methods Phys. Res. Sect. A Accel. Spectrometers Detect. Assoc. Equip. 2007, 580, 728–731. [Google Scholar] [CrossRef]
- Bikiaris, D.; Daniilia, S.; Sotiropoulou, S.; Katsimbiri, E.; Pavlidou, E.; Moutsatsou, A.P.; Chryssoulakis, Y. Ochre-differentiation through micro-Raman and micro-FTIR spectroscopies: Application on wall paintings at Meteora and Mount Athos, Greece. Spectrochim. Acta Part A Mol. Biomol. Spectrosc. 2000, 56, 3–18. [Google Scholar] [CrossRef]
- Post, J.E.; McKeown, D.A.; Heaney, P.J. Raman spectroscopy study of manganese oxides: Tunnel structures. Am. Mineral. 2020, 105, 1175–1190. [Google Scholar] [CrossRef]
- Bernardini, S.; Bellatreccia, F.; Casanova Municchia, A.; Della Ventura, G.; Sodo, A. Raman spectra of natural manganese oxides. J. Raman Spectrosc. 2019, 50, 873–888. [Google Scholar] [CrossRef]
- Fuster-López, L.; Izzo, F.C.; Piovesan, M.; Yusá-Marco, D.J.; Sperni, L.; Zendri, E. Study of the chemical composition and the mechanical behaviour of 20th century commercial artists' oil paints containing manganese-based pigments. Microchem. J. 2016, 124, 962–973. [Google Scholar] [CrossRef] [Green Version]
- Berenblut, B.J.; Dawson, P.; Wilkinson, G.R. A comparison of the Raman spectra of anhydrite (CaSO4) and gypsum (CaSO4).2H2O). Spectrochim. Acta Part A Mol. Spectrosc. 1973, 29, 29–36. [Google Scholar] [CrossRef]
- Berenblut, B.J.; Dawson, P.; Wilkinson, G.R. The Raman spectrum of gypsum. Spectrochim. Acta Part A Mol. Spectrosc. 1971, 27, 1849–1863. [Google Scholar] [CrossRef]
- Pfaff, G. Inorganic Pigments, 1st ed.; Walter de Gruyter GmbH: Berlin, Germany, 2017. [Google Scholar]
- Schmidt, C.M.; Walton, M.S.; Trentelman, K. Characterization of Lapis Lazuli Pigments Using a Multitechnique Analytical Approach: Implications for Identification and Geological Provenancing. Anal. Chem. 2009, 81, 8513–8518. [Google Scholar] [CrossRef]
- Frison, G.; Brun, G. Lapis lazuli, lazurite, ultramarine ‘blue’, and the colour term ‘azure’ up to the 13th century. J. Int. Colour Assoc. 2016, 16, 41–55. [Google Scholar]
- Ganio, M.; Pouyet, E.; Webb, S.; Schmidt Patterson, C.; Walton, M. From lapis lazuli to ultramarine blue: Investigating Cennino Cennini’s recipe using sulfur K-edge XANES. Pure Appl. Chem. 2018, 90, 463–475. [Google Scholar] [CrossRef]
- Chukanov, N.; Sapozhnikov, A.; Shendrik, R.; Vigasina, M.; Steudel, R. Spectroscopic and Crystal-Chemical Features of Sodalite-Group Minerals from Gem Lazurite Deposits. Minerals 2020, 10, 1042. [Google Scholar] [CrossRef]
- Delamare, F. Blue Pigments. 5000 Years of Art and Industry; Archetype Publications Ltd.: London, UK, 2013. [Google Scholar]
- Hsiao, Y.H.; Shen, Y.H.; Ray, D.T. Synthesis of Ultramarine from Reservoir Silts. Minerals 2017, 7, 69. [Google Scholar] [CrossRef] [Green Version]
- La Russa, M.; Ruffolo, S. Mortars and plasters—How to characterize mortar and plaster degradation. Archaeol. Anthropol. Sci. 2021, 13, 165. [Google Scholar] [CrossRef]
- Veneranda, M.; Fdez-Ortiz de Vallejuelo, S.; Prieto-Taboada, N.; Maguregui, M.; Marcaida, I.; Morillas, H.; Martellone, A.; de Nigris, B.; Osanna, M.; Castro, K.; et al. In-situ multi-analytical characterization of original and decay materials from unique wall mirrors in the House of Gilded Cupids, Pompeii. Herit. Sci. 2018, 6, 40. [Google Scholar] [CrossRef]
- Morillas, H.; Maguregui, M.; Madariaga, J.M. Spectroscopic evidences to understand the influence of marine environments on Built Heritage. Spectrosc. Eur. 2016, 28, 6–11. [Google Scholar]
- Poole, A.; Sims, I. Concrete Petrography: A Handbook of Investigative Techniques, 2nd ed.; CRC Press: Boca Raton, FL, USA, 2016. [Google Scholar]
- Charola, A.E. Salts in the Deterioration of Porous Materials: An Overview. J. Am. Inst. Conserv. 2000, 39, 327–343. [Google Scholar] [CrossRef]
- Newman, S.P.; Clifford, S.J.; Coveney, P.V.; Gupta, V.; Blanchard, J.D.; Serafin, F.; Ben-Amotz, D.; Diamond, S. Anomalous fluorescence in near-infrared Raman spectroscopy of cementitious materials. Cem. Concr. Res. 2005, 35, 1620–1628. [Google Scholar] [CrossRef]
- Martinez-Ramirez, S.; Fernandez-Carrasco, L. Raman Spectroscopy: Application to Cementitious Systems. In Construction and Building: Design, Materials, and Techniques; Doyle, S.G., Ed.; Nova Science Publishers: Hauppauge, NY, USA, 2011. [Google Scholar]
- Yue, Y.; Wang, J.-J.; Basheer, M.; Bai, Y. In-situ monitoring of early hydration of clinker and Portland cement with optical fiber excitation Raman spectroscopy. Cem. Concr. Compos. 2020, 112, 103664. [Google Scholar] [CrossRef]
- Aldega, L.; Corrado, S.; Di Paolo, L.; Somma, R.; Maniscalco, R.; Balestrieri, M.L. Shallow burial and exhumation of the Peloritani Mountains (NE Sicily, Italy): Insight from paleothermal and structural indicators. Geol. Soc. Am. Bull. 2011, 123, 132–149. [Google Scholar] [CrossRef]
- Matias, G.; Faria, P.; Torres, I. Lime mortars with heat treated clays and ceramic waste: A review. Constr. Build. Mater. 2014, 73, 125–136. [Google Scholar] [CrossRef]
- Cardiano, P.; Sergi, S.; De Stefano, C.; Ioppolo, S.; Piraino, P. Investigations on ancient mortars from the Basilian monastery of Fragalà. J. Therm. Anal. Calorim. 2008, 91, 477–485. [Google Scholar] [CrossRef]


| ID | Description |
|---|---|
| PG | White colored preparatory ground |
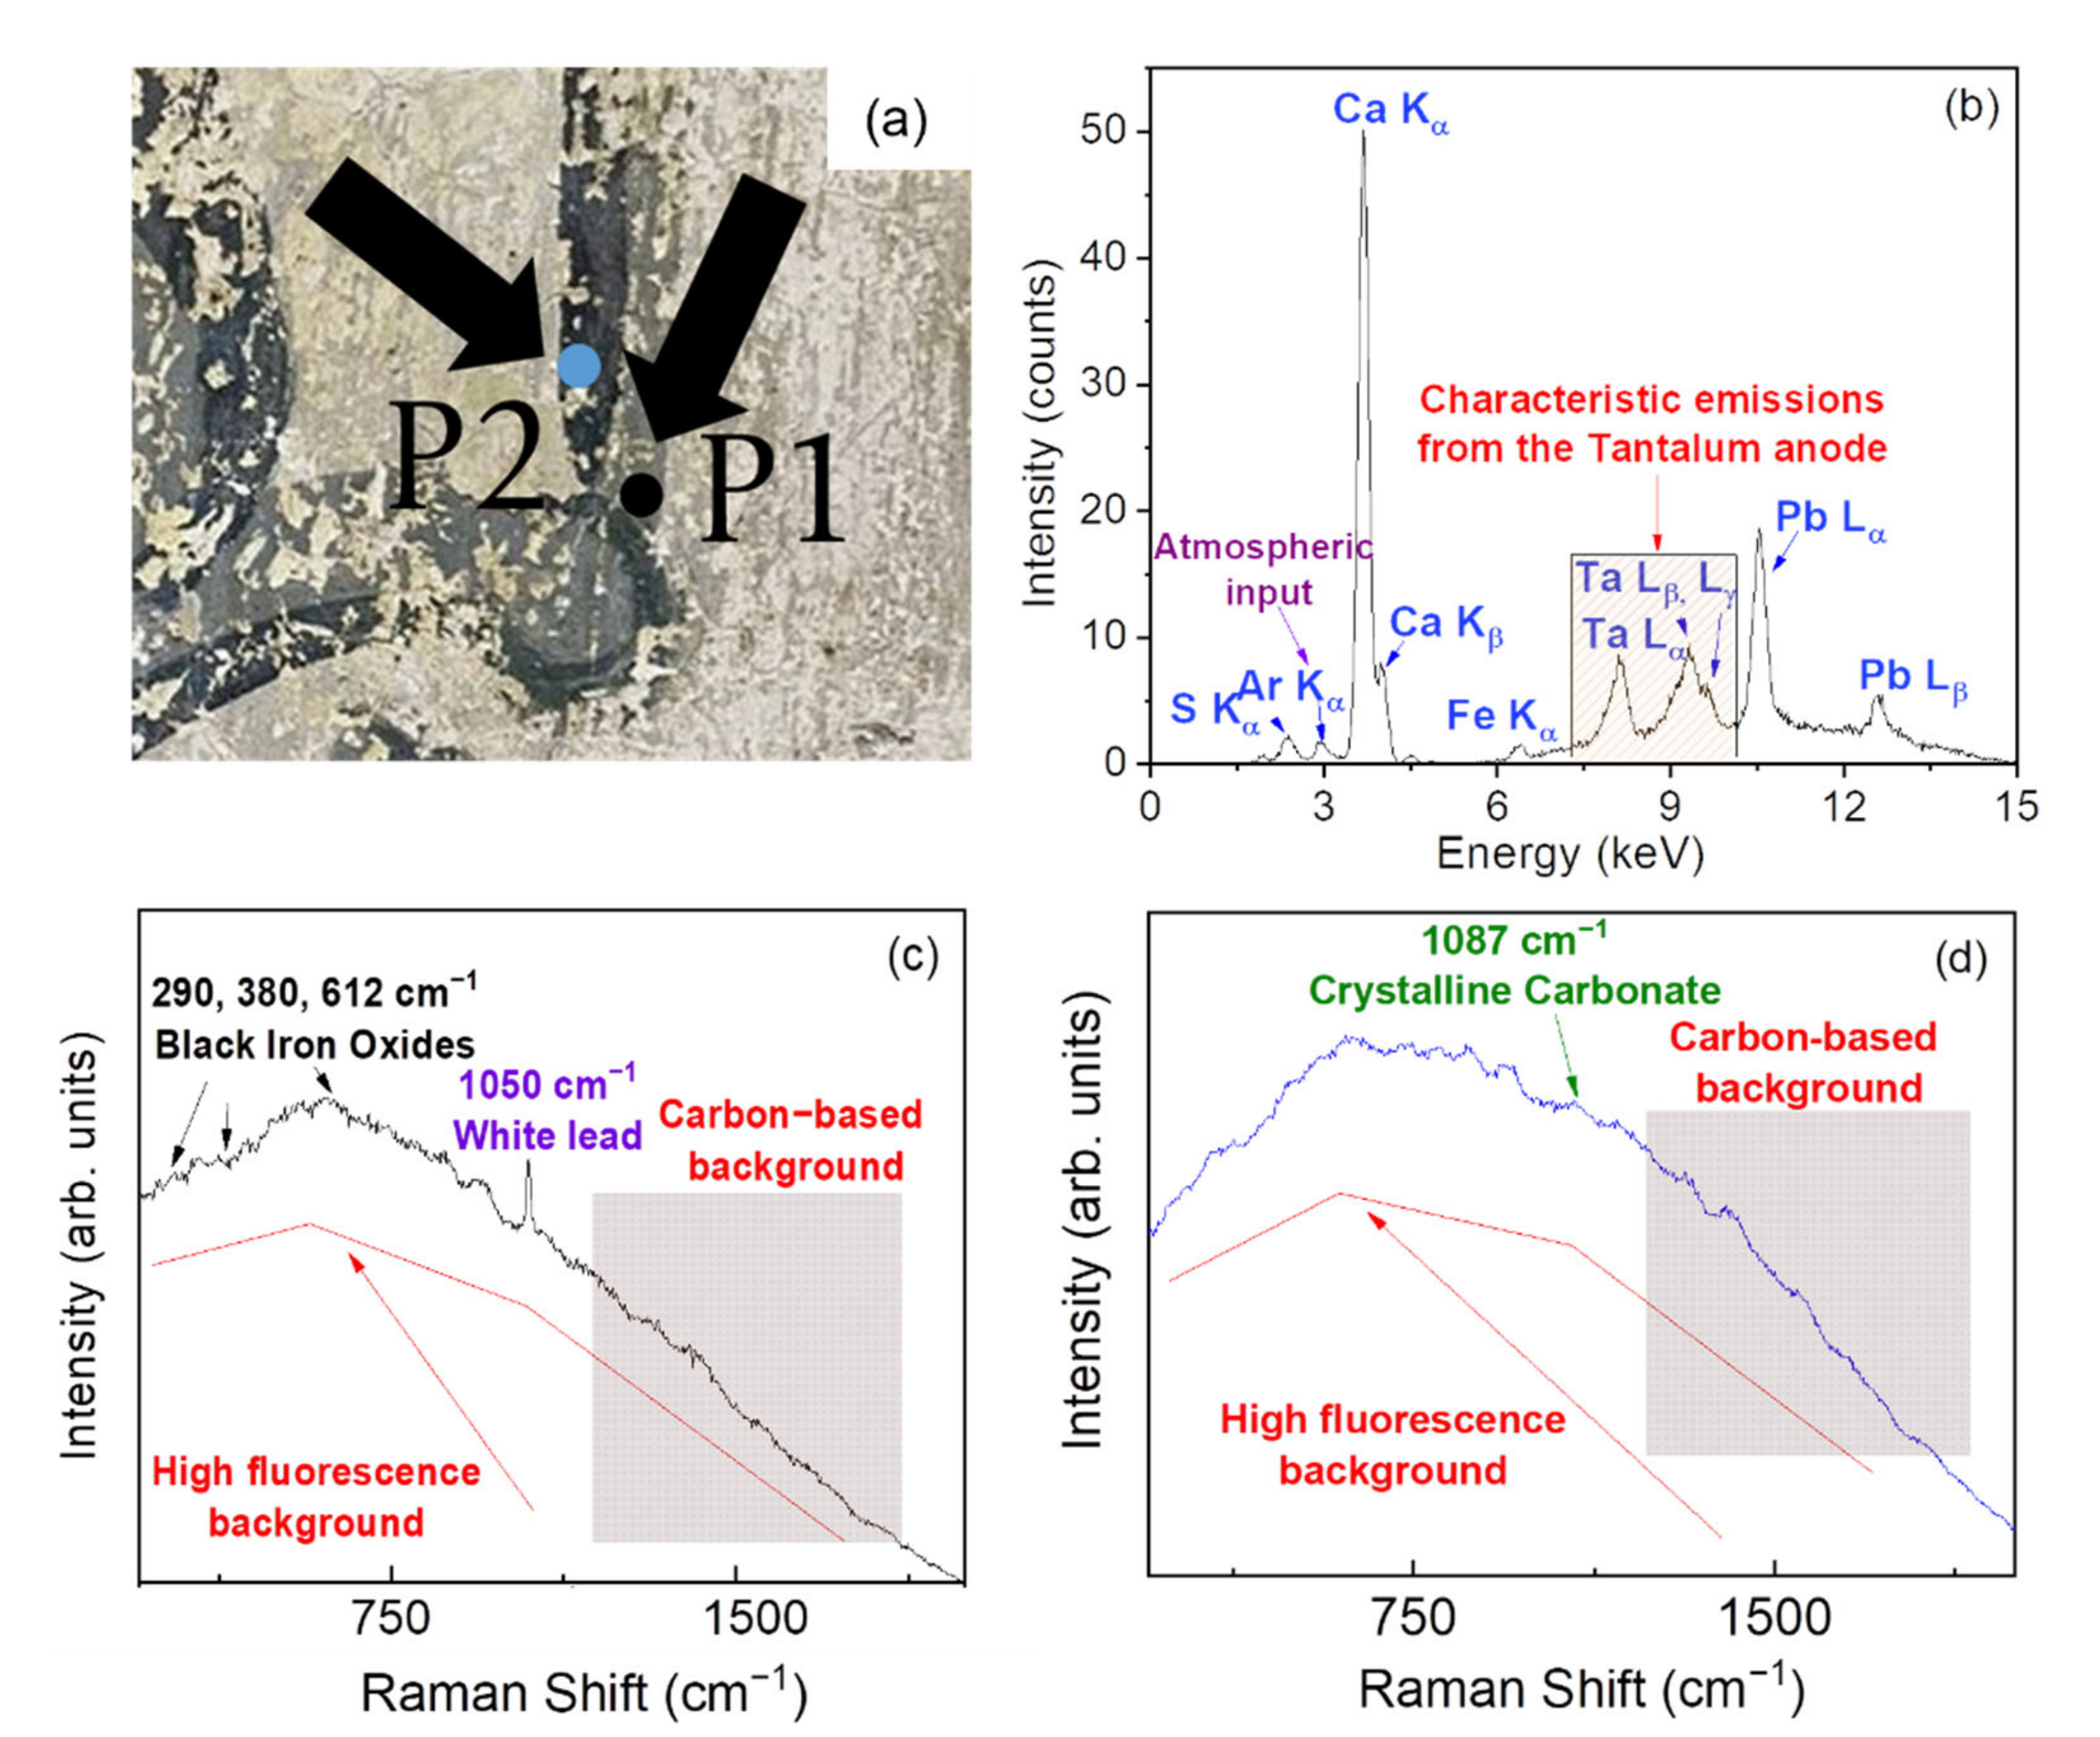
| P1 | Pigmented plaster—light gray |
| P2 | Pigmented plaster—dark gray |
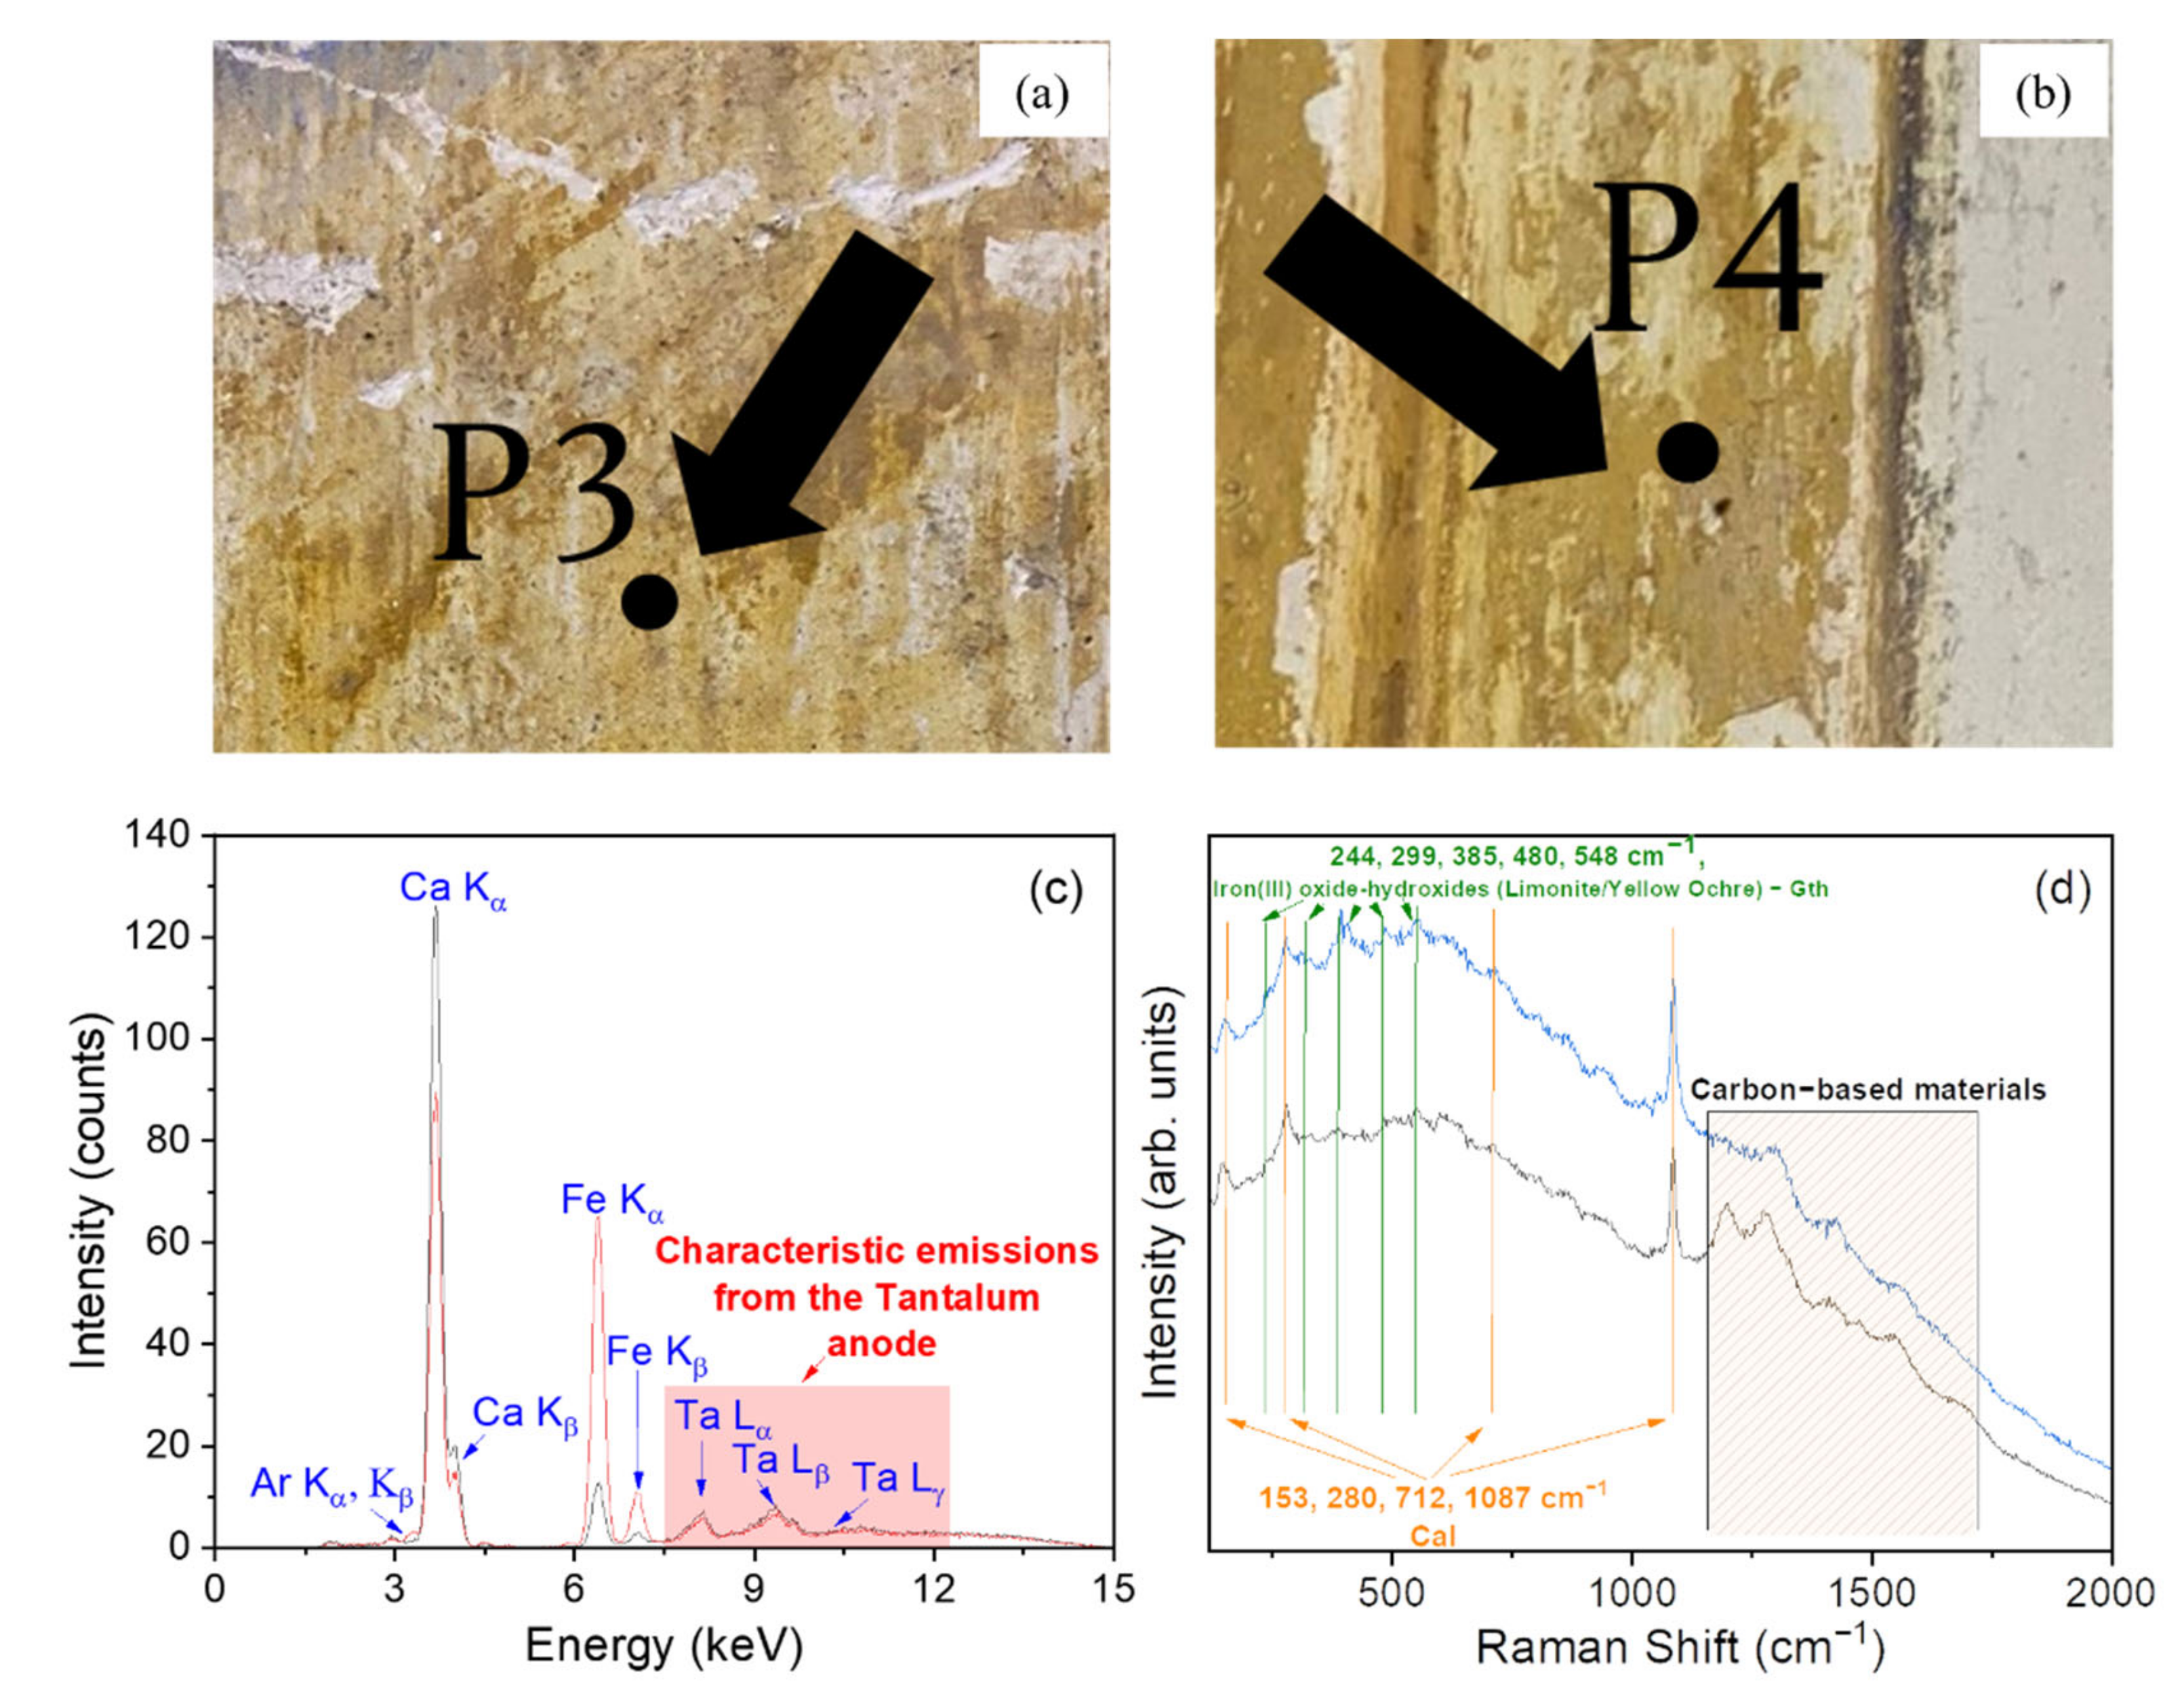
| P3 | Pigmented plaster—light yellow |
| P4 | Pigmented plaster—dark yellow |
| P5 | Pigmented plaster—dark brown |
| P6 | Pigmented plaster—brown |
| P7 | Pigmented plaster—pink |
| P8 | Pigmented plaster—dark blue |
| P9 | Pigmented plaster—light blue |
| ALT | Crystalline deposit of salts (efflorescence) |
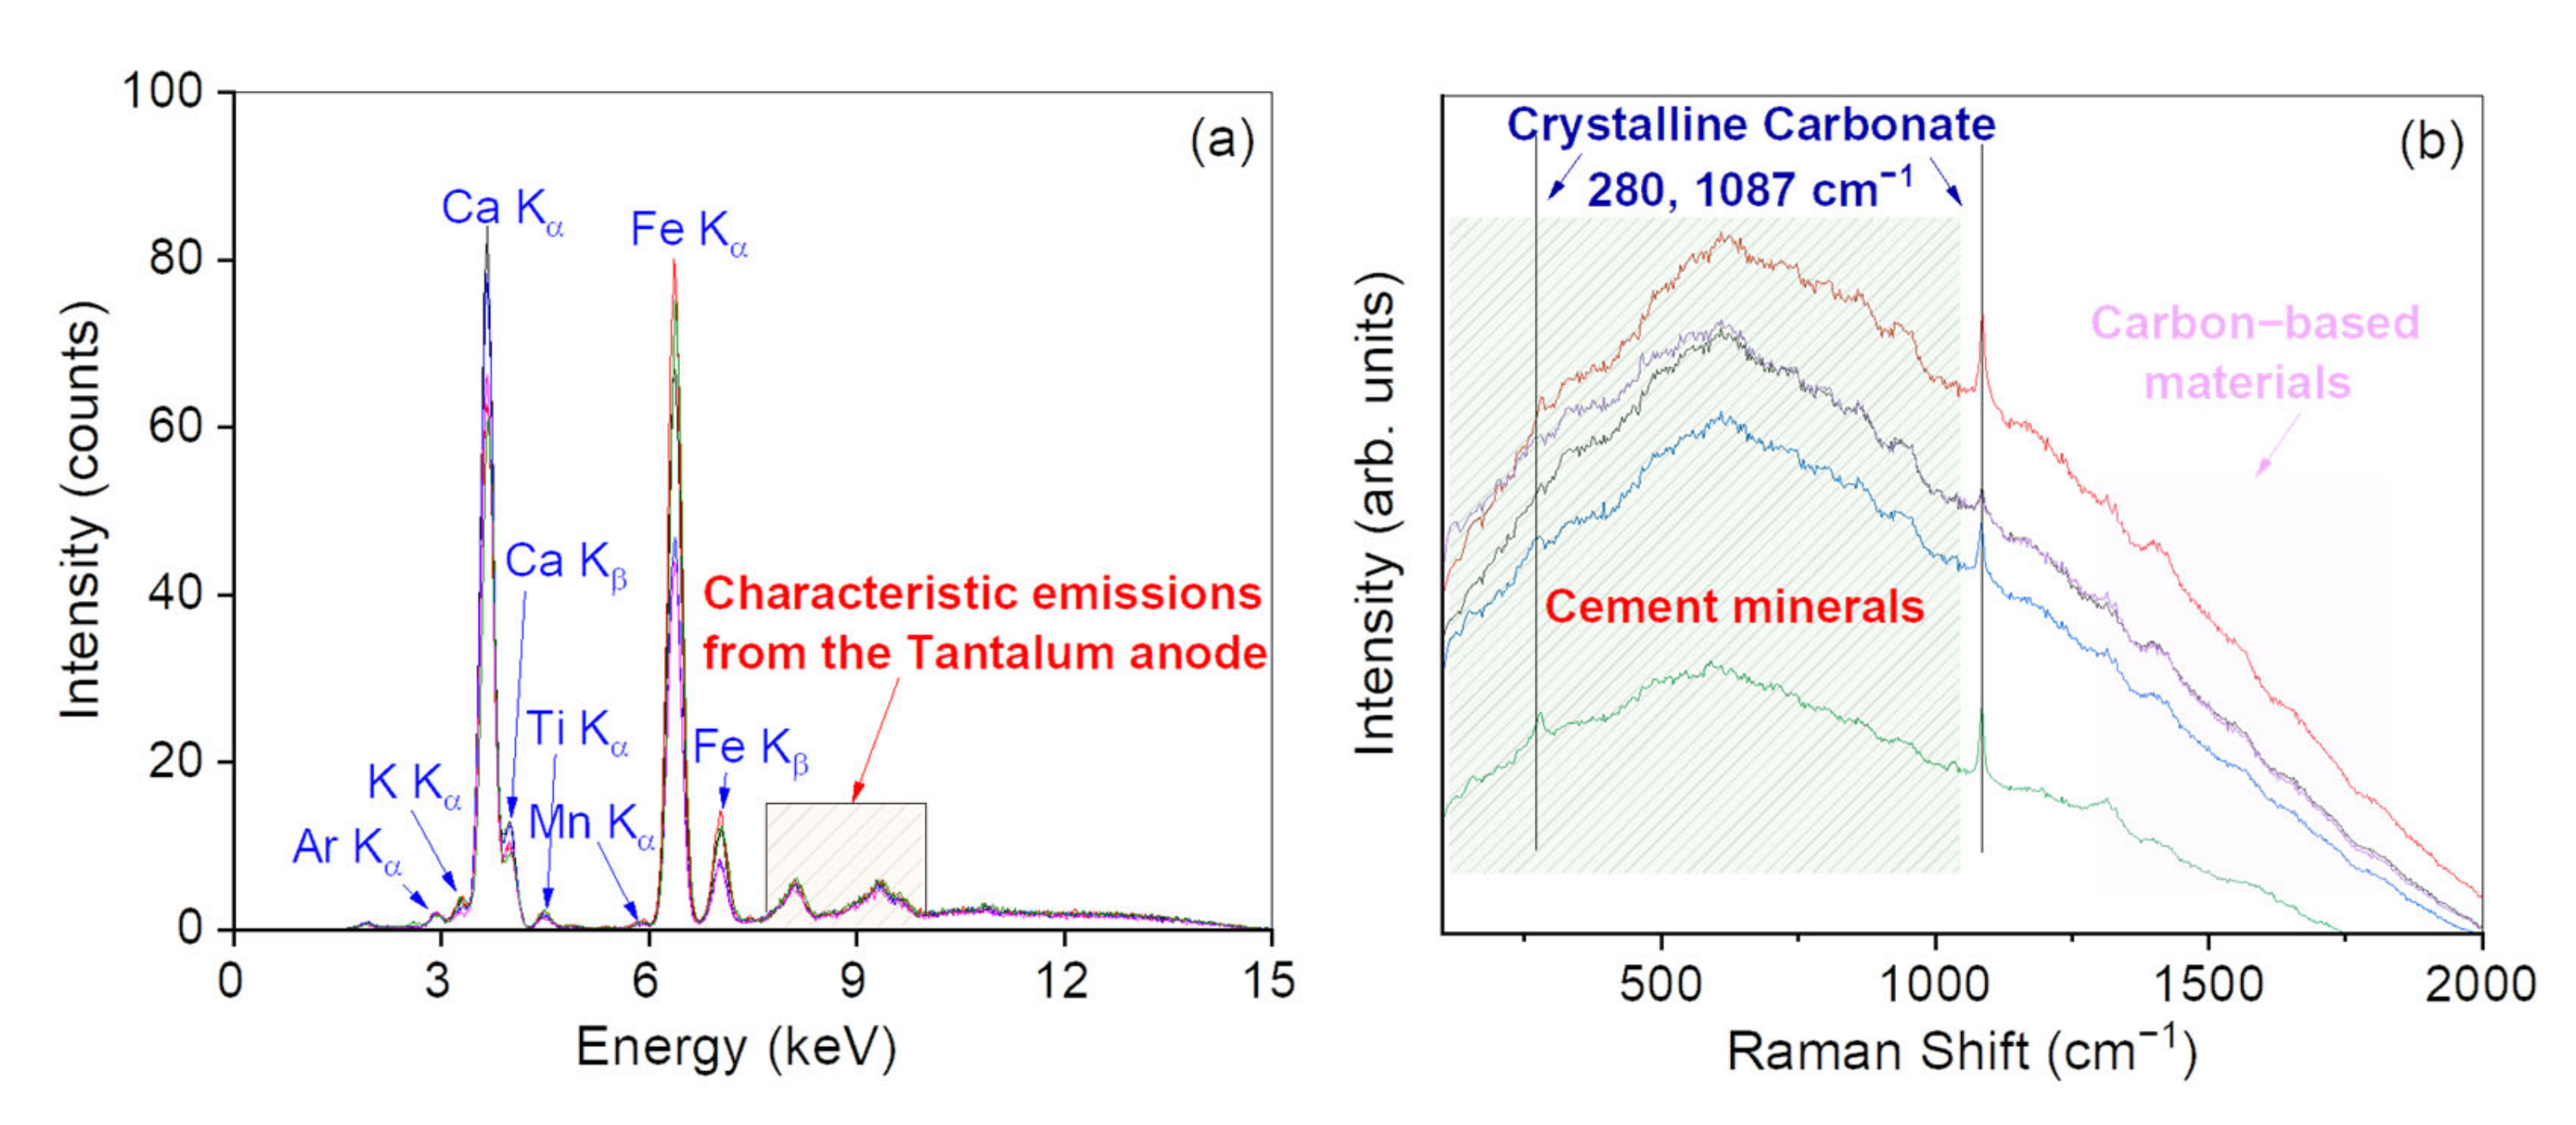
| M1 | Gray mortar joint |
| M2 | Gray mortar joint |
| M3 | Gray mortar joint |
| M4 | Gray mortar joint |
| M5 | Gray mortar joint |
Publisher’s Note: MDPI stays neutral with regard to jurisdictional claims in published maps and institutional affiliations. |
© 2022 by the authors. Licensee MDPI, Basel, Switzerland. This article is an open access article distributed under the terms and conditions of the Creative Commons Attribution (CC BY) license (https://creativecommons.org/licenses/by/4.0/).
Share and Cite
Spoto, S.E.; Paladini, G.; Caridi, F.; Crupi, V.; D’Amico, S.; Majolino, D.; Venuti, V. Multi-Technique Diagnostic Analysis of Plasters and Mortars from the Church of the Annunciation (Tortorici, Sicily). Materials 2022, 15, 958. https://0-doi-org.brum.beds.ac.uk/10.3390/ma15030958
Spoto SE, Paladini G, Caridi F, Crupi V, D’Amico S, Majolino D, Venuti V. Multi-Technique Diagnostic Analysis of Plasters and Mortars from the Church of the Annunciation (Tortorici, Sicily). Materials. 2022; 15(3):958. https://0-doi-org.brum.beds.ac.uk/10.3390/ma15030958
Chicago/Turabian StyleSpoto, Sebastiano Ettore, Giuseppe Paladini, Francesco Caridi, Vincenza Crupi, Sebastiano D’Amico, Domenico Majolino, and Valentina Venuti. 2022. "Multi-Technique Diagnostic Analysis of Plasters and Mortars from the Church of the Annunciation (Tortorici, Sicily)" Materials 15, no. 3: 958. https://0-doi-org.brum.beds.ac.uk/10.3390/ma15030958