Article

Prospects of Using Pseudobrookite as an Iron-Bearing Mineral for the Alkaline Electrolytic Production of Iron

by
Daniela V. Lopes
1,*,
Aleksey D. Lisenkov
1,
Luís C. M. Ruivo
1,2,
Aleksey A. Yaremchenko
1,
Jorge R. Frade
1 and
Andrei V. Kovalevsky
1
1
Department of Materials and Ceramic Engineering, CICECO—Aveiro Institute of Materials, University of Aveiro, 3810-193 Aveiro, Portugal
2
Department of Environment and Planning & Centre for Environmental and Marine Studies (CESAM), University of Aveiro, Campus Universitário de Santiago, 3810-193 Aveiro, Portugal
*
Author to whom correspondence should be addressed.
Submission received: 30 December 2021 / Revised: 11 February 2022 / Accepted: 13 February 2022 / Published: 15 February 2022
(This article belongs to the Special Issue Feature Papers in Energy Materials)

Abstract

:
The alkaline electrolytic production of iron is gaining interest due to the absence of CO2 emissions and significantly lower electrical energy consumption when compared with traditional steelmaking. The possibility of using an iron-bearing pseudobrookite mineral, Fe2TiO5, is explored for the first time as an alternative feedstock for the electrochemical reduction process. To assess relevant impacts of the presence of titanium, similar electroreduction processes were also performed for Fe2TiO5·Fe2O3 and Fe2O3. The electroreduction was attempted using dense and porous ceramic cathodes. Potentiostatic studies at the cathodic potentials of −1.15–−1.30 V vs. an Hg|HgO|NaOH reference electrode and a galvanostatic approach at 1 A/cm2 were used together with electroreduction from ceramic suspensions, obtained by grinding the porous ceramics. The complete electroreduction to Fe0 was only possible at high cathodic polarizations (−1.30 V), compromising the current efficiencies of the electrochemical process due to the hydrogen evolution reaction impact. Microstructural evolution and phase composition studies are discussed, providing trends on the role of titanium and corresponding electrochemical mechanisms. Although the obtained results suggest that pseudobrookite is not a feasible material to be used alone as feedstock for the electrolytic iron production, it can be considered with other iron oxide materials and/or ores to promote electroreduction.

1. Introduction

Industries such as iron and steel production represent a crucial sector in the global market. Around 70% of the steel manufactured worldwide is still produced by the carbothermal reduction route. This traditional route of converting iron oxides into metallic iron is responsible for 7 to 9% of global CO2 direct emissions [1,2]. Apart from molten oxide electrolysis (MOE) [3,4], electrochemical reduction in alkaline media arises as an interesting lean-CO2 technology for iron production and steelmaking, considering future industrialization [5,6,7,8,9]. The absence of greenhouse gas emissions, the relatively low temperature (~100 °C) used and simultaneous hydrogen and oxygen production due to the water splitting are attractive features of such electrowinning technology. Significant benefits are expected from the integration of this approach with intermittent renewable energy, considering hydrogen production and storage. Moreover, around 13 GJ/ton of energy are consumed as compared to 19 GJ/ton by the traditional steelmaking route [10,11]. The strong alkaline electrolytes are preferred to the acidic ones, where lower current efficiency is observed due to the looping between iron valence states [7,12] and lower overvoltages for hydrogen evolution, along with less restrictive requirements to manufacture materials in the case of alkaline electrolytes.
Hematite is the most studied raw material for electroreduction to Fe0. Studies have been performed both in suspensions [5,13,14] and bulk ceramic cathodes [6,7,8,15]. Despite the associated low electrical conductivity, electrodeposition and electroreduction from Fe2O3 is proved to be feasible, with Faradaic efficiencies higher than 70% in both modes. Studies on Fe3O4 [9,14] and FeOOH [14] were also performed, showing, however, generally lower efficiencies. Different feedstocks for the electrochemical reduction for steelmaking are now under consideration, including iron-rich waste such as red mud from the aluminium industry [16,17]. The role of some specific elements like Al [18,19] and Mg [20] on the reduction mechanisms of hematite- or magnetite-based compounds were also studied. Recently, the electroreduction of titanium-containing magnetite, Fe3–xTixO4, using ironsands as a feedstock, was also studied [21]. However, relatively low titanium content was considered in that work. In fact, all iron feedstocks relevant for industrial processing contain phase impurities and non-conductive components, which produce hardly predictable effects during electroreduction. Relevant iron oxide-based minerals can be also considered as an alternative feedstock, due to their abundance in the Earth’s crust. Natural iron-titanium oxides, such as pseudobrookite (Fe2TiO5), are an interesting raw material with a substantially higher Ti content (~33 wt.% of TiO2). Fe2TiO5 is the most stable iron-titanate phase with an n-type semiconductor behaviour, showing suitable properties to be used as a catalyst in biomass gasification [22] due to its compositional flexibility and redox changes, and its capacity to absorb in the visible light spectrum allows it to be used as a photocatalyst [23,24]. It is also used as an electrocatalyst by designing from it defects-rich heterostructures [25] and as a gas sensor [26], since it is a metal oxide semiconductor material or ceramic pigments [27] due to its presence in glassy coatings and glazes after firing at high temperatures. Synthesis of phase-pure Fe2TiO5 can be performed mainly by solid-state reaction [23,28,29], hydrothermal synthesis [28] and sol-gel [23,24], among others, while the design of highly porous Fe2TiO5 ceramics seems to be lacking in the literature. The present work explores, for the first time, the use of an iron-bearing mineral such as pseudobrookite as a raw material for iron production and aims to study the impact of higher titanium content on the electroreduction mechanism.

2. Materials and Methods

The precursor materials included hematite (Gute Chemie, abcr GmbH, Karlsruhe, Germany, 99.8%) and titanium (IV) oxide (rutile phase, Alfa Aesar, Tewksbury, MA, USA, 99.8%) powders. The powders were ball-milled with ethanol (AGA—Álcool e Géneros Alimentares S.A., Lisbon, Portugal, 99.5%) for 4 h to improve the homogeneity and decrease the particle size of the mixture, followed by oven drying at 60 °C for 24 h. Two types of samples were prepared, dense (Fe2TiO5 composition) and porous (compositions such as Fe2TiO5, Fe2TiO5·Fe2O3 and Fe2O3). Dense, disk-shaped Fe2TiO5 samples were compacted by uniaxial pressing and sintered at 1000 °C for 2 h by microwave irradiation, using a PYRO Microwave Muffle Furnace T480 (Milestone, Sorisole, Italy) with 15 °C/min of heating and cooling rates. The porous ceramics of Fe2TiO5, Fe2TiO5·Fe2O3 and Fe2O3 were prepared by emulsification with the liquid paraffin method (Valente e Ribeiro Lda., Lisbon, Portugal) from the mixture of powders in a water suspension (50 vol.% of solids) or from the Fe2O3 powder in water (40 vol.% of solids), according to [30]. Porous samples were first calcined at 500 °C for a complete elimination of the organic phase (1 °C/min until 300 °C, 3 h of dwell; 2 °C/min until 500 °C, 1 h of dwell; 5 °C/min of cooling rate), followed by firing at 1100 °C for Fe2O3 and 1150 °C for the remaining cases, all with 5 °C/min of heating and cooling rates, and 20 min of dwell. Open porosity of all samples was estimated by the Archimedes method, as described in [8,31].
A three-electrode PTFE electrochemical cell was used for all the electrochemical tests at 80 °C, using 10 M NaOH as electrolyte (100 mL). A Hg|HgO|NaOH (1 M) (+0.098 V vs. standard hydrogen electrode, CH Instruments, Inc., Austin, TX, USA) was used as a reference electrode (RE) connected to the electrochemical cell by a Luggin capillary. A spiral platinum wire (7.40 cm2) was used as the counter electrode (CE). The experimental conditions used during the electrochemical reduction tests were selected based on previous results [8,9,18]. The tests were performed for Fe2TiO5, Fe2TiO5·Fe2O3 and Fe2O3 pellets (2–3 mm thickness, ~1.1 cm2 of area), which were used as ceramic cathodes. These pellets were glued to a Ni foil with silver paste (Agar Scientific, Essex, UK). To prevent unwanted electrochemical contributions, the Ni plate was painted with lacquer (Lacomit Varnish, Agar Scientific, Essex, UK). The configuration of the bulk working electrode (WE) was similar to the one described as NFAg-R in our previous work [18]. The schematic electrochemical cell used for the reduction tests in pellets is described in Figure 1. For comparison purposes, the Fe2TiO5 composition was crushed into powder (<17 µm) in order to prepare alkaline ceramic suspensions (100 g/L, 10 M NaOH). The alkaline suspensions were magnetically stirred (100 rpm) and used as an electrolyte in the process of electrodeposition of Fe0 on an iron nail (WE, 1 cm2). In suspension mode, the bare iron nail was placed in the cell instead of the Ni plate + ceramic cathode and the electrolyte was filled with the iron oxides suspension. An Autolab PGSTAT302N potentiostat (Metrohm, Herisau, Switzerland) was used for cyclic voltammetry studies (−1.2 V to 0 V; 10 mV/s) and for the electrochemical reduction under galvanostatic mode (1 A/cm2) or at potentiostatic mode at potentials such as −1.30 V, −1.20 V and −1.15 V. All samples were washed with ethanol after the electrochemical reduction/deposition and dried in a vacuum desiccator to avoid oxidation in air. Faradaic efficiencies were estimated considering the mass difference of each WE before and after the electroreduction, and also attending to the total electric charge passed in the electrochemical cell. Microstructural features of all ceramic cathodes before and after the electrochemical studies were assessed by a scanning electron microscope (SEM), Hitachi SU-70 (Hitachi High-Technologies Corporation, Tokyo, Japan), coupled with energy disperse spectroscopy analysis (EDS), Bruker Quantax 400. Phase composition was studied by X-ray diffraction (XRD) analysis, using a PANalytical XPert PRO diffractometer (Malvern Panalytical, Malvern, UK), CuKα radiation, 2θ = 10°–80°, with a graphite monochromator, with the software Panalytical HighScore Plus 4.7 (PDF-4).

3. Results and Discussion

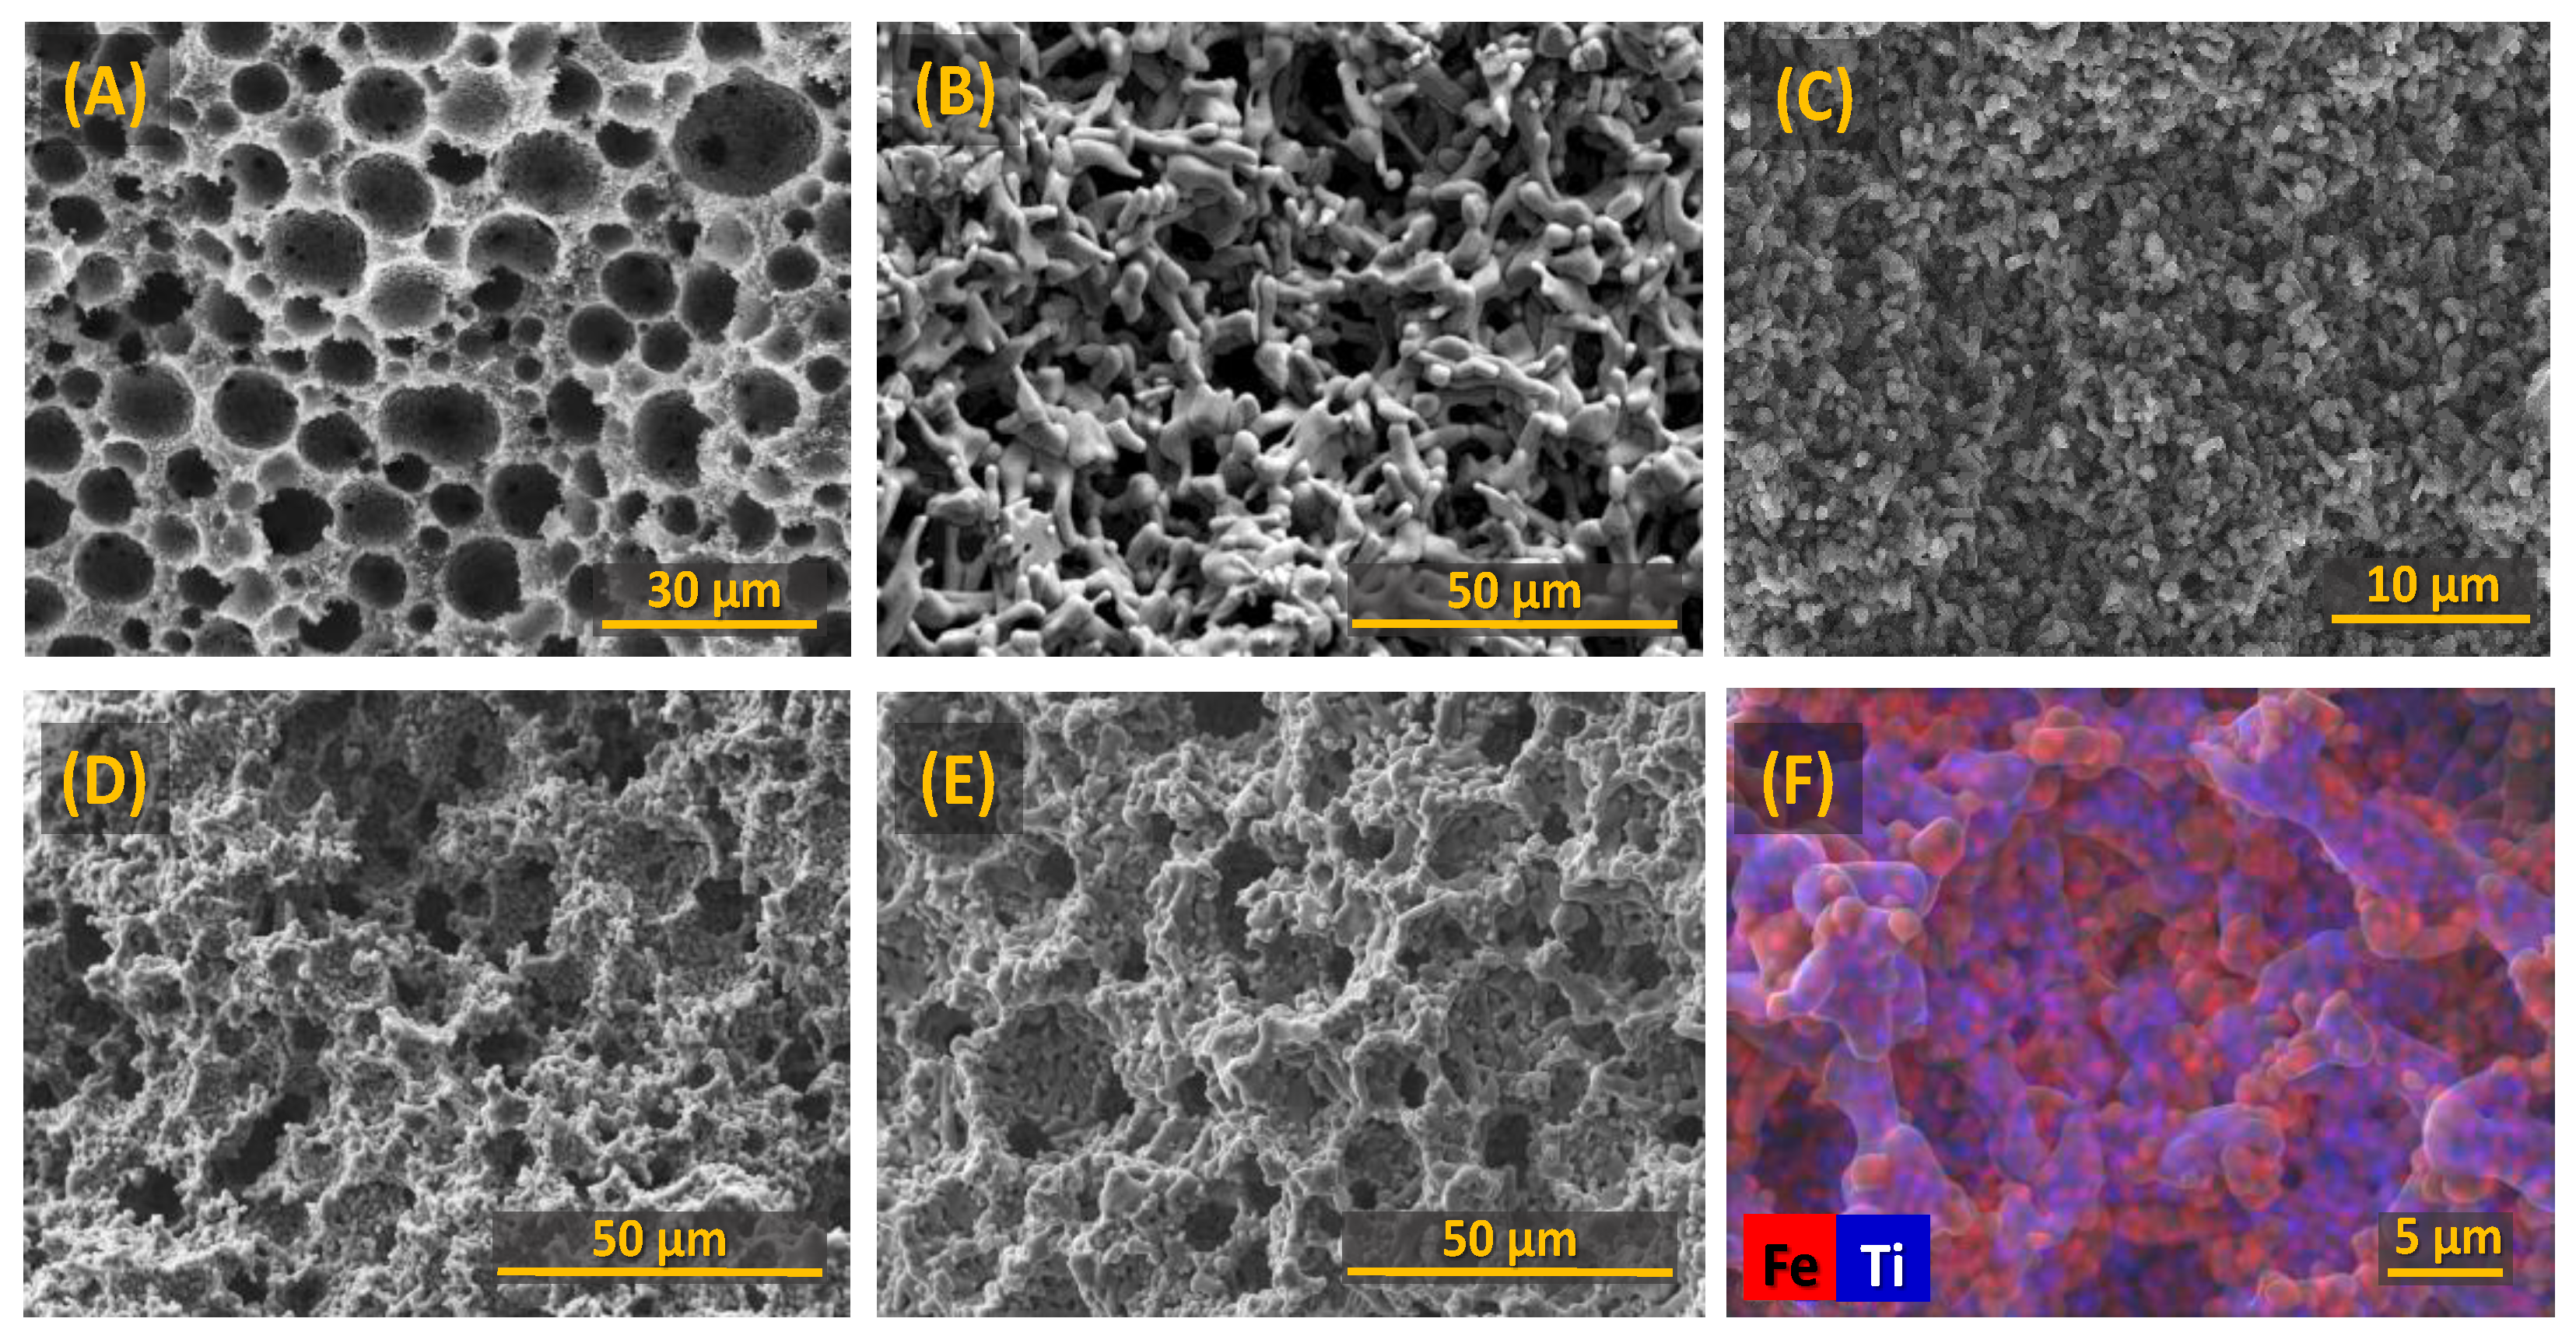
3.1. Structural and Microstructural Features of the Ceramic Cathodes

Previous studies have convincingly demonstrated the importance of porosity and a percolating porous network, facilitating electrolyte access and electrochemical reduction [8,18]. SEM micrographs of the porous ceramic cathodes prepared by the emulsification of aqueous suspension of Fe2O3-TiO2 powders with liquid paraffin are shown in Figure 2, in comparison with the dense Fe2TiO5 cathode. The formation of highly porous cellular ceramics structures with interconnecting channels is clearly visible for the typical calcined green Fe2TiO5 samples (Figure 2A). However, significant microstructural evolution is observed after firing at 1150 °C (Figure 2B), showing the formation of thicker walls composed of elongated Fe2TiO5 grains. This type of microstructure is typical for pseudobrookite-based ceramics, where the highly anisotropic structure promotes the formation of grains with a high aspect ratio, accompanied with significant thermal stresses and formation of microcracks due to anisotropic thermal expansion [32,33]. Such microstructural reorganisation leads to partial collapse of the interconnecting channels and a significant decrease in mechanical strength of the obtained ceramic cathodes. Thus, further firing processes were performed at lower temperatures (1000 to 1150 °C). Ceramic cathodes with various composition and microstructures to ensure a reasonable comparison were prepared, including dense Fe2TiO5 cathodes (Figure 2C); porous Fe2O3 (Figure 2D) and porous Fe2TiO5·Fe2O3 cathodes (Figure 2E). The average diameter of the cell cavities corresponded to ~10 µm. EDS mapping results show a uniform distribution of Fe2TiO5 (blue) and Fe2O3 phases in porous composite Fe2TiO5·Fe2O3 cathodes (Figure 2F), confirmed by the XRD results (Figure 3). The addition of Fe2O3 helps to maintain a well-defined cellular structure after firing. This is illustrated by the comparison of the green ceramics (Figure 2A), where the initial porous skeleton is not yet affected by the grain growth, with the fired Fe2TiO5 showing almost collapsed cellular structure (Figure 2B) and Fe2TiO5·Fe2O3 with clearly observable cellular pores and interconnection channels. Open porosity levels of the cellular samples amounted to 72%, 70% and 56% (vol%), respectively, for Fe2TiO5, Fe2TiO5·Fe2O3 and Fe2O3 compositions, in contrast with the dense Fe2TiO5 cathodes (<3% vol.). The formation of single-phase Fe2TiO5 for both porous and dense cathodes, as well as of Fe2O3 for the hematite porous cathode is confirmed by XRD (Figure 3). The obtained results show that the selected suspension emulsification conditions allow the preparation of pseudobrookite-based cellular ceramics with a designed porosity, adequate for further electroreduction studies.

3.2. Electrochemical Reduction of the Fe-Ti-Bearing Ceramic Cathodes

3.2.1. Studies of the Relevant Redox Processes by Cyclic Voltammetry

General trends of the redox mechanisms occurring in the ceramic cathodes during the electrochemical studies can be obtained from the cyclic voltammograms (CV) represented in Figure 4. The CV analyses were recorded before (t = 0 h) and after (t = 5, 7 h) the electrochemical reduction of the ceramic cathodes, using a scan rate of 10 mV/s. Much lower current densities are observed before the reduction for all the studied cases, due to the generally low electrical conductivity of the samples, in contrast with the plots obtained after reduction, already suggesting the presence of more conductive phases. One should also consider the improvement of the electrical conductivity of the Fe2O3 cathode (10−14 S/cm for Fe2O3 at room temperature [34,35,36]) when combined with titanium, e.g., in the form of Fe2TiO5 [29,37,38,39]. Dense pseudobrookite samples demonstrate a better initial electrochemical behaviour, showing higher current densities (Figure 4A) as compared to porous samples. This generally suggests that, at the initial stage, the electrochemical processes are likely limited by the bulk electrode conductivity. The cathodic (C) and anodic (A) peaks/shoulders of the reduction and oxidation of the iron species, correspondingly, are listed in Table 1. Generally, the reduction of Fe(III) to Fe(II) species in all the compositions tested takes place around ~−1 V (C1) (Figure 4A,C,E), while the reduction to metallic iron occurs in a superimposed region of the voltammogram associated with the hydrogen evolution reaction (HER) due to the water splitting above ~−1.1 V. HER actively competes for the cathodic current during Fe0 formation, decreasing considerably the Faradaic efficiencies, as observed in several works [8,9,13,14,19,20], and it is also responsible for the collapse of ceramic cathodes, as in [18]. The present results confirm the non-direct reduction of hematite-based ceramics to metallic iron, involving a reduction of Fe(III) to Fe(II) aqueous species, where Fe3O4 is usually a well-established intermediate Fe(III)/Fe(II) phase, in accordance with Pourbaix diagrams [40,41]. Moreover, Fe(II) aqueous species such as Fe(OH)3 and mainly HFeO2 from the reductive dissolution of Fe3O4 might be present at the used temperature. The presence of Fe(OH)2 is debatable at temperatures higher than 65 °C [42], but it is still considered in several studies [9,43,44]. One can also consider the dissolution of some Fe(III) species to Fe(OH)4 anions and its reduction to Fe(OH)3 in such strong alkaline media and temperature (~100 °C) [45].
A less cathodic C1 shift of ~0.05 V is observed when comparing dense and porous Fe2TiO5 samples before reduction (Figure 4A). As was previously demonstrated, in porous insulating Fe2O3 cathodes, the electroreduction starts in the vicinity of the current collector and then progresses to the bulk, promoted by the formation of more conductive phases (Fe3O4/Fe). Thus, the electron transfer is facilitated in the vicinity of the current collector, and this might be responsible for the earlier onset of the Fe(III) to Fe(II) reduction in the case of the porous samples. However, it is possible to distinguish Fe0 formation from the HER current contribution only in the porous samples. The Fe0 shoulders (C2) are registered around cathodic potentials between −1.13 V and −1.15 V, in agreement with previous studies on porous hematite and hematite-based ceramics under similar experimental conditions [8,18]. Thus, the cathodic potential of −1.15 V was chosen for further electrochemical tests, despite the wide cathodic range observed in the C2 shoulders. It should be noticed that the studies on the electrochemical reduction of titanomagnetite sands showed higher cathodic peaks at around −1.2 V vs. (Hg|HgO) when using more concentrated alkali electrolytes (18 M) [21]. The decrease in overall Ti content from Fe2TiO5 to Fe2TiO5·Fe2O3 and to Fe2O3 could be responsible for the slight shift to less cathodic polarization (~0.02 V for C2). In fact, this potential shift might be contributed by the different effective Fe3+/Fe2+ concentrations in the samples. Moreover, a combined effect from the presence of Ti as non-soluble species (discussed later on) might lead to blocking of the active electroreduction sites, delaying the electrochemical reduction. During oxidation, one can observe anodic peaks at around ~−0.88 V (A1) and below −0.7 V (A2) due to the oxidation of Fe0 to Fe(II) species, and to Fe(III) species (Fe3O4 and FeOOH), respectively.
When considering the voltammograms after the electroreduction of the ceramic cathodes to Fe0 (Figure 4B,D,F), broader peaks were observed for the Fe2TiO5 and Fe2TiO5·Fe2O3 cathodes but not for the case of Fe2O3. In fact, C1 (Figure 4F) is less pronounced (−7.98 mA/cm2) due to lower content of Fe(II) species in the sample, while C2 is much better defined, indicating higher conversion of Fe(II) species to Fe0 in the sample. Also, a third anodic peak (A0) around −1.04 V was observed. Since A0 is positioned immediately after the potential corresponding to Fe0 formation and HER only takes place at more negative potentials, one expects it to be ascribed to some minor Fe0 oxidation to Fe(II) species, further continued in the process reflected by A1 peak, as in [9,20]. The high conversion to Fe0 in the Fe2O3 samples can also justify the significant shift in the C1 peak to less cathodic potentials (0.1 V) after the electrochemical reduction. On the other hand, broader peaks were found after the eletroreduction for the Fe-Ti ceramic cathodes (Figure 4B,D), most likely due to the slow kinetics of the conversion of iron species when blocked with Ti low-soluble species, similar to a Mg-containing ferrospinel cathode [20].

3.2.2. Chronoamperometric Studies of the Dense Fe2TiO5 Ceramic Cathodes

Dense single-phase pseudobrookite cathodes were subjected to chronoamperometric studies aiming at the complete reduction to Fe0 (Figure 5). A multi-step experiment was performed by applying a cathodic potential of −1.15 V, followed by an increase to −1.20 V, due to the absence of any noticeable impact in the current density at low polarizations (Figure 5A), for a maximum period of 7 h.
Relatively low current densities were also reached when a second single experiment was performed, by increasing the cathodic polarization to −1.30 V (<30 mA/cm2) for 5 h, also showing noise in the chronoamperometric curve, most likely due to the effects exerted by hydrogen bubbles at the cathode surface.
Post-mortem studies of the ceramic cathodes clearly show signs of delamination and cracks regardless of the cathodic polarization applied. This effect was also observed when decreasing the polarization down to −1.08 V (results not shown), revealing similar cracks between a “greyish” and “reddish” zone, assumed as an Fe2TiO5 electroreduction product and the initial pseudobrookite structure, correspondingly. The “greyish” zone was found near the current collector (CC), while the “reddish” was found on the opposite side, as observed on the inset image in Figure 5A.
SEM mapping images show the different morphology of both areas, separated by a surface line (SL). Both areas show the presence of octahedral crystals enriched with iron, which likely correspond to Fe3O4, in agreement with the XRD diffractogram (Figure 5B). The growth of these crystals apparently results in cracks and delamination in the SL area, promoted by significant structural and microstructural rearrangements during the transformation phase of highly anisotropic pseudobrookite into magnetite. Near CC, magnetite crystals surrounded by a nanostructured amorphous anatase phase (needles marked as blue in the mapping images) were found. In fact, this coverage might be responsible for blocking the possible reduction to Fe0 since the conductive Fe3O4 crystals become isolated by the insulating phase. Some of the Fe3O4 crystals show slits and significant porosity in their interior (Figure 5C). Although exact reasons for such behaviour are still unclear, these might be related to excessive hydrogen evolution in the regions where a good electrical connection with the bulk cathode is still maintained, while another part of the cathode surface becomes deactivated due to the formation of insulating TiO2 phases.
The electrochemical reduction of the Fe2TiO5 composition is significantly limited due to the described phenomena. By using porous ceramic cathodes instead of dense ones, one expects to facilitate the electrochemical reduction to Fe0 due to the percolation of the electrolyte into the cathode bulk, as already proved in previous works [8,18,20]. Moreover, the cracks’ propagation, similar to that presented in inset in Figure 5, followed by losses of electrical contact, is expected to be limited in porous ceramics, as compared to dense ones.

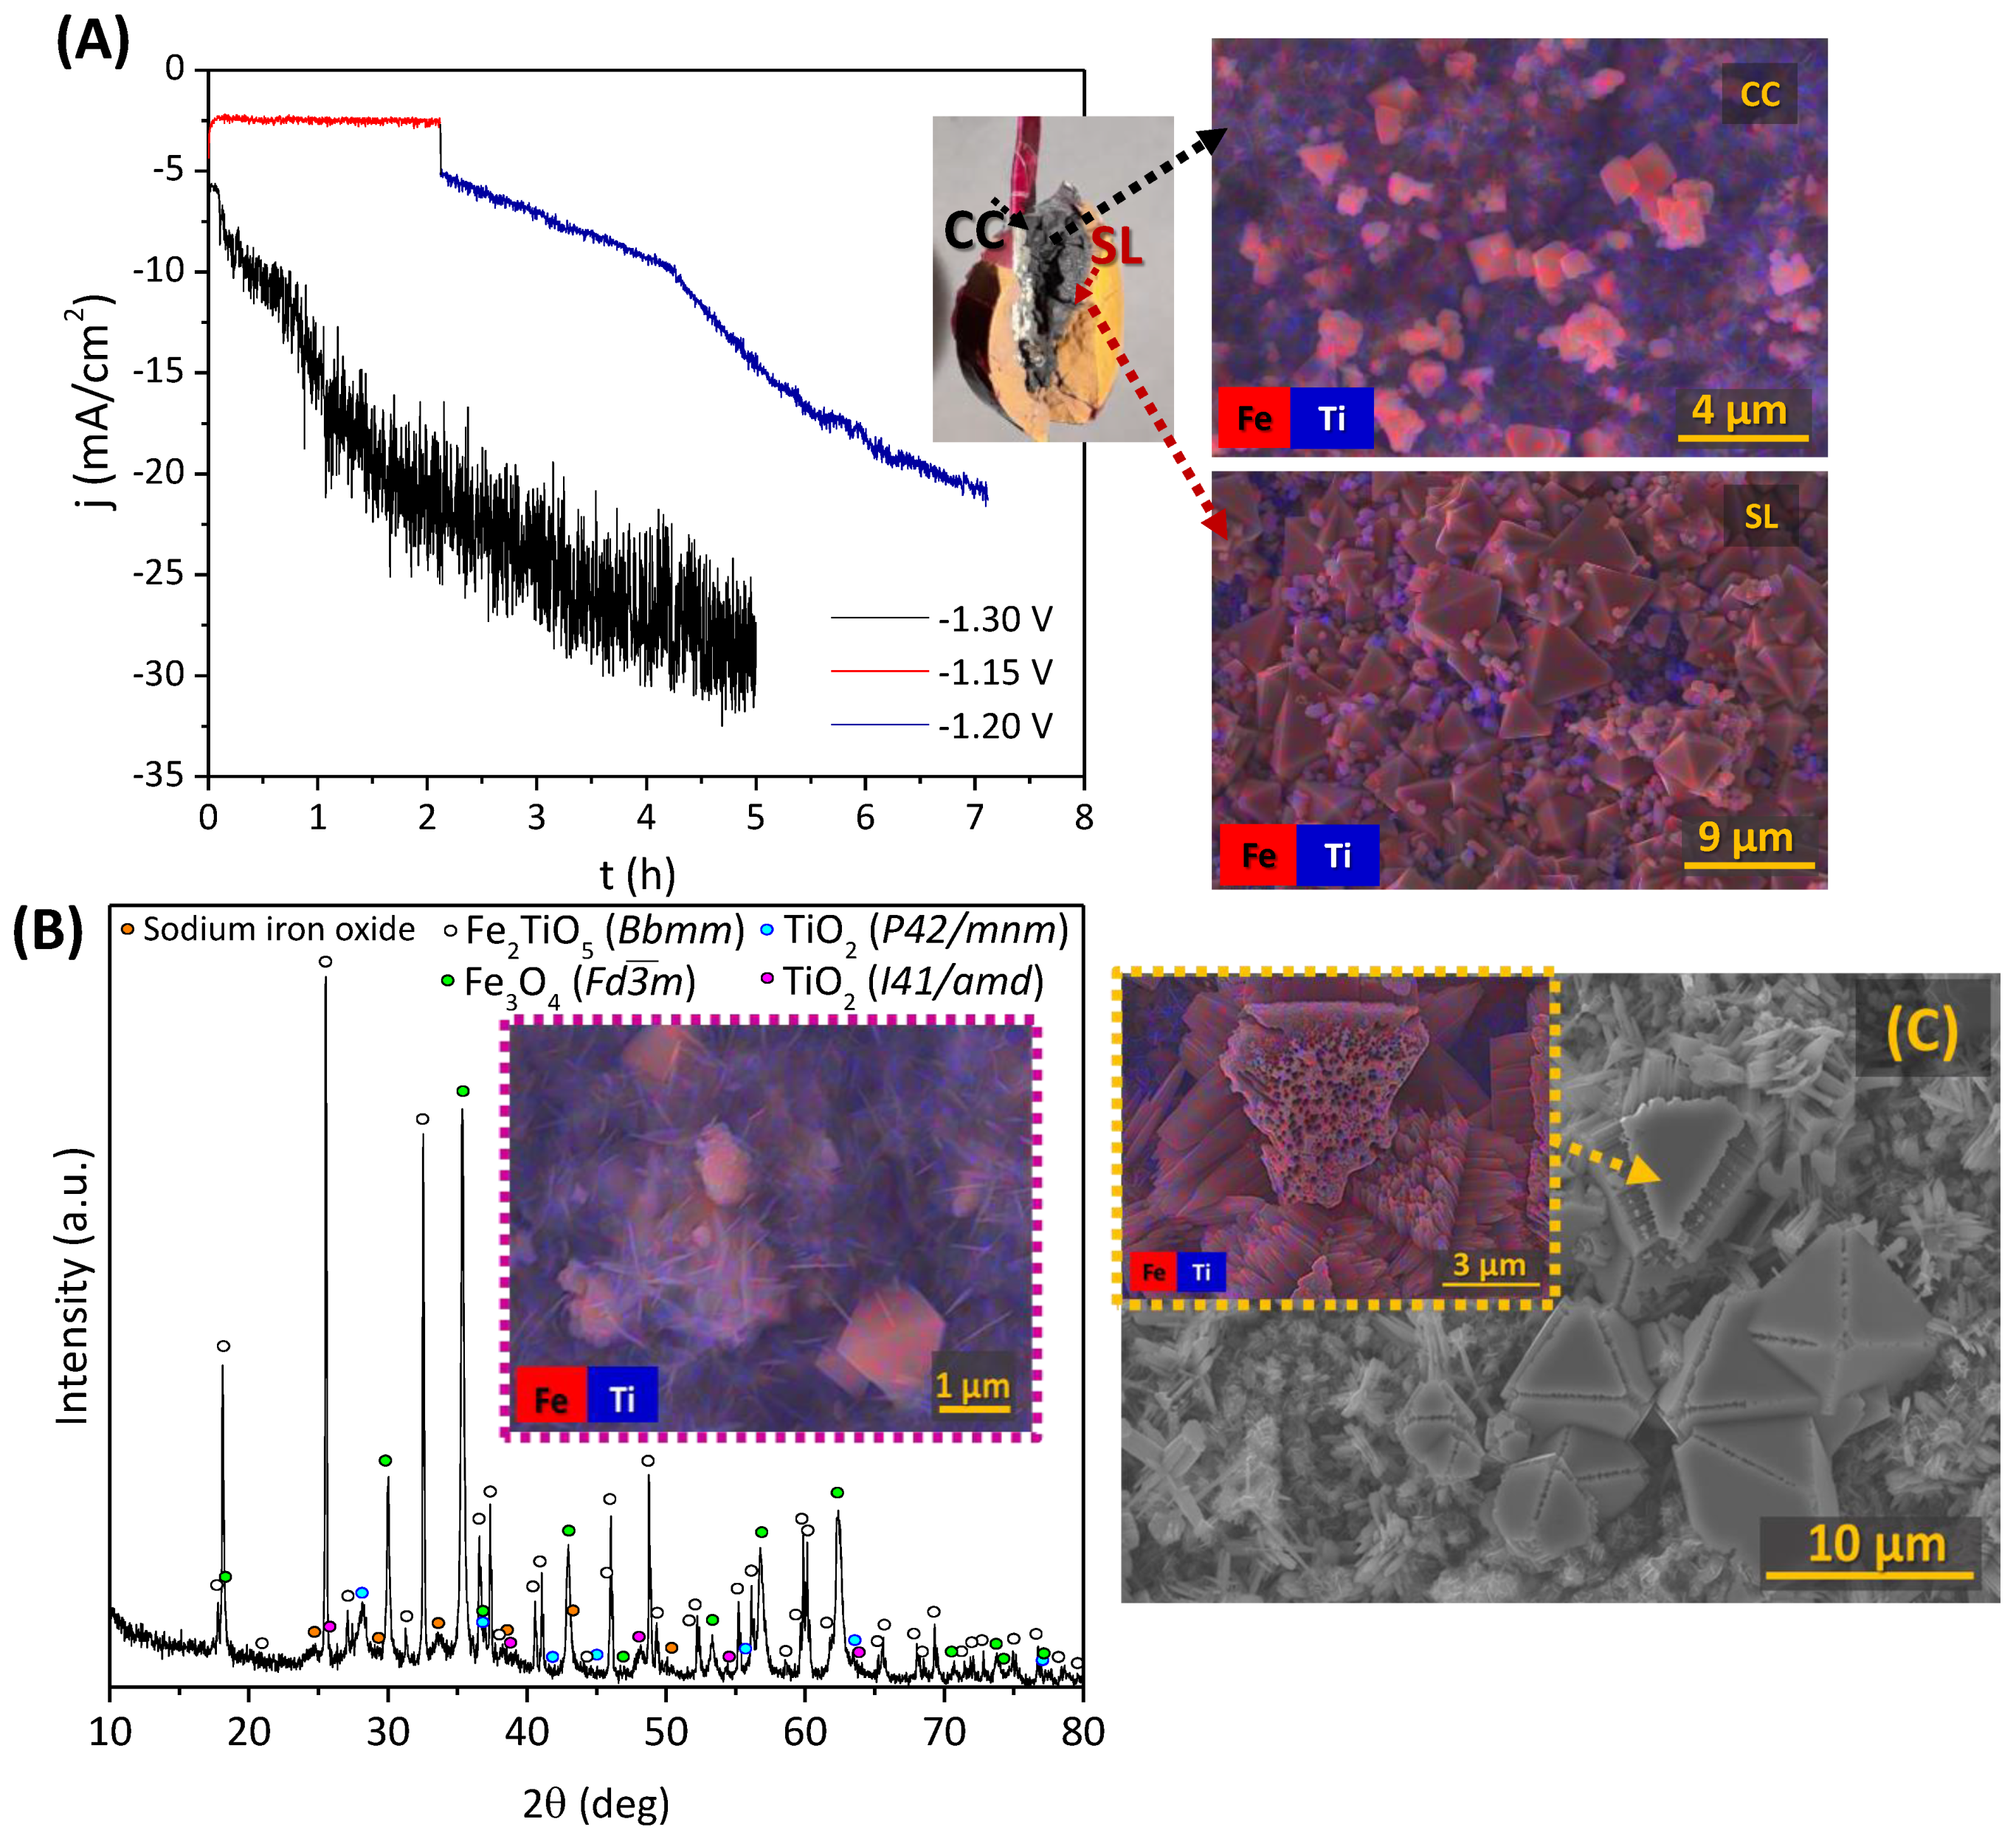
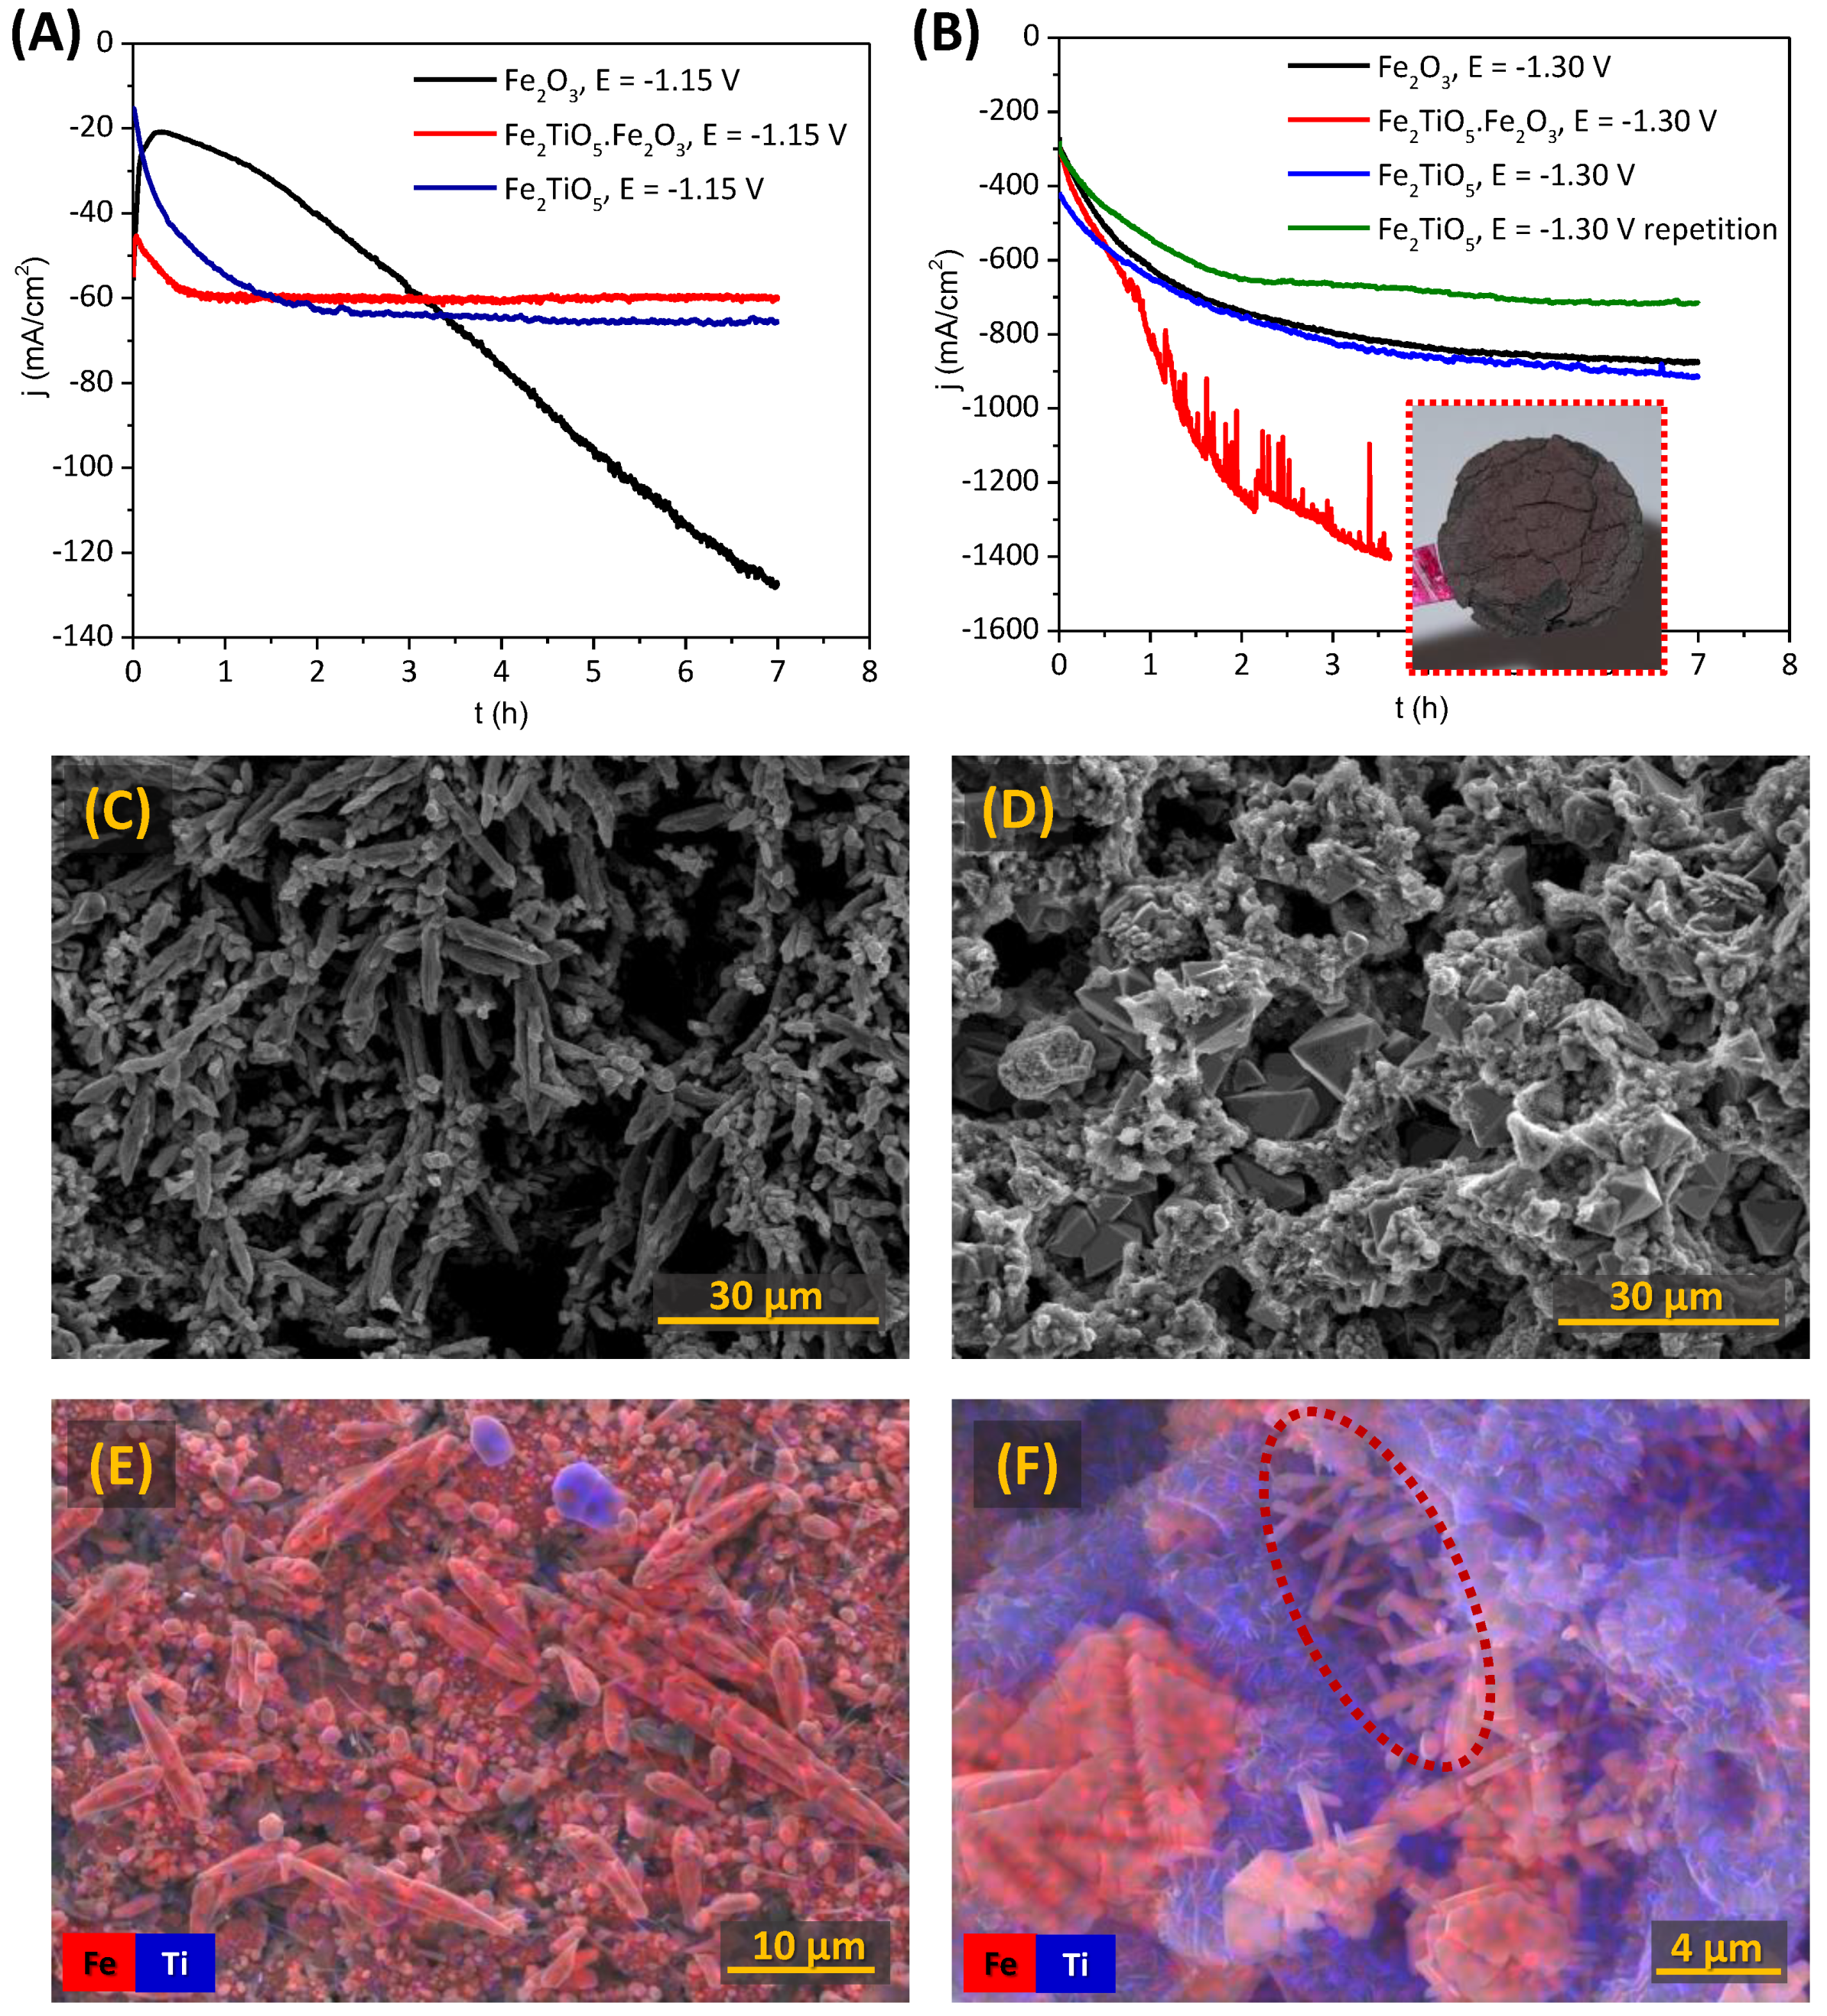
3.2.3. Chronoamperometric Studies of the Porous Cathodes

The results on cathodic reduction of porous cathodes and corresponding microstructural evolution are represented in Figure 6. The electroreduction was performed in potentiostatic mode during 7 h, with polarization of −1.15 V (Figure 6A) and −1.30 V (Figure 6B). The selection of cathodic potential of −1.15 V was based on the results obtained in Table 1 (peak C2). Previously, the electrochemical reduction of porous cathodes was proved to be more effective when compared to dense ones. The presence of pores combined with a suitable interconnectivity between them facilitates the access of the electrolyte and migration of all the ionic species involved in the reduction to Fe0, in agreement with previous studies [8,15,18].
Both Fe2TiO5 and Fe2TiO5·Fe2O3 show similar electrochemical performance, with slower reduction progress after 3 h (65 mA/cm2) and 1 h (60 mA/cm2), respectively. Lower currents observed during the initial stage of the electroreduction of Fe2O3 are likely a result of a higher resistivity of Fe2O3 as compared to Fe2TiO5. During the first 0.3 h, the cathodic current even decreases due to the processes related to the formation of a stable interface between the current collector, cathode pellet and electrolyte, promoted by the electrolyte entrance in the porous cavities. However, Fe2O3 cathodes show continuous progress in the electroreduction, accompanied by a gradual increase of the electrical current, reaching 127 mA/cm2 in 7 h due to the formation of more conductive phases, including Fe0. The reduction is still incomplete after 7 h, as indicated by the absence of a current density plateau after the 7 h of the experiment. The plateau presence and current density decrease, which usually occur after the complete reduction of the cathode to Fe0 can be explained within the three-phase interline (3PI) model proposed by [15,45]. Titanium-bearing cathodes reach stable values of the current much faster than one could expect assuming a high Faradaic efficiency of the reduction under the used experimental conditions. These results suggest the presence of notable kinetic limitations impeding the bulk electroreduction of Ti-bearing cathodes, in accordance with the above-mentioned CV results.
In order to understand better the electrochemical behaviour of Ti-bearing cathodes and establish possible limiting factors, the chronoamperometric studies were performed at fairly more negative cathodic potentials of −1.30 V (Figure 6B). While the plateau can be observed for all tested compositions, with at least 10 times higher current densities, one cannot observe the expected decrease of the current density, indicating complete electroreduction. The reproducibility of the results is, however, quite poor, as illustrated by the green and blue curves corresponding to two different trials of the electroreduction of Fe2TiO5 samples under identical conditions. In the Fe2TiO5·Fe2O3 case, the cathode pellets were partially disintegrated and cracked, as shown in the inset (Figure 6B), likely due to significant mechanical stresses exerted by transformation of phases and excessive (and probably localised) hydrogen evolution. These factors lead to hardly predictable variations of the cathode surface area available for electroreduction. However, the above troubles were never an issue for Fe2O3 cathodes, regardless of the applied potentials.
Corresponding SEM micrographs are shown in Figure 6C–F. The reduction of Fe2O3 occurs as expected, with dendritic Fe0 growth (Figure 6C) observed at both potentials used for the cathodic reduction. In the case of Fe2TiO5·Fe2O3 cathodes, octahedral crystals (most likely Fe3O4) appear inside the porous structures (Figure 6D), indicating the incomplete electroreduction. On the other hand, the post-mortem analysis of the Fe2TiO5 cathodes reveals interesting results, showing the formation of few dendritic Fe0 growths near CC, when −1.30 V was applied in Figure 6E (SEM image of the sample from the blue curve in Figure 6B). However, the results are poorly reproducible, since another sample tested under similar conditions showed mostly the formation of octahedral crystals in the pores (Figure 6F, SEM image of the sample from the green curve in Figure 6B). Still, for this sample, one observed the presence of micro-rods enriched with iron, which, to a certain extent, resemble the structure of the typical Fe0 dendrites. The latter suggests that complete electroreduction of the Fe2TiO5 cathodes under the discussed conditions might still be possible but is progressively blocked by the simultaneous formation of TiO2 phases, limiting the electrical contact between Fe-enriched conducting products.
XRD patterns after the electroreduction are shown in Figure 7, in fair agreement with the results presented in Figure 6. The presence of Fe0 is obvious in the Fe2O3 samples (Figure 6A), where around 19 wt% and 81 wt% of Fe0 are present when the cathodic potentials of −1.15 and −1.30 V (not shown) were applied, respectively. Magnetite was also found as a secondary phase, but mostly unreduced Fe2O3 was found, confirming a surface reduction of the pellet, not reaching the core, as mentioned during the chronoamperometry results. Current efficiencies were lower, 20% and 6% for −1.15 and −1.30 V, at 80 °C, when compared with the literature data for porous Fe2O3 samples [8,15,18], due to the higher cathodic polarization used in this work. When increasing the cathodic polarization, the hydrogen evolution reaction lowers the Faradaic efficiency, despite relatively higher current densities being attained. Concerning the reduction of the Fe2TiO5 cathodes, metallic iron was only observed in this composition when high cathodic polarizations of −1.30 V were applied (Figure 6B). Fe2TiO5·Fe2O3 cathodes (Figure 7C) revealed the absence of Fe0. However, both rutile and anatase are found in this sample, likely blocking the electroreduction, as suggested by the microstructural studies. Although this fact actually suggests that the complete electroreduction of Ti-bearing iron oxides might be not feasible under discussed conditions, it may open new prospects for electrochemical conversion of the Ti-bearing minerals into materials with potentially high photocatalytic activity.
In general, the electroreduction of Fe2TiO5 to Fe0 in bulk cathodes appears to be feasible only at high cathodic potentials above −1.30 V. The galvanostatic approach was also attempted and discussed in the next section to bring more insights on the prospects for electrochemical reduction of pseudobrookite.

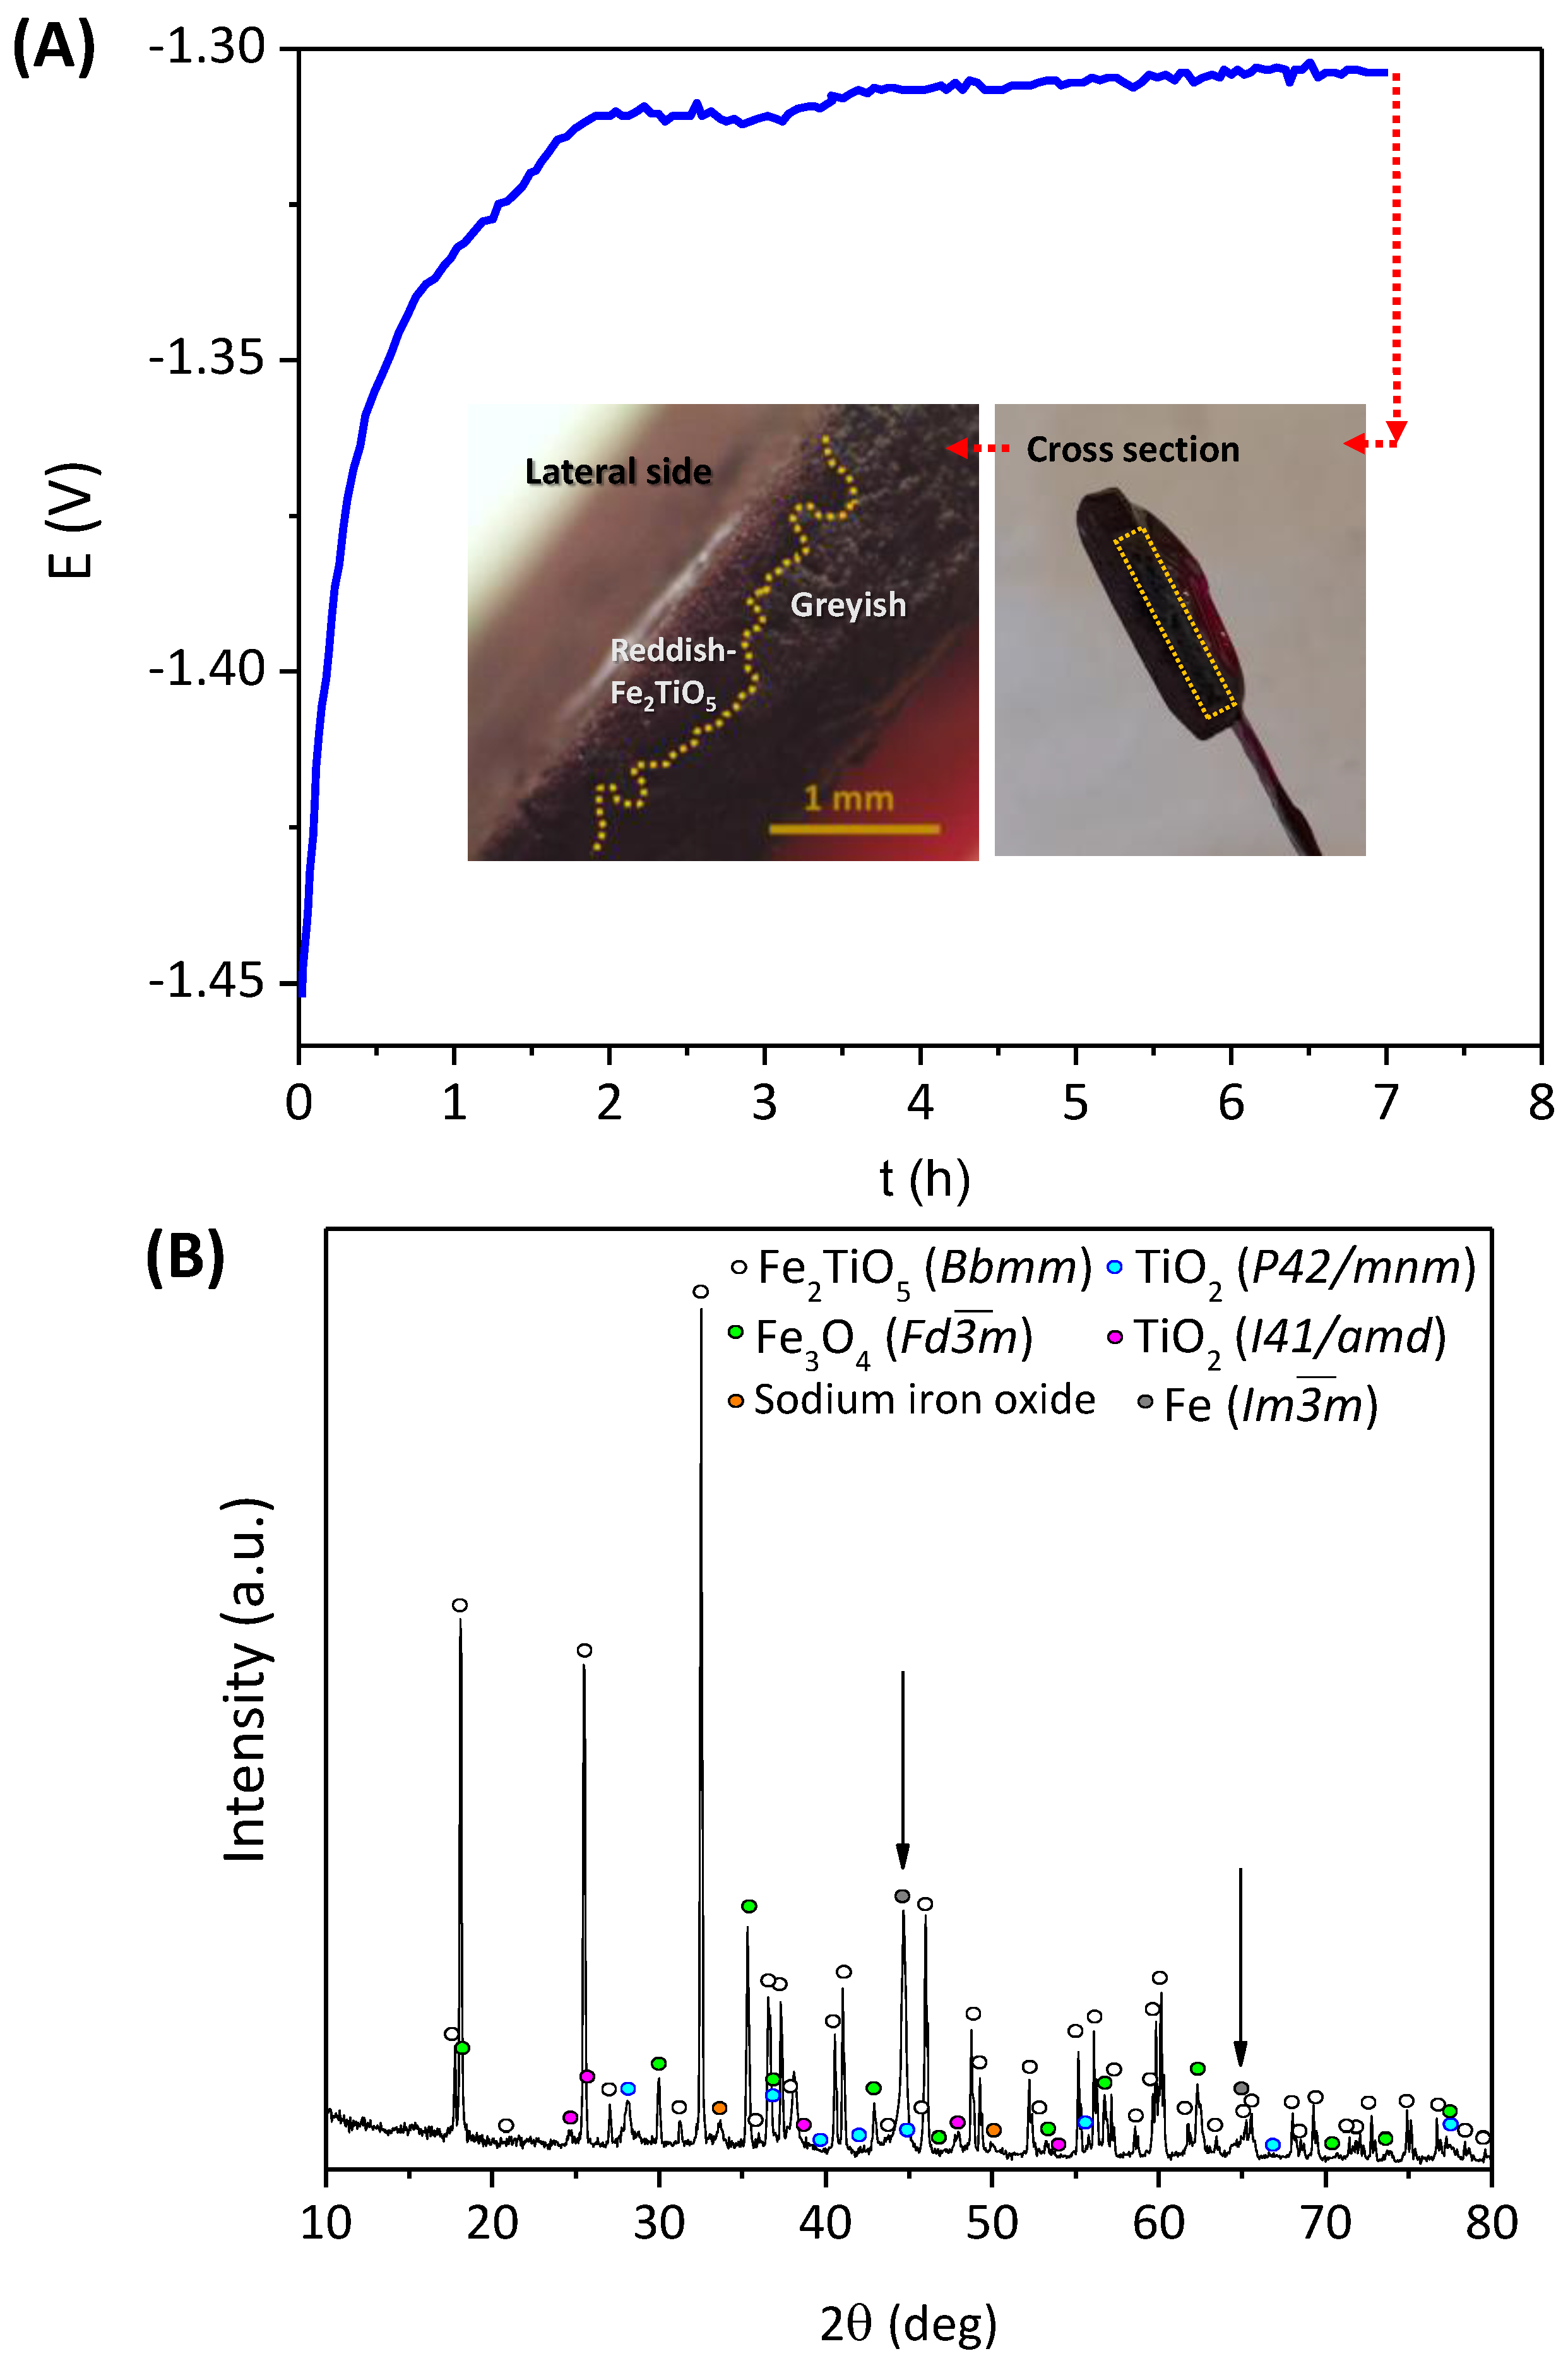
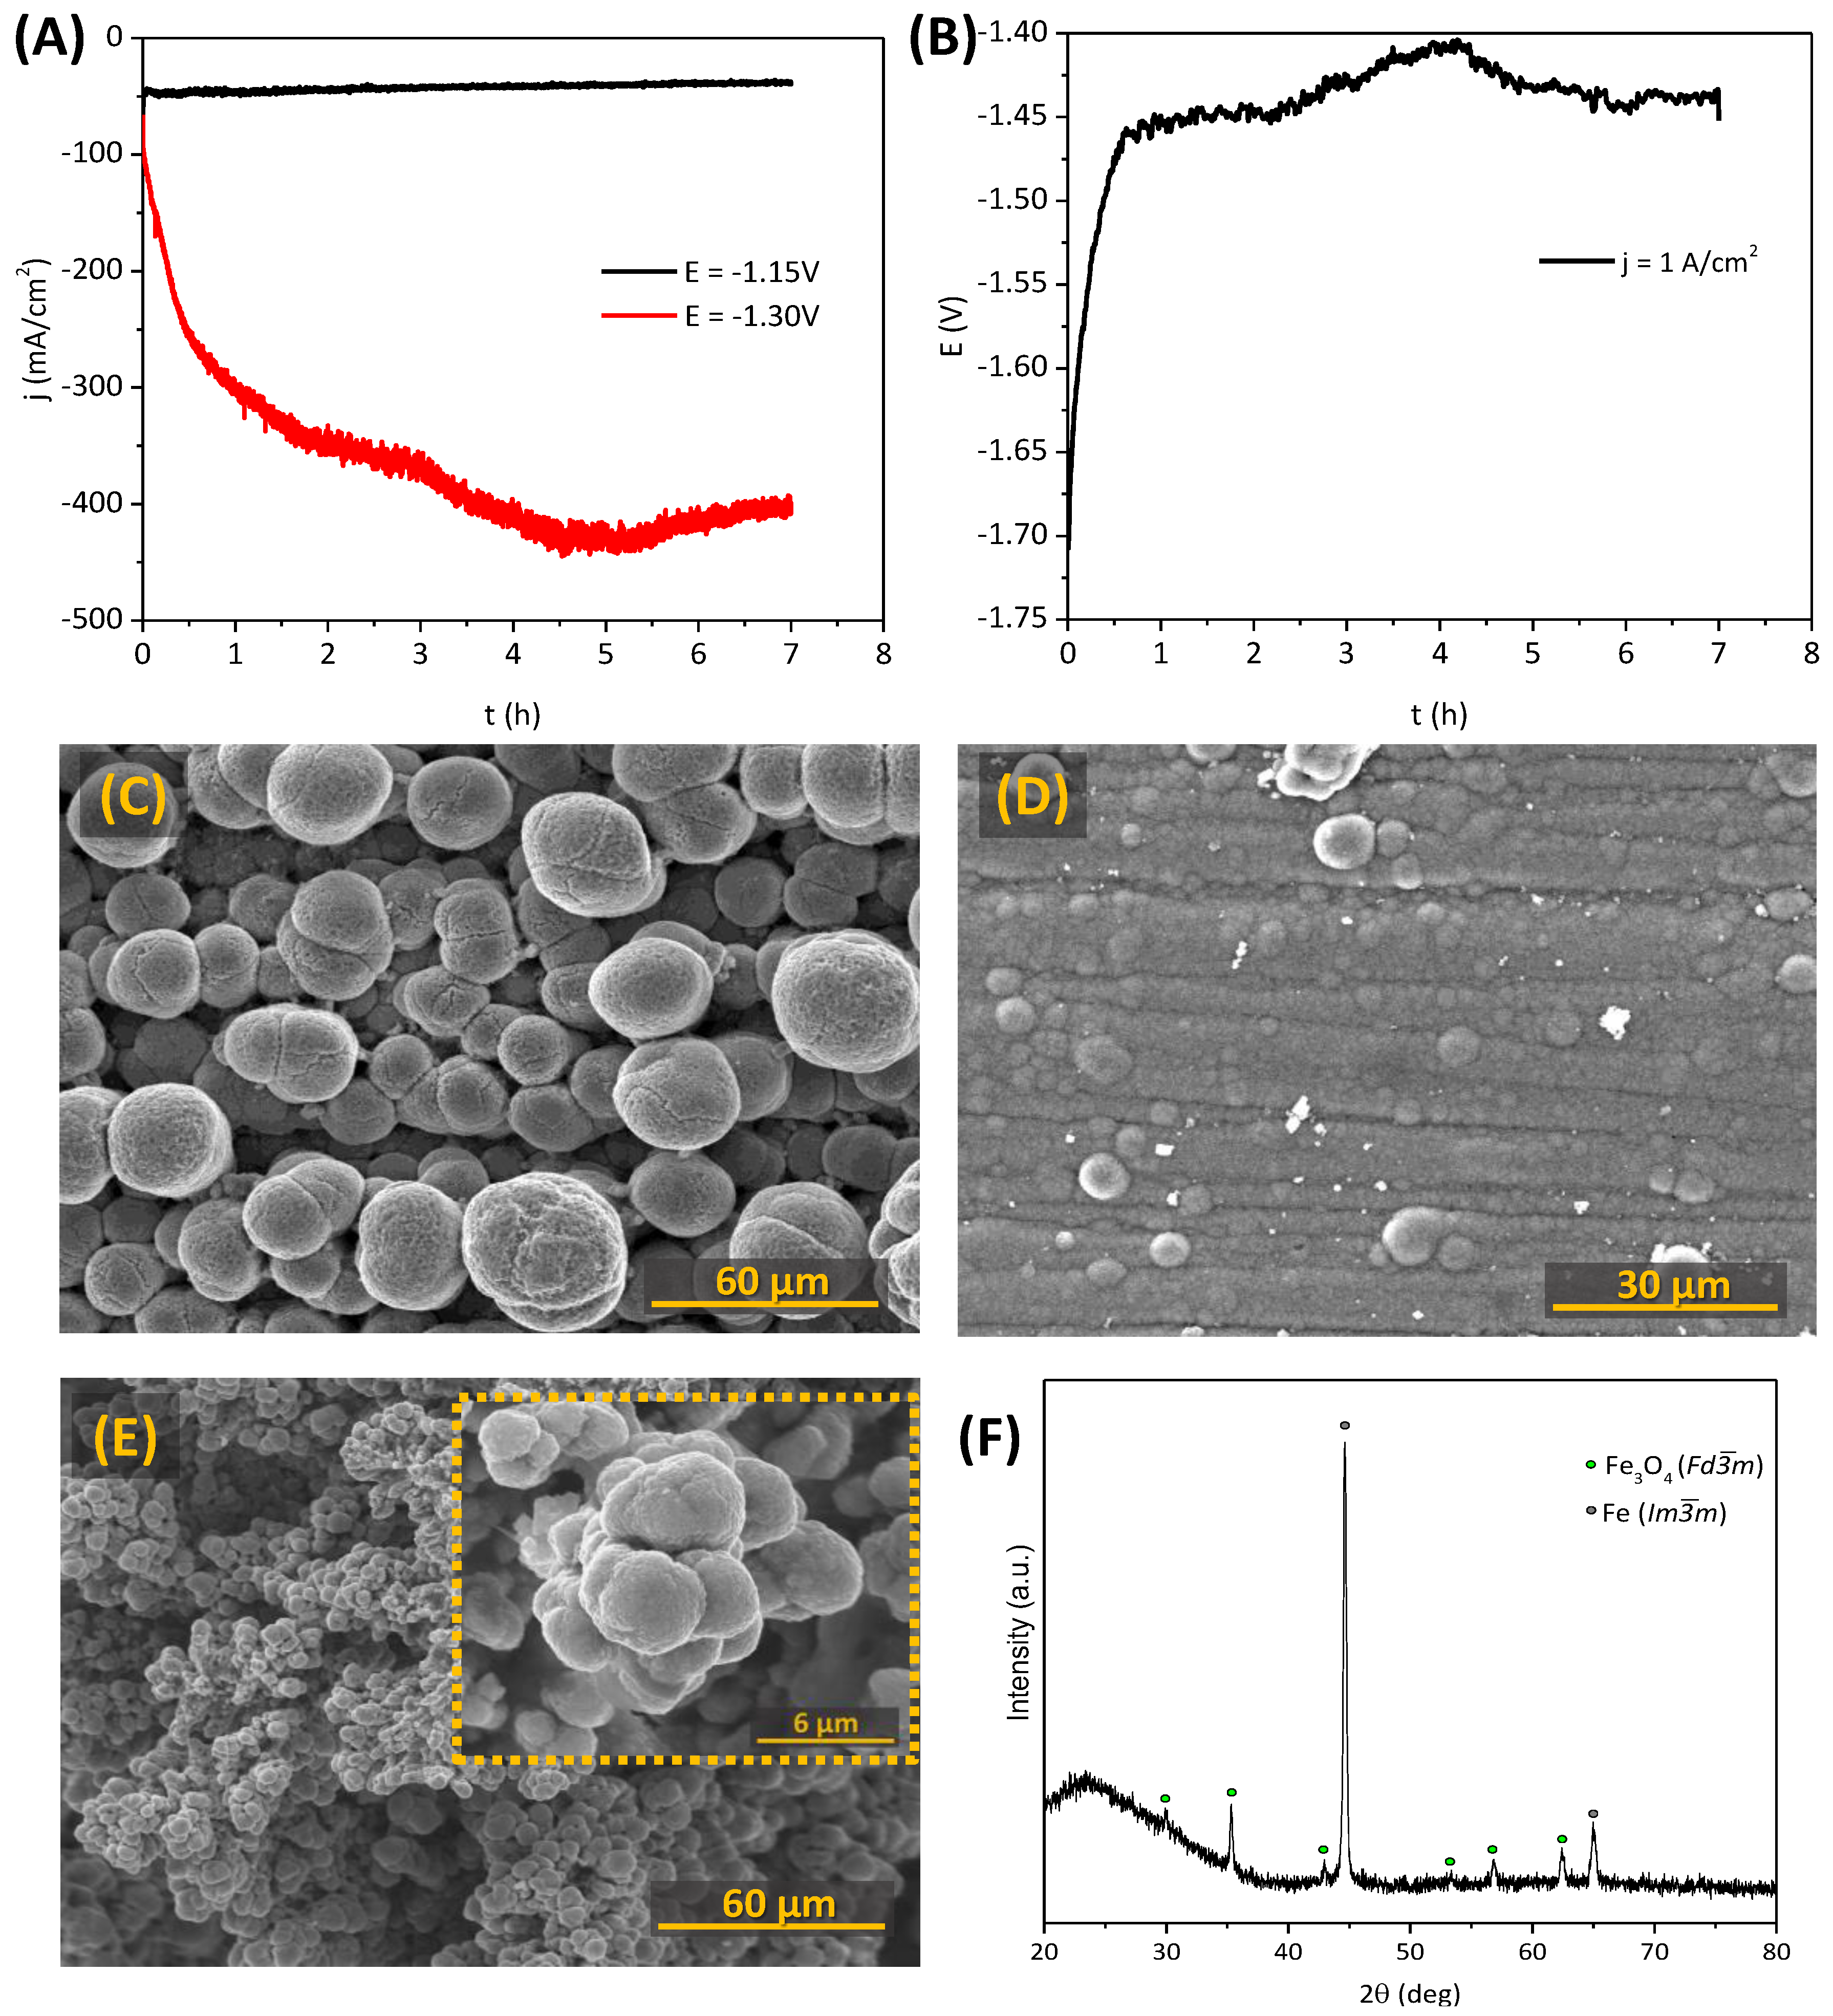
3.2.4. Galvanostatic Electroreduction

Fe2TiO5 ceramic cathodes were tested in the same experimental conditions but under a galvanostatic mode using 1 A/cm2 current density.
Figure 8 shows the potential vs. time curve, together with the notable physical changes of the sample, and its XRD pattern. A non-uniform greyish region was found near CC after the electroreduction, corresponding to the end of the experiment reaching the potentials around −1.30 V. A dense Fe0 layer of 220 µm was found by Bjäreborn et al. [21] at the surface of titanomagnetite when 1 A/cm2 was applied in galvanostatic mode. When higher current densities up to 2.3 mA/cm2 were applied, a thicker layer of porous dendritic Fe0 was observed (340 µm).
In the present work, while the reddish part of the sample can be related to the initial Fe2TiO5 structure (red is the initial colour of pseudobrookite samples), one can detect the presence of Fe0 in the greyish section (<1 wt.%), along with Ti-phases (~4 wt.%), as confirmed by the XRD results presented in Figure 8B. Very low Faradaic efficiencies were obtained in these conditions, since HER also played an important role at such high current densities by competing with the cathodic current for the reduction to Fe0.
Negligible titanium-phases were observed on the Fe0 phase (~1wt.%) in [21], but they were mainly present on the unreduced part of the cathodes. The fate of Ti was assumed to be exsolved as solid inclusions, or to the electrolyte or as phase-segregated solids in the unreduced section of the pellet. Despite the mentioned work involving more concentrated electrolyte and higher temperature for the electrochemical reduction when applying the current density of 1 A/cm2, the significant difference with the present work is associated with using much less titania addition. In the present work, the higher titanium content has a stronger impact on the electroreduction process due to rather pronounced segregation of Ti-containing phases, eventually covering the porous structure and blocking further electrochemical reduction.
More insights on the electrochemical reduction mechanism of Fe2TiO5 can be obtained by analysing the SEM microstructures of the cathodes after the galvanostatic reduction, represented in Figure 9. The SEM images suggest the dissolution–redeposition electrochemical process occurring in the ceramic cathodes. The C1 image represents the typical initial pseudobrookite particle with some “needle” nanostructures formed at the surface related to anatase and rutile, as previously shown in Figure 5B. The crystals marked as red represent the formation of intermediate electroreduction product, Fe3O4, eventually growing and evolving to cluster crystals (C2). The next stage of the Fe3O4 formation is represented by binding those clusters to form larger octahedral crystals that show some “defects” until the final shape is totally formed (C3, C4). Similar micro-rods marked at red as in Figure 6 also can be observed near nanostructured rutile and anatase (C5), possibly indicating the presence of Fe0, as confirmed by the XRD diffractogram. The C4 image clearly shows the blocking of conducting islands composed of red iron-enriched crystals by the blue insulating TiO2 phases. This blocking apparently involves losses of the electrical contact, as discussed before, and hampers the redeposition of iron from dissolved Fe2+ species. The HER effect is expected to be more pronounced at higher potentials, causing partial physical removal of the nanostructured TiO2 phases by hydrogen bubbles. This explains the Fe0 presence when applying higher current densities and potentials (−1.30 V) when compared to −1.15 V, in accordance with the previous XRD diffractograms.

3.3. Electrochemical Reduction of Alkaline Fe2TiO5 Suspensions

The possibility of electroreduction from alkaline Fe2TiO5 suspensions was also evaluated both in potentiostatic and galvanostatic modes, aiming at strategies for feasible industrial application. In this respect, while the electroreduction of bulk cathodes is expected to provide more trends regarding the process mechanism, the electrolysis of ceramic suspensions appears to be suitable for large-scale iron production. The obtained results are represented in Figure 10A. While applying a cathodic polarization of −1.30 V, notably high currents up to 440 mA/cm2 can be reached due to the deposition of a conductive phase, such as Fe0, and corresponding increase of the cathode surface area, followed by a small current density decrease. When applying lower potentials (−1.15 V), the current density decreased by around 20% with time, reaching 39 mA/cm2. In the galvanostatic mode (Figure 10B), the applied potential decreases to −1.40 V and −1.45 V, for reasons similar to those promoting a current increase in Figure 10A. SEM images of all the obtained deposits (Figure 10C–E) show quite distinct microstructures when compared to [13,19,20]. The usual dendritic shape obtained when using Fe2O3-based suspensions in similar electroreduction conditions was not observed in any of the cases. Round and dense nodules can be seen instead, apparently formed from several nanometric crystals. This shape is similar to that observed by Feynerol et al. [14] for goethite alkaline suspensions. However, the XRD pattern of the deposits (Figure 10F) clearly prove the presence of Fe0 along with traces of Fe3O4. Ti-containing phases were not found trapped in the deposits.
Moreover, the observed Fe3O4 phase should not be considered as the common intermediate phase during the reduction in pellets/bulk, but as a phase formed due to the minor oxidation of the samples during their handling. The observed promising results can be explained not only by the use of the high cathodic polarization, when compared with the lower potential-Fe3O4 region in Pourbaix diagrams at 100 °C [42], but also by the specificity of the electroreduction in suspensions. The mechanism is trigged by some adsorption of the particles on the surface of the WE, combined with the Fe(III) dissolution as hydrated Fe(OH)4 anions and its reduction to Fe(II) species as Fe(OH)3. Further reduction results in the deposition of Fe0 on the WE [14,46,47,48]. When increasing the polarization up to −1.30 V, a much denser Fe0 layer was obtained, showing a considerable decrease in the crystal size from 30 µm dispersed nodules to a few clusters (7.5 µm) deposited on a very compact layer of Fe0 crystals. The higher polarization during the galvanostatic electrodeposition lead to even smaller < 5 µm sized dispersed nodules. HER has a stronger effect during higher cathodic polarization, and is possibly responsible for removing some of the Fe0 deposits. The reason possibly lies in the current density decrease and potential increase closer to the end of the experiments, as shown in Figure 10A,B. In general, the observed morphology differences and considerably lower Faradaic efficiencies when compared with pure Fe2O3 suspensions might be linked to combined effects of HER and the presence of sodium iron titanate species in the electrolyte [21,49,50]. Around 25%, 5% and 4% of current efficiencies were obtained with experimental conditions of −1.15 V, −1.30 V and 1 A/cm2, respectively.

4. Conclusions

The electrochemical reduction of a titanium-bearing pseudobrookite mineral, Fe2TiO5, was attempted both in pellet/bulk ceramic cathodes with high porosity and in suspension modes, under strong alkaline conditions (10 M, NaOH). Particular attention was given to the design of highly porous cathodes by the emulsification with liquid paraffin prior to the electroreduction, promoting contact between the electrode and electrolyte. The impact of the high content of titanium on the electroreduction of iron oxides was explored for the first time, by comparative electrochemical studies of Fe2TiO5, Fe2TiO5·Fe2O3 and Fe2O3. Partial reduction followed by the formation of the Fe3O4 crystals in bulk ceramic cathodes is clearly demonstrated by SEM-EDS and XRD studies, a crucial step in the mechanism of reduction. However, further electroreduction was shown to be blocked due to the formation of insulating TiO2 phases, as demonstrated by microstructural studies.
The present results demonstrate the possibility of producing metallic iron from Fe2TiO5 when cathodic polarization higher than −1.30 V are applied or when relatively high cathodic current densities (1 A/cm2) are used in galvanostatic mode. Relatively low Faradaic efficiency, hardly reaching 25%, was attained by the electroreduction from suspensions. In general, Faradaic efficiencies of iron reduction are hampered when using high cathodic polarizations due to the competing hydrogen evolution reaction, destroying the Fe2TiO5·Fe2O3 cathodes. Despite appearing to be not feasible for industrial steel production by the electrowinning process, natural pseudobrookite and other iron-bearing minerals with lower Ti content still can be considered as a feedstock when mixed with other iron rich-materials for a better efficiency of the process. While affecting negatively the electroreduction process, the promoted formation of nanostructured rutile and anatase may open new strategies for the synthesis of composite materials for photocatalytic and catalytic applications, using abundant minerals feedstock.

Author Contributions

Conceptualization, D.V.L. and A.V.K.; visualization, D.V.L. and A.V.K.; methodology, D.V.L., A.D.L., L.C.M.R. and A.A.Y., investigation, D.V.L., A.D.L., L.C.M.R. and A.A.Y.; data curation, D.V.L. and A.D.L.; software, D.V.L. and A.D.L.; formal analysis, D.V.L., A.D.L., L.C.M.R., A.A.Y. and A.V.K.; resources, D.V.L. and A.V.K.; validation, D.V.L., A.D.L., A.A.Y. and A.V.K.; supervision, J.R.F. and A.V.K.; writing—original draft preparation, D.V.L. and A.V.K.; writing—review and editing, D.V.L., A.D.L., L.C.M.R., A.A.Y., J.R.F. and A.V.K.; project administration J.R.F. and A.V.K.; funding acquisition, J.R.F. and A.V.K. All authors have read and agreed to the published version of the manuscript.

Funding

This research was funded by the European Commission by the financial support of the project SIDERWIN- DLV-768788—Horizon 2020/SPIRE10.

Institutional Review Board Statement

Not applicable.

Data Availability Statement

Not applicable.

Acknowledgments

The authors would like to acknowledge the research fellowship BI/UI50/9051/2020 within the SIDERWIN project (SIDERWIN- DLV-768788—Horizon 2020/SPIRE10), and CICECO-Aveiro Institute of Materials (ref. UIDB/50011/2020 & UIDP/50011/2020, and LA/P/0006/2020), financed by national funds through the FCT/MEC (PIDDAK) and when appropriate co-financed by FEDER under the PT2020 Partnership Agreement. Luís C. M. Ruivo acknowledges the Portuguese Foundation for Science and Technology for providing financial support to his PhD scholarship (ref. SFRH/BD/129901/2017). The authors are also grateful to Artur Sarabando (University of Aveiro) for the assistance with the XRD analysis.

Conflicts of Interest

The funders had no role in the design of the study; in the collection, analyses, or interpretation of data; in the writing of the manuscript, or in the decision to publish the results.

References

  1. Mousa, E.A. Modern blast furnace ironmaking technology: Potentials to meet the demand of high hot metal production and lower energy consumption. Metall. Mater. Eng. 2019, 25, 69–104. [Google Scholar] [CrossRef] [Green Version]
  2. World Steel Association. World Steel in Figures, 2020 (Report); World Steel Association: Brussels, Belgium, 2020. [Google Scholar]
  3. Wiencke, J.; Lavelaine, H.; Panteix, P.J.; Petitjean, C.; Rapin, C. The Impact of Iron Oxide Concentration on the Performance of Molten Oxide Electrolytes for the Production of Liquid Iron Metal. Metall. Mater. Trans. B 2020, 51B, 365–376. [Google Scholar] [CrossRef] [Green Version]
  4. Wiencke, J.; Lavelaine, H.; Panteix, P.J.; Petitjean, C.; Rapin, C. Electrolysis of iron in a molten oxide electrolyte. J. Appl. Electrochem. 2018, 48, 115–126. [Google Scholar] [CrossRef] [Green Version]
  5. Allanore, A.; Lavelaine, H.; Valentin, G.; Birat, J.P.; Lapicque, F. Electrodeposition of metal iron from dissolved species in alkaline media. J. Electrochem. Soc. 2007, 154, E187–E193. [Google Scholar] [CrossRef]
  6. Allanore, A.; Lavelaine, H.; Valentin, G.; Birat, J.P.; Lapicque, F. Iron Metal Production by Bulk Electrolysis of Iron Ore Particles in Aqueous Media. J. Electrochem. Soc. 2008, 155, E125–E129. [Google Scholar] [CrossRef]
  7. Allanore, A.; Lavelaine, H.; Valentin, G.; Birat, J.P.; Delcroix, P.; Lapicque, F. Observation and modeling of the reduction of hematite particles to metal in alkaline solution by electrolysis. Electrochim. Acta 2010, 55, 4007–4013. [Google Scholar] [CrossRef]
  8. Ivanova, Y.; Monteiro, J.; Teixeira, L.; Vitorino, N.; Kovalevsky, A.; Frade, J. Designed porous microstructures for electrochemical reduction of bulk hematite ceramics. Mater. Des. 2017, 122, 307–314. [Google Scholar] [CrossRef]
  9. Monteiro, J.; Ivanova, Y.; Kovalevsky, A.; Ivanou, D.; Frade, J. Reduction of magnetite to metallic iron in strong alkaline medium. Electrochim. Acta 2016, 193, 284–292. [Google Scholar] [CrossRef]
  10. Allanore, A.; Lavelaine, H.; Birat, J.P.; Valentin, G.; Lapicque, F. Experimental investigation of cell design for the electrolysis of iron oxide suspensions in alkaline electrolyte. J. Appl. Electrochem. 2010, 40, 1957–1966. [Google Scholar] [CrossRef]
  11. Cavaliere, P. Clean Ironmaking and Steelmaking Processes, 1st ed.; Springer International Publishing: Lecce, Italy, 2019; pp. 555–575. [Google Scholar]
  12. Izaki, M. Electrodeposition of iron and iron alloys. In Modern Electroplating, 5th ed.; Schlesinger, M., Paunovic, M., Eds.; John Wiley & Sons, Inc.: Hoboken, NJ, USA, 2010; pp. 309–326. [Google Scholar]
  13. Ivanova, Y.; Monteiro, J.; Horovistiz, A.; Ivanou, D.; Mata, D.; Silva, R.; Frade, J. Electrochemical deposition of Fe and Fe/CNTs composites from strongly alkaline hematite suspensions. J. Appl. Electrochem. 2015, 45, 515–522. [Google Scholar] [CrossRef]
  14. Feynerol, V.; Lavelaine, H.; Marlier, P.; Pons, M.N.; Lapicque, F. Reactivity of suspended iron oxide particles in low temperature alkaline electrolysis. J. Appl. Electrochem. 2017, 47, 1339–1350. [Google Scholar] [CrossRef]
  15. Zou, X.; Gu, S.; Lu, X.; Xie, X.; Lu, C.; Zhou, Z.; Ding, W. Electroreduction of Iron (III) Oxide Pellets to Iron in Alkaline Media: A Typical Shrinking-Core Reaction Process. Metall. Mater. Trans. B 2015, 46B, 1262–1274. [Google Scholar] [CrossRef] [Green Version]
  16. Maihatchi, A.; Pons, M.-N.; Ricoux, Q.; Goettmann, F.; Lapicque, F. Electrolytic iron production from alkaline suspensions of solid oxides: Compared cases of hematite, iron ore and iron-rich Bayer process residues. J. Electrochem. Sci. Eng. 2020, 10, 95–102. [Google Scholar] [CrossRef] [Green Version]
  17. Koutsoupa, S.; Koutalidi, S.; Bourbos, E.; Balomenos, E.; Panias, D. Electrolytic iron production from alkaline bauxite residue slurries at low temperatures. Johns. Matthey Technol. Rev. 2021, 65, 366–374. [Google Scholar] [CrossRef]
  18. Lopes, D.V.; Ivanova, Y.A.; Kovalevsky, A.V.; Sarabando, A.R.; Frade, J.R.; Quina, M.J. Electrochemical reduction of hematite-based ceramics in alkaline medium: Challenges in electrode design. Electrochim. Acta 2019, 327, 135060. [Google Scholar] [CrossRef]
  19. Lopes, D.V.; Kovalevsky, A.; Quina, M.; Frade, J. Electrochemical deposition of zero-valent iron from alkaline ceramic suspensions of Fe2−xAlxO3 for iron valorisation. J. Electrochem. Soc. 2020, 167, 102508. [Google Scholar] [CrossRef]
  20. Lopes, D.V.; Lisenkov, A.D.; Sergiienko, S.A.; Constantinescu, G.; Sarabando, A.; Quina, M.J.; Frade, J.R.; Kovalevsky, A.V. Alkaline Electrochemical Reduction of a Magnesium Ferrospinel into Metallic Iron for the Valorisation of Magnetite-Based Metallurgical Waste. J. Electrochem. Soc. 2021, 168, 073504. [Google Scholar] [CrossRef]
  21. Bjareborn, O.; Arif, T.; Monaghan, B.; Bumby, C.W. Fate of titanium in alkaline electro-reduction of sintered titanomagnetite. Mater. Res. Express 2020, 7, 106508. [Google Scholar] [CrossRef]
  22. Ruivo, L.C.M.; Pio, D.T.; Yaremchenko, A.A.; Tarelho, L.A.C.; Frade, J.R.; Kantarelis, E.; Engvall, K. Iron-based catalyst (Fe2−xNixTiO5) for tar decomposition in biomass gasification. Fuel 2021, 300, 120859. [Google Scholar] [CrossRef]
  23. Zhao, Q.; Feng, G.; Jiang, F.; Lan, S.; Chen, J.; Liu, M.; Huang, Z.; Liu, J.; Hu, Q.; Jiang, W. Comparison of Fe2TiO5/C photocatalysts synthesized via a nonhydrolytic sol–gel method and solid-state reaction method. RSC Adv. 2020, 10, 43762–43772. [Google Scholar] [CrossRef]
  24. Vasiljevic, Z.Z.; Dojcinovic, M.P.; Vujancevic, J.D.; Jankovic-Castvan, I.; Ognjanovic, M.; Tadic, N.B.; Stojadinovic, S.; Brankovic, G.O.; Nikolic, M. V Photocatalytic degradation of methylene blue under natural sunlight using iron titanate nanoparticles prepared by a modified sol—gel method. R. Soc. Open Sci. 2020, 7, 200708. [Google Scholar] [CrossRef] [PubMed]
  25. Fernando, N.; Swaminathan, J.; Hernandez, F.; Priyadarshana, G.; Sandaruwan, C.; Yang, W.; Karunaratne, V.; Wang, Z.; Amaratunga, G.; Kottegoda, N.; et al. Pseudobrookite based heterostructures for efficient electrocatalytic hydrogen evolution. Mater. Rep. Energy 2021, 1, 100020. [Google Scholar] [CrossRef]
  26. Miskovic, G.; Lukovic, M.D.; Nikolic, M.V.; Vasiljevic, Z.Z.; Nicolics, J.; Aleksic, O.S. Analysis of electronic properties of pseudobrookite thick films with possible application for NO gas sensing. In Proceedings of the 39th International Spring Seminar on Electronics Technology, Pilsen, Czech Republic, 18–22 May 2016; pp. 386–391. [Google Scholar]
  27. Dondi, M.; Matteucci, F.; Cruciani, G.; Gasparotto, G.; Tobaldi, D.M. Pseudobrookite ceramic pigments: Crystal structural, optical and technological properties. Solid State Sci. 2007, 9, 362–369. [Google Scholar] [CrossRef] [Green Version]
  28. Min, K.; Park, K.; Lim, A.; Kim, J.; Kim, D. Synthesis of pseudobrookite-type Fe2TiO5 nanoparticles and their Li-ion electroactivity. Ceram. Int. 2012, 38, 6009–6013. [Google Scholar] [CrossRef]
  29. Nikolic, M.V.; Sekulic, D.L.; Vasiljevic, Z.Z.; Lukovic, M.D.; Pavlovic, V.B.; Aleksic, O.S. Dielectric properties, complex impedance and electrical conductivity of Fe2TiO5 nanopowder compacts and bulk samples at elevated temperatures. J. Mater. Sci. Mater. Electron. 2017, 28, 4796–4806. [Google Scholar] [CrossRef] [Green Version]
  30. Lopes, D.V.; Kovalevsky, A.V.; Quina, M.J.; Frade, J.R. Processing of highly-porous cellular iron oxide-based ceramics by emulsification of ceramic suspensions. Ceram. Int. 2018, 44, 20354–20360. [Google Scholar] [CrossRef]
  31. Hughes, S.W. Archimedes revisited: A faster, better, cheaper method of accurately measuring the volume of small objects. Phys. Educ. 2005, 40, 468–474. [Google Scholar] [CrossRef] [Green Version]
  32. Cleveland, J.; Bradt, R. Grain Size/Microcracking Relations for Pseudobrookite Oxides. J. Am. Ceram. Soc. 1978, 61, 478–481. [Google Scholar] [CrossRef]
  33. Chen, C.; Giovannelli, F.; Duclère, J.R.; Delorme, F. Thermoelectric properties of Fe2(Ti1−xNbx)O5 pseudobrookite ceramics with low thermal conductivity. J. Eur. Ceram. Soc. 2017, 37, 4681–4685. [Google Scholar] [CrossRef]
  34. Morin, F. Electrical properties of αFe2O3 and α-Fe2O3 containing Titanium. Phys. Rev. 1951, 83, 1005–1010. [Google Scholar] [CrossRef]
  35. Guskos, N.; Papadopoulos, G.J.; Likodimos, V.; Patapis, S.; Yarmis, D.; Przepiera, A.; Przepiera, K.; Majszczyk, J.; Typek, J.; Wabia, M.; et al. Photoacoustic, EPR and electrical conductivity investigations of three synthetic mineral pigments: Hematite, goethite and magnetite. Mater. Res. Bull. 2002, 37, 1051–1061. [Google Scholar] [CrossRef]
  36. Lee, K.K.; Deng, S.; Fan, H.M.; Mhaisalkar, S.; Tan, H.R.; Tok, E.S.; Loh, K.P.; Chin, W.S.; Sow, C.H. α-Fe2O3 nanotubes-reduced graphene oxide composites as synergistic electrochemical capacitor materials. Nanoscale 2012, 4, 2958–2961. [Google Scholar] [CrossRef] [PubMed] [Green Version]
  37. Huda, M.N.; Walsh, A.; Yan, Y.; Wei, S.-H.; Al-Jassim, M.M. Electronic, structural, and magnetic effects of 3d transition metals in hematite. J. Appl. Phys. 2010, 107, 123712. [Google Scholar] [CrossRef] [Green Version]
  38. Nikolic, M.V.; Sekulic, D.L.; Nikolic, N.; Slankamenac, M.P.; Aleksic, O.S.; Danninger, H.; Halwax, E.; Pavlovic, V.B.; Nikolic, P.M. Structural and electrical properties of Ti doped α-Fe2O3. Sci. Sinter. 2013, 45, 281–292. [Google Scholar] [CrossRef] [Green Version]
  39. Nikolic, M.V.; Lukovic, M.D.; Vasiljevic, Z.Z.; Labus, N.J.; Aleksic, O.S. Humidity sensing potential of Fe2TiO5—pseudobrookite. J. Mater. Sci. Mater. Electron. 2018, 29, 9227–9238. [Google Scholar] [CrossRef] [Green Version]
  40. Pourbaix, M. Atlas of Electrochemical Equilibria in Aqueous Solutions, 2nd ed.; Cebelcor: Brussels, Belgium, 1974; p. 648. [Google Scholar]
  41. Verink, J.E. Simplified Procedure for Constructing Pourbaix Diagrams. In Uhlig’s Corrosion Handbook, 2nd ed.; Revie, R., Ed.; John Wiley & Sons, Inc.: Hoboken, NJ, USA, 2000; pp. 111–124. [Google Scholar]
  42. Le, H.; Ghali, E. Interpretation des diagrammes E-pH du systeme Fe-H2O en relation avec la fragilisation caustique des aciers. J. Appl. Electrochem. 1993, 23, 72–77. [Google Scholar] [CrossRef]
  43. Armstrong, R.; Baurhoo, I. The dissolution of iron in concentrated alkali. J. Electroanal. Chem. Interfacial Electrochem. 1972, 40, 325–338. [Google Scholar] [CrossRef]
  44. Kitamura, H.; Zhao, L.; Hang, B.T.; Okada, S.; Yamaki, J. Effect of Charge Current Density on Electrochemical Performance of Fe/C Electrodes in Alkaline Solutions. J. Electrochem. Soc. 2012, 159, A720–A724. [Google Scholar] [CrossRef]
  45. Xiao, W.; Jin, X.; Deng, Y.; Wang, D.; Chen, G.Z. Three-phase interlines electrochemically driven into insulator compounds: A penetration model and its verification by electroreduction of solid AgCl. Chem. A Eur. J. 2007, 13, 604–612. [Google Scholar] [CrossRef]
  46. Allanore, A.; Feng, J.; Lavelaine, H.; Ogle, K. The Adsorption of Hematite Particles on Steel in Strongly Alkaline Electrolyte. J. Electrochem. Soc. 2010, 157, E24–E30. [Google Scholar] [CrossRef]
  47. Siebentritt, M.; Volovitch, P.; Ogle, K.; Lefèvre, G. Adsorption and electroreduction of hematite particles on steel in strong alkaline media. Colloids Surfaces A Physicochem. Eng. Asp. 2014, 440, 197–201. [Google Scholar] [CrossRef]
  48. LeDuc, J.A.M.; Loftfield, R.E.; Vaaler, L.E. Electrolytic Iron Powder from a Caustic Soda Solution. J. Electrochem. Soc. 1959, 106, 659–667. [Google Scholar] [CrossRef]
  49. Xue, T.; Wang, L.; Qi, T.; Chu, J.; Qu, J.; Liu, C. Decomposition kinetics of titanium slag in sodium hydroxide system. Hydrometallurgy 2009, 95, 22–27. [Google Scholar] [CrossRef]
  50. Shukaev, I.L.; Butova, V.V.; Chernenko, S.V.; Pospelov, A.A.; Shapovalov, V.V.; Guda, A.A.; Aboraia, A.M.; Zahran, H.Y.; Yahia, I.S.; Soldatov, A.V. New orthorhombic sodium iron(+2) titanate. Ceram. Int. 2020, 46, 4416–4422. [Google Scholar] [CrossRef]
Figure 1. Scheme of the electrochemical cell used for the electroreduction of the samples: WE—working electrode; RE—reference electrode; CE—counter electrode (Pt wire); 1—Luggin capillary; 2—ceramic cathode; 3—Ni plate covered with lacquer (or iron nail in the case of suspensions); 4—electrolyte (NaOH, 10 M); 5—Teflon cell; 6—heating system; 7—hydrogen bubbles; 8—oxygen bubbles.
Materials 15 01440 g001
Figure 2. Micrographs of the ceramic cathodes: (A) typical cellular Fe2TiO5 green monolith (500 °C); (B) cellular Fe2TiO5 (1150 °C); (C) dense Fe2TiO5 (1000 °C); (D) cellular Fe2O3 (1100 °C); (E) cellular Fe2TiO5·Fe2O3 (1150 °C); (F) EDS image of cellular Fe2TiO5·Fe2O3 (1150 °C).
Materials 15 01440 g002
Figure 3. XRD patterns of all the ceramic cathodes and corresponding firing/sintering temperatures.
Materials 15 01440 g003
Figure 4. CV plots before (t = 0 h, green or red for dense pellets) and after (t = 5, 7 h, orange or brown for dense pellets) the electrochemical reduction of (A,B) Fe2TiO5; (C,D) Fe2TiO5·Fe2O3; (E,F) Fe2O3; recorded with 10 mV/s (10 M NaOH, 80 °C).
Materials 15 01440 g004
Figure 5. Electrochemical reduction of Fe2TiO5 dense ceramic cathodes: (A) chronoamperometry at −1.30 V, −1.20 V and −1.15 V (10 M NaOH, 80 °C) and EDS images of the Fe3O4 crystals; (B) typical XRD diffractogram after the electroreduction; (C) SEM + EDS image of Fe3O4 crystals formation.
Materials 15 01440 g005
Figure 6. Electrochemical reduction of the porous Fe2O3, Fe2TiO5·Fe2O3 and Fe2TiO5 ceramic cathodes: (A,B) chronoamperometry at −1.15 V and −1.30 V, respectively (10 M NaOH, 80 °C); typical SEM and EDS mapping images after the electroreduction of the cathodes of (C) Fe2O3 (potentiostatic mode on −1.15 V); (D) Fe2TiO5·Fe2O3 (−1.15 V) and (E,F) Fe2TiO5 (−1.30 V).
Materials 15 01440 g006
Figure 7. XRD diffractograms of the cathodes after the electrochemical reduction of: (A) Fe2O3 (−1.15 V); (B) Fe2TiO5 (−1.30 V); (C) Fe2TiO5·Fe2O3 (−1.15 V).
Materials 15 01440 g007
Figure 8. Galvonostatic electroreduction (1 A/cm2, 7 h): (A) chronopotentiometry results during 7 h, 1 A/cm2; (B) XRD diffractogram of the final bulk pellet.
Materials 15 01440 g008
Figure 9. The microstructural evolution from (C1) to (C5) of the ceramic Fe2TiO5 cathodes reduced under galvanostatic mode, 1A/cm2 during 7 h.
Materials 15 01440 g009
Figure 10. The results obtained for electrochemical deposition from alkaline Fe2TiO5 suspensions during 7 h (10 M NaOH, 80 °C): (A) potentiostatic electrodeposition at −1.15 V and −1.30 V; (B) galvanostatic electrodeposition at 1 A/cm2; SEM images of the deposits after: (C) −1.15 V (potentiostatic); (D) −1.30 V (potentiostatic); (E) 1 A/cm2 (galvanostatic); (F) typical XRD pattern of the deposits.
Materials 15 01440 g010
Table 1. Cathodic and anodic peaks/shoulders from the cyclic voltammograms before and after the electrochemical reduction.
CompositionBefore ReductionAfter Reduction
Cathodic Peaks/Shoulders (V)Anodic Peaks/Shoulders (V)Cathodic
Peaks/Shoulders (V)
Anodic
Peaks/Shoulders (V)
Dense Fe2TiO5C′1 = −1.04
C′2 = −1.14
A′1 = −0.87
A′2 = −0.69
C′1 = −0.92
C’2 = −1.15
-
A′2 = −0.35
Porous Fe2TiO5C1 = −0.99
C2 = −1.15
A1 = −0.88
A2 = −0.68
C1 = −0.91
C2 = −1.14
A1 = −0.85
A2 = −0.59
Porous Fe2TiO5·Fe2O3C1 = −1.01
C2 = −1.15
A1 = −0.88
A2 = −0.67
C1 = −0.91
C2 = −1.13
A1 = −0.84
A2 = −0.59
Porous Fe2O3-
C1 = −0.98
C2 = −1.13
-
A1 = −0.87
A2 = −0.63
-
C1 = −0.88
C2 = −1.12
A0 = −1.04
A1 = −0.89
A2 = −0.59
Publisher’s Note: MDPI stays neutral with regard to jurisdictional claims in published maps and institutional affiliations.

