
Material Extrusion of Structural Polymer–Aluminum Joints—Examining Shear Strength, Wetting, Polymer Melt Rheology and Aging

 , ,
, ,
Abstract
:1. Introduction
- Which of the common thermoplastics for ME is most suitable to generate structural polymer–metal joints? Direct comparison between the studies is not feasible, in particular due to different processing and substrate surface conditions.
- Can structural polymer–metal joints be generated by ME on “simple” practical relevant metal surfaces (e.g., prepared by grid blasting)? In the relevant studies, either a primer was applied beforehand or complex surface preparation methods were used. Moreover, none of the studies considers joint degradation.
2. Materials and Methods
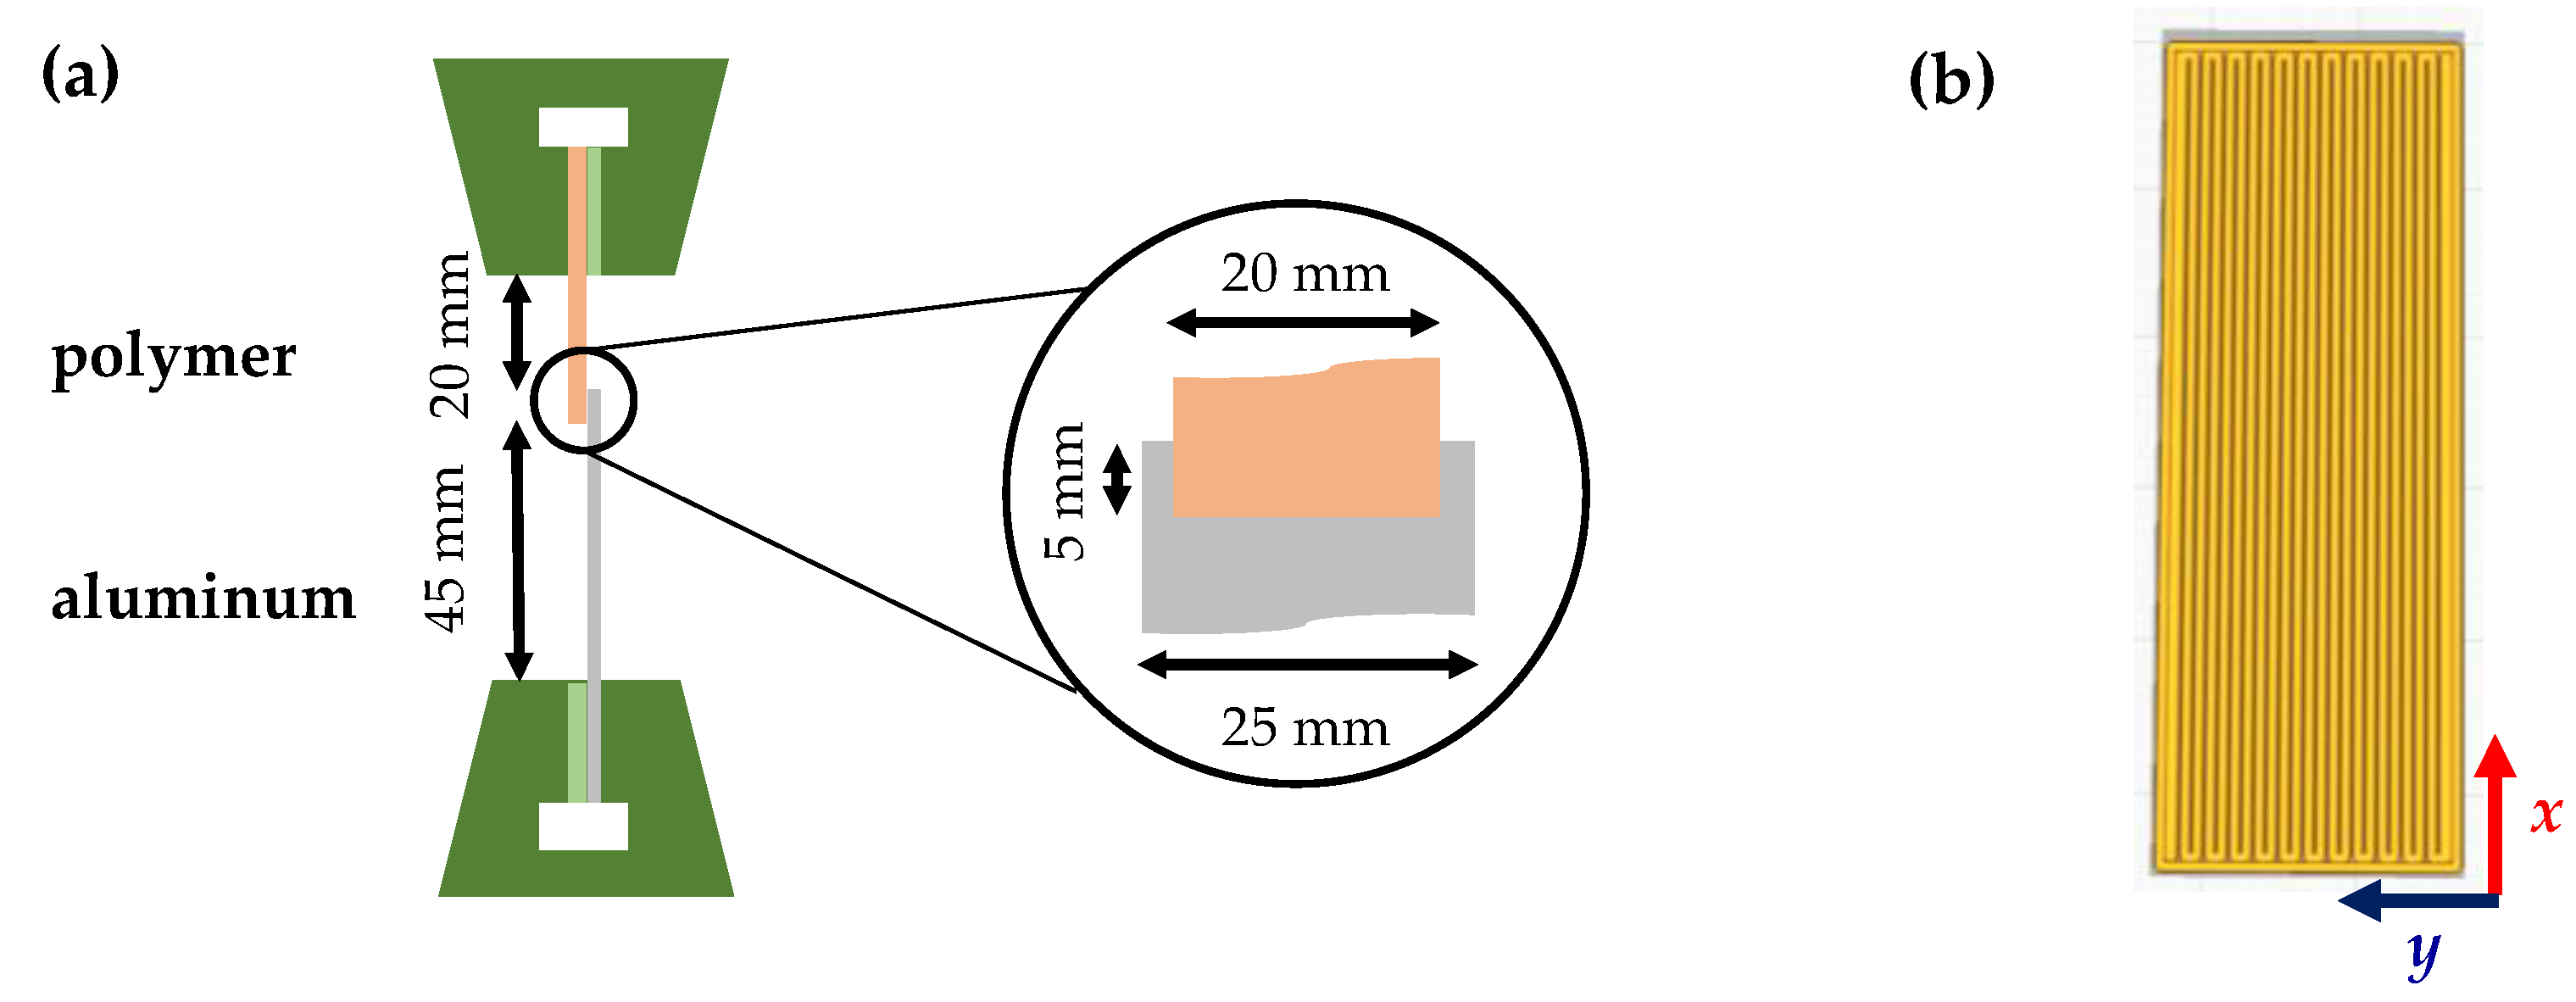
2.1. Aluminum Substrates
2.2. Material Extrusion (ME)
- Acrylonitrile–butadiene–styrene copolymer (ABS), Extrafill™ (Fillamentum, 768 24 Hulín, Czech Republic), yellow-colored filament
- Poly(ethylene terephthalate) glycol comonomer (PETG), PolyLite™ (Polymaker, Shanghai, China), transparent filament
- Poly(lactic acid) (PLA), Ingeo™ 3D870 (Nature Works, Minnetonka, MN, USA), black-colored filament
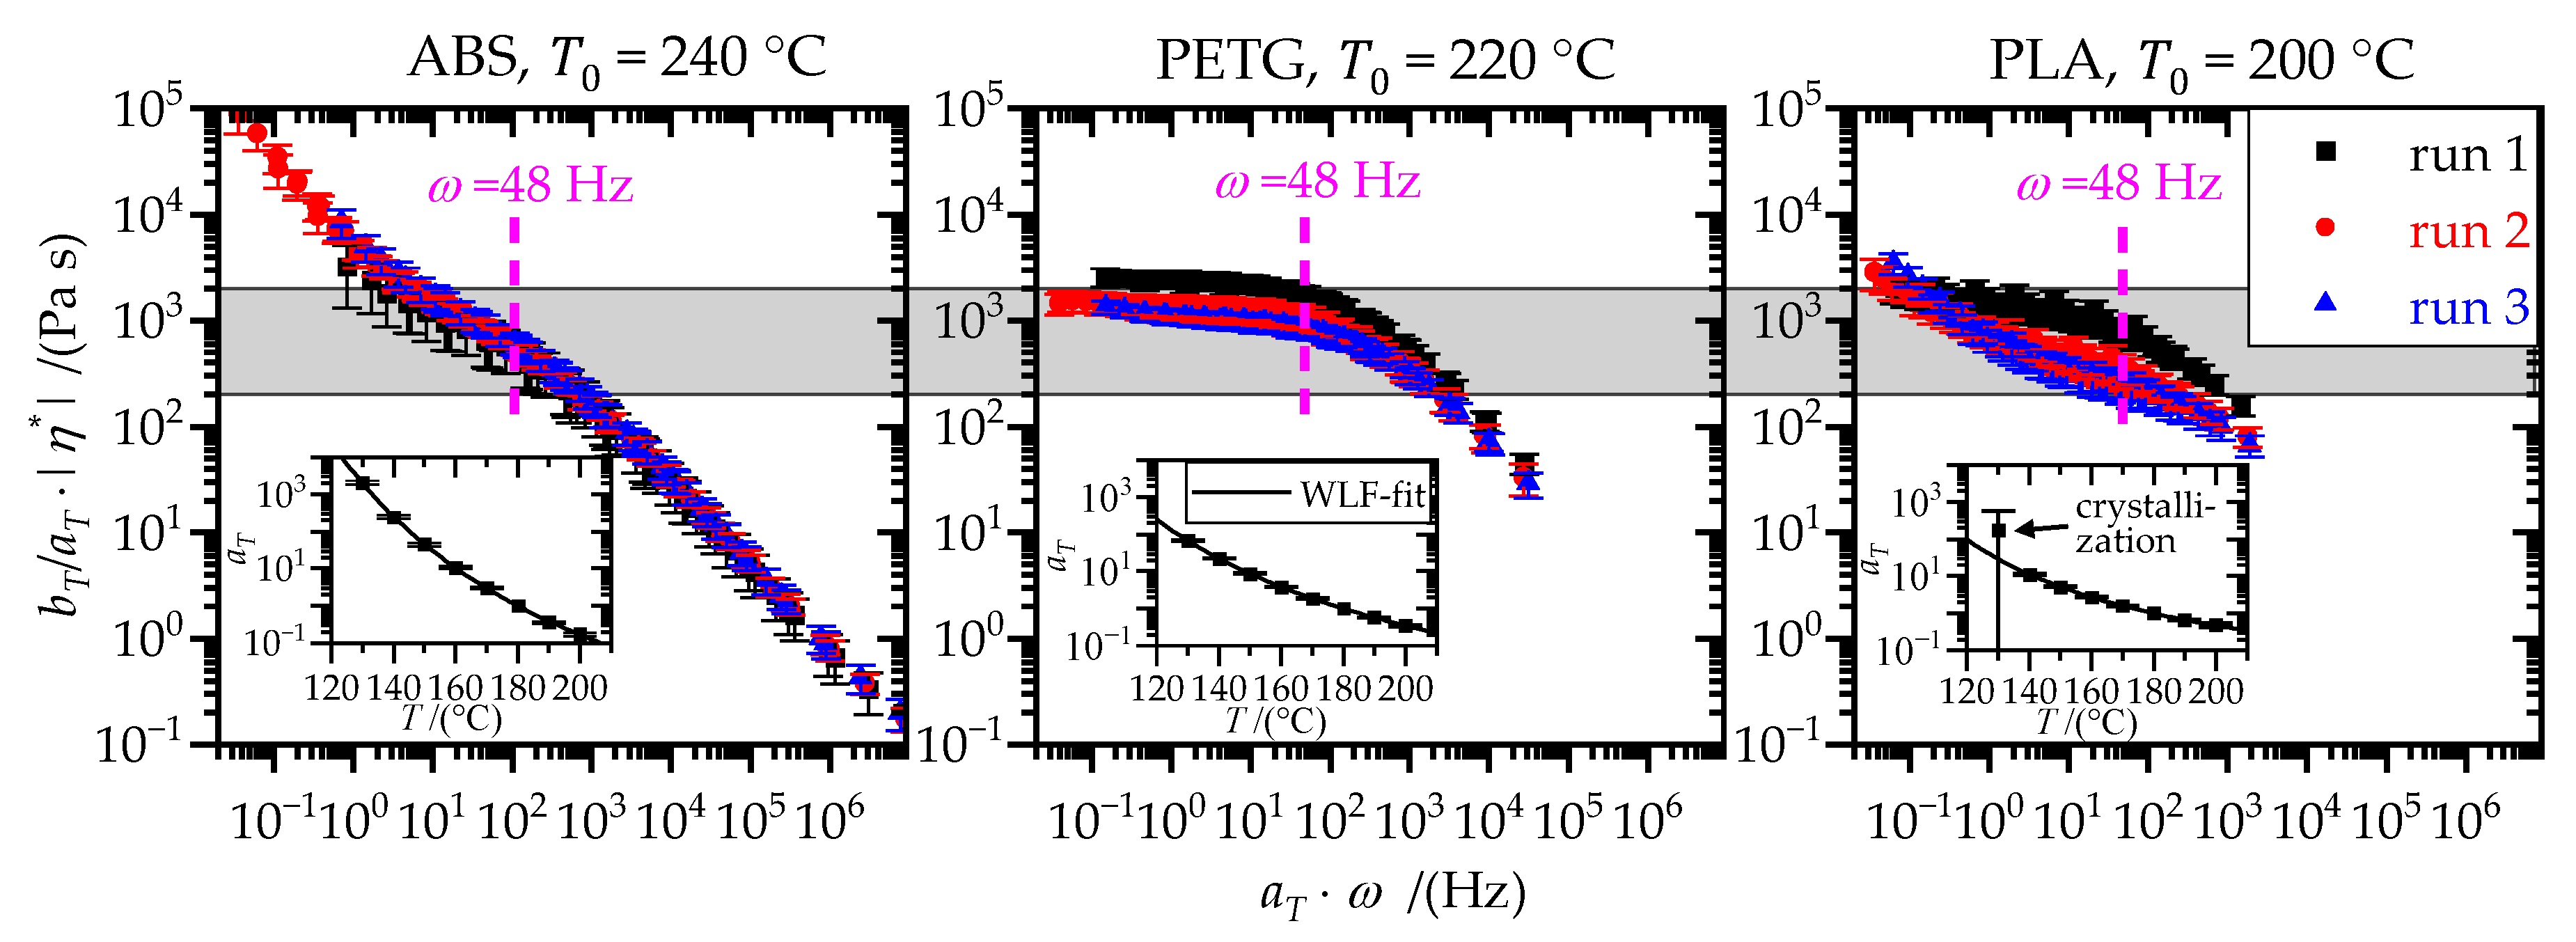
2.3. Rheometry
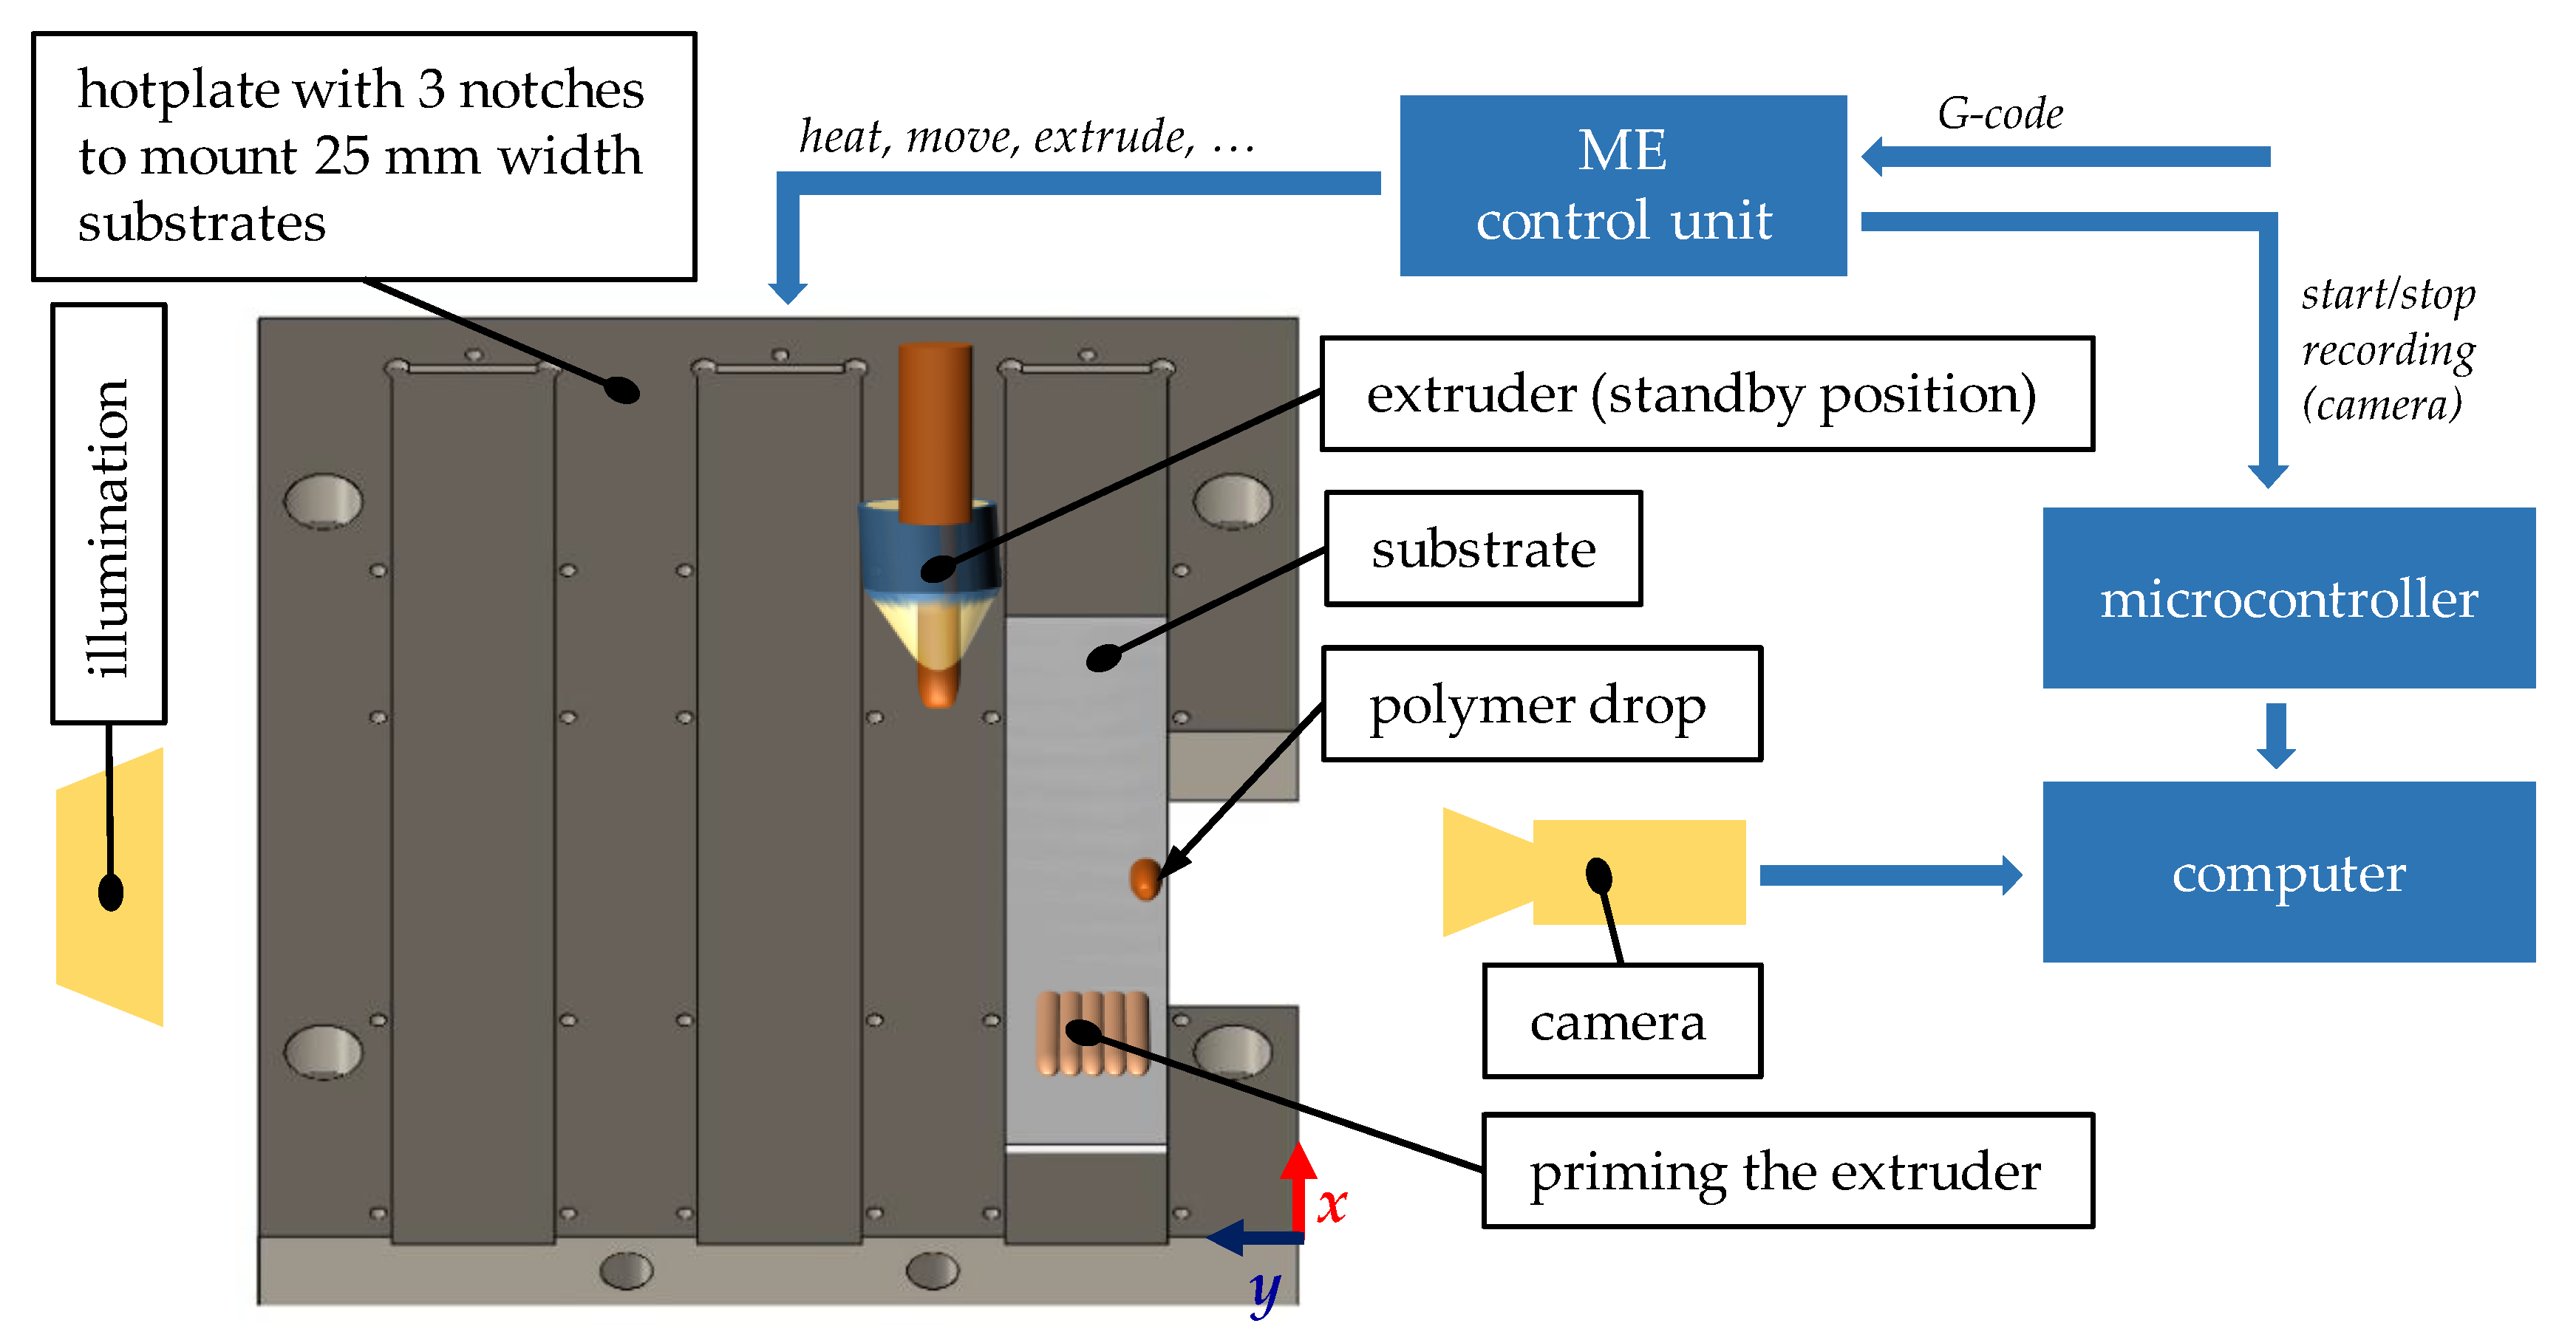
2.4. Wetting
2.5. Mechanical Performance
2.6. Aging
- Aging (moist–warm conditions): Darkness, 40 °C and humid air (75% r. h., setup above saturated NaCl solution [35])
- Storing (dry conditions): Darkness, 23 °C and dry air (<8% r. h., setup above silica gel desiccant)
3. Results and Discussion
3.1. Material Properties
Polymer Melt Rheology
- ABS and degraded PLA (second and third run) behaved like viscoplastic fluids. These types of fluids do not converge to a zero shear viscosity, η0, for low shear rates. Instead, the viscosity continuously increases, as the fluids have a yield stress [46]. This is of great relevance for the thermal wetting and joining processes since there is no external force (except gravity) acting on the polymer (melt) after it leaves the extrusion nozzle.
- The carboxyl-(end-) groups resulting from hydrolysis of PETG and PLA can form strong physical bonds (H-bonding) to the metal substrate [5].
3.2. Wetting
3.3. Adhesion Interface Performance
3.3.1. Influence of Thermal Processing
3.3.2. Aging Resistance
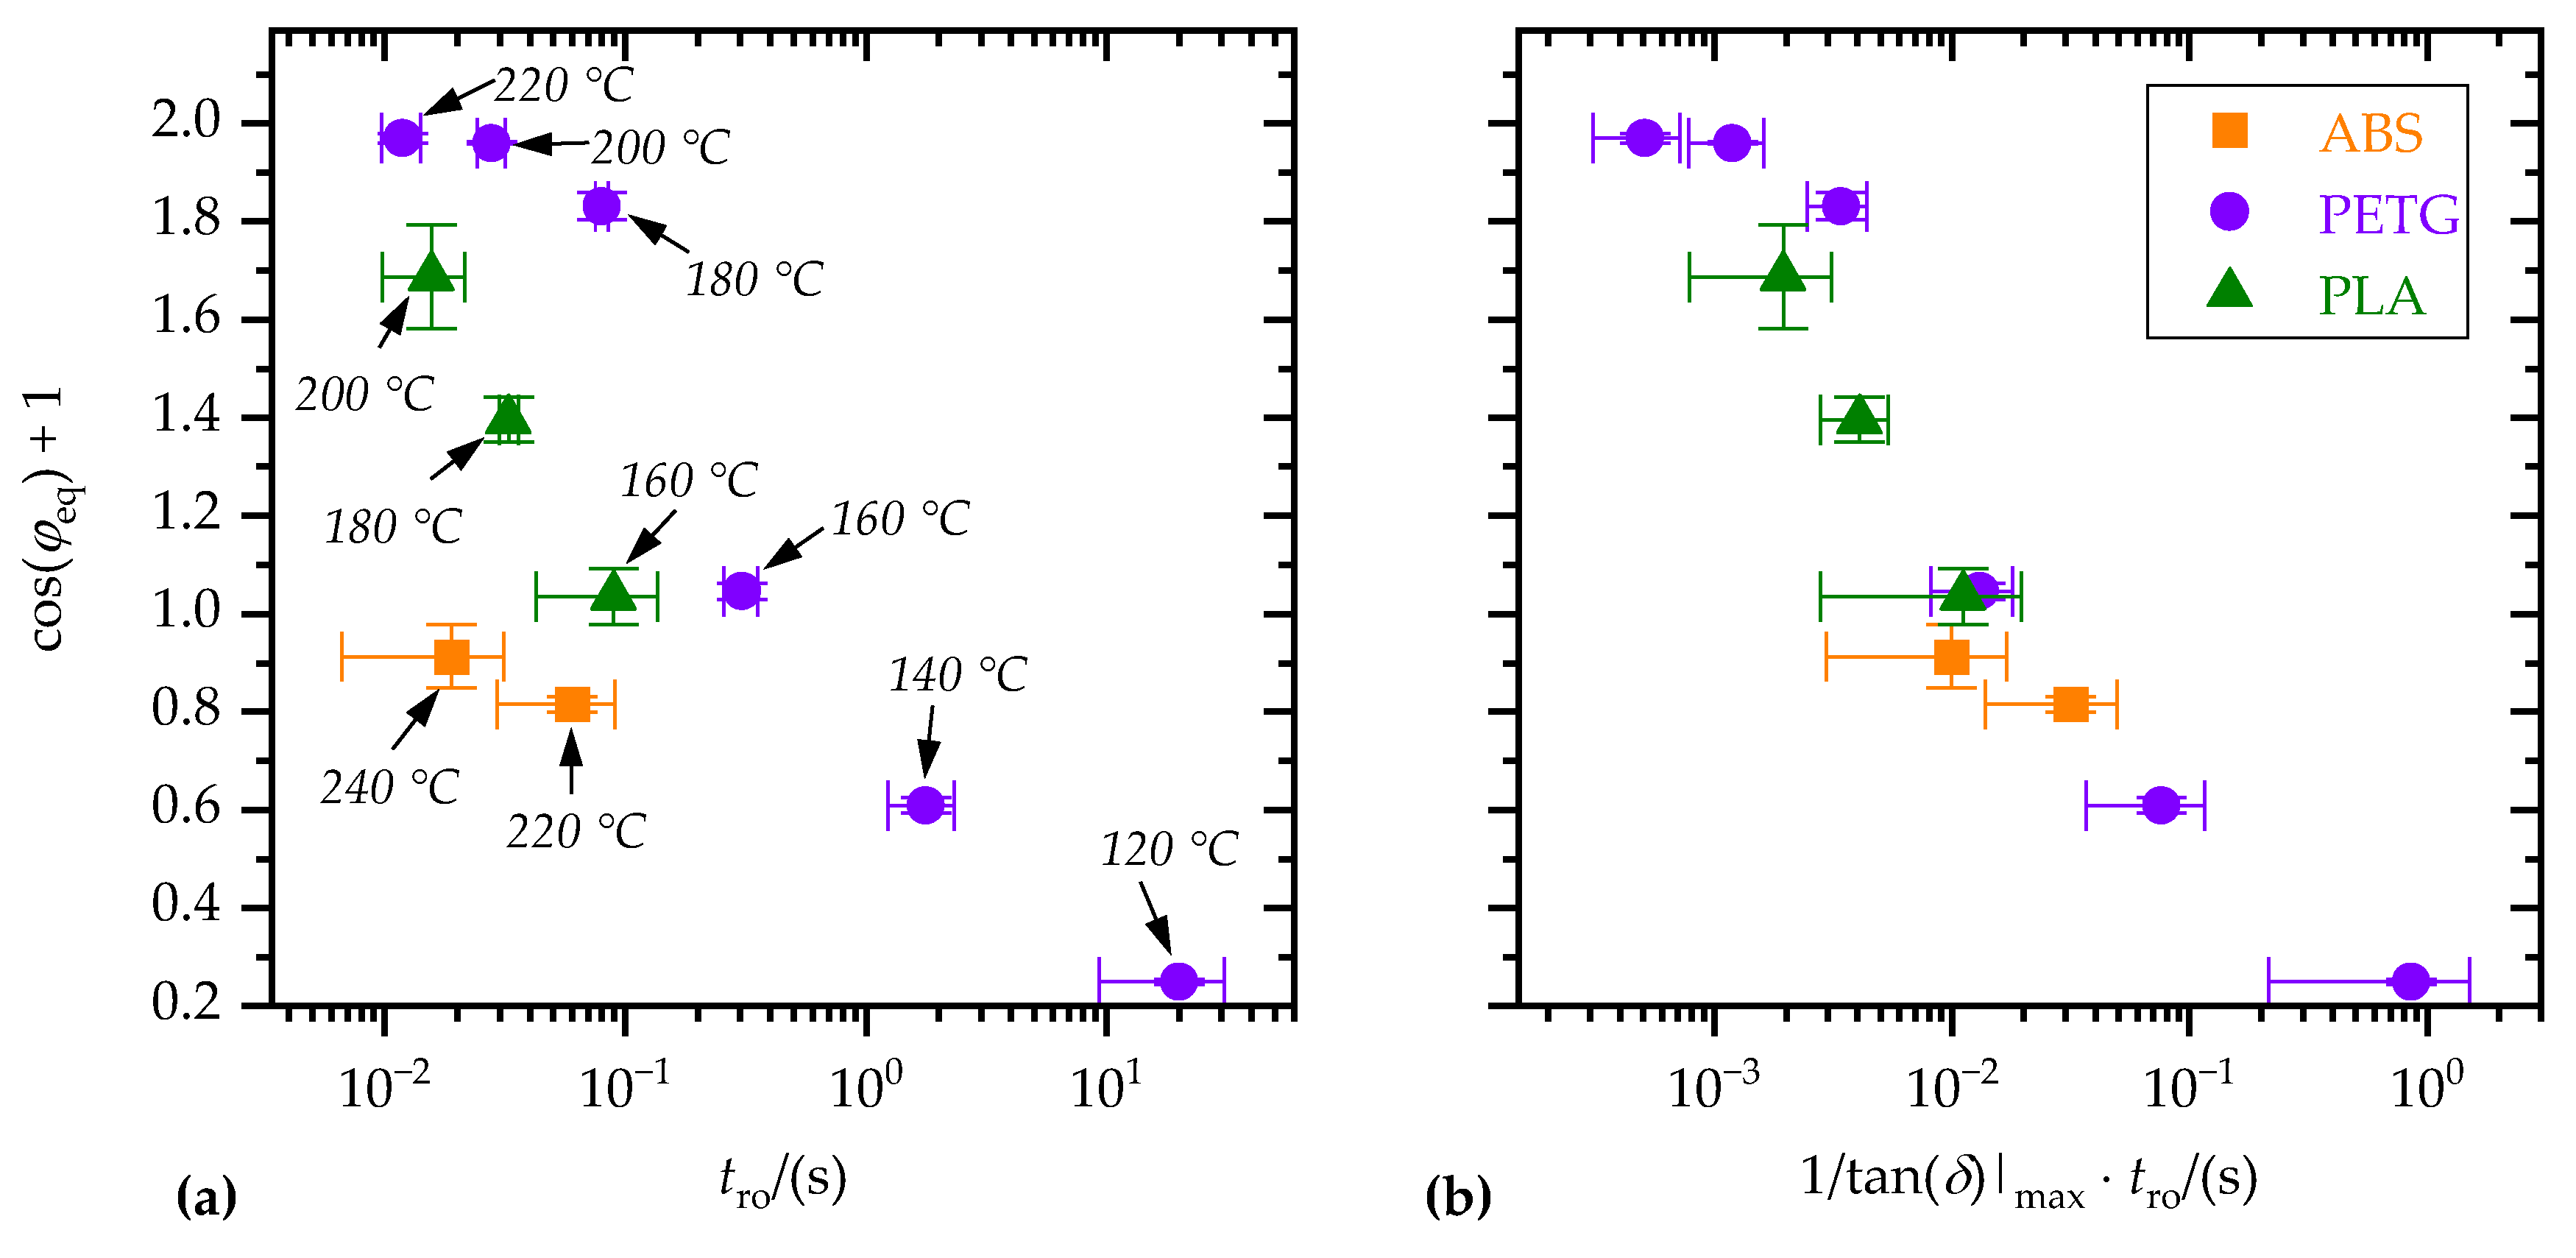
3.4. Correlating Polymer Properties, Wetting and Adhesion Interface Performance
4. Conclusions
- Which of the common thermoplastics for ME is most suitable to generate structural polymer–metal joints?
- Can structural polymer–metal joints be generated by ME on “simple” practical relevant metal surfaces (e.g., prepared by grid blasting)?
Author Contributions
Funding
Institutional Review Board Statement
Informed Consent Statement
Data Availability Statement
Acknowledgments
Conflicts of Interest
References
- Bromberger, J.; Kelly, R. Additive manufacturing: A long-term game changer for manufacturers. In The Great Re-Make: Manufacturing for Modern Times; McKinsey & Company: New York, NY, USA, 2017; pp. 59–66. [Google Scholar]
- Ligon, S.C.; Liska, R.; Stampfl, J.; Gurr, M.; Mülhaupt, R. Polymers for 3D Printing and Customized Additive Manufacturing. Chem. Rev. 2017, 117, 10212–10290. [Google Scholar] [CrossRef] [PubMed] [Green Version]
- Frascio, M.; Marques, E.A.D.S.; Carbas, R.J.C.; da Silva, L.F.M.; Monti, M.; Avalle, M. Review of Tailoring Methods for Joints with Additively Manufactured Adherends and Adhesives. Materials 2020, 13, 3949. [Google Scholar] [CrossRef] [PubMed]
- Klein, B. Fügetechniken. In Leichtbau-Konstruktion: Berechnungsgrundlagen und Gestaltung; Klein, B., Ed.; Springer: Wiesbaden, Germany, 2013; pp. 284–317. ISBN 978-3-658-02271-6. [Google Scholar]
- Habenicht, G. Kleben: Grundlagen, Technologien, Anwendungen; 5. Erweiterte und Aktualisierte Auflage; Springer: Berlin, Germany, 2006; ISBN 978-3-540-26273-2. [Google Scholar]
- Habenicht, G.; Ahner, C. Applied Adhesive Bonding: A practical Guide for Flawless Results; Wiley-VCH: Weinheim, Germany; Chichester, UK, 2009; ISBN 978-3-527-32014-1. [Google Scholar]
- Ebnesajjad, S. Adhesives Technology Handbook, 2nd ed.; William Andrew Pub: Norwich, NY, USA, 2008; ISBN 0815515332. [Google Scholar]
- Ramiasa, M.; Ralston, J.; Fetzer, R.; Sedev, R. The influence of topography on dynamic wetting. Adv. Colloid Interface Sci. 2014, 206, 275–293. [Google Scholar] [CrossRef]
- Lu, G.; Wang, X.-D.; Duan, Y.-Y. A Critical Review of Dynamic Wetting by Complex Fluids: From Newtonian Fluids to Non-Newtonian Fluids and Nanofluids. Adv. Colloid Interface Sci. 2016, 236, 43–62. [Google Scholar] [CrossRef]
- Welygan, D.G.; Burns, C.M. Dynamic Contact Angles of Viscous Liquids. J. Adhes. 1980, 11, 41–55. [Google Scholar] [CrossRef]
- Elias, H.-G. Makromoleküle: Band 2: Physikalische Strukturen und Eigenschaften; 5. Viskositat von Schmelzen; Wiley-VCH: Weinheim, Germany; New York, NY, USA, 2001; ISBN 9783527626502. [Google Scholar]
- Adamson, A.W.; Gast, A.P. Physical Chemistry of Surfaces, 6th ed.; Wiley: New York, NY, USA, 1997; ISBN 0471148733. [Google Scholar]
- Das, A.; Gilmer, E.L.; Biria, S.; Bortner, M.J. Importance of Polymer Rheology on Material Extrusion Additive Manufacturing: Correlating Process Physics to Print Properties. ACS Appl. Polym. Mater. 2021, 3, 1218–1249. [Google Scholar] [CrossRef]
- Costa, S.F.; Duarte, F.M.; Covas, J.A. Estimation of filament temperature and adhesion development in fused deposition techniques. J. Mater. Processing Technol. 2017, 245, 167–179. [Google Scholar] [CrossRef]
- Seppala, J.E.; Hoon Han, S.; Hillgartner, K.E.; Davis, C.S.; Migler, K.B. Weld formation during material extrusion additive manufacturing. Soft Matter. 2017, 13, 6761–6769. [Google Scholar] [CrossRef]
- Bartolai, J.; Simpson, T.W.; Xie, R. Predicting strength of additively manufactured thermoplastic polymer parts produced using material extrusion. Rapid Prototyp. J. 2018, 24, 321–332. [Google Scholar] [CrossRef]
- Dealy, J.M.; Read, D.J.; Larson, R.G. Structure and Rheology of Molten Polymers: From Structure to Flow Behavior and Back Again, 2nd ed.; Hanser Publications: Cincinnati, OH, USA, 2018; ISBN 9781569906118. [Google Scholar]
- Amancio-Filho, S.T.; Falck, R. Verfahren zum Herstellen eines schichtförmigen Bauteils. Patent DE 10 2016 121 267 A1, 7 November 2016. [Google Scholar]
- Falck, R.; Dos Santos, J.F.; Amancio-Filho, S.T. Microstructure and Mechanical Performance of Additively Manufactured Aluminum 2024-T3/Acrylonitrile Butadiene Styrene Hybrid Joints Using an AddJoining Technique. Materials 2019, 12, 864. [Google Scholar] [CrossRef] [Green Version]
- Falck, R.; Goushegir, S.M.; dos Santos, J.F.; Amancio-Filho, S.T. AddJoining: A novel additive manufacturing approach for layered metal-polymer hybrid structures. Mater. Lett. 2018, 217, 211–214. [Google Scholar] [CrossRef]
- Chueh, Y.-H.; Wei, C.; Zhang, X.; Li, L. Integrated laser-based powder bed fusion and fused filament fabrication for three-dimensional printing of hybrid metal/polymer objects. Addit. Manuf. 2020, 31, 100928. [Google Scholar] [CrossRef]
- Hertle, S.; Kleffel, T.; Wörz, A.; Drummer, D. Production of polymer-metal hybrids using extrusion-based additive manufacturing and electrochemically treated aluminum. Addit. Manuf. 2020, 33, 101135. [Google Scholar] [CrossRef]
- Dröder, K.; Reichler, A.-K.; Mahlfeld, G.; Droß, M.; Gerbers, R. Scalable Process Chain for Flexible Production of Metal-Plastic Lightweight Structures. Procedia CIRP 2019, 85, 195–200. [Google Scholar] [CrossRef]
- Bechtel, S.; Meisberger, M.; Klein, S.; Heib, T.; Quirin, S.; Herrmann, H.-G. Estimation of the Adhesion Interface Performance in Aluminum-PLA Joints by Thermographic Monitoring of the Material Extrusion Process. Materials 2020, 13, 3371. [Google Scholar] [CrossRef]
- Ostermann, F. Anwendungstechnologie Aluminium, 3rd ed.; Springer: Berlin/Heidelberg, Germany, 2014; ISBN 978-3-662-43806-0. [Google Scholar]
- ABS Extrafill—Technical Data Sheet; Fillamentum: Hulin, Czech Republic, 2019.
- PolyLite (TM) PETG—Technical Data Sheet; Polymaker: Shanghai, China, 2017.
- Ingeo Biopolymer 3D870 Technical Data Sheet; NatureWorks: Minnetonka, MN, USA, 2017.
- Coogan, T.J.; Kazmer, D.O. In-line rheological monitoring of fused deposition modeling. J. Rheol. 2019, 63, 141–155. [Google Scholar] [CrossRef]
- Coogan, T.J.; Kazmer, D.O. Modeling of interlayer contact and contact pressure during fused filament fabrication. J. Rheol. 2019, 63, 655–672. [Google Scholar] [CrossRef]
- Mackay, M.E. The importance of rheological behavior in the additive manufacturing technique material extrusion. J. Rheol. 2018, 62, 1549–1561. [Google Scholar] [CrossRef]
- Andersen, N.K.; Taboryski, R. Drop shape analysis for determination of dynamic contact angles by double sided elliptical fitting method. Meas. Sci. Technol. 2017, 28, 47003. [Google Scholar] [CrossRef] [Green Version]
- MATLAB Central File Exchange. Drop Shape Analysis—Fit Contact Angle by Double Ellipses or Polynomials. Available online: https://www.mathworks.com/matlabcentral/fileexchange/57919-drop-shape-analysis-fit-contact-angle-by-double-ellipses-or-polynomials (accessed on 24 August 2021).
- Gordelier, T.J.; Thies, P.R.; Turner, L.; Johanning, L. Optimising the FDM additive manufacturing process to achieve maximum tensile strength: A state-of-the-art review. RPJ 2019, 25, 953–971. [Google Scholar] [CrossRef]
- Wexler, A.; Hasegawa, S. Relative humidity-temperature relationships of some saturated salt solutions in the temperature range 0° to 50 °C. J. Res. Natl. Bur. Stand. 1954, 53, 19–26. [Google Scholar] [CrossRef]
- Ansys GRANTA EduPack; ANSYS, Inc.: Canonsburg, PA, USA, 2021.
- Farah, S.; Anderson, D.G.; Langer, R. Physical and mechanical properties of PLA, and their functions in widespread applications —A comprehensive review. Adv. Drug Deliv. Rev. 2016, 107, 367–392. [Google Scholar] [CrossRef] [PubMed] [Green Version]
- Goh, G.D.; Yap, Y.L.; Tan, H.K.J.; Sing, S.L.; Goh, G.L.; Yeong, W.Y. Process–Structure–Properties in Polymer Additive Manufacturing via Material Extrusion: A Review. Crit. Rev. Solid State Mater. Sci. 2020, 45, 113–133. [Google Scholar] [CrossRef]
- Vidakis, N.; Petousis, M.; Velidakis, E.; Liebscher, M.; Mechtcherine, V.; Tzounis, L. On the Strain Rate Sensitivity of Fused Filament Fabrication (FFF) Processed PLA, ABS, PETG, PA6, and PP Thermoplastic Polymers. Polymers 2020, 12, 2924. [Google Scholar] [CrossRef] [PubMed]
- Algarni, M.; Ghazali, S. Comparative Study of the Sensitivity of PLA, ABS, PEEK, and PETG’s Mechanical Properties to FDM Printing Process Parameters. Crystals 2021, 11, 995. [Google Scholar] [CrossRef]
- Chacón, J.M.; Caminero, M.A.; García-Plaza, E.; Núñez, P.J. Additive manufacturing of PLA structures using fused deposition modelling: Effect of process parameters on mechanical properties and their optimal selection. Mater. Des. 2017, 124, 143–157. [Google Scholar] [CrossRef]
- Vairis, A.; Petousis, M.; Vidakis, N.; Savvakis, K. On the Strain Rate Sensitivity of Abs and Abs Plus Fused Deposition Modeling Parts. J. Mater. Eng. Perform. 2016, 25, 3558–3565. [Google Scholar] [CrossRef]
- Mackay, M.E.; Swain, Z.R.; Banbury, C.R.; Phan, D.D.; Edwards, D.A. The performance of the hot end in a plasticating 3D printer. J. Rheol. 2017, 61, 229–236. [Google Scholar] [CrossRef]
- Quintans, J. Rheological Characterization of Unmodified and Chemically Modified Poly (Ethylene Terephthalate) Resins. Master’s Thesis, New Jersey Institute of Technology, Newark, NJ, USA, 1998. [Google Scholar]
- Bagheriasl, D.; Carreau, P.J.; Riedl, B.; Dubois, C.; Hamad, W.Y. Shear rheology of polylactide (PLA)–cellulose nanocrystal (CNC) nanocomposites. Cellulose 2016, 23, 1885–1897. [Google Scholar] [CrossRef]
- Hepperle, J. Rheological properties of polymer melts. In Co-Rotating Twin-Screw Extruder: Fundamentals, Technology, and Applications; Kohlgrüber, K., Bierdel, M., Eds.; Hanser: Munich, Germany, 2008; ISBN 9781569904220. [Google Scholar]
- Ehrenstein, G.W.; Pongratz, S. Beständigkeit von Kunststoffen; Hanser Verlag: München, Germany, 2007; ISBN 978-3-446-21851-2. [Google Scholar]
- Zhang, X.; Schneider, K.; Liu, G.; Chen, J.; Brüning, K.; Wang, D.; Stamm, M. Structure variation of tensile-deformed amorphous poly(l-lactic acid): Effects of deformation rate and strain. Polymer 2011, 52, 4141–4149. [Google Scholar] [CrossRef]
- Campilho, R.D.S.G.; Banea, M.D.; Neto, J.A.B.P.; Da Silva, L.F.M. Modelling of Single-Lap Joints Using Cohesive Zone Models: Effect of the Cohesive Parameters on the Output of the Simulations. J. Adhes. 2012, 88, 513–533. [Google Scholar] [CrossRef]
- Summa, J.; Becker, M.; Grossmann, F.; Pohl, M.; Stommel, M.; Herrmann, H.G. Fracture analysis of a metal to CFRP hybrid with thermoplastic interlayers for interfacial stress relaxation using in situ thermography. Compos. Struct. 2018, 193, 19–28. [Google Scholar] [CrossRef]


| Temperature Setting | Ts,1/(°C) | Ts,2/(°C) | Ts,3/(°C) | Ts,i/(°C), i > 4 |
|---|---|---|---|---|
| 1 | 240 | 150 | 100 | Ts0/(°C) |
| 2 | 220 | 150 | 100 | Ts0/(°C) |
| 3 | 200 | 150 | 100 | Ts0/(°C) |
| 4 | 180 | 150 | 100 | Ts0/(°C) |
| 5 | 160 | 150 | 100 | Ts0/(°C) |
| 6 | 140 | 100 | Ts0/(°C) | |
| 7 | 120 | 100 | Ts0/(°C) |
| Property | Al | ABS | PETG | PLA | |
|---|---|---|---|---|---|
| thermal expansion coefficient | α/(10−6/K) | 23 [25] | 108–234 [36] | 120–123 [36] | 126–145 [36] |
| density | ρ/(g/cm3) | 2.7 [25] | 1.04 [26] | 1.25 [27] | 1.22 [28] |
| melting temperature | Tm/(°C) | 650 * [25] | amorphous | amorphous | 169 ± 0 |
| crystallization temperature | Tc/(°C) | 575 * [25] | amorphous | amorphous | 119 ± 0 |
| glass transition temperature | Tg/(°C) | - | 99 ± 1 | 75.5 ± 0 | 58 ± 2 |
| elastic modulus | E/(GPa) | 70 [25] | 2.3 ± 0.1 | 2.1± 0.1 | 2.9± 0.1 |
| yield strength | σy/(MPa) | 280 [25] | 30 ± 1 | 47 ± 1 | 48 ± 1 |
| elongation at yield | εy/(%) | 1.8 ± 0.2 | 4.1 ± 0.1 | 2.5 ± 0.2 | |
| surface roughness | Ra/(µm) | ||||
| - blank | 0.18 ± 0.02 [24] | ||||
| - sandblasted (FEPA 150) | 1.9 ± 0.5 [24] | ||||
| Property | ABS, Run 1 | ABS, Run 2 | ABS, Run 3 | PETG, Run 1 | PETG, Run 2 | PETG, Run 3 | PLA, Run 1 | PLA, Run 2 | PLA, Run 3 |
|---|---|---|---|---|---|---|---|---|---|
| tan(δ)|max | 1.9 | 1.3 | 1.3 | 23 | 25 | 14 | 8.0 | 3.3 | 2.8 |
| ±0.1 | ±0.0 | ±0.0 | ±5 | ±6 | ±3 | ±1.8 | ±0.3 | ±0.2 | |
| tro (T0)/(ms) | 1500 | 2020 | 2440 | 80 | 48 | 47 | 33 | 15 | 13 |
| ±100 | ±180 | ±190 | ±5 | ±5 | ±6 | ±3 | ±5 | ±4 |
| Ts,1/(°C) | φeq/(°), ABS | φeq/(°), PETG | φeq/(°), PLA |
|---|---|---|---|
| 240 | 95 ± 4 | - | - |
| 220 | 101 ± 1 | 14 ± 2 | - |
| 200 | - | 16 ± 1 | 46 ± 8 |
| 180 | - | 34 ± 3 * | 67 ± 3 |
| 160 | - | 87 ± 1 | 88 ± 3 |
| 140 | - | 113 ± 1 * | |
| 120 | - | 139 ± 1 |
| Property | ABS, Fresh | ABS, Aged | PETG, Fresh | PETG, Aged | PLA, Fresh | PLA, Aged |
|---|---|---|---|---|---|---|
| E/(MPa) | 2260 ± 50 | 2320 ± 40 | 2100 ± 80 | 2210 ± 80 | 2880 ± 70 | 2640 ± 120 |
| εy/(%) | 1.8 ± 0.2 | 1.7 ± 0.1 | 4.1 ± 0.1 | 2.5 ± 0.3 | 2.5 ± 0.2 | 1.8 ± 0.0 |
| σy/(MPa) | 29.6 ± 1.3 | 30.3 ± 1.0 | 46.9 ± 0.9 | 46.2 ± 3.4 | 48.1 ± 1.3 | 41.4 ± 2.0 |
Publisher’s Note: MDPI stays neutral with regard to jurisdictional claims in published maps and institutional affiliations. |
© 2022 by the authors. Licensee MDPI, Basel, Switzerland. This article is an open access article distributed under the terms and conditions of the Creative Commons Attribution (CC BY) license (https://creativecommons.org/licenses/by/4.0/).
Share and Cite
Bechtel, S.; Schweitzer, R.; Frey, M.; Busch, R.; Herrmann, H.-G. Material Extrusion of Structural Polymer–Aluminum Joints—Examining Shear Strength, Wetting, Polymer Melt Rheology and Aging. Materials 2022, 15, 3120. https://0-doi-org.brum.beds.ac.uk/10.3390/ma15093120
Bechtel S, Schweitzer R, Frey M, Busch R, Herrmann H-G. Material Extrusion of Structural Polymer–Aluminum Joints—Examining Shear Strength, Wetting, Polymer Melt Rheology and Aging. Materials. 2022; 15(9):3120. https://0-doi-org.brum.beds.ac.uk/10.3390/ma15093120
Chicago/Turabian StyleBechtel, Stephan, Rouven Schweitzer, Maximilian Frey, Ralf Busch, and Hans-Georg Herrmann. 2022. "Material Extrusion of Structural Polymer–Aluminum Joints—Examining Shear Strength, Wetting, Polymer Melt Rheology and Aging" Materials 15, no. 9: 3120. https://0-doi-org.brum.beds.ac.uk/10.3390/ma15093120