Article

Quantification of the Hardened Cement Paste Content in Fine Recycled Concrete Aggregates by Means of Salicylic Acid Dissolution

1
Department of Structural Engineering, College of Civil Engineering, Tongji University, Shanghai 200092, China
2
Univ. Lille, Institute Mines-Télécom, Univ. Artois, Junia, ULR 4515—LGCgE—Laboratoire de Génie Civil et géo-Environnement, F-59000 Lille, France
3
IMT Nord Europe, Institut Mines-Télécom, Centre for Materials and Processes, F-59000 Lille, France
4
University Orléans, University Tours, INSA CVL, LaMé, EA 7494, F-45100 Orléans, France
5
Building Materials, Urban and Environmental Engineering, University of Liège, 4000 Liege, Belgium
*
Author to whom correspondence should be addressed.
Submission received: 28 March 2022 / Revised: 29 April 2022 / Accepted: 4 May 2022 / Published: 9 May 2022
(This article belongs to the Special Issue Utilisation of Recycled Materials and By-Products in Concrete)

Abstract

:
Adherent hardened cement paste attached to recycled concrete aggregates (RCA) generally presents a higher porosity than natural aggregates, which induces a lower porosity in the properties of RCA. The characterization of the adherent hardened cement paste content (HCPC) in the fine RCA would promote better applications of RCA in concrete, but the determination of HCPC in fine RCA is not well established. A simple method based on salicylic acid dissolution was specifically developed to quantify the HCPC in RCA, especially for RCA containing limestone aggregates. The results demonstrated that the soluble fraction in salicylic acid (SFSA) was equal to the HCPC for white cement and slightly lower for grey Portland cement, which was also confirmed by a theoretical approach using modelling the hydration of cement paste with the chemical equations and the stoichiometric ratios. The physical and mechanical properties of RCA (e.g., water absorption) were strongly correlated to the SFSA. For industrial RCA, SFSA did not give the exact value of HCPC, but it was sufficient to correlate HCPC with the other properties of RCA. The water absorption could be estimated with good accuracy for very fine RCA (laboratory-manufactured RCA or industrial RCA) by extrapolating the relationship between water absorption and HCPC, which is very important for concrete formulation.

1. Introduction

A huge amount of construction and demolition waste (CDW) is generated annually (e.g., the European Union generated 838.9 million tons of CDW in 2021 according to Eurostat [1]). On the other hand, good quality aggregate (e.g., the European Union of 39 countries: 3.07 billion tons of aggregates in 2018 [2]) is needed for the construction industry according to European Aggregates Association. Recycling CDW as aggregate in the concrete industry would be a partial solution to the aggregate shortage and waste disposal problem [3,4]. The main components of CDW are old concrete (ranging from 32% to 75%), bricks, wood from buildings, glass, gypsum asphalt from the pavement, plastics, etc. [5,6]. The use of RCA crushed from CDW to replace the natural aggregates (NA) in the production of concrete has increased over the last decade [7,8,9,10,11].
RCA is generally composed of a mix between NA and adherent mortar (or adherent hardened cement paste) and the complete separation of them is quite difficult [12]. Hardened cement paste presents a much higher porosity than the NA generally used for the manufacture of concrete [13,14]. Therefore, the quantity and the quality of hardened cement paste are responsible for the poorer properties of RCA, such as higher porosity [15], higher water absorption [13,15], lower density [15,16], and lower resistance to crushing and abrasion [13]. Concrete produced with RCA generally shows lower workability [9,17], lower mechanical behavior [11,18,19], and lower durability performance than NA-based concrete [17,18,19,20,21,22]. The effect of HCPC is even more crucial for fine RCA (FRCA: fraction of RCA less than 5 mm), which makes them difficult to apply into mortar or concrete compared with coarse RCA (CRCA: fraction of RCA greater than 5 mm) [10,14,23,24].
To promote better application of RCA in the concrete, it is important to study the role of HCPC in RCA despite the quantitative influence of HCPC on the physical and mechanical properties of RCA is not well described.
Currently, there is no standard to determine HCPC or adherent mortar content in RCA; however, some methods were developed in the literature (Table 1). The thermal method [25] and the sodium sulphate solution method are only applicable to coarse RCA because the removal of mortar is difficult with small particles, and they are only suitable for determining the adherent mortar content of coarse RCA. The image analysis method [26] and the linear traverse method [27,28] are suitable for the quantification of residual mortar in coarse RCA. The X-ray SEM-based image analysis developed by Ulsen et al. [29] is too long to perform as a statistical approach is needed to obtain reliable results. The deionized water dissolution has the carbonation contamination problem. It also takes ten days, which is too long, and the ICP analysis is expensive [30]. For the hydrochloric acid solution method, it cannot be applied for RCA made with limestone, which is soluble in hydrochloric acid [31,32]. The above-mentioned methods seem to be not adapted to the characterization of HCPC in fine RCA, especially for RCA containing limestone [33,34,35].
HCPC in fine RCA is closely related to other physical and mechanical properties (e.g., density and water absorption) of fine RCA, which play an important role in concrete formulation [23,36]. Indeed, the water absorption of fine RCA has to be accurately quantified to assess the effective water used in concrete [37,38,39,40,41,42]. However, the current methods (such as EN 1097–6 [43] or ASTM C 128 [44], IFSTTAR No. 78 method [45]) used to determine the water absorption of fine RCA are generally not accurate, particularly for the RCA containing a high percentage of fine particles [46,47].
This paper intends to develop and validate an easily performed method to quantify HCPC in fine RCA by a theoretical approach and an experimental method. In addition, the validity of the method was conducted by applying it to industrial produced RCA, laboratory-manufactured noncarbonated RCA, and well-carbonated RCA. The relationship between the main properties of fine RCA and HPCP was correlated and a new method to determine the water absorption of industrial produced and laboratory-manufactured fine RCA was proposed.

2. Materials and Methods

2.1. Laboratory-Produced RCA

Laboratory-produced initial concrete (named OC1, OC2 and OC3) with two different water-to-cement (W/C) ratios (W/C = 0.6 for OC1 and OC2, W/C = 0.4 for OC3) and the volumes of paste (278 dm3/m3 for OC1, around 350 dm3/m3 for OC2 and OC3) were manufactured. The fine RCA was obtained by crushing the concrete after 28 and 90 days of curing using a jaw crusher. These three concretes were prepared with white cement (CEM I 52.5 N according to EN 197–1 [48] from Lafarge company: Teil factory, France) and limestone aggregates (sourced from Tournai, Holcim France Benelux). A total of 1138 kg of aggregate, 756 kg of sand and 299 kg of cement were used for the concrete OC1 while 1041 kg of aggregate, 692 kg of sand and 376 kg of cement were used for the concrete OC2. For the concrete OC3, 1019 kg of aggregate, 677 kg of sand and 475 kg of cement were used. More detailed information on prepared concrete can be found in Zhao et al. [49]. The fraction 0/5 mm of RCA was obtained after crushing and they were divided into four granular classes: 0/0.63, 0.63/1.25, 1.25/2.5, and 2.5/5 mm. They were pre-dried at 105 °C and then stored in sealed bags to minimize carbonation. These laboratory-manufactured noncarbonated RCA were noted as RCAl_OCx_28/90 (x refers to the type of three initial concretes). To study the influence of carbonation, 1 kg of these different granular classes of RCAl_OC1_90 was then stored in the accelerated carbonation chamber for two weeks (pure CO2 at 20 °C and relative humidity of 75% were used to achieve nearly complete carbonation and maximize the effect of carbonation). The carbonation degree of RCA was verified by the phenolphthalein indicator, the colour of RCA after carbonation treatment measured by phenolphthalein was not pink (while it was pink for the RCA stored in natural carbonation condition), which indicated that the sample was well-carbonated after two weeks’ storage in accelerated chamber [12]. All the laboratory-manufactured noncarbonated RCA and laboratory-manufactured well-carbonated RCA (noted as RCAl_OC1_90 wc) were characterized including HCPC, density and water absorption. Each granular class of RCA is referred to as its average particle size.
Pure cement pastes with a W/C ratio of 0.5 were prepared and then cured in water for 28 and 90 days. They were made with the previous white cement (CEM I 52.5 N of Lafarge, noted as White cement CEM I 52.5 N) and grey cement (CEM II/A-L 52.5 N according to EN 197-1 provided from Holcim in France, noted as Grey cement CEM II/A-L 52.5 N). Pure cement pastes with a W/C ratio of 0.6 were prepared and cured in water for 500 days with cement CEM III/A 42.5 N and cement CEM I 52.5 N according to EN 197-1 from CBR Company in Belgium (noted as CBR CEM III/A 42.5 N and CBR CEM I 52.5 N, respectively). Table 2 presents the mineralogical compositions of cement using the Rietveld method. To assess the impact of insoluble and soluble phases in salicylic acid and methanol solution, specific experiments were performed on pure cement pastes with a white cement CEM I 52.5 N of Lafarge and a grey cement CEM II/A-L 52.5 N of Holcim. These cement pastes made with a W/C ratio of 0.5 were studied after 28 days of hydration (fraction 1.25/2.5 mm) by X-ray Diffraction (XRD) before and after dissolution, and RCAl_OC1_90 0.63/1.25 mm was also investigated. The samples were measured with XRD using a Bruker D8 Advance diffractometer (with a Co Kα1 radiation, sweep from 10° to 100° 2θ).

2.2. Industrial RCA

Three commercial RCA obtained from industrial recycling plants were investigated together with the laboratory-produced RCA. The first two industrial RCA (noted as RCAi1 and RCAi2) were obtained by the Colas Company in France. The third industrial RCA (noted RCAi3) was provided by the French National Project Recybéton [50]. The same tests on the four granular classes were conducted for the industrial RCA as the laboratory-produced RCA.

2.3. Experimental Methods

2.3.1. Water Absorption

The water absorption of fine RCA (each granular class) was measured with two methods: the European standard EN 1097-6 [43] and No. 78 of IFSTTAR [44]. A detailed comparison of these two experimental methods is presented in Reference [49]. The mean value of water absorption was measured from three representative samples.

2.3.2. Density

The specific density of fine RCA was determined using a helium pycnometer (Micromeritics AccuPyc 1330). The representative samples of fine RCA were pre-dried at 105 °C before the density analysis.

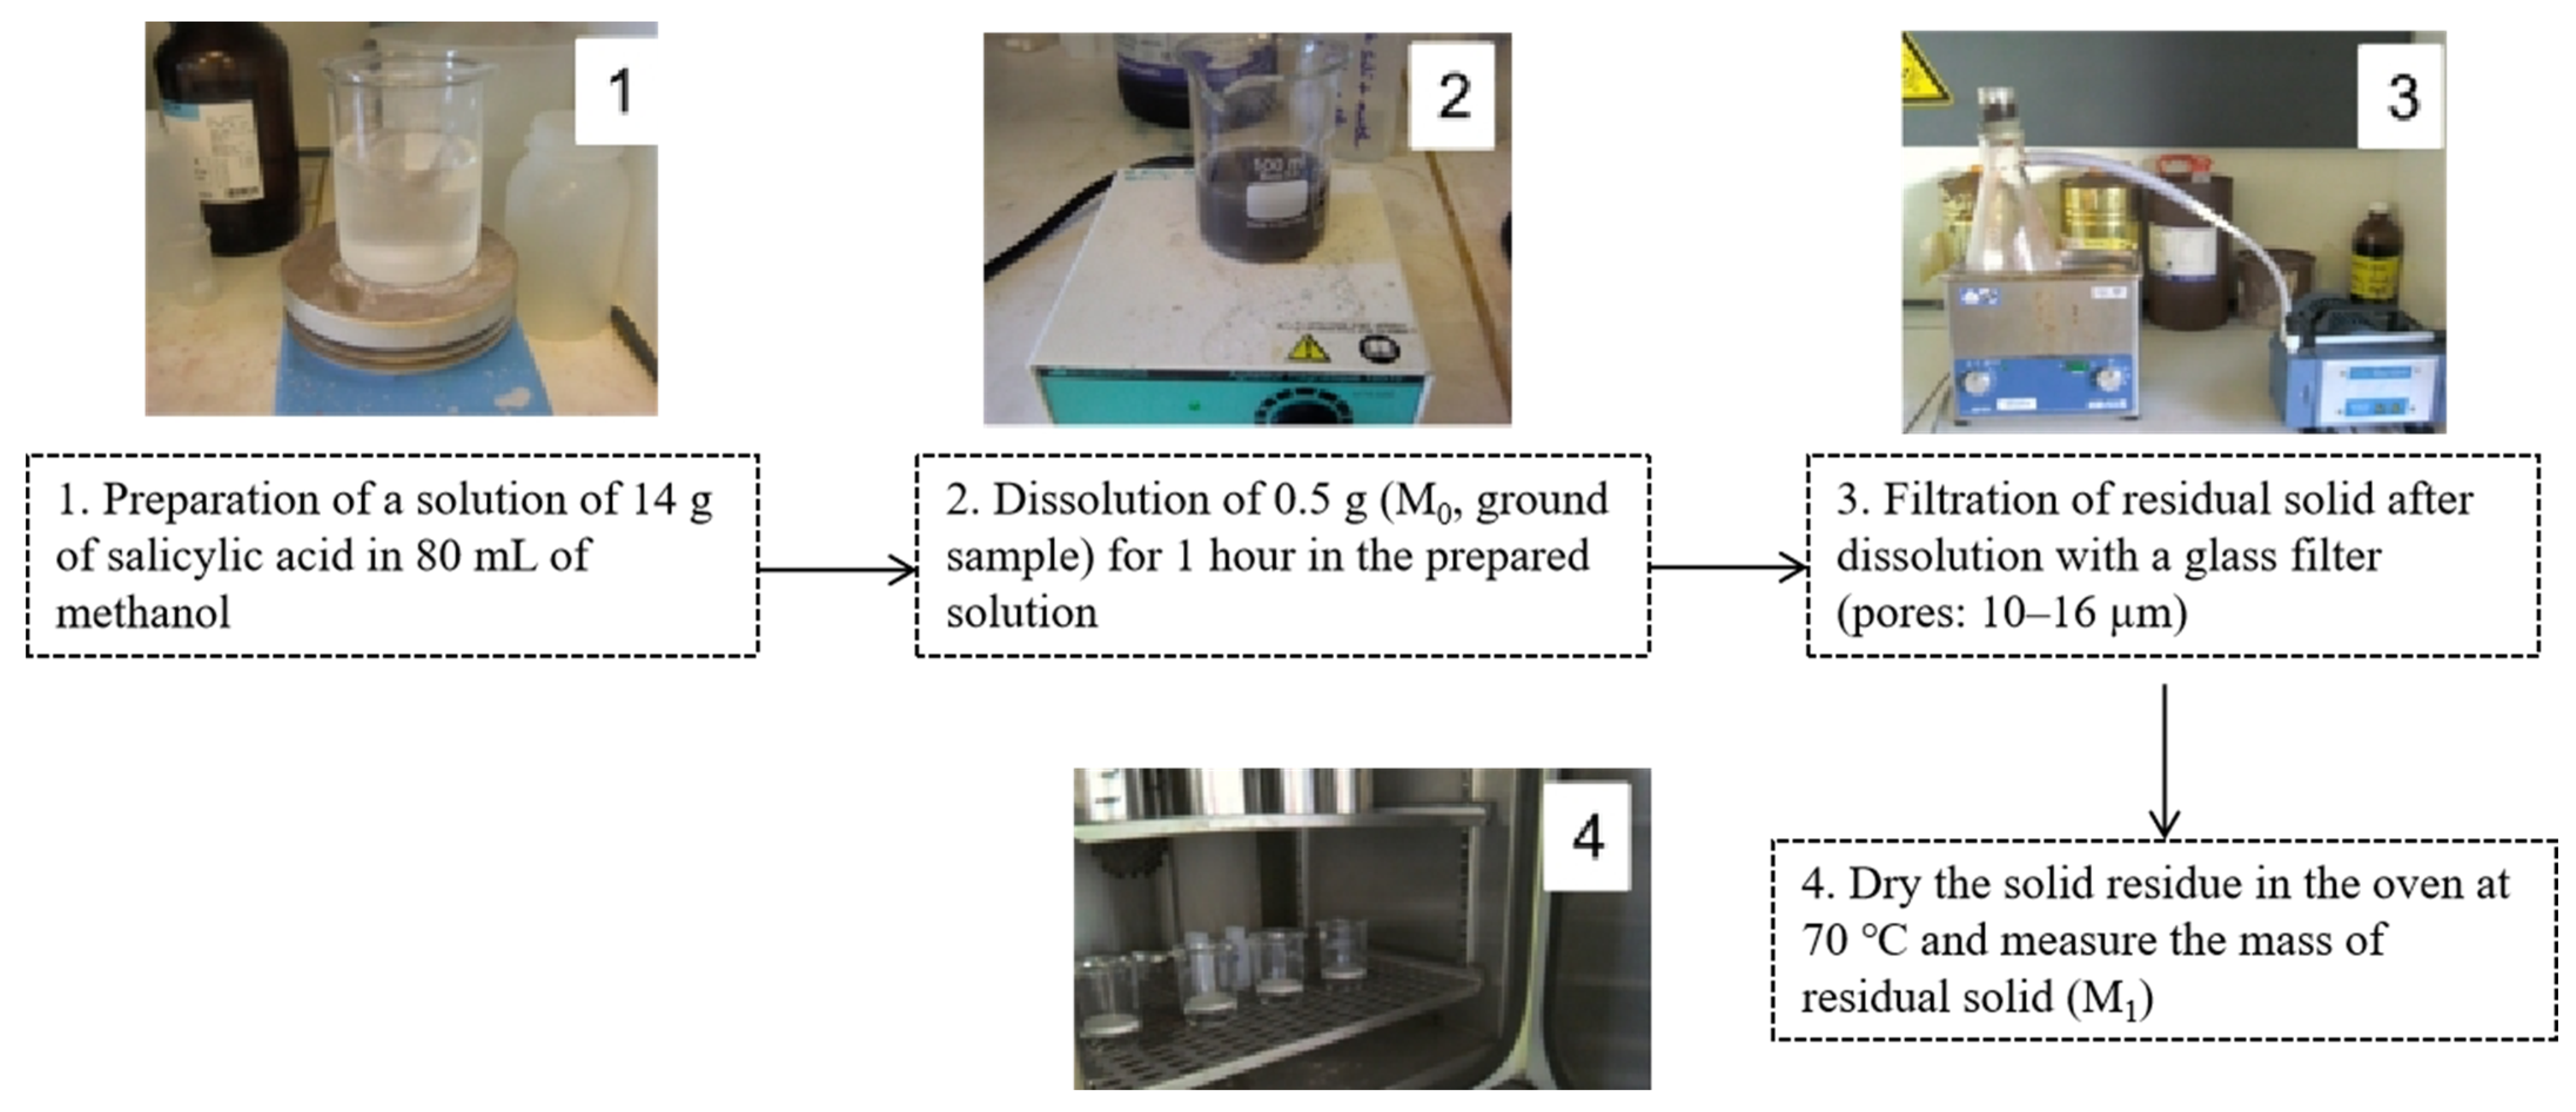
2.3.3. Hardened Cement Paste Content

A dissolution of hardened cement paste in salicylic acid and methanol solution method was developed, which can be easily performed in an industrial laboratory. The selective dissolution of hardened cement paste in salicylic acid and methanol solution is indeed well known for estimating the content of blast furnace slag (BFS) in blended cement composed of BFS and ordinary Portland cement (OPC) (dissolving the unhydrated cement and the hydration products, leaving only the blast furnace slag undissolved) [51,52,53].
The principle of this selective dissolution was based on 1 h of dissolution in a solution of 14 g of salicylic acid in 80 mL of methanol [49]. Generally, the representative samples (RCA) were pre-dried in an oven at 105 °C until the constant mass was reached, then they were ground to a particle size of less than 200 µm. Detailed information on the experimental protocol is shown in Figure 1. The soluble fraction in the salicylic acid (SFSA) was then calculated as follows (Equation (1)):
S F S A ( % ) = M 0 M 1 M 0 × 100
where M0 is the mass of the dried sample before the dissolution and M1 is the mass of the residual dried sample after the dissolution.

3. Results and Discussion

3.1. Measurement of Hardened Cement Paste Content in RCA

3.1.1. Experimental Approach

The accuracy of the estimate of hardened cement paste content (HCPC) by the soluble fraction in the salicylic acid (SFSA) mostly depends on the amount of soluble versus insoluble phases contained in the cement paste of fine RCA [54]. Table 3 shows the XRD results before and after the dissolution of cement and cement pastes compared with the ICDD database (corresponding XRD diffractograms are shown in Figure 2, Figure 3, Figure 4, Figure 5 and Figure 6).
From these results, most of the phases contained in OPC cement paste (Ca(OH)2, C-S-H, ettringite, C2S, C3S, CaO) was soluble in salicylic acid except some phases such as C3A, C4AF, Gypsum, C3AH6, AFm and blast furnace slag; however, the quantity of these insoluble phases was relatively low in the hydrated cement paste. The main phases contained in natural aggregates (Quartz, Dolomite, Calcite) were insoluble in salicylic acid. Thus, apart from calcium aluminate phases and their corresponding hydrates, all cement paste is expected to be dissolved.
Two other cement pastes (cement CBR CEM I 52.5 N and CBR CEM III/A 42.5 N, W/C = 0.6, cured in water for 500 days) were also conducted to study the influence of long curing (a cement paste with a high degree of hydration). A crushed calcareous aggregate from France and siliceous sand complying with European standard EN 196-1 [55] were also tested. The experimental results showed that 95.57% of white cement paste and 62.99% of grey cement paste were dissolved while only 0.83% of siliceous sand and 3.21% of calcareous aggregate were dissolved (Table 4). For white cement paste, the SFSA was almost identical to the hardened cement paste content (HCPC). This was the reason why white cement was chosen for the manufacture of initial concretes. For the grey cement paste (Table 4), the grey cement had a larger content of C3A, C4AF and calcite which do not dissolve in salicylic acid, so SFSA corresponded to only 62.99% of HCPC. For grey cement paste, SFSA was always lower than HCPC. For cement pastes made with CBR CEM III/A 42.5 N and CBR CEM 52.5 N after a long time cured in water, SFSA corresponded to 80.14% and 78.42%, respectively. Most phases of cement paste made with blended cement (CEM III/A: Portland cement combined with BFS) can dissolve in salicylic acid, which corresponded to 80.14% of HCPC. For industrial RCA generally containing a grey cement paste, SFSA did not give the exact value of HCPC, but it will be demonstrated later that for a given RCA, SFSA was sufficient to correlate HCPC with the other properties of RCA. This method was also chosen because it was easy to perform, and a very small standard deviation was observed.

3.1.2. Theoretical Approach to the Estimation of SFSA

As discussed in Section 3.1.1, SFSA was not exactly HCPC. However, the difference between SFSA and HCPC can be determined theoretically through modelling. The chemical equations for modelling the hydration of cement paste (CEM I and CEM II with inert material such as limestone) and their corresponding stoichiometric ratios are listed in Table 5.
The SFSA can be estimated based on the degree of hydration α, soluble hydrates (C-S-H, CH and ettringite) and the amount of soluble anhydrous cement (C3S and C2S). For the hydration of the aluminate (reaction with gypsum and not with anhydrite), the anhydrite was considered hydrated as gypsum before reacting with aluminates [56]. It was assumed that gypsum and anhydrite were present in the cement in stoichiometric amounts so that the reaction with the aluminate was complete at the maximum degree of hydration. The SFSA was determined by Equation (2):
S F S A ( α ) = M a n h , s o l + M h y d r , s o l M a + M i n + M a n h + M h y d r
where Manh,sol and Mhydr,sol are the soluble masses of anhydrous and soluble hydrates at a degree of hydrations α, Ma is the mass of natural aggregates (considered insoluble), Min is the inert phases in the cement considered insoluble (e.g., calcite), Manh and Mhydr are the mass of anhydrous cement (C3S, C2S, C3A, C4AF, gypsum and anhydrite) and the mass of hydrates for the degree of hydration α, respectively.
The degree of hydration α is defined as the fraction of the anhydrous cement that has already hydrated, which relates to the amount of cement consumed (inert phases are not accounted, e.g., calcite). The degree of hydration α varies between 0 and 1 whatever the cement composition (Equation (3)).
α = M a n h , c o n s u m p M a n h , 0
Two variables x (Equation (4)) and y (Equation (5)) were used to quantify the soluble fraction of the cement in the water and the soluble fraction of the cement in the salicylic acid:
x = M a n h , 0 M i c = C 3 S + C 2 S + C 3 A + C 4 A F + C S ¯ H 2 + C S ¯
y = M a n h , s o l M a n h = C 3 S + C 2 S C 3 S + C 2 S + C 3 A + C 4 A F + C S ¯ H 2 + C S ¯
where Mic is the mass of initial cement (Mic = Min,0 + Manh,0), C3S, C2S, … are the mass contents of the various constituents of the cement obtained by using the Rietveld method (Table 2).
It was considered that the composition of anhydrous cement does not change during hydration (the relative proportions of C3S, C2S, C3A, C4AF, gypsum and anhydrite are thus assumed to be constant). Thus, the parameter y is also constant during hydration. Finally, 25% of aluminates formed as ettringite and 75% of aluminates formed as AFm were assumed throughout the hydration. With all the above assumptions, the total mass of anhydrous and the mass of soluble anhydrous in the salicylic acid for a given degree of hydration α can be determined, respectively (Equations (6) and (7)):
M a n h = x M i c ( 1 α )
M a n h , s o l = y x M i c ( 1 α )
The mass of soluble hydrates in salicylic acid can be given as Equation (8):
M h y d r , s o l = M C S H + M C H + M E t t = α M i c { C 3 S [ 1 + ( E C 3 S ) ] + C 2 S [ 1 + ( E C 2 S ) ] + 0.25 { C 3 A [ 1 + ( E C 3 A ) E t t ] + C 4 A F [ 1 + ( E C 4 A F ) E t t ] } }
We assumed that:
C s o l = C 3 S + C 2 S + 0.25 ( C 3 A + C 4 A F )
( E C ) s o l = C 3 S ( E C 3 S ) + C 2 S ( E C 2 S ) + 0.25 [ C 3 A ( E C 3 A ) E t t + C 4 A F ( E C 4 A F ) E t t ]
( E C ) m o y = { C 3 S ( E C 3 S ) + C 2 S ( E C 2 S ) + C S ¯ ( E C S ¯ ) + 0.25 C 3 A ( E C 3 A ) E t t + 0.75 C 3 A ( E C 3 A ) A F m + 0.25 C 4 A F ( E C 4 A F ) E t t + 0.75 C 4 A F ( E C 4 A F ) A F m }
We can obtain:
M h y d = α x M i c + α M i c ( E C ) m o y
M h y d , s o l = α M i c ( C s o l + ( E C ) s o l )
Finally, the SFSA can be written as Equation (14):
S F S A = y x M i c ( 1 α ) + α M i c ( C s o l + ( E C ) s o l ) M a + M i c + α M i c ( E C ) m o y

3.1.3. Application to Pure Cement Pastes

Table 6 presents the required values to calculate the SFSA for the three tested cements (white cement CEM I 52.5 N, grey cement CEM II/A-L 52.5 N and CBR CEM I 52.5 N). Figure 7 demonstrates the variation of the SFSA for the three pure cement pastes, the mortar of concrete OC1 and concrete OC1 itself. The measured experimental SFSA values on cement pastes are also shown with three horizontal lines (Figure 7). The experimentally obtained SFSA values were close to the calculated values for the three pure cement pastes. Thus, the measurement of SFSA allowed an accurate estimation of the HCPC in the case of white cement (SFSA is close to 1 for pure white cement paste). However, for a grey cement paste based on cement CEM II/A-L 52.5 N and cement paste based on cement CBR CEM I 52.5 N, the SFSA remained below the HCPC.

3.1.4. Hardened Cement Paste Content in RCA

Table 7 shows the obtained SFSA values for laboratory-produced RCA (four granular classes) and for the fraction 0/5 mm. The SFSA value of full fraction 0/5 mm was calculated by the obtained SFSA values of each granular class and the mass percentage of each fraction. The experimentally obtained SFSA was compared with the theoretically calculated value from the mortar and concrete composition of the initial concrete, whereas the degree of hydration α at 28 days and 90 days were considered as 0.7 and 0.9, respectively.
The results indicated that SFSA increased as the particle size decreased (Table 7), whatever the concrete composition and the degree of hydration. The SFSA of RCAl_OC1 for the fraction 0/0.63 mm was 26.54%, while it was 19.35% for the fraction 2.5/5 mm. Etxeberria et al. [8] stated that the finer fraction of RCA had higher adherent mortar content (it was 20% for fraction 10/25 mm and 40% for fraction 4/10 mm). De Juan and Gutiérrez [25] mentioned that the adherent mortar content was higher as the fraction was lower. Thus, the experimental results obtained in this study were in agreement with the tendency obtained from the literature [8,25]. A reasonable linear trend with the correlation coefficient R2 between 0.82 and 0.99 was found between the SFSA and average particle size for all concretes. Moreover, all experimental values were within the range of the calculated values from mortar and concrete composition whatever the granular fraction. This demonstrated that the smaller particles (mainly crushed mortar and coarse natural aggregates from parent concrete) were generated when the crushing procedure was used for the production of RCA [25].
For all studied RCA, the SFSA values obtained for RCA_90 were slightly higher than that of RCA produced from the same concrete at the age of 28 days. This result was confirmed by the previous theoretical calculation (the SFSA increased with the degree of hydration for the RCA made from mortar OC1 and concrete OC1).
In addition, the results showed that SFSA was highly related to the composition of initial concrete. The SFSA of RCA_OC1 was lower than that of RCA_OC2 obtained from concrete OC2 containing a higher cement paste volume and the same W/C ratio. Similarly, the SFSA of RCA_OC2 was lower than that of RCA_OC3 obtained from concrete OC3 which contained the same volume of a denser cement paste (lower W/C ratio). Thus, the SFSA depended closely on the quantities of cement and aggregates used in the parent concrete (as shown in Equation (14)).
Figure 8 reports the variation of SFSA vs. the granular classes for all studied RCA. A quasi-linear relationship between the SFSA and granular class (correlation coefficient R2 between 0.77 and 0.99) was obtained. The SFSA obtained for industrial RCA was significantly lower than those measured for laboratory-manufactured RCA. The SFSA obtained for all laboratory-manufactured RCA was in the range of 20–40%, while it was in the range of 5–15% for the industry RCA. These results might be attributed to the chemical and mineralogical composition of cement used in the manufacture of the initial concrete (probably CEM II containing a higher insoluble fraction such as limestone in salicylic acid) and any carbonation of cement paste could also reduce the soluble fraction [12]. The values obtained for industrial RCA were between the values of noncarbonated laboratory-produced RCA and carbonated laboratory-produced RCA (for example the SFSA of RCAl_OC1_90 was 27% for fraction 0/0.63 mm and it was 5% for RCAl_OC1_90 wc). The industrial RCA were partly carbonated, the carbonated phases cannot dissolve in salicylic acid [12] and, therefore, lower SFSA values were obtained for the three industrial RCA compared with noncarbonated laboratory-produced RCA.

3.2. Relationships between HCPC and the Other Properties

3.2.1. Relationship between HCPC and Density

Figure 9 illustrates the variation of density as a function of granular classes. The density of RCA linearly increased as the particle size of RCA increased, which was attributed to the presence of higher HCPC in the finer fraction of RCA. The density of all the fractions of RCA was lower than that of natural aggregates, which was due to the lower density of hardened cement paste than that of natural aggregates [12,25]. The density of all the fractions of RCAl_OC1_90 wc was higher than that of RCAl_OC1_90. This result could be attributed to the transformation of portlandite to calcite, which presented a higher density than portlandite. After the treatment of accelerated carbonation, the slope of density to average particle size was lower than that of RCAl_OC1_90 (0.007 for RCAl_OC1_90 wc and 0.022 for RCAl_OC1_90, respectively), it can be explained that the finer fraction of RCA has higher HCPC, and the density of the latter was increased by the treatment of accelerated carbonation [57,58]. Since the industrial RCA was partly carbonated, the carbonation degree was much greater than the laboratory-produced noncarbonated RCA, the higher values of density were obtained for the industrial RCA, which was attributed to the partial carbonation during the service life of concrete products and the storage of RCA in recycling center; however, other unknown parameters such as the composition of RCA, the density of NA and hardened cement paste in RCA could also affect the density of industrial RCA.
Figure 10 presents the variation of specific density as a function of SFSA. The specific density decreased linearly when the SFSA increased. Indeed, the density of RCA directly depended on the proportion of hardened cement paste and the density of hardened cement paste and natural aggregates. If we considered the intersection points of these relations with the axis of coordinates (x = 0), we can obtain the density of the natural aggregates (NA). As shown in Table 8, the density of NA obtained for all RCA was in the range of 2.6–2.77 g/cm3, which signified the calculation through the relations seems to be reasonable. In the same way, when all the RCA was composed of hardened cement paste (x = 100%), we can obtain the density of hardened cement paste. As shown in Table 8, the density of hardened cement paste of RCAi3 was less than that of other materials. It has to be noted that, for the industrial RCA studied (as well as for well-carbonated RCA: RCAl_OC1_90 wc), the range of variation of SFSA was very limited (about 5%) which certainly led to large uncertainties on the extrapolated values of NA and hardened cement paste. The correlation coefficients between density and SFSA (R2) were within the range of 0.7 to 0.96. The slope of density to SFSA changed a little (from −0.012 to −0.011 after the carbonation; the black circle shows the RCA before carbonation in Figure 9).

3.2.2. Relationship between HCPC and Water Absorption

Table 9 shows the water absorption determined with two methods (EN and IFSTTAR) for all studied RCA. For the granular fractions greater than 0.63 mm, the water absorption values obtained by these two methods were very close to each other (the absolute difference was less than 1% for all studied RCA). These results showed that the two protocols can both be used to correctly estimate the saturated surface dry (SSD) state of coarse particles greater than 0.63 mm and thus the water absorption of fractions greater than 0.63 mm.
For the finer fraction 0/0.63 mm, the EN method did not allow us to precisely identify the SSD state. The small angular grains may form some cohesion even if all the water on the surface of particles were removed, which prevented the collapse of the grains once the cone was removed [49]. Therefore, the standard EN protocol underestimated the water absorption for a fraction less than 0.63 mm.
On the contrary, the water absorption increased for the finer fraction with the IFSTTAR method (Table 9). Absorbent paper allowed for drying the surface of the fine particles, but the agglomerates were not able to be broken during the drying by absorbent paper because of capillary forces [56]. Therefore, the IFSTTAR method overestimated the water absorption of the fraction of RCA less than 0.63 mm. The same trends were obtained for laboratory-manufactured RCA and industrial RCA.
As can be seen in Table 9, the water absorption obtained with all the granular classes of well-carbonated RCA (RCAl_OC1_90 wc) was significantly lower than those obtained with noncarbonated RCA (RCAl_OC1_90). It can probably be attributed to the reduction in porosity caused by the transformation of portlandite to calcite in hardened cement paste during the accelerated carbonation [59,60,61].
Figure 11 demonstrates the water absorption (IFSTTAR method) as a function of the SFSA. The water absorption increased linearly with the increase in SFSA. The water absorption measured by the EN or IFSTTAR method for the finer fraction (0/0.63 mm) seems to be either underestimated or overestimated, respectively (for example the fraction 0/0.63 mm of RCAl_OC1_90 is shown in Figure 11). The water absorption of RCA depended on the water absorptions of hardened cement paste and NA and the proportions of hardened cement paste [49]. For a given initial concrete composition, the water absorptions of natural aggregates (WANA) and the hardened cement paste (WACP) did not depend on the granular classes of RCA. Thus, the water absorption of a given granular fraction of RCA (WARCA) can be determined with Equation (15).
W A R C A = W A C P × H C P C + W A N A × ( 1 H C P C )
where HCPC is the hardened cement paste content in RCA for the considered granular class.
Equation (15) indicated that WARCA varied linearly with the HCPC. Thus, the water absorption of the finer fraction (0/0.63 mm) can be obtained by extrapolation of the relation between WA and SFSA determined with the three coarser fractions of RCA. The extrapolation carried out using both EN and IFSTTAR methods gave similar values for the water absorption of fraction 0/0.63 mm. The average difference between these two values obtained for all studied RCA was 0.94% (Table 10). As expected, the water absorption of finer fraction obtained by extrapolation was between the value obtained by the EN and IFSTTAR methods (the water absorption of the fraction 0/0.63 mm corresponds to the extrapolated values from experimental results with the IFSTTAR method in Figure 11; the values measured by the EN and IFSTTAR methods were also reported for RCAl_OC1_90 to demonstrate that these experimental values are not appropriate). The accurate total water absorption of RCA used (fraction 0/5 mm) can be determined by knowing the proportion of each fraction through sieve analysis and its water absorption.
As shown in Figure 11, all industrial RCA tested were composed of the range of laboratory-produced RCA and well-carbonated RCA. As discussed previously, the water absorption of RCA directly depended on the water absorptions of hardened cement paste and NA, and the hardened cement paste content (HCPC) could also affect it. The water absorption of NA can be neglected compared with the water absorption of hardened cement paste. The water absorption of hardened cement paste depended on the property or porosity of hardened cement paste. Therefore, the water absorption of RCA depended on the properties of hardened cement pastes (W/C ratio, nature of cement, carbonation state) and HCPC. Thus, drawing the relationship between water absorption and the SFSA can be a very convenient way to differentiate different sources of RCA, since the composition of parent concrete is generally unknown for industrial RCA obtained from the recycling center. The slope of this regression can also be used to estimate the effect of weathering or some specific treatment of RCA after being crushed in a factory. Indeed, the linear relationship between the HCPC (obtained through SFSA) and the average particle size will be remained, because the presence of insoluble phases of the hardened cement paste will impact similarly for all granular classes of a given RCA. On the other hand, insoluble phases will impact the coefficients of the linear regression of the water absorption as a function of HCPC as this latter will decrease with an increase in the content of insoluble phases.
The method based on the dissolution of the major part of the hardened cement paste contained in RCA by salicylic acid (SFSA) seemed to be also applicable for the measurement of HCPC of industrial RCA. The method was not applied to obtain the absolute HCPC of industrial RCA, especially for carbonated RCA, as salicylic acid cannot dissolve the carbonated phases from hardened cement paste. However, the insoluble phases of the hardened cement paste will similarly impact all the granular classes. Therefore, it can give the slope of SFSA with granular class, and the relationship between water absorption and SFSA can be used to extrapolate the water absorption of the finer fraction for industrial RCA.

4. Conclusions

A method to estimate the hardened cement paste content in RCA based on the dissolution in a solution of salicylic acid in methanol was validated through a theoretical approach. It proved to be applicable for the measurement of HCPC for industrial RCA and laboratory-manufactured RCA. The main conclusions can be drawn as follows:
(1)
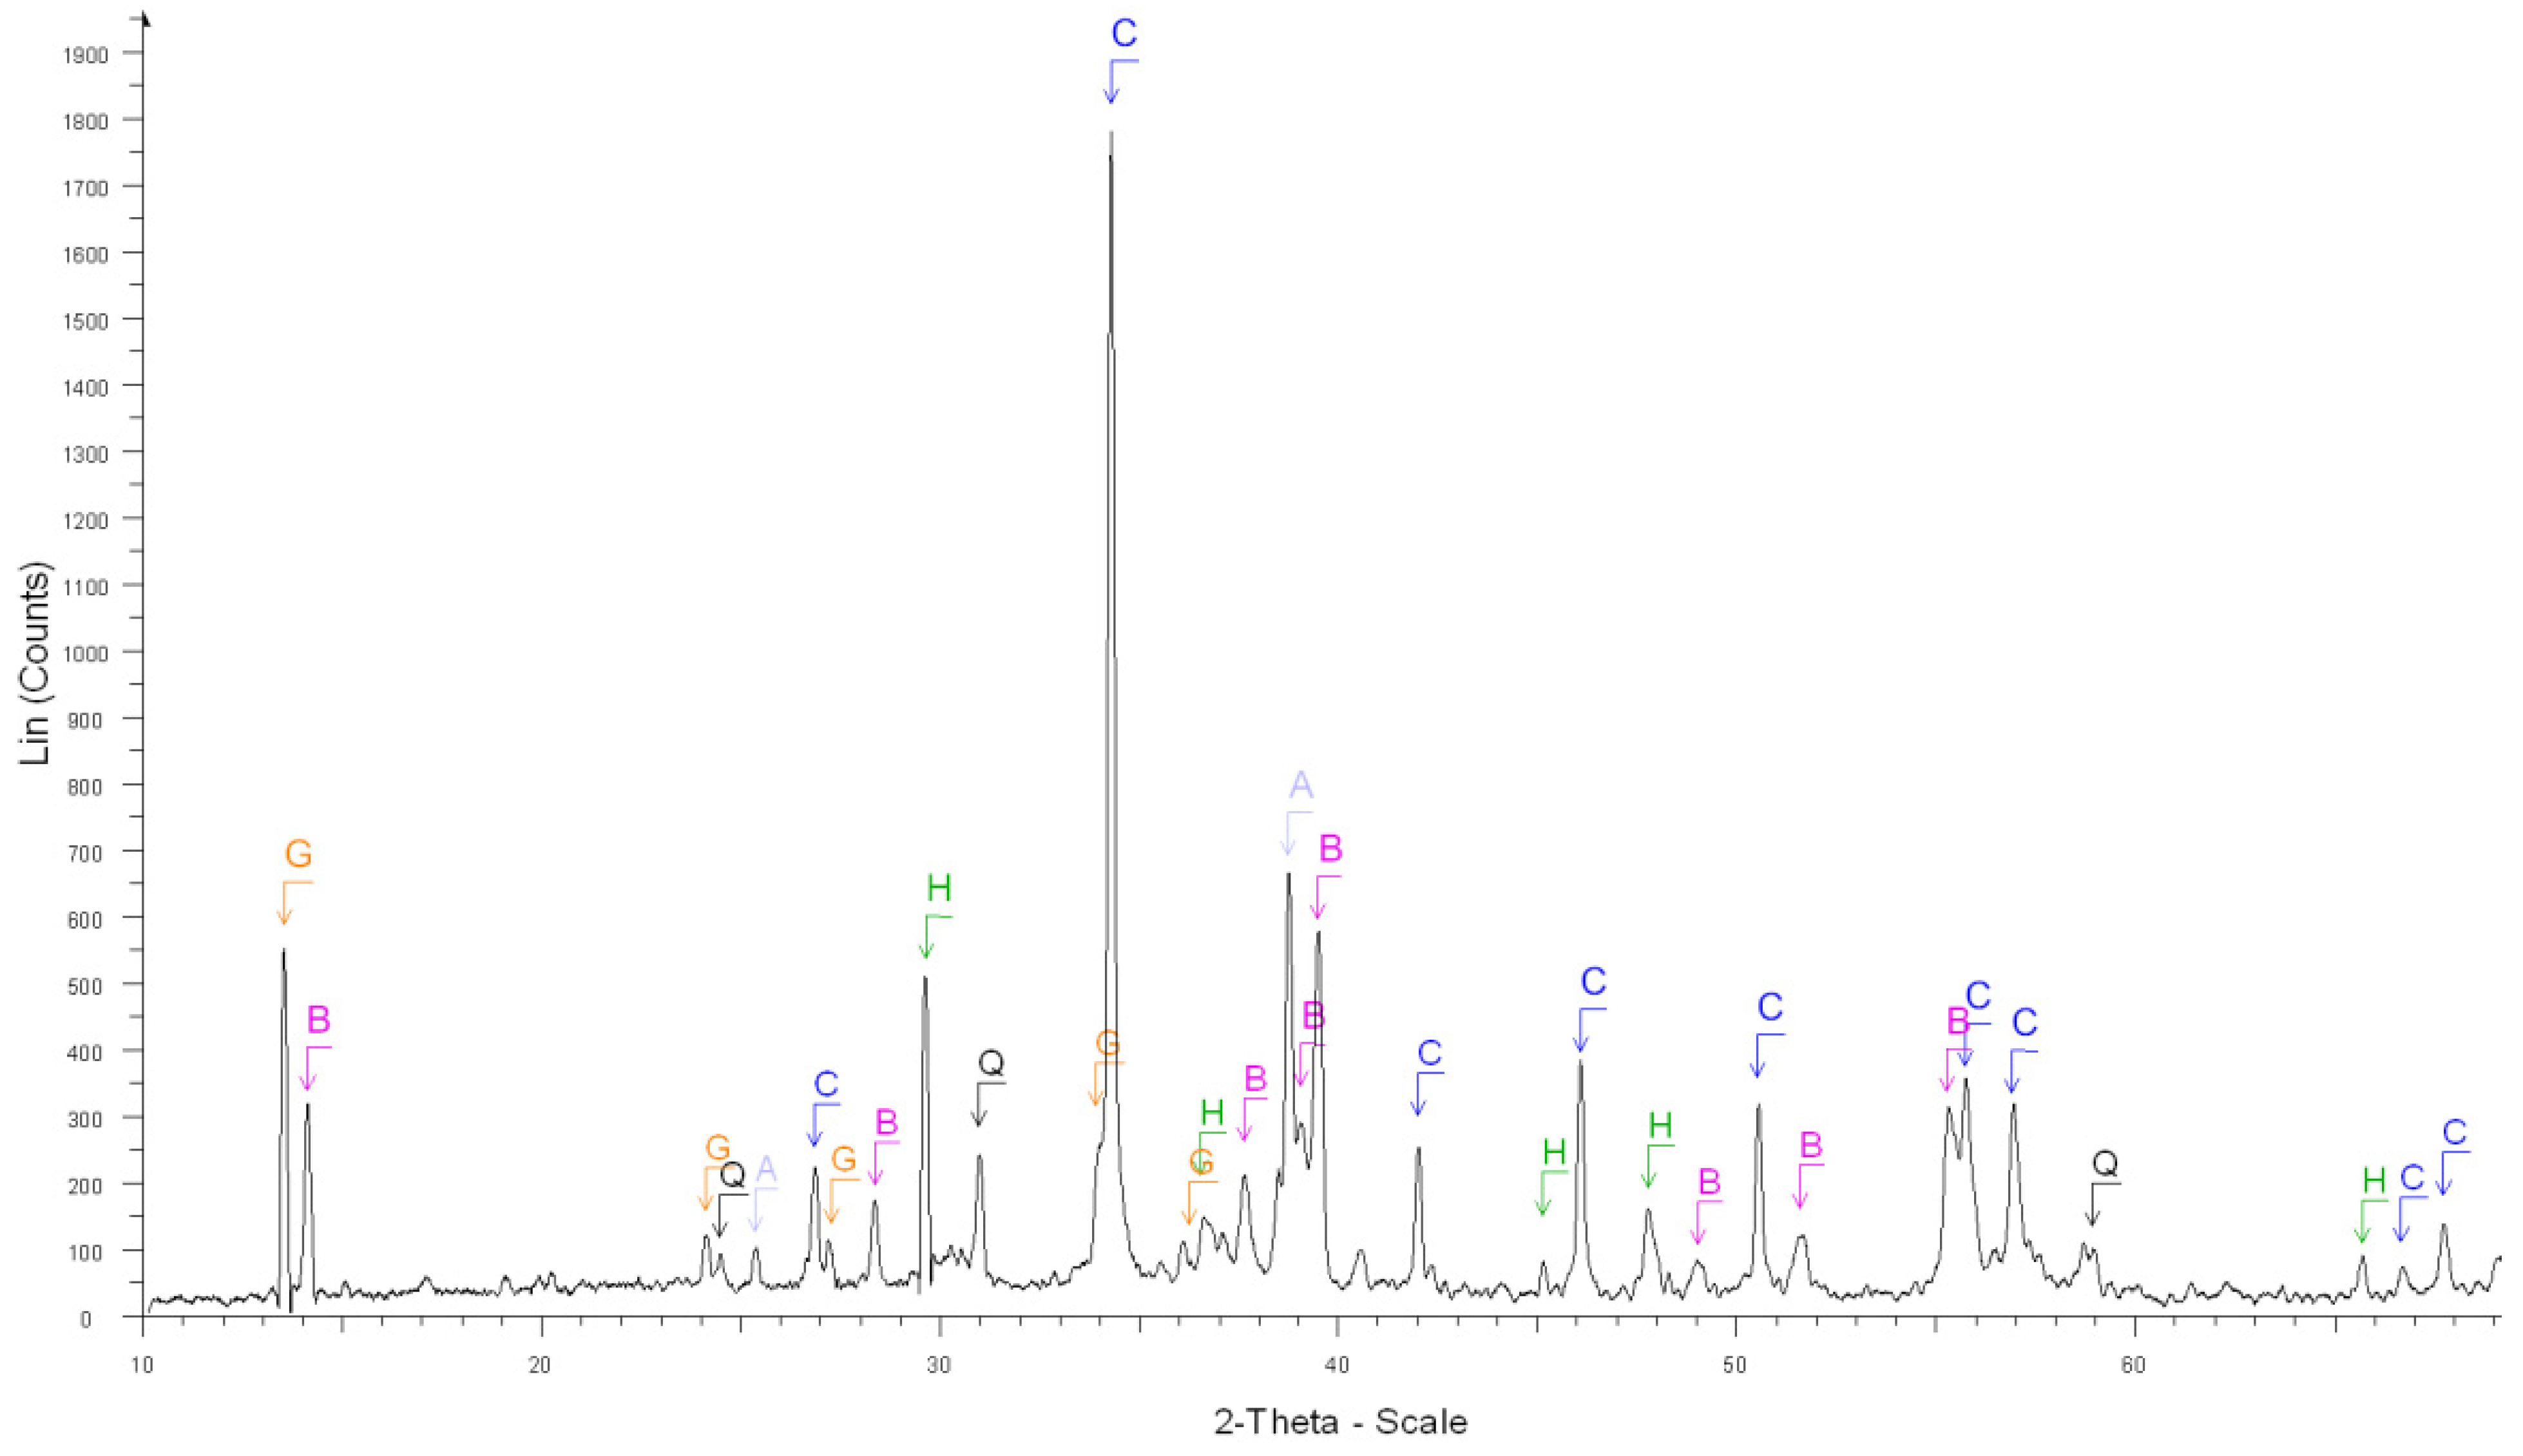
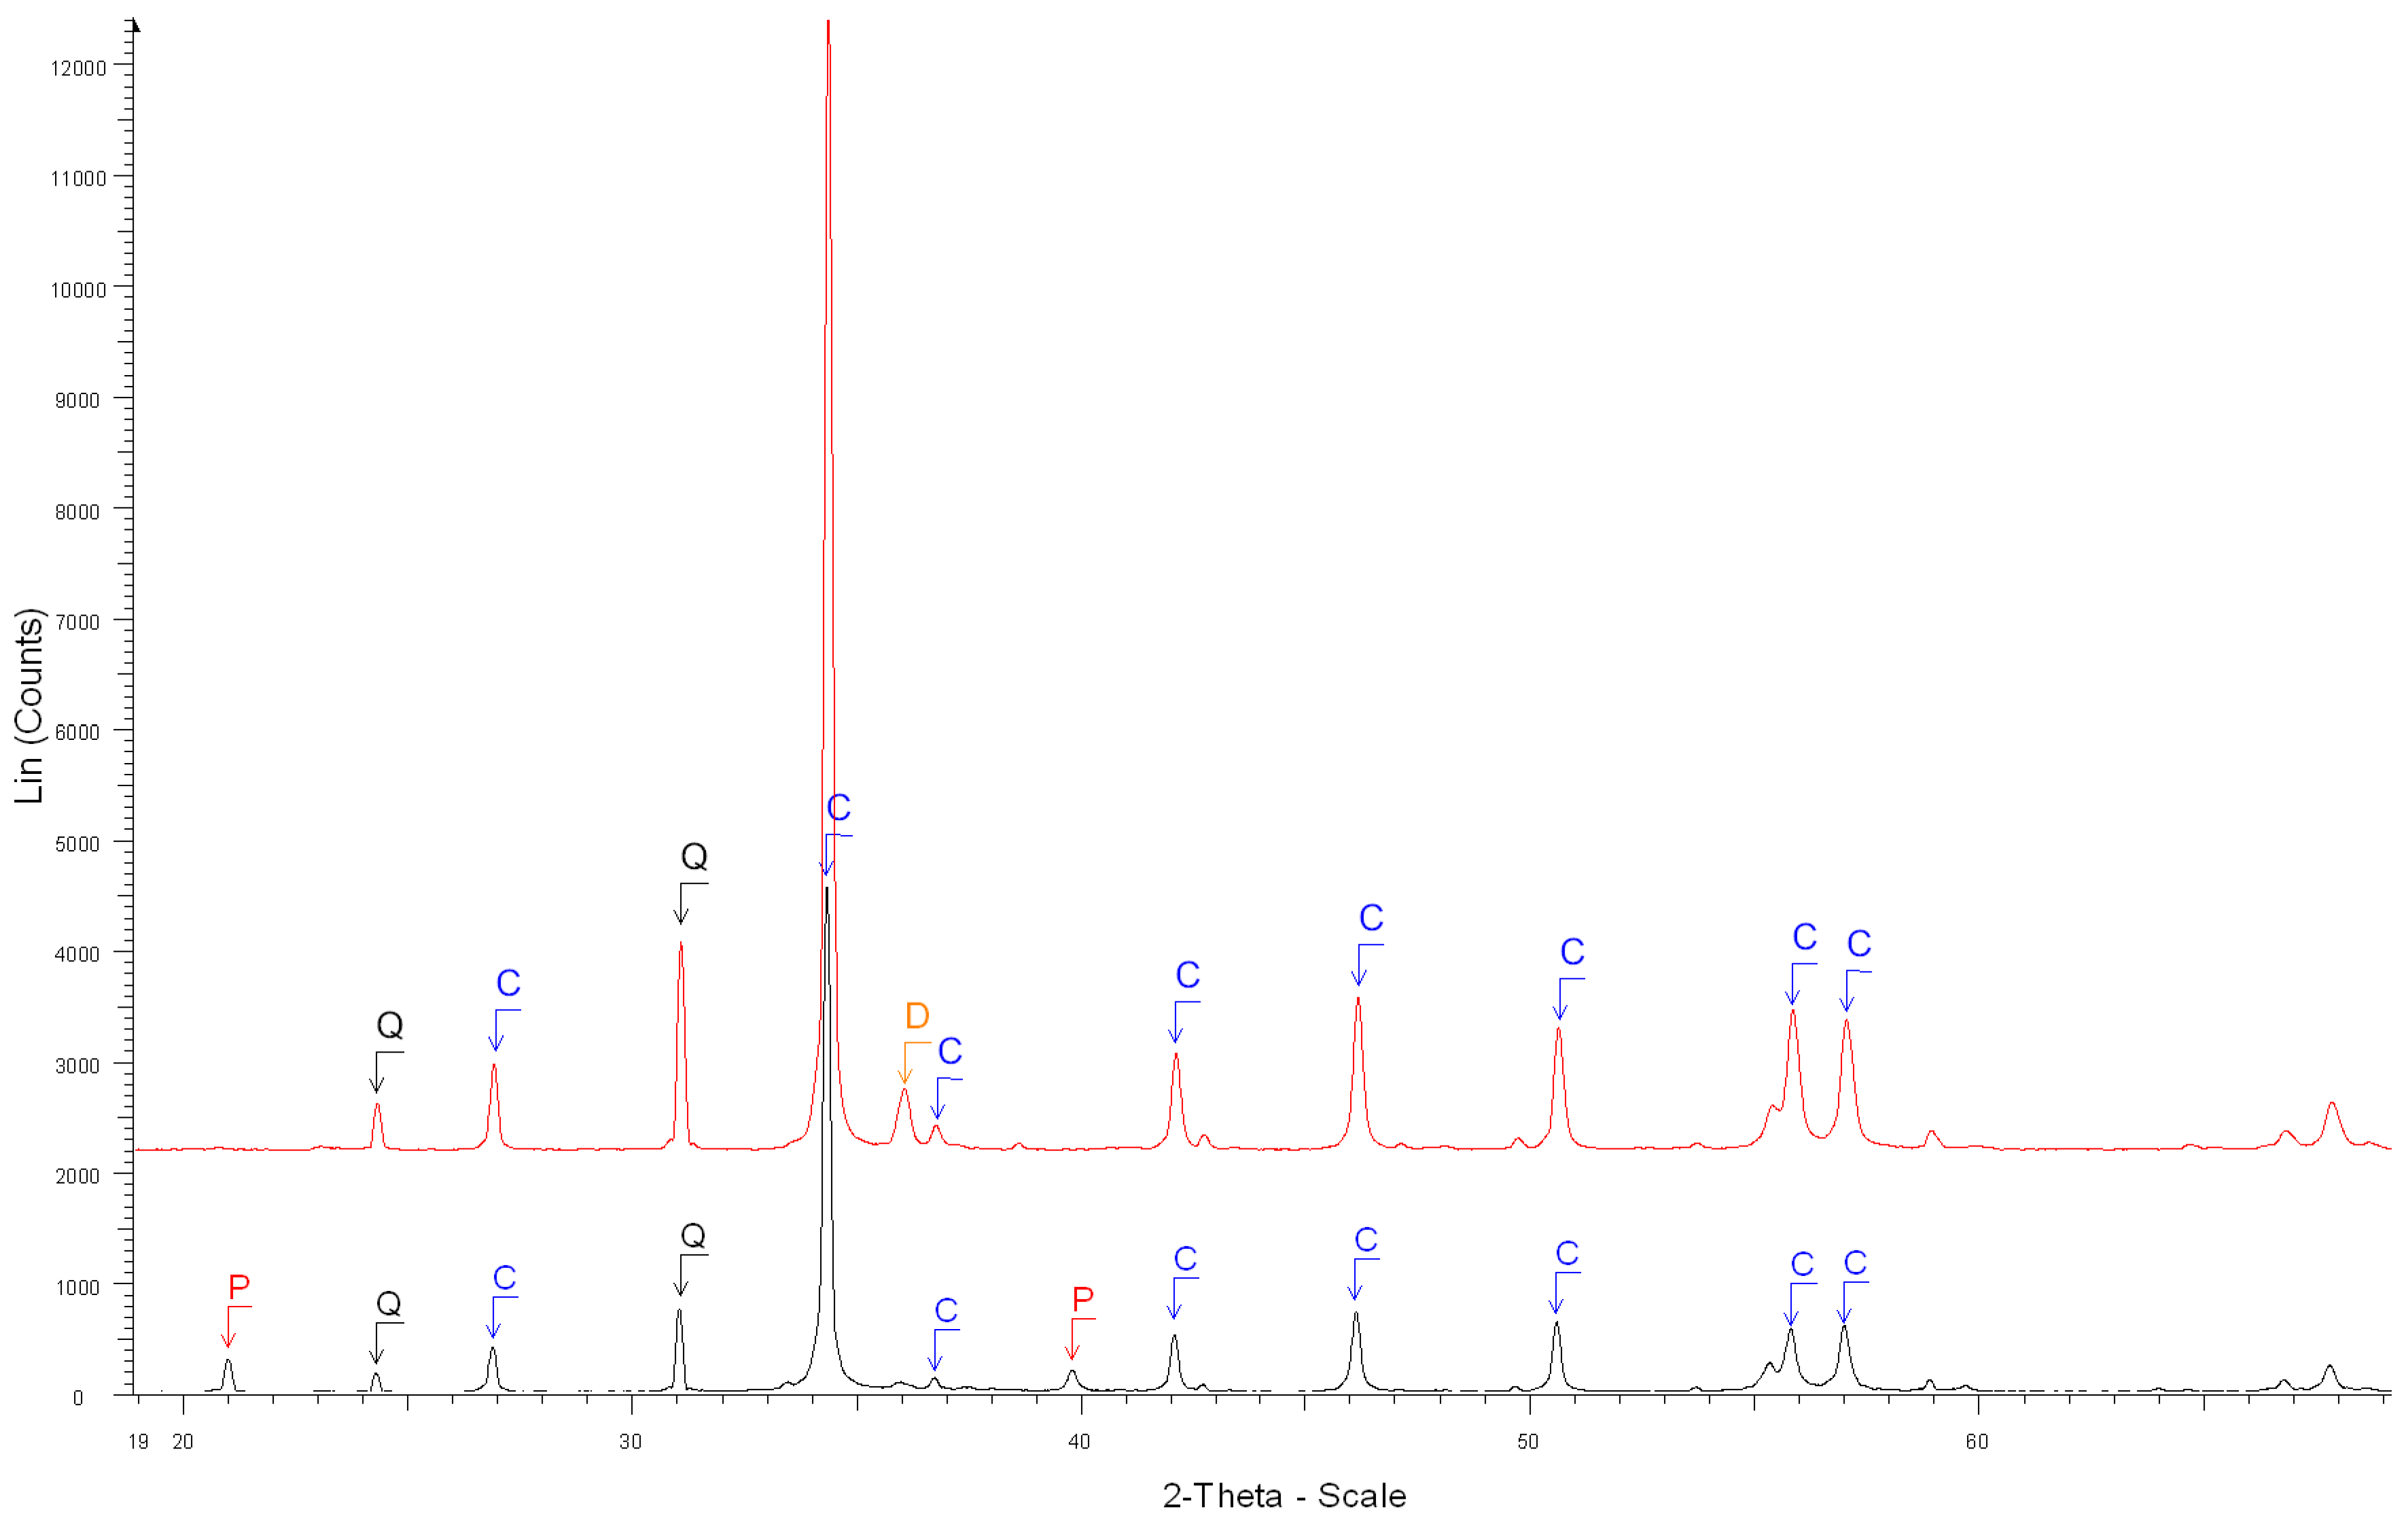
The XRD results confirmed that the salicylic acid allowed us to dissolve most of the phases contained in OPC cement paste (Ca(OH)2, C-S-H, ettringite, C2S, C3S) but not the main phases contained in natural aggregates and especially limestone;
(2)
The experimental results showed that 95.57% of white cement paste and 62.99% of grey cement paste were dissolved while only 0.83% of siliceous sand and 3.21% of calcareous aggregate were dissolved. For white cement paste, the soluble fraction in salicylic acid (SFSA) was almost identical to the HCPC. For the grey cement paste (higher content of C3A, C4AF and calcite), SFSA corresponded to only 62.99% of HCPC. For cement paste made with CBR CEM 52.5 N after a long time cured in water, SFSA corresponded to 78.42% of HCPC. Most phases of cement paste made with blend cement (CBR CEM III/A 42.5 N: Portland cement combined with slag) can dissolve in salicylic acid, which corresponded to 80.14% of HCPC;
(3)
The difference between SFSA and HCPC could be estimated theoretically by modelling the hydration of cement paste with the chemical equations and the corresponding stoichiometric ratios. The experimentally obtained SFSA values were very close to the values calculated for the three pure cement pastes. The model results were consistent with the experimental results;
(4)
SFSA in RCA obtained from industrial center increased as the particle size decreased, which showed a similar tendency as laboratory-manufactured RCA. In addition, all experimental values were within the range of the calculated values based on mortar and concrete composition. This indicated that the RCA contained both crushed mortar and part of coarse NA from parent concrete. The SFSA obtained for industrial RCA was significantly lower than those measured for laboratory-manufactured RCA. These results might be attributed to the nature of cement used in parent concrete (e.g., CEM II contains a higher insoluble fraction in salicylic acid such as limestone) and any carbonation of cement paste also reducing the soluble fraction. Therefore, SFSA did not give the exact value of HCPC for industrial RCA, but it was demonstrated that the SFSA was sufficient to correlate HCPC with the other properties of RCA.
(5)
The properties of RCA including specific density, water absorption and porosity were strongly correlated to HCPC. The higher the HCPC or SFSA, the higher the water absorption and porosity, and the lower the specific density. The linear relationship can be obtained between the water absorption (porosity, specific density) and the HCPC or SFSA. The water absorption could be estimated with good accuracy for very fine RCA (laboratory-manufactured RCA or industrial RCA) by extrapolating the relationship obtained between water absorption and HCPC or SFSA with coarser granular class, which was important for the formulation of concrete made with RCA, but the value was quite difficult to accurately measure.

Author Contributions

Z.Z.: writing—original draft preparation, investigation, writing—review and editing, funding acquisition. J.X.: writing—review and editing. D.D.: conceptualization, validation. D.B.: validation. S.R.: conceptualization. L.C.: validation. All authors have read and agreed to the published version of the manuscript.

Funding

This research was supported by the Fundamental Research Funds for the Central Universities, funding numbers: 22120220084 and 22120210317 (Tongji University).

Institutional Review Board Statement

Not applicable.

Informed Consent Statement

Not applicable.

Data Availability Statement

Not applicable.

Acknowledgments

The authors would like to thank the LafargeHolcim Company and CBR Company for the cement and natural aggregates. The authors would also like to thank the Colas Company for supplying industrial RCA. The authors would like to thank the Fundamental Research Funds for the Central Universities (Tongji University, funding numbers: 22120220084 and 22120210317) for their financial support.

Conflicts of Interest

The authors declare no conflict of interest. The funders had no role in the design of the study; in the collection, analyses, or interpretation of data; in the writing of the manuscript; or in the decision to publish the results.

References

  1. Eurostat Generation of Waste by Economic Activity. Statistical Classification of Economic Activities in the European Community (NACE Rev.2): Construction. Available online: https://ec.europa.eu/eurostat/databrowser/view/ten00106/default/bar?lang=en (accessed on 28 January 2022).
  2. UEPG. European Aggregates Association—Annual Review 2019–2020; UEPG: Brussels, Belgium, 2020. [Google Scholar]
  3. Xiao, J.; Li, W.; Fan, Y.; Huang, X. An overview of study on recycled aggregate concrete in China (1996–2011). Constr. Build. Mater. 2012, 31, 364–383. [Google Scholar] [CrossRef]
  4. Zhao, Z.; Courard, L.; Groslambert, S.; Jehin, T.; Léonard, A.; Xiao, J. Use of recycled concrete aggregates from precast block for the production of new building blocks: An industrial scale study. Resour. Conserv. Recycl. 2020, 157, 104786. [Google Scholar] [CrossRef]
  5. Xiao, J.; Xie, H.; Zhang, C. Investigation on building waste and reclaim in Wenchuan earthquake disaster area. Resour. Conserv. Recycl. 2012, 61, 109–117. [Google Scholar] [CrossRef]
  6. Batayneh, M.; Marie, I.; Asi, I. Use of selected waste materials in concrete mixes. Waste Manag. 2007, 27, 1870–1876. [Google Scholar] [CrossRef]
  7. Zaharieva, R.; Buyle-Bodin, F.; Wirquin, E. Frost resistance of recycled aggregate concrete. Cem. Concr. Res. 2004, 34, 1927–1932. [Google Scholar] [CrossRef]
  8. Etxeberria, M.; Vázquez, E.; Marí, A.; Barra, M. Influence of amount of recycled coarse aggregates and production process on properties of recycled aggregate concrete. Cem. Concr. Res. 2007, 37, 735–742. [Google Scholar] [CrossRef]
  9. Katz, A. Properties of concrete made with recycled aggregate from partially hydrated old concrete. Cem. Concr. Res. 2003, 33, 703–711. [Google Scholar] [CrossRef]
  10. Pedro, D.; de Brito, J.; Evangelista, L. Structural concrete with simultaneous incorporation of fine and coarse recycled concrete aggregates: Mechanical, durability and long-term properties. Constr. Build. Mater. 2017, 154, 294–309. [Google Scholar] [CrossRef]
  11. Manzi, S.; Mazzotti, C.; Bignozzi, M.C. Short and long-term behavior of structural concrete with recycled concrete aggregate. Cem. Concr. Compos. 2013, 37, 312–318. [Google Scholar] [CrossRef]
  12. Zhao, Z.; Remond, S.; Damidot, D.; Courard, L.; Michel, F. Improving the properties of recycled concrete aggregates by accelerated carbonation. Proc. Inst. Civ. Eng. Constr. Mater. 2018, 171, 126–132. [Google Scholar] [CrossRef] [Green Version]
  13. Zhao, Z.; Courard, L.; Michel, F.; Remond, S.; Damidot, D. Influence of granular fraction and origin of recycled concrete aggregates on their properties. Eur. J. Environ. Civ. Eng. 2018, 22, 1457–1467. [Google Scholar] [CrossRef] [Green Version]
  14. Kou, S.C.; Poon, C.S. Properties of concrete prepared with crushed fine stone, furnace bottom ash and fine recycled aggregate as fine aggregates. Constr. Build. Mater. 2009, 23, 2877–2886. [Google Scholar] [CrossRef]
  15. Padmini, A.K.; Ramamurthy, K.; Mathews, M.S. Influence of parent concrete on the properties of recycled aggregate concrete. Constr. Build. Mater. 2009, 23, 829–836. [Google Scholar] [CrossRef]
  16. Hansen, T.C. Recycled aggregates and recycled aggregate concrete second state-of-the-art report developments 1945–1985. Mater. Struct. 1986, 19, 201–246. [Google Scholar] [CrossRef]
  17. Kou, S.C.; Poon, C.S. Enhancing the durability properties of concrete prepared with coarse recycled aggregate. Constr. Build. Mater. 2012, 35, 69–76. [Google Scholar] [CrossRef]
  18. Thomas, C.; Setién, J.; Polanco, J.A.; Alaejos, P.; De Juan, M.S. Durability of recycled aggregate concrete. Constr. Build. Mater. 2013, 40, 1054–1065. [Google Scholar] [CrossRef]
  19. Sagoe-Crentsil, K.K.; Brown, T.; Taylor, A.H. Performance of concrete made with commercially produced coarse recycled concrete aggregate. Cem. Concr. Res. 2001, 31, 707–712. [Google Scholar] [CrossRef]
  20. Kwan, W.H.; Ramli, M.; Kam, K.J.; Sulieman, M.Z. Influence of the amount of recycled coarse aggregate in concrete design and durability properties. Constr. Build. Mater. 2012, 26, 565–573. [Google Scholar] [CrossRef]
  21. Olorunsogo, F.T.; Padayachee, N. Performance of recycled aggregate concrete monitored by durability indexes. Cem. Concr. Res. 2002, 32, 179–185. [Google Scholar] [CrossRef]
  22. Wagih, A.M.; El-Karmoty, H.Z.; Ebid, M.; Okba, S.H. Recycled construction and demolition concrete waste as aggregate for structural concrete. HBRC J. 2013, 9, 193–200. [Google Scholar] [CrossRef] [Green Version]
  23. Khatib, J.M. Properties of concrete incorporating fine recycled aggregate. Cem. Concr. Res. 2005, 35, 763–769. [Google Scholar] [CrossRef]
  24. Evangelista, L.; de Brito, J. Durability performance of concrete made with fine recycled concrete aggregates. Cem. Concr. Compos. 2010, 32, 9–14. [Google Scholar] [CrossRef]
  25. de Juan, M.S.; Gutiérrez, P.A. Study on the influence of attached mortar content on the properties of recycled concrete aggregate. Constr. Build. Mater. 2009, 23, 872–877. [Google Scholar] [CrossRef]
  26. Abbas, A.; Fathifazl, G.; Fournier, B.; Isgor, O.B.; Zavadil, R.; Razaqpur, A.G.; Foo, S. Quantification of the residual mortar content in recycled concrete aggregates by image analysis. Mater. Charact. 2009, 60, 716–728. [Google Scholar] [CrossRef]
  27. Topçu, I.B.; Şengel, S. Properties of concretes produced with waste concrete aggregate. Cem. Concr. Res. 2004, 34, 1307–1312. [Google Scholar] [CrossRef]
  28. Hansen, T.C.; Narud, H. Strength of recycled concrete made from crushed concrete coarse aggregate. Concr. Int. 1983, 5, 79–83. [Google Scholar]
  29. Ulsen, C.; Contessotto, R.; dos Santos Macedo, R.; Kahn, H. Quantification of the cement paste and phase’s association in fine recycled aggregates by SEM-based image analysis. Constr. Build. Mater. 2022, 320, 126206. [Google Scholar] [CrossRef]
  30. dos Santos Macedo, R.; Ulsen, C.; Mueller, A. Quantification of residual cement paste on recycled concrete aggregates containing limestone by selective dissolution. Constr. Build. Mater. 2019, 229, 116875. [Google Scholar] [CrossRef]
  31. Yagishita, F.; Sano, M.; Yamada, M. Behavior of Reinforced Concrete Beams Containing Recycled Coarse Aggregate. Demolition and Reuse of Concrete and Masonry; CRC Press: London, UK, 1994. [Google Scholar]
  32. Nagataki, S.; Gokce, A.; Saeki, T.; Hisada, M. Assessment of recycling process induced damage sensitivity of recycled concrete aggregates. Cem. Concr. Res. 2004, 34, 965–971. [Google Scholar] [CrossRef]
  33. Ulsen, C.; Tseng, E.; Angulo, S.C.; Landmann, M.; Contessotto, R.; Balbo, J.T.; Kahn, H. Concrete aggregates properties crushed by jaw and impact secondary crushing. J. Mater. Res. Technol. 2019, 8, 494–502. [Google Scholar] [CrossRef]
  34. Lu, B.; Shi, C.; Zhang, J.; Wang, J. Effects of carbonated hardened cement paste powder on hydration and microstructure of Portland cement. Constr. Build. Mater. 2018, 186, 699–708. [Google Scholar] [CrossRef]
  35. van de Wouw, P.M.F.; Florea, M.V.A.; Brouwers, H.J.H.J. Methods for determining and tracking the residual cement paste content of recycled concrete. In Proceedings of the 2nd International Conference of Sustainable Building Materials (ICSBM 2019), Eindhoven, The Netherlands, 12–15 August 2019; pp. 226–233. [Google Scholar]
  36. Poon, C.S.; Shui, Z.H.; Lam, L.; Fok, H.; Kou, S.C. Influence of moisture states of natural and recycled aggregates on the slump and compressive strength of concrete. Cem. Concr. Res. 2004, 34, 31–36. [Google Scholar] [CrossRef]
  37. Théréné, F.; Keita, E.; Nael-Redolfi, J.; Boustingorry, P.; Bonafous, L.; Roussel, N. Water absorption of recycled aggregates: Measurements, influence of temperature and practical consequences. Cem. Concr. Res. 2020, 137, 106196. [Google Scholar] [CrossRef]
  38. Bouarroudj, M.E.; Rémond, S.; Bulteel, D.; Potier, G.; Michel, F.; Zhao, Z.; Courard, L. Use of grinded hardened cement pastes as mineral addition for mortars. J. Build. Eng. 2021, 34, 101863. [Google Scholar] [CrossRef]
  39. Taboada, G.L.; Seruca, I.; Sousa, C.; Pereira, Á. Exploratory data analysis and data envelopment analysis of construction and demolitionwaste management in the European economic area. Sustainability 2020, 12, 4995. [Google Scholar] [CrossRef]
  40. Zhang, C.; Hu, M.; Di Maio, F.; Sprecher, B.; Yang, X.; Tukker, A. An overview of the waste hierarchy framework for analyzing the circularity in construction and demolition waste management in Europe. Sci. Total Environ. 2022, 803, 149892. [Google Scholar] [CrossRef]
  41. Fang, X.; Xuan, D.; Zhan, B.; Li, W.; Poon, C.S. A novel upcycling technique of recycled cement paste powder by a two-step carbonation process. J. Clean. Prod. 2021, 290, 125192. [Google Scholar] [CrossRef]
  42. Zhao, Z.; Remond, S.; Damidot, D.; Xu, W. Influence of fine recycled concrete aggregates on the properties of mortars. Constr. Build. Mater. 2015, 81, 179–186. [Google Scholar] [CrossRef]
  43. CEN EN 1097; Tests for Mechanical and Physical Properties of Aggregates-Part 6: Determination of Particle Density and Water Absorption. British Standard Institution: London, UK, 2014.
  44. ASTM C 128; Standard Test Method for Density, Relative Density (Specific Gravity), and Absorption of Fine Aggregate. ASTM International: West Conshohocken, PA, USA, 2004.
  45. IFSTTAR Test N° 78; Tests on Granulates in Concrete: Measurement of Total Water Absorption of Crushed Sand. Institut Français des Sciences et Technologies des Transports, de L’améNagement et des Réseaux: Paris, France, 2011.
  46. Djerbi Tegguer, A. Determining the water absorption of recycled aggregates utilizing hydrostatic weighing approach. Constr. Build. Mater. 2012, 27, 112–116. [Google Scholar] [CrossRef]
  47. Tam, V.W.Y.; Gao, X.F.; Tam, C.M.; Chan, C.H. New approach in measuring water absorption of recycled aggregates. Constr. Build. Mater. 2008, 22, 364–369. [Google Scholar] [CrossRef] [Green Version]
  48. CEN EN 197-1; Cement–Part 1: Composition, Specifications and Conformity Criteria for Common Cements. CEN: Brussels, Belgium, 2011.
  49. Zhao, Z.; Remond, S.; Damidot, D.; Xu, W. Influence of hardened cement paste content on the water absorption of fine recycled concrete aggregates. J. Sustain. Cem. Mater. 2013, 2, 186–203. [Google Scholar] [CrossRef]
  50. de Larrard, F.; Colina, H. The French National Project Recybéton: To Bring the Concrete World into Circular Economy. Available online: https://www.pnrecybeton.fr/en/ (accessed on 9 April 2019).
  51. Luke, K.; Glasser, F. Selective dissolution of hydrated blast furnace slag cements. Cem. Concr. Res. 1987, 17, 273–282. [Google Scholar] [CrossRef]
  52. Gutteridge, W.A. On the dissolution of the interstitial phases in Portland cement. Cem. Concr. Res. 1979, 9, 319–324. [Google Scholar] [CrossRef]
  53. Ohsawa, S.; Asaga, K.; Goto, S.; Daimon, M. Quantitative determination of fly ash in the hydrated fly ash—CaSO4·2H2O-Ca(OH)2 system. Cem. Concr. Res. 1985, 15, 357–366. [Google Scholar] [CrossRef]
  54. Zhao, Z. Re-Use of Fine Recycled Concrete Aggregates for the Manufacture of Mortars. Doctoral Dissertation, University of Lille, Lille, France, 2014. [Google Scholar]
  55. CEN EN 196; Methods of testing cement–Part 1: Determination of strength. European Committee for Standardization. CEN: Brussels, Belgium, 2005.
  56. Zhao, Z.; Remond, S.; Damidot, D.; Courard, L. Toward the quantification of the cement paste content of fine recycled concrete aggregates by salicylic acid dissolution corrected by a theoretical approach. In Proceedings of the 14th International Congress on the Chemistry of Cement, Beijing, China, 13 October 2015. [Google Scholar]
  57. Thiery, M.; Villain, G.; Dangla, P.; Platret, G. Investigation of the carbonation front shape on cementitious materials: Effects of the chemical kinetics. Cem. Concr. Res. 2007, 37, 1047–1058. [Google Scholar] [CrossRef]
  58. Shi, Z.; Lothenbach, B.; Geiker, M.R.; Kaufmann, J.; Leemann, A.; Ferreiro, S.; Skibsted, J. Experimental studies and thermodynamic modeling of the carbonation of Portland cement, metakaolin and limestone mortars. Cem. Concr. Res. 2016, 88, 60–72. [Google Scholar] [CrossRef]
  59. Grabiec, A.M.; Klama, J.; Zawal, D.; Krupa, D. Modification of recycled concrete aggregate by calcium carbonate biodeposition. Constr. Build. Mater. 2012, 34, 145–150. [Google Scholar] [CrossRef]
  60. Ngala, V.T.; Page, C.L. Effects of carbonation on pore structure and diffusional properties of hydrated cement pastes. Cem. Concr. Res. 1997, 27, 995–1007. [Google Scholar] [CrossRef]
  61. Lawrence, R.M.; Mays, T.J.; Rigby, S.P.; Walker, P.; D’Ayala, D. Effects of carbonation on the pore structure of non-hydraulic lime mortars. Cem. Concr. Res. 2007, 37, 1059–1069. [Google Scholar] [CrossRef]
Figure 1. Experimental protocol of measurement of hardened cement paste content in RCA (the subfigure refers to the corresponding procedure).
Materials 15 03384 g001
Figure 2. XRD diffractograms: After the dissolution of white cement. C, F, Z, S, A and M stand for calcite, calcium sulfate, syngenite, calcium sulfate hydrate, calcium sulfate hydrate, portlandite and calcite magnesian, respectively.
Materials 15 03384 g002
Figure 3. XRD diffractograms: After the dissolution of grey cement. C, B, H, G, Q, A and M stand for calcite, brownmillerite, anhydrite, gypsum, quartz, calcium aluminum oxide and calcite magnesian, respectively.
Materials 15 03384 g003
Figure 4. XRD diffractograms: Before (black curve below) and after the dissolution (red curve above) of white cement paste. B, C, P and L stand for brownmillerite, calcite, portlandite and β-dicalcium silicate, respectively.
Materials 15 03384 g004
Figure 5. XRD diffractograms: Before (black curve below) and after the dissolution (red curve above) of grey cement paste. B, S, C, Q, A, P and L stand for brownmillerite, calcium sulfate hydrate, calcite, quartz, calcium aluminum oxide, portlandite and β-dicalcium silicate, respectively.
Materials 15 03384 g005
Figure 6. XRD diffractograms: Before (black curve below) and after the dissolution (red curve above) of RCAl_OC1_90 0.63/1.25 mm. Q, C, D, and P stand for quartz, calcite, dolomite and portlandite, respectively.
Materials 15 03384 g006
Figure 7. Variations of theoretical SFSA for pure grey cement paste, pure cement paste with CBR CEM I 52.5 N and for pure white cement-based paste, mortar of concrete OC1 and concrete OC1. Three horizontal solid lines show the comparison with the values obtained for the corresponding cement pastes.
Materials 15 03384 g007
Figure 8. SFSA as a function of the average particle size of the four granular classes for all studied RCA.
Materials 15 03384 g008
Figure 9. Density as a function of the granular classes for all studied RCA.
Materials 15 03384 g009
Figure 10. Correlation between specific density and SFSA in RCA.
Materials 15 03384 g010
Figure 11. Correlation between water absorption (IFSTTAR method) and SFSA for all studied RCA.
Materials 15 03384 g011
Table 1. Summary of the hardened cement paste content or adherent mortar content measurement of RCA from literature.
Author (Reference No.)Test MethodsFractions of RCA (mm)Adherent Mortar or Hardened Cement Paste Content (%)Advantages/Disadvantages
Etxeberria et al. [8]Not mentionedCRCA 4/10, 10/2540% for fraction 4/10; 20% for fraction 10/25-
De Juan et al. [25] Thermal method15 samples of CRCA 4/8, 8/1633–55% for fraction 4/8; 23–44% for fraction 8/16This method is only suitable for CRCA because the removal of mortar necessitates “brushing” the RCA, which is difficult with small particles.
Nagataki et al. [32]Hydrochloric acid solution methodCRCA 5/2052.3–55% for level 1; 30.2–32.4% for level 3This method cannot be used for RCA containing limestone aggregates and filler, which are also dissolved by hydrochloric acid.
Yagishita et al. [31]Hydrochloric acid solution methodCRCA 5/10, 10/2040.2% for low-grade fraction 10/20, 35.2 for low-grade fraction 5/10; 26% for medium-grade fraction 10/20, 16.7 for low-grade fraction 5/10
Abbas et al. [26]Image analysis method and sodium sulphate solution methodTwo CRCA 4.75/9.5, 9.5/12.7,12.7/19Image analysis: 30%, 21%, 21% for 4.75/9.5, 9.5/12.7, 12.7/19, respectively;
Sodium sulphate solution method: 26%,22%,21% for 4.75/9.5, 9.5/12.7, 12.7/19, respectively
The image analysis method is suitable for the quantification of residual mortar in CRCA. Moreover, this method is long to perform as a statistical approach is needed.
The sodium sulphate solution method is only suitable for CRCA.
Hansen and Narud [28]Linear traverse methodCRCA 4/8, 8/16, 16/3258–64% for fraction 4/8; 38–39% for fraction 8/16; 25–35% for fraction 16/32This linear traverse method is only suitable for adherent mortar content of CRCA.
Topçu et al. [27]Linear traverse methodCRCA 4/8, 16/3260% for fraction 4/8; 30% for fraction 16/32
Ulsen et al. [29]X-ray SEM-based image analysisFRCA 0.15/3.0HCPC: 10% for the fraction 0.15/3.0; 15% for the fraction 0.15/0.3The correlations between the sum of CaO and LOI and cement paste + carbonates, and the comparison to the cement plus carbonate content by HCl leaching stated the reliability SEM-based image analysis.
Macedo et al. [30]The dissolution method in deionized water (10 days)Simulated 1%, 5%, 10% and 20% hardened cement pasteThe deionized method presents good efficiency in the removal of the calcium ions from the hydrated cement phases, C-S-H and CH in the simulated samplesThere is the carbonation contamination and dissolution in deionized water takes ten days, which is too long. In addition, the ICP analysis is expensive.
Table 2. Mineralogical composition of cement determined by the XRD-Rietveld (%).
C3SC2SC3AC4AFAnhydriteCalcitePericlaseGypsumQuartzSlag
White cement CEM I 52.5 N73.9021.871.46-0.521.530.72---
Grey cement CEM II/A-L 52.5 N52.378.018.868.890.7417.930.462.050.7-
CBR CEM III/A 42.5 N35.17.913.295.220.160.03-0.86-44.01
CBR CEM I 52.5 N66.9712.087.199.470.021.03-1.76--
Table 3. XRD results before and after dissolution in salicylic acid and methanol for cement and pastes (number of * refers to the percentage of phases, the more *, the more percentage presented).
SampleInsoluble Phases
1. After the dissolution of white cement
(Figure 2)
Calcite Ca(CO3) ****,
Calcium Sulfate Ca(SO4) **,
Syngenite K2Ca(SO4)2.H2O *,
Calcium Sulfate Hydrate Ca(SO4)(H2O)0.5 *,
Calcium Aluminum Oxide Ca3Al2O6 ***,
Calcite, magnesian Ca,Mg(CO3) **
2. After the dissolution of grey cement
(Figure 3)
Calcite Ca(CO3) ****,
Brownmillerite Ca2(Al, Fe + 3)2O5 **,
Anhydrite Ca(SO4) **,
Gypsum Ca(SO4).2H2O *, Quartz SiO2 *,
Calcium Aluminum Oxide Ca3Al2O6 ***
Calcite, magnesian Ca,Mg(CO3) *
3. Before the dissolution of white cement paste (Figure 4)Portlandite Ca(OH)2 ****, β-dicalcium Silicate Ca2SiO4 **,
Calcite Ca(CO3) *, Tricalcium Silicate Ca3SiO5 *,
Calcium Silicate Hydrate Ca1.5SiO3.5 ×H2O *
4. After the dissolution of white cement paste (Figure 4)Calcite Ca(CO3) ****,
Calcium Sulfate Hydrate Ca(SO4).0.5H2O ***,
Bassanite Ca(SO4).0.5H2O ***
5. Before the dissolution of grey cement paste (Figure 5)Portlandite Ca(OH)2 ****, Calcite Ca(CO3) ***, Quartz SiO2 *,
β-dicalcium Silicate Ca2SiO4 **,
Calcium Aluminum Oxide Carbonate Hydroxide Hydrate (AFm hemi carbonate) Ca4Al2O6(CO3)0.5(OH).11.5H2O **,
Brownmillerite Ca2(Al, Fe +3)2O5 *
6. After the dissolution of grey cement paste(Figure 5)Calcite Ca(CO3) ****, Quartz SiO2 *
Calcium Aluminum Oxide Ca3Al2O6 *,
Brownmillerite Ca2(Al, Fe + 3)2O5 **,
Calcium Sulfate Hydrate Ca(SO4).0.5H2O *,
Calcium Aluminum Iron Oxide Ca3(Al, Fe)2O6 *
7. Before the dissolution of RCAl_OC1_90 0.63/1.25 mm (Figure 6)Calcite Ca(CO3) ****, Quartz SiO2 **,
Portlandite Ca(OH)2 **
8. After the dissolution of RCAl_OC1_90 0.63/1.25 mm (Figure 6)Calcite Ca(CO3) ****, Quartz SiO2 **,
Dolomite CaMg(CO3)2 *
Table 4. Experimental results of SFSA for cement pastes and natural aggregates (%).
Test 1Test 2Test 3Mean
Value
Standard Deviation Value
White cement paste (CEM I 52.5 N)95.4696.3594.8995.570.74
Grey cement paste (CEM II/A-L 52.5 N)62.5663.0863.3362.990.39
Cement paste (CBR CEM III/A 42.5 N)79.8780.0980.4880.140.31
Cement paste (CBR CEM I 52.5 N)78.2978.2678.7078.420.24
Siliceous sand0.760.860.880.830.06
Calcareous aggregate3.423.033.183.210.20
Table 5. Chemical equations and corresponding stoichiometric ratios used for the modelling of hydration of cement.
Chemical EquationsStoichiometric Ratios
C 3 S + 5.5 H C 1.7 S H 4.2 + 1.3 C H ( E / C 3 S ) = 0.434
C 2 S + 4.5 H C 1.7 S H 4.2 + 0.3 C H ( E / C 2 S ) = 0.471
C 3 A + 3 C S ¯ H 2 + 26 H C 6 A S ¯ 3 H 32 ( E t t ) ( ( E + C S ¯ H 2 ) / C 3 A ) E t t = 3.644
C 3 A + C S ¯ H 2 + 10 H C 4 A S ¯ H 12 ( A F m ) ( ( E + C S ¯ H 2 ) / C 3 A ) A F m = 1.304
C 4 A F + 3 C S ¯ H 2 + 30 H C H + F H 3 + C 6 A S ¯ 3 H 32 ( E t t ) ( ( E + C S ¯ H 2 ) / C 4 A F ) E t t = 2.173
C 4 A F + C S ¯ H 2 + 14 H C H + F H 3 + C 4 A S ¯ H 12 ( A F m ) ( ( E + C S ¯ H 2 ) / C 4 A F ) A F m = 0.872
C S ¯ + 2 H C S ¯ H 2 ( E / C S ¯ ) = 0.265
Table 6. Values needed to calculate the SFSA for the three cements.
xyCsol(E/C)sol(E/C)moy
White cement (CEM I 52.5 N)0.97750.97970.96140.43700.4527
Grey cement (CEM II/A-L 52.5 N)0.80920.74620.64820.39400.5408
CBR CEM I 52.5 N0.97490.81090.83220.46450.5968
Table 7. SFSA for different granular classes of the laboratory-produced RCA (unit: %, the numbers 28 and 90 refer to the aging of the original concrete samples in days).
Fractions (mm)RCAl_OC1_28RCAl_OC1_90RCAl_OC2_28RCAl_OC2_90RCAl_OC3_28RCAl_OC3_90
0/0.6326.5427.2832.6639.0137.3138.36
0.63/1.2524.9825.7229.5132.6335.6835.86
1.25/2.523.2523.6027.0627.7931.5333.22
2.5/519.3520.7623.1625.3528.2929.34
0/522.5823.3526.5529.2731.5932.63
Calculated value on concrete16.5317.4821.3622.5025.9027.20
Calculated value on mortar32.9034.3840.1041.7046.1647.80
Table 8. Coefficients of the linear relationships between density and SFSA (y = ax + b).
abR2Density of NA (x = 0)Density of Hardened Cement Paste (x = 100%)
RCAi1−0.0102.640.952.641.64
RCAi2−0.0082.600.822.601.84
RCAi3−0.0142.610.962.611.17
RCAl_OC1_90−0.0112.630.782.631.55
RCAl_OC1_90 wc−0.0122.770.982.771.57
Table 9. Water absorption of all fractions (in mm) of studied RCA determined by standard EN (WAEN) and IFSTTAR (WAIF) methods (%).
WAENWAIF
0/0.630.63/1.251.25/2.52.5/50/0.630.63/1.251.25/2.52.5/5
RCAl_OC1_287.6110.468.227.7621.9011.159.367.83
RCAl_OC2_288.0512.7810.909.3323.1813.5911.529.45
RCAl_OC3_289.7410.078.107.6821.4410.898.847.71
RCAl_OC1_909.429.377.797.1217.6610.368.768.39
RCAl_OC2_909.7711.028.677.9922.8411.949.508.66
RCAl_OC3_906.528.757.316.6716.7910.088.767.58
RCAl_OC1_90 wc6.306.275.575.2513.107.146.055.64
RCAi16.148.017.036.4316.768.597.236.61
RCAi28.629.177.656.7021.3310.107.927.05
RCAi36.328.096.996.6615.858.917.246.92
Table 10. Extrapolated water absorption of Fraction 0/0.63mm from standard EN and IFSTTAR for industrial RCA and laboratory-manufactured RCA.
Tested
Value of IFSTTAR (%)
Tested Value of EN 1097-6 (%)Extrapolated Value of IFSTTAR (%)Extrapolated Value of EN 1097-6 (%)Difference between Two Extrapolated Values (%)
RCAi116.766.149.168.480.68
RCAi221.338.6211.4410.231.21
RCAi315.856.3211.449.941.05
RCAl_OC1_9017.669.4210.679.820.85
RCAl_OC1_90 wc13.1-7.266.350.91
Publisher’s Note: MDPI stays neutral with regard to jurisdictional claims in published maps and institutional affiliations.

