1. Introduction
Progress in high-temperature processes such as membrane, catalytic, SOFC, etc., depends on the development of new active and stable functional materials with high conductivity, bulk oxygen mobility, and catalytic activity. It is very difficult to find a monophasic material satisfying all these demands. One of the ways to solve the problem is the preparation of composite materials consisting of two phases with different properties. Among them, perovskite–fluorite composites are very promising for high-temperature applications due to the possibility to form coherent interphase boundaries and combine properties of constituent components (high bulk oxygen mobility of fluorites with a high rate of oxygen heteroexchange as well as electron conductivity and catalytic activity of perovskites) [
1,
2,
3,
4,
5]. In addition, synergistic effects were observed in such two-phase systems. Thus, the application of CeO
2-based supports in the synthesis of supported perovskite catalysts enhances the activity in oxidation reactions, which is attributed to the non-additive effect upon the interaction of these phases [
6,
7,
8]. A similar result was noted when studying the La
0.8Sr
0.2MnO
3/MeO
x (Me = Sr, La, Ba, Ce) composites obtained by mechanochemical treatment of La
0.8Sr
0.2MnO
3 and MeO
x oxides, in which the non-additive effect was observed only in the case of Me = Ce and became more pronounced with increasing calcination temperature of the composite [
9]. The authors related this to the unique properties of the CeO
2–high content of oxygen and its ability (in comparison with other oxides) to readily exchange with the environment, which increases when CeO
2 is modified with other cations.
In a recent review on composites in methane oxidation, the clear evidence of mixed oxide cerium-containing catalysts in achieving highly active catalysts in complete methane combustion was demonstrated as well as that such catalysts may be valid alternatives to the more expensive and sensible noble metal catalysts. Ce
1−xFe
xO
2−x (x = 0.3−0.4) and 20% NiO/CeO
2 composites were shown to be among the most active. Their activity in methane oxidation was comparable with the activity of the industrial catalyst Pd/Al
2O
3 [
10].
The effect of phase ratio in a composite on its properties was studied in some works [
4,
11]. The authors of [
11] investigated (0.1 or 0.8) LaFeO
3/CeO
2 composites, which were obtained by mechanical activation of the calcined oxides, in methane oxidation and nitrous oxide decomposition reactions. The non-additive effect was shown to manifest itself only after thermal treatment of the composites. In the oxidation of methane, the composites, despite a smaller content of LaFeO
3, compared well in activity with LaFeO
3, whereas in the decomposition of nitrous oxide their activity strongly exceeded that of LaFeO
3. The study did not reveal an essential difference in activity (reaction rate) of the composites with different (0.1 or 0.8) CeO
2 content in the tested reactions. At the same time, a wider variation of the phases ratio in the La
0.65Sr
0.35MnO
3/CeO
2 composites demonstrated that the maximum oxygen exchange rate (which is important for the red-ox processes where reoxidation of the active site serves as the limiting step) was achieved exactly at the 1:1 ratio [
4].
One of the promising composites for application in different high-temperature red-ox processes—catalytic, membrane, SOFC, and others—is the LaFe
0.4Ni
0.6O
3/CeO
2 composite due to the high catalytic activity, mixed conductivity, and high-temperature stability of LaFe
0.4Ni
0.6O
3 [
12,
13,
14,
15]. For example, LaFe
1-xNi
xO
3 (x = 0.2–0.8) catalysts showed high activity and resistance to coking in carbon dioxide and steam reforming of methane, in distinction to LaFeO
3 and LaNiO
3 [
12,
13]. In [
14,
15], high conductivity of LaFe
0.4Ni
0.6O
3 was observed, which made this material very promising for use in medium-temperature solid oxide fuel cells (SOFC). Investigation on the compatibility of LaFe
0.4Ni
0.6O
3 with CeO
2 or ZrO
2, which was performed in [
16,
17], revealed a higher stability of LaFe
0.4Ni
0.6O
3/CeO
2 composites. The acquired data on the conductivity of the composites in dependence on the perovskite content suggest that by increasing the perovskite content above 50% the main contribution to conductivity is made by the electronic conductivity, whereas at a perovskite content below 50%, the main contribution is made by the ionic one. At the 1:1 ratio of components, the composite simultaneously possesses high electronic and ionic conductivity, which is essential for its application as the SOFC anodes and cathodes. A similar dependence of conductivity on the perovskite content was obtained in [
18] for the composites prepared using mischmetals (nonseparated mixtures of lanthanides with different contents of lanthanum).
The data available in the literature allow assuming that the LaFe0.4Ni0.6O3/CeO2 composite with the phase ratio 1:1 will be highly active and stable in high-temperature methane and CO oxidation reactions, which is interesting for its application both as the deep oxidation catalyst and the material for direct SOFC.
The LaFe
0.4Ni
0.6O
3/CeO
2 composite can be prepared in different ways in one or two stages before calcination. The perovskite and fluorite oxides previously prepared via different routes (the first stage) are usually combined in the second stage, and after that, the obtained mixture of oxides is calcined to form a composite material (the preparation in two stages) [
4,
11,
19]. A one-stage (or one-pot) preparation route means that all raw materials are combined at the first stage with the formation of a precursor, which forms a composite material after calcination. New possibilities for composite preparation have emerged due to the development of the mechanochemical (MC) method, which may be applied at different stages: for preparation of perovskites (the first stage) [
20,
21,
22], for combination of perovskite and fluorite phases (the second stage) [
11,
23], and for one-pot preparation of composite materials [
24]. The MC method makes it possible to also prepare materials without wet stages and waste water [
20,
21,
22].
The properties of composite materials are determined not only by the properties of constituent components and their quantitative ratio, but also by the preparation method that influences the particle size of constituent phases, homogeneity of the particles (phases) distribution and their mutual modification, as well as the length of interphase boundaries that affect the properties of the composites [
10,
24,
25,
26].
It is reputed that the best methods for low-temperature LaFe
0.4Ni
0.6O
3 preparation are Pechini, sol–gel, and co-precipitation methods [
12,
16,
27,
28]. The ceramic method, being the simplest one, requires a long high-temperature (>1200 °C, >100 h) calcination [
14]. The mechanical treatment of raw materials in high-power planetary ball mills, due to their disintegration, homogenization, and activation, also provides the possibility of low-temperature preparation of a LaFe
0.4Ni
0.6O
3 perovskite and LaFe
0.4Ni
0.6O
3/CeO
2 composite.
The main goal of this paper is the preparation of LaFe0.4Ni0.6O3 perovskite and LaFe0.4Ni0.6O3/CeO2 (1:1) composites using mechanical and Pechini routes and investigation of their physical and chemical properties including catalytic activity in CO and CH4 oxidation processes.
3. Results and Discussion
3.1. Phase Composition
According to the XRD data, doped LaFeO3, LaNiO3, La2NiO4, and simple oxides (La2O3, Fe2O3, NiO) were detected in the mixture of the MC-treated initial raw oxides. The subsequent calcinations at 900 °C for 6–100 h led to an increase in the amounts of both (based on LaFeO3 and on LaNiO3) doped perovskite phases, but the monophase LaFe0.4Ni0.6O3 perovskite was not detected even after calcination during 100 h, probably due to very mild MC treatment conditions. Therefore, for our subsequent experiments on composites preparation, the monophase LaFe0.4Ni0.6O3 (perovskite) and CeO2 (fluorite) oxides and their precursors prepared via the Pechini method were used, while MC treatment was applied only for their combination. For comparison, the composite prepared via the one-pot Pechini route (sample 3) was also studied.
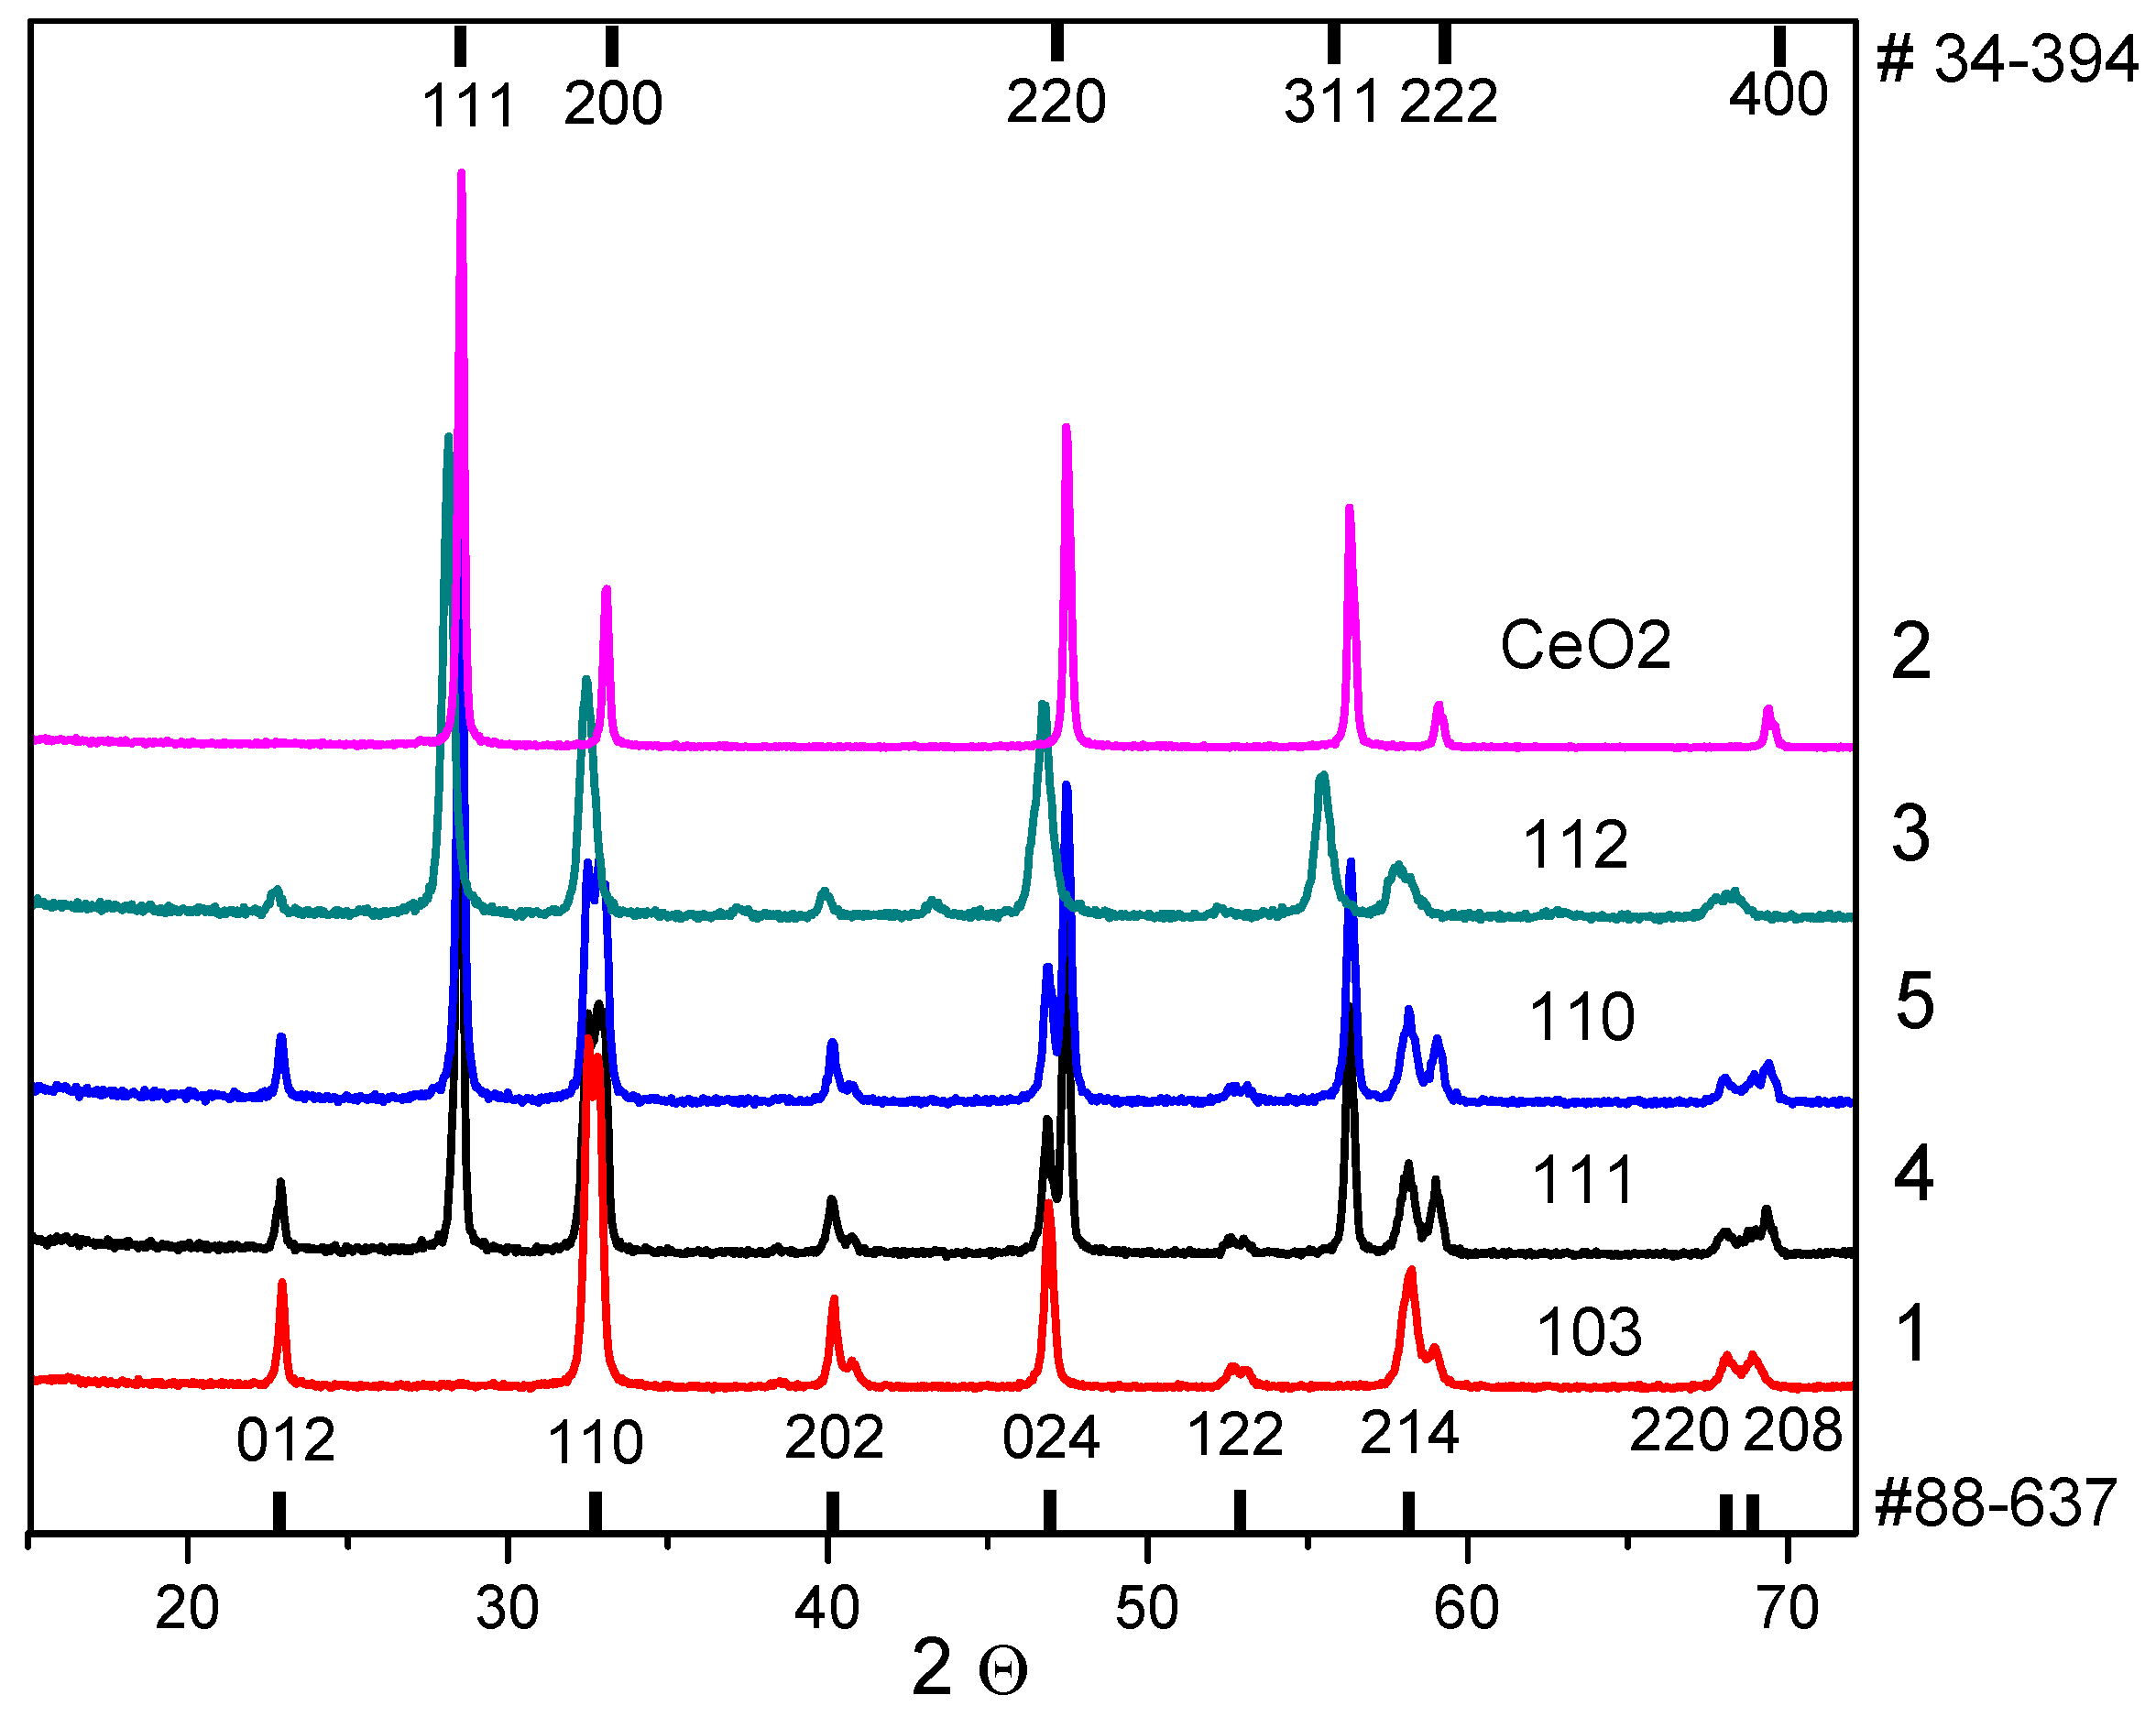
The XRD data for the as-prepared samples (
Figure 1) indicate the presence of only the perovskite phase (sample 1) according to PDF card #88-637, only the fluorite phase (sample 2) according to PDF card #34-394, and both (perovskite and fluorite) phases in the composites (samples 3–5). It is worth noting that cerium oxide is observed in trace amounts in sample 3, so the cell parameters for this phase were not calculated. The perovskite phase in samples 1, 4, and 5 was determined in the rhombohedral modification (PDF card #88-637) with a small difference in cell parameters, while in sample 3 it was determined in the orthorhombic modification (PDF card #88-638) with a noticeable difference in cell parameters (
Table 2), which may be due to the weak (samples 4 and 5) or strong (sample 3) modification of the perovskite structure with Ce cations in the as-prepared composites. A similar modification of the perovskite phase was observed in the work of Ren et al. [
32] for chemical compositions La
0.6Ce
0.4FeO
3 and La
0.8Ce
0.2FeO
3. This effect can be explained by a significant difference in the cationic radii of lanthanum and cerium. The partial entry of cerium cations into the perovskite structure was also confirmed by the absence of visible reflexes on diffractograms in sample 3 as previously mentioned above.
The X-ray crystallite sizes for both phases (perovskite and fluorite) detected in the composites depend on the samples preparation conditions. For both phases, the sizes are nearly 50 nm in the monophase samples (1 and 2), nearly 40 nm in the samples prepared via the MC combination of oxides or their precursors (samples 4 and 5, respectively), and nearly 25 nm in the one-pot prepared composite (sample 3). The observed differences in the perovskite and fluorite cell parameters as well as in the X-ray crystallite sizes detected for the one-pot prepared composite (sample 3) compared with the other two composites (samples 4 and 5) or monophase samples (samples 1 and 2) revealed a strong bulk chemical modification of both the perovskite and fluorite phases in the one-pot prepared composite (sample 3). The surface mutual modification of the perovskite and fluorite phases can be proposed for composites 4 and 5 mainly because of the smaller changes in the oxides’ cell parameters according to XRD (
Table 2). The data on the samples’ specific surface area values are listed in
Table 2.
3.2. Microstructure, Bulk, and Surface Particles Composition
TEM and EDX mapping (
Figure 2) data revealed the generally separated perovskite (one type) and fluorite (another type) aggregated particles (both about 1 μm in size) in composites 4 and 5 and only the mixed (perovskite + fluorite) aggregated particles with nearly the same size (~ 1 μm) in composite 3. All the aggregates were composed of 20–50 nm crystallites, which is consistent with the crystallite size range estimated by XRD (
Table 2).
According to the EDX data obtained from different local areas in different aggregated particles, the aggregates in sample 1 are fairly uniform in composition. The enrichment of the particle surface with La may be proposed for this sample due to its higher content. Two types of local areas that strongly differ in composition (enriched with perovskite or fluorite cations) were distinguished in samples 4 and 5 in different aggregates consisting mainly of perovskite or fluorite phases, respectively. One type of aggregate particles and areas composition was revealed in sample 3, which is fairly uniform in composition in different aggregates. Due to a higher Ce content in the analyzed areas, the enrichment of the particles’ surface with Ce may be proposed for sample 3 since the signal from cerium on the surface of agglomerates is quite clearly visible on the EDX mapping (
Figure 2a).
Hence, according to the TEM + EDX data, two types of aggregates in samples 4 and 5, which differ in chemical composition, and only one type in sample 3 were revealed for the prepared two-phase composites (samples 3–5). It is clear that the homogeneity of the LaFe0.4Ni0.6O3 and CeO2 phases’ mutual distribution and their mutual modification are much higher in sample 3 compared with samples 4 and 5.
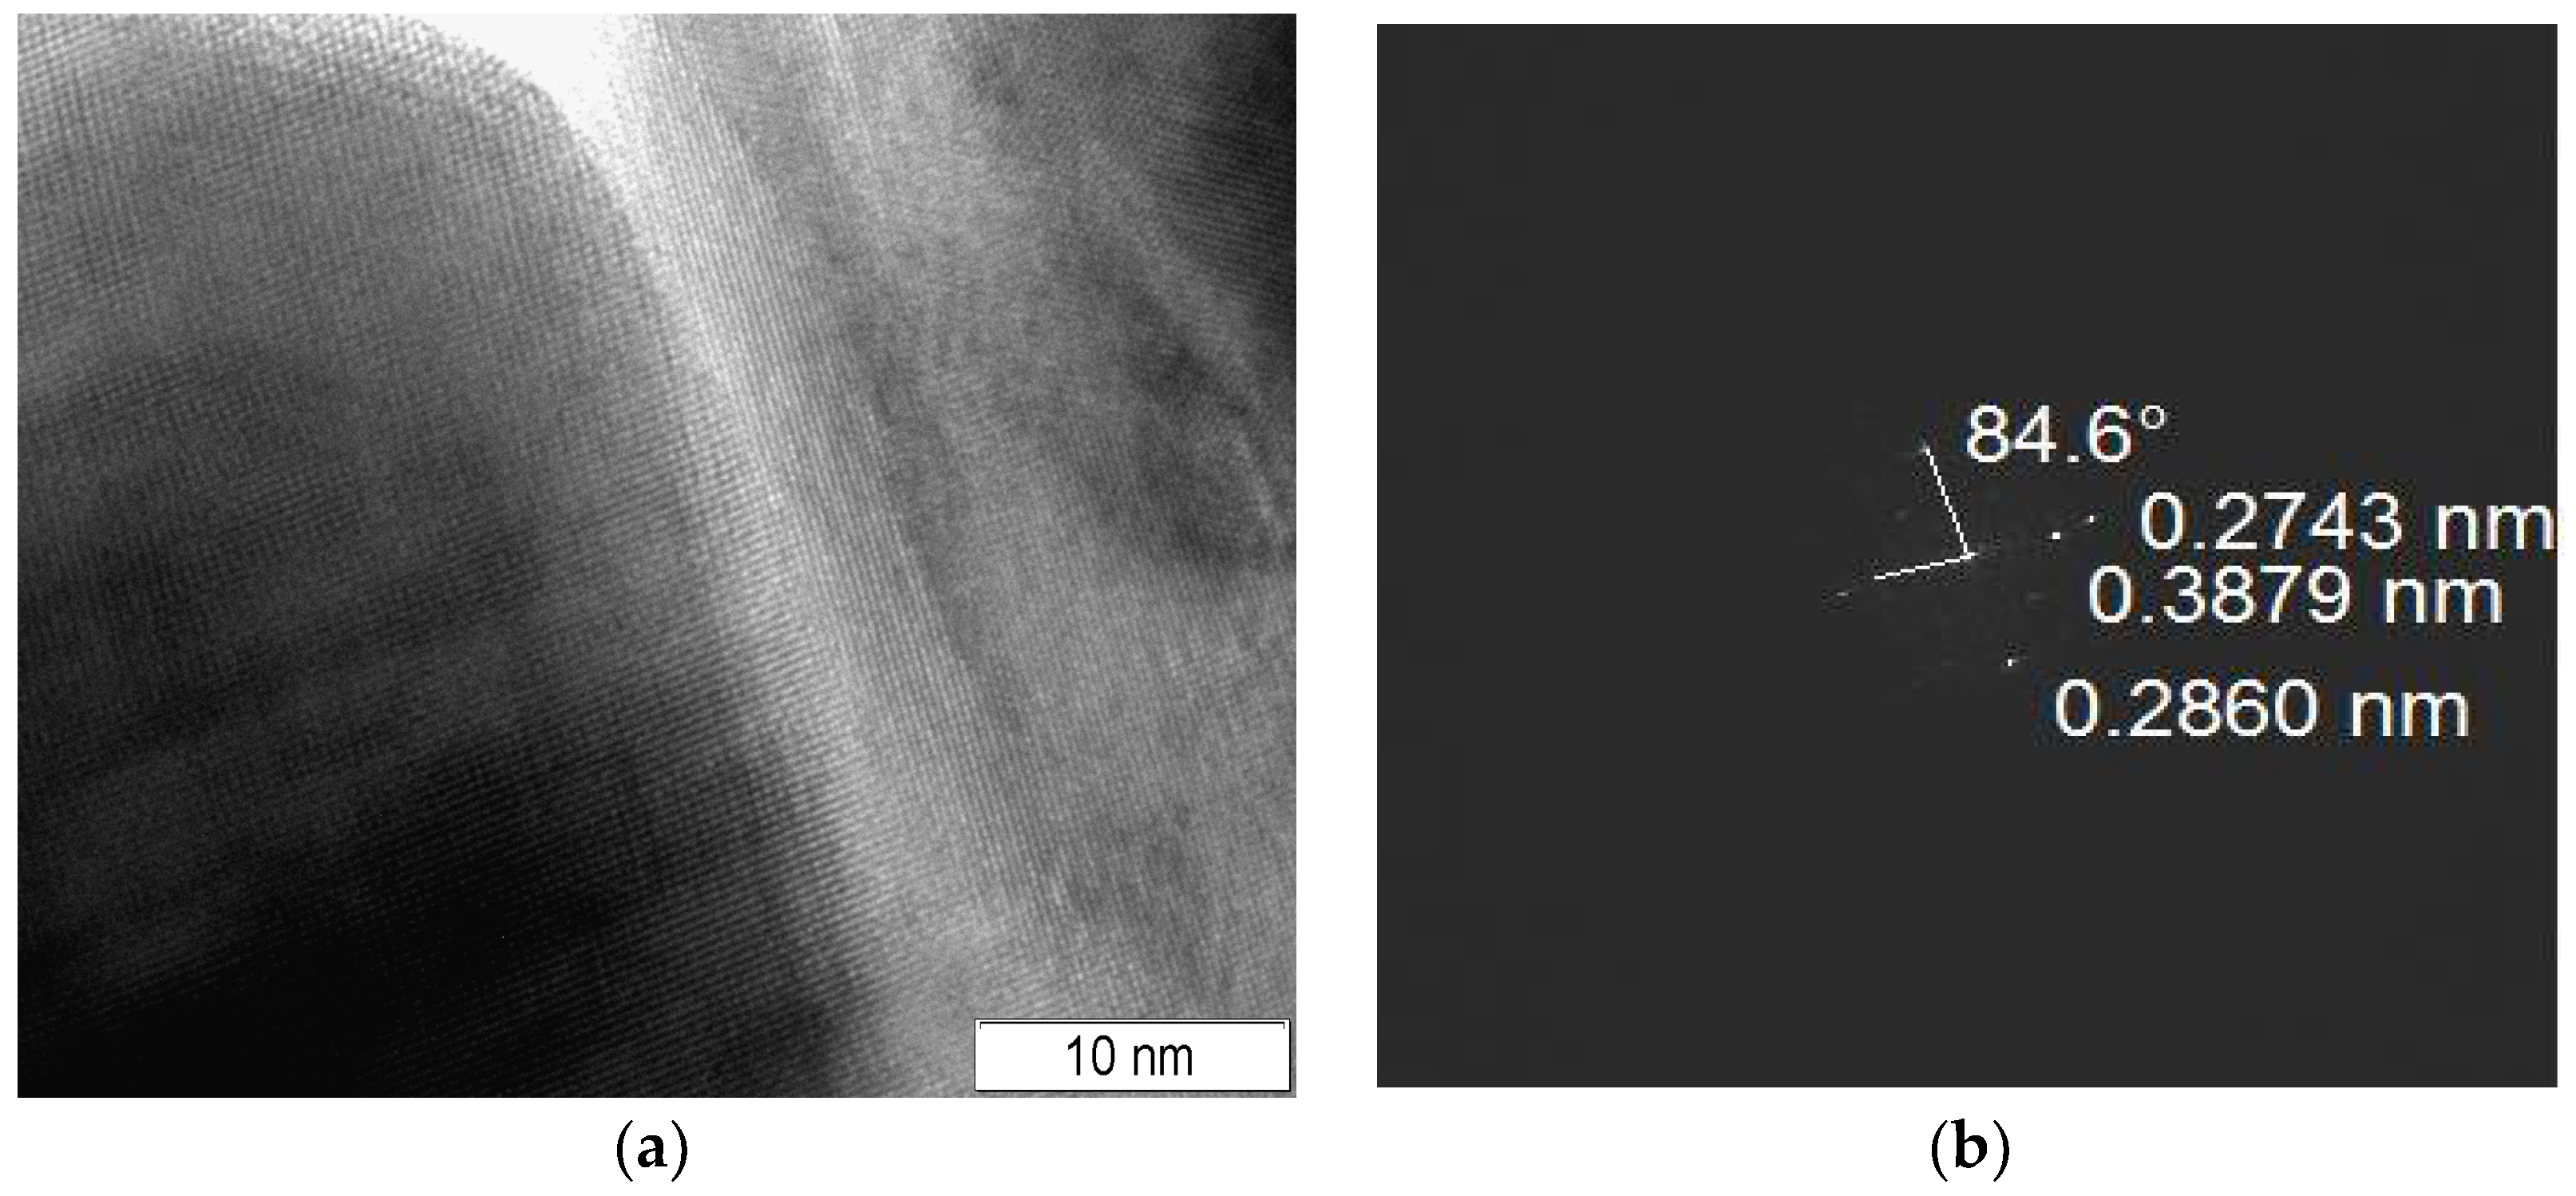
Due to the difference between X-ray crystallite size and aggregate size, the formation of interblock and interphase boundaries is very possible in the as-prepared samples. One may propose a higher density of interphase boundaries in sample 3 due to the formation of the mixed aggregates and smaller X-ray perovskite and fluorite crystallite sizes. However, the formation of interphase boundaries was detected in other composites (samples 4 and 5), too. In
Figure 3, there is an area between the perovskite and fluorite crystallites in which the Fourier transform image confirms the formation of interphase boundaries in composite 5 because the detected interplanar spacings correspond to perovskite (0.2860, 0.3879 nm) and fluorite (0.2743 nm) structures.
It should be noted that, compared with X-ray diffraction, X-ray photoelectron spectroscopy is a surface-sensitive method and the depth of analysis is approximately 6–10 nm, depending on the kinetic energy of the photoelectrons [
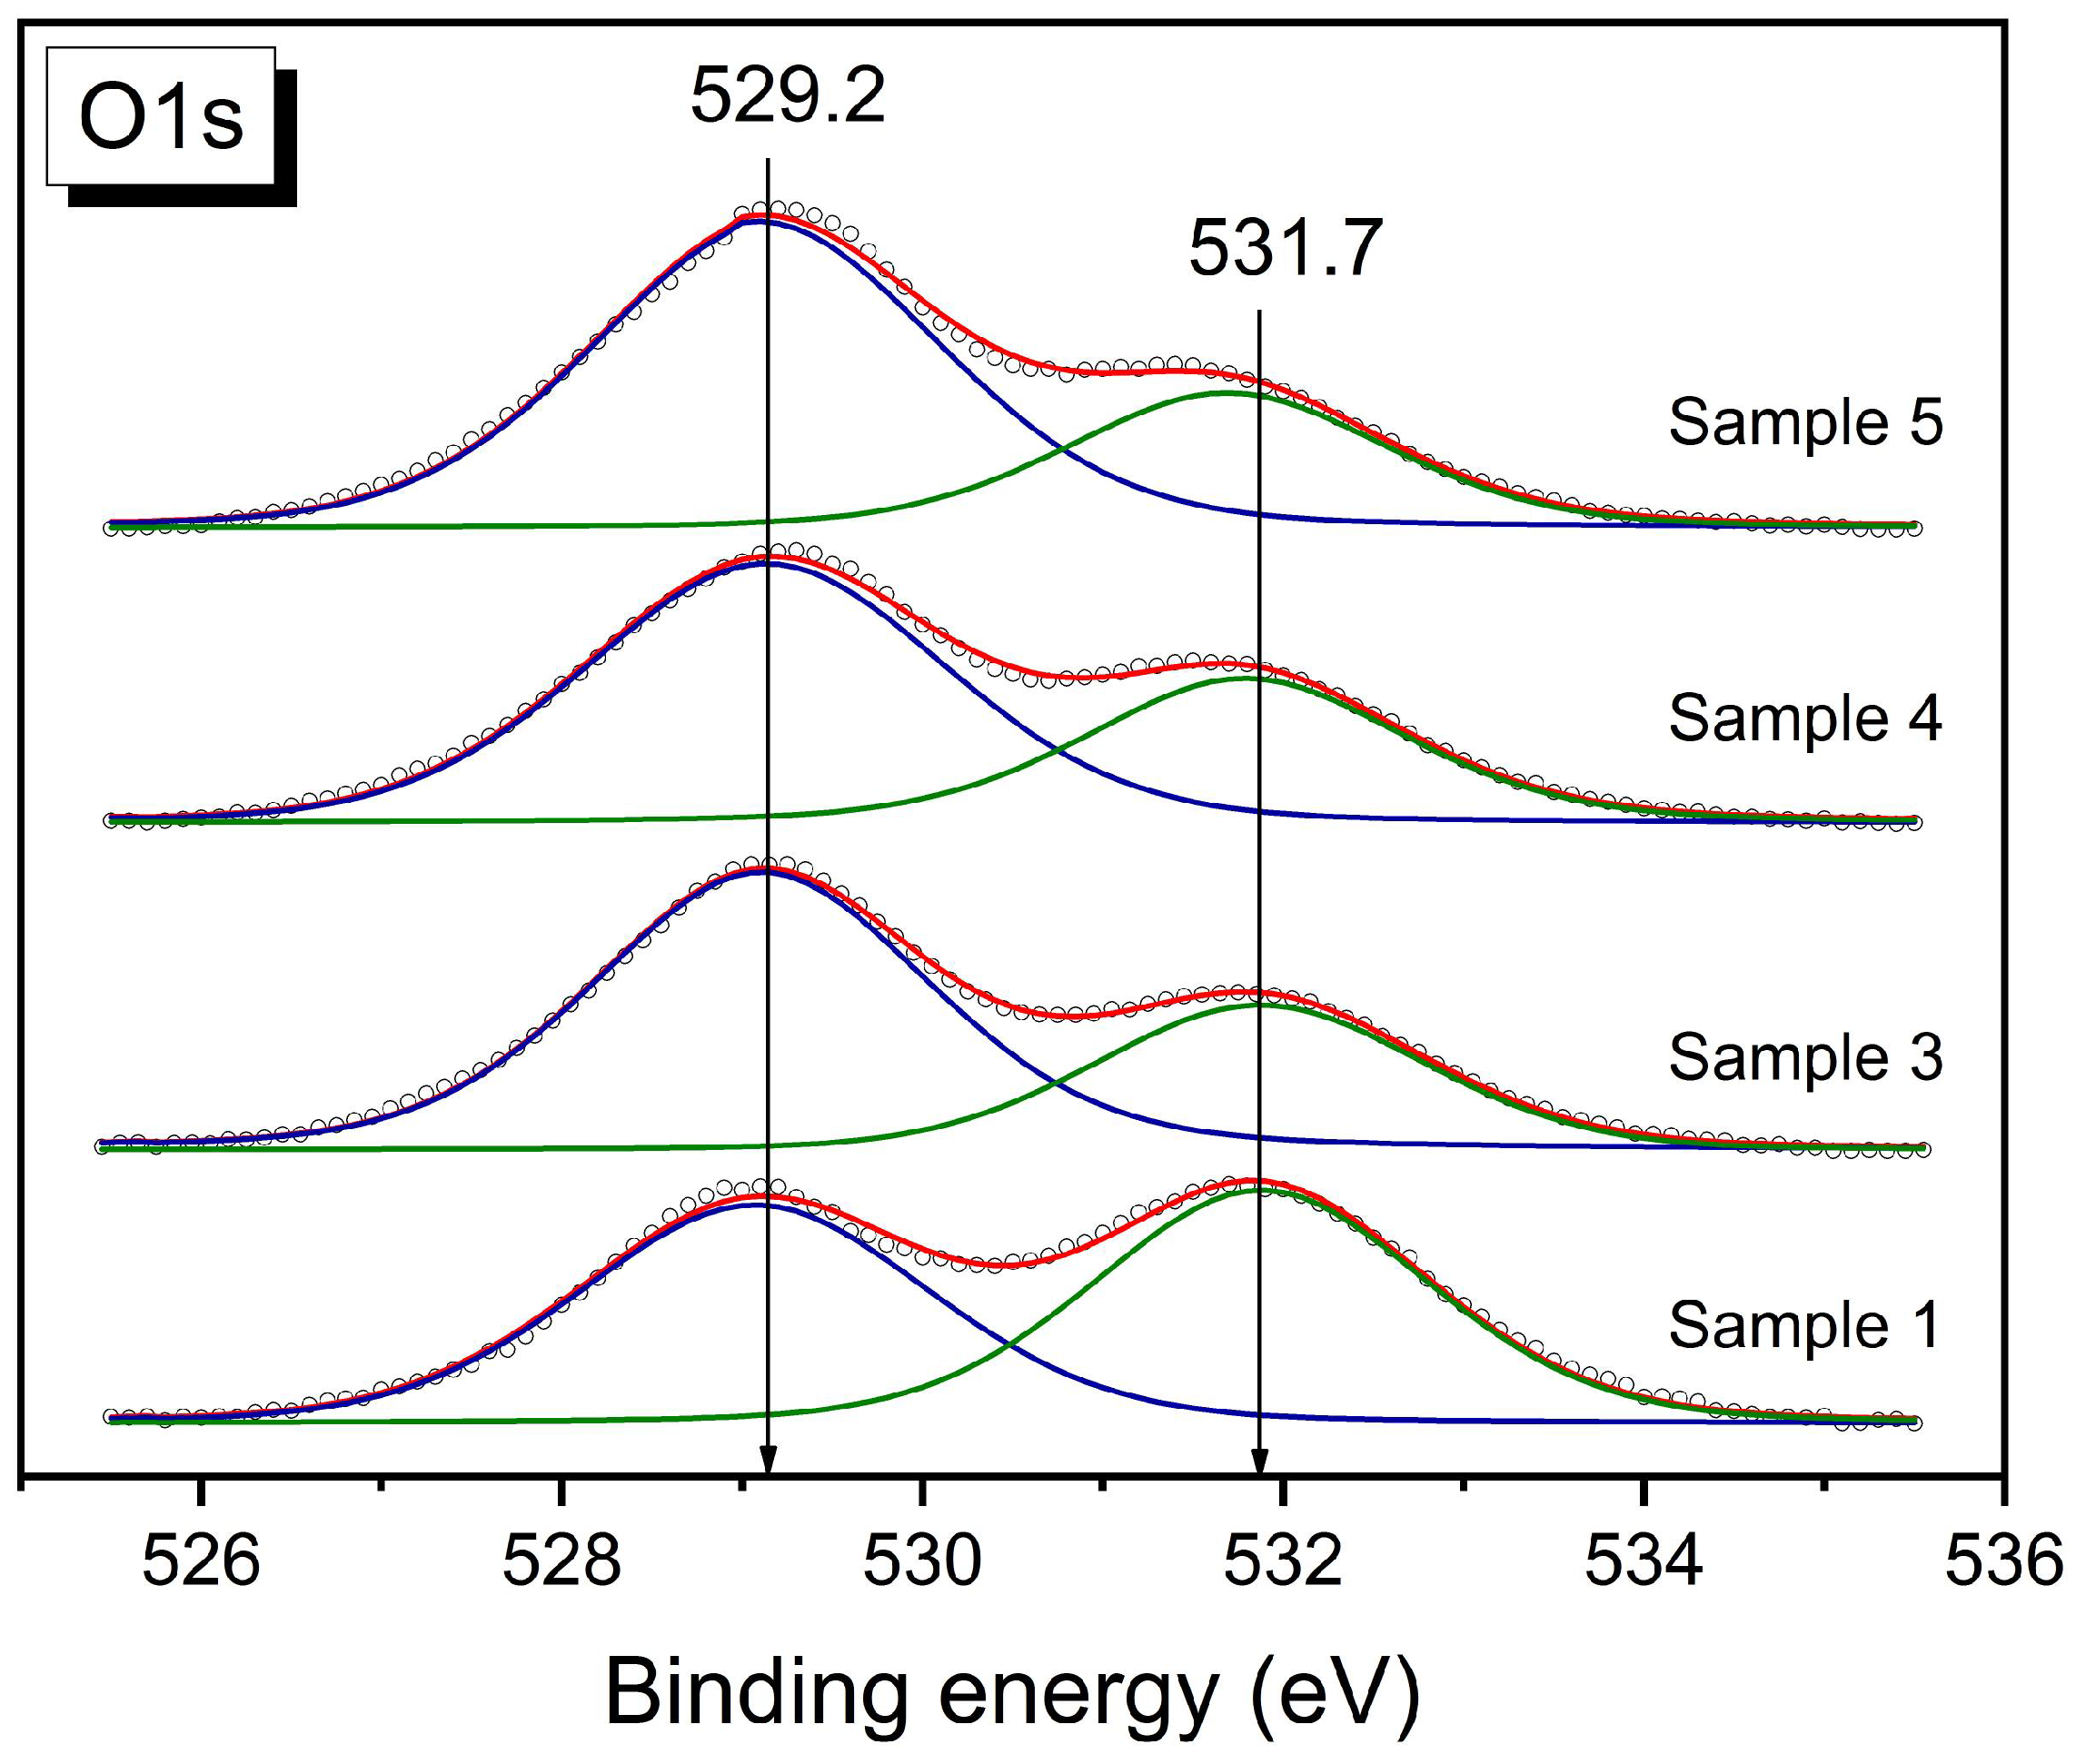
33]. According to the XPS data, the surface of the samples is enriched with oxygen in the perovskite and fluorite structures with BE (O1s) = 529.2 ± 0.1 eV (
Figure 4, blue lines) and, very probably, in the surface carbonates because there is oxygen with BE (O1s) = 531.7 ± 0.2 eV (
Figure 4, green lines) and carbon (BE (C1s) = 288.9 ± 0.2 eV) ions in the carbonates [
30,
34]. Samples 3–5 may contain a lower quantity of surface carbonates because of a higher O
(529)/O
(531) ratio. The surface of all the composites is also enriched with “perovskite” (La, Fe, and Ni) ions compared with the monophase perovskite sample (
Table 3). The samples differ in their La/Ce ratio as well as the (Fe + Ni)/(La + Ce) and (Fe + Ni)/La ratios (
Table 3). The highest content of “perovskite” ions was revealed for sample 4 (La/Ce = 1.36 and (Fe + Ni)/La = 0.61). Although for sample 5 the La/Ce ratio is lower (La/Ce = 0.86), the (Fe + Ni)/La ratio is higher (0.64) than that for sample 4 (0.61). The lowest (Fe + Ni)/La ratio (0.48) at La/Ce = 1.06 was revealed for the composite prepared via the one-pot Pechini method (sample 3). Hence, according to the XPS data, surface enrichment with “perovskite” ions (La + Fe + Ni) in the composites was revealed. Taking into account the highest surface content of the “perovskite” ions in composites 4 and 5 compared with composite 3 and with its possible content (at Perovskite: Fluorite = 1: 1 ratio and near the same particles and X-ray sizes), a significant modification of the surface of the fluorite particles in samples 4 and 5 with La, Fe, and Ni ions in the perovskite and/or simple oxide forms may be proposed for the samples; this is consistent with the data obtained and discussed in detail in [
11], while the bulk modification with “perovskite” ions may mainly be proposed for sample 3, which agrees with the X-ray data.
Therefore, according to the XPS data, a higher surface content of “perovskite” ions was revealed for all the composites (samples 3–5) compared with pure perovskite (sample 1). The composites may also be depleted with carbonates. The main difference between the prepared composites is a higher surface content of 3d ions in the MC samples (samples 4 and 5) compared with the Pechini sample (sample 3).
3.3. H2-TPR Data
According to H
2-TPR (
Figure 5a), there are two main peaks of hydrogen consumption for LaFe
0.4Ni
0.6O
3 perovskite (sample 1) and LaFe
0.4Ni
0.6O
3/CeO
2 composites (samples 3–5), while only one high-temperature peak was revealed for CeO
2 (sample 2). No strong difference in the total (up to 900 °C) hydrogen consumption for composites 4 and 5 was detected (
Table 4). Their total consumption (~3.15·10
−3 mol H
2·g
−1) is lower than that calculated for a mixture of perovskite (sample 1) and fluorite (sample 2) oxides in the 1:1 ratio (3.66·10
−3 mol H
2·g
−1) and points to the bulk modification of both phases in the as-prepared composites that led to oxygen vacancy formation in both oxides. The H
2-TPR data for sample 3 strongly differ from that of other composites. A lower total (up to 900 °C) hydrogen consumption (2.81·10
−3 mol H
2·g
−1) detected for sample 3 compared with samples 4 and 5 may be due to a stronger mutual bulk chemical modification of constituent phases in the one-pot prepared composite, resulting in the higher oxygen vacancy formation in both phases.
For composites 4 and 5, H
2 consumption in the first reduction peaks is also lower (0.61–0.64·10
−3 mol H
2·g
−1) than the value calculated for the mixture of oxides (0.7·10
−3 mol H
2·g
−1), while for composite 3 the consumption in the first peak is much higher (1.38·10
−3 mol H
2·g
−1) compared with the calculated value. Therewith, consumption in the first reduction peaks for samples 4 and 5 is lower compared with sample 1, and the temperature maximum of the main reduction peak for sample 3 is much higher compared with the other composites (~200 °C). The detected changes in the temperature maximum of the first reduction peaks for samples 3, 4, and 5 (
Figure 5a) may also be due to the longevity of mutual modification of the phases for sample 3.
As for the hydrogen consumption at lower temperatures (up to 300 °C), which may be due to the removal of the most weakly bound surface oxygen species (that is important for low-temperature oxidative processes [
35]), it decreases in the series 5 > 4 > 3 (
Figure 5b), which correlates with specific surface areas of the samples (m
2·g
−1, 7.3 > 5.2 > 2). The H
2 consumption calculated for the mixture at temperatures up to 300 °C is lower than that for samples 4 and 5 but higher than for sample 3 (
Figure 5b). The higher low-temperature consumption for composites 4 and 5 compared with the calculated value at near the same values of specific surface areas may be due to the formation of surface oxygen vacancies in the modified perovskite and fluorite phases with the weakly bound oxygen species incorporated into vacancies. The smaller amount of the weakly bound oxygen species in sample 3 may be due to its lower specific surface area.
3.4. Catalytic Activity in CO and CH4 Oxidation
In spite of the lower LaFe
0.4Ni
0.6O
3 content in the composites, their catalytic activity (conversion) in CO oxidation is much higher than the monophase activity of the LaFe
0.4Ni
0.6O
3 and CeO
2 samples (
Figure 6a).
The conversion of CO for composites 5 and 4 was higher than that for the composite prepared via the one-pot Pechini route (sample 3). Actually, there is a correlation between the low-temperature hydrogen consumption (up to 300 °C) and the catalytic activity of the samples in CO oxidation. Hence, the difference in activity may be due to the difference in their specific surface areas but catalytic activities normalized to m
2 (
Figure 6b) were in the same (5 > 4 > 3 > 1 = 2) order. Therefore, the clear non-additive effect in CO oxidation was revealed for all the composites due to the modification of CeO
2 with La and 3d ions and the formation of point defects in the CeO
2 subsurface, which led to an increase in the content of weakly bound surface oxygen species adsorbed on vacancies and the low-temperature activity of the prepared composites. It should be noted that the activity (at 300 °C) of composite 5, which was prepared by the mechanochemical method (W = 2.5·10
18 CO molecules·m
−2 s
−1), exceeds virtually 5-fold the activity (measured at the same conditions) of LaMnO
3, which is one of the most active perovskites in the oxidation reactions (W = 0.45·10
18 CO molecules·m
−2·s
−1 according to [
35]). However, the low-temperature activity in CO oxidation is lower than the activity of the most active composite Cu
0.1[Ce(La)]
0.9O
x, which at 200 °C and a contact time of 0.09 s in a reaction mixture of 2% CO + 16% O
2 demonstrated 100% conversion, very probably due to the much higher specific surface area value [
36].
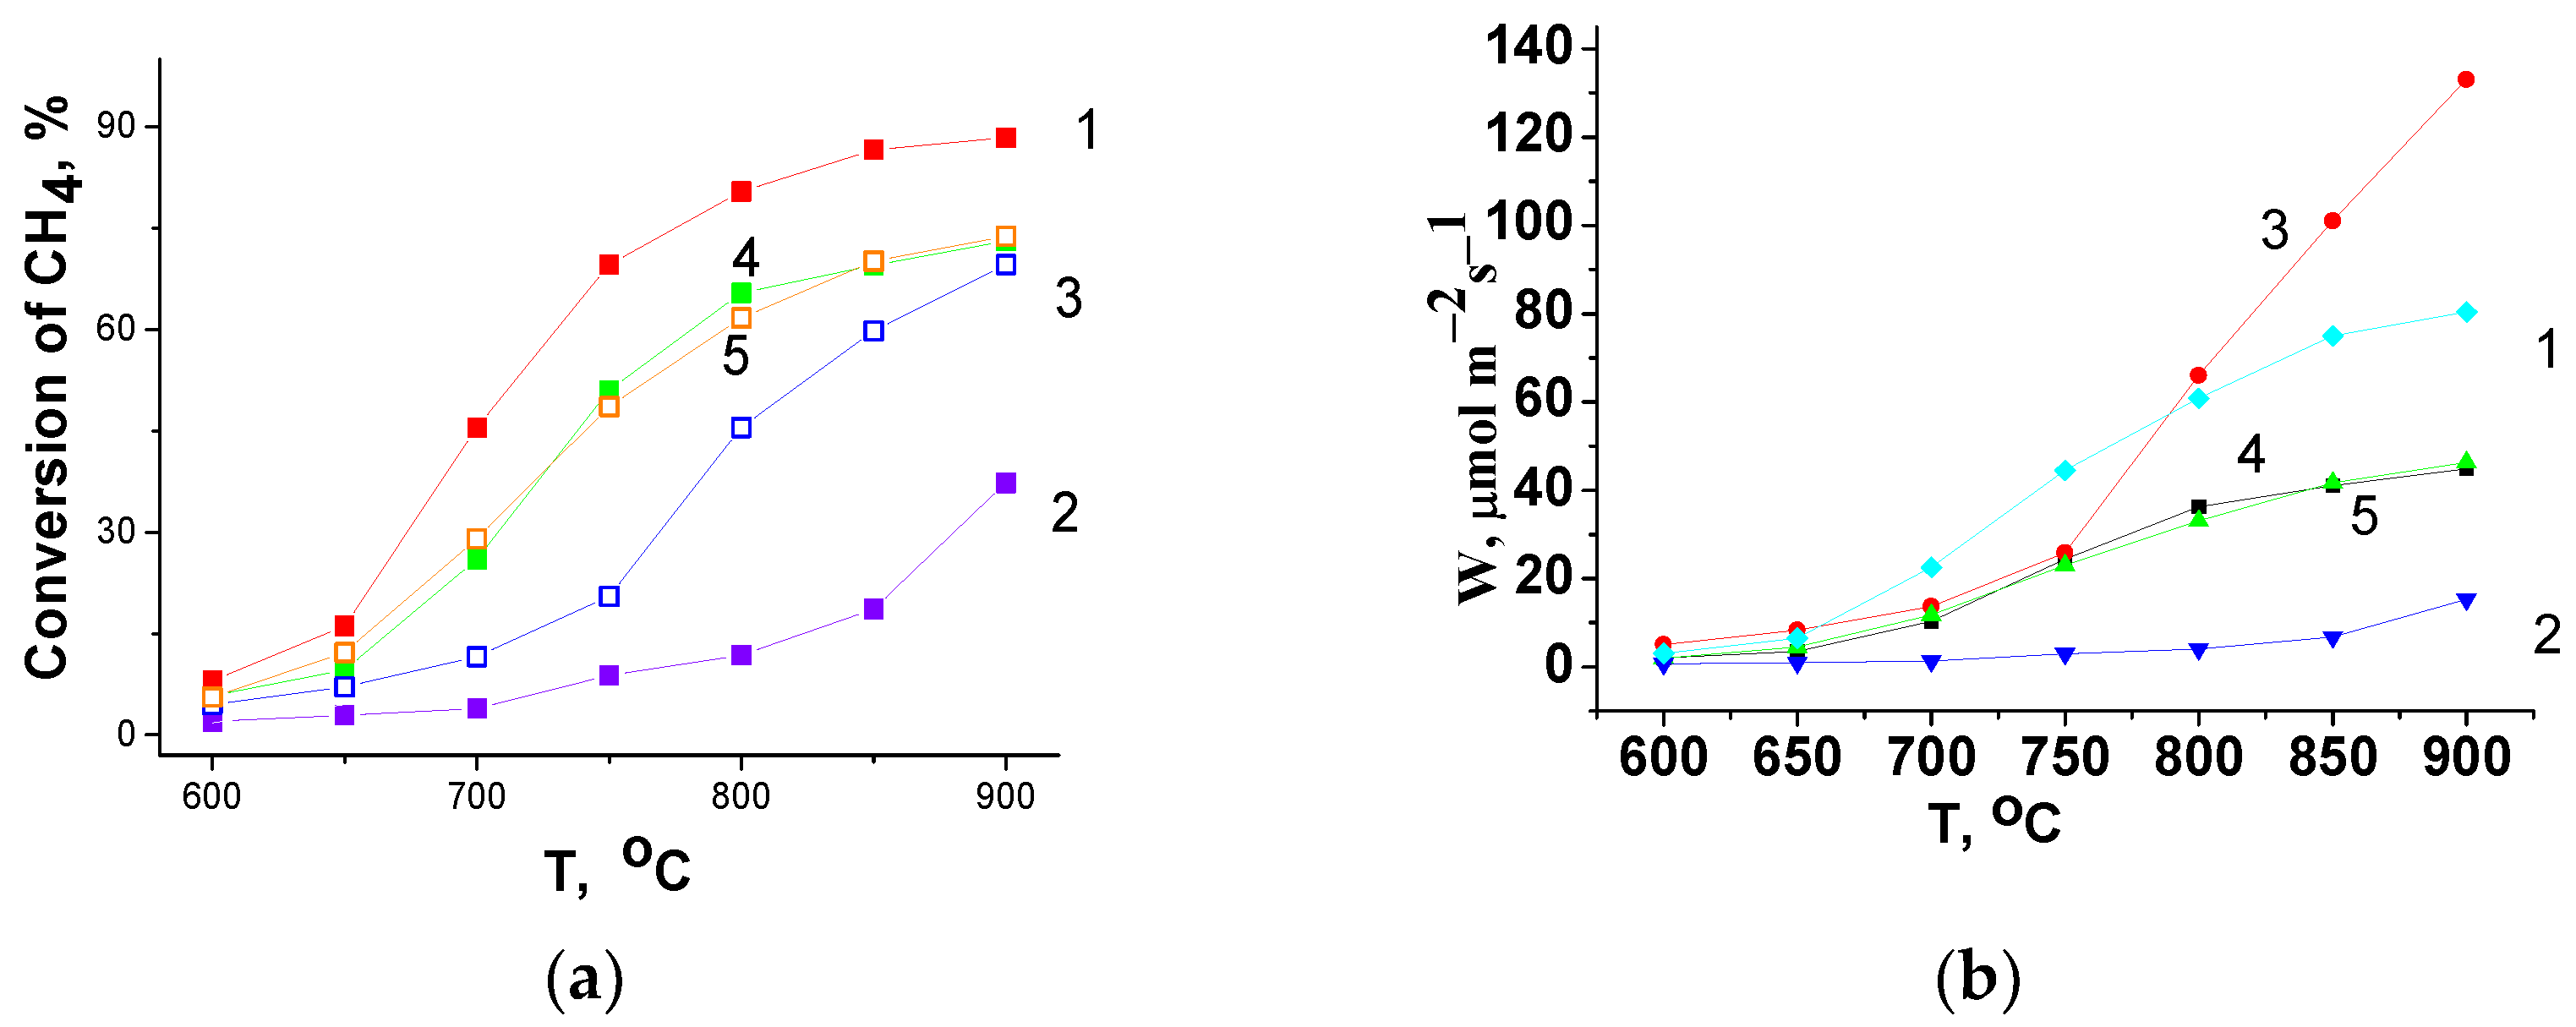
In high-temperature (600–900 °C) methane oxidation, LaFe
0.4Ni
0.6O
3/CeO
2 composites (samples 3–5) demonstrate a lower conversion than LaFe
0.4Ni
0.6O
3 (sample 1), while the CeO
2 (sample 2) shows the lowest value (
Figure 7a). The one-pot prepared composite (sample 3) demonstrates the lowest conversion, but with an increase in the testing temperature the difference in conversions between composites decreases and at 900 °C all the composites show nearly the same conversion. The reaction rate of methane oxidation at 900 °C obtained for the composite strongly exceeds the value for LaMnO
3, which is equal to 8 µmol·m
−2·s
−1, and even the oxidation rate for a more active La
0.5Sr
0.5MnO
3 (100 µmol·m
−2·s
−1) according to [
37]. Due to very different testing conditions in methane oxidation, it is difficult to compare the high-temperature activity of the prepared composites with the low-temperature activity of the most active ones according to [
10,
36].
Actually, there is a correlation between the hydrogen consumption in the first peak (up to 400 °C) and the catalytic activity (
Figure 7a) of the samples in CH
4 oxidation. The catalytic activity of the samples normalized to m
2 (
Figure 7b) also revealed a lower activity of the composites compared with LaFe
0.4Ni
0.6O
3 perovskite at temperatures up to 750 °C. At higher temperatures (T > 750 °C), the normalized activity of the LaFe
0.4Ni
0.6O
3/CeO
2 composite prepared via the Pechini route (sample 3) strongly increases and becomes even higher than the activity of composites 4 and 5 and the LaFe
0.4Ni
0.6O
3 perovskite (sample 1).
The data obtained indicate that the catalytic activity of LaFe0.4Ni0.6O3/CeO2 composites depends on the sample preparation details and testing conditions.
In the low-temperature CO oxidation, the catalytic activity correlates mainly with the amount of weakly bound surface oxygen species that were reduced with hydrogen at low temperatures (up to 300 °C), which depends on the specific surface area values, chemical composition, and microstructure of the samples.
In the high-temperature CH
4 oxidation (600–900 °C), when a bulk oxygen species may be involved in the reaction, the reducibility of the bulk samples and the rate of oxygen heteroexchange may influence the catalytic activity of the oxides [
11,
36]. The data obtained are in accordance with this observation. Therefore, the highest H
2 consumption in the first peak (at 300–400 °C) was detected for pure LaFe
0.4Ni
0.6O
3, while for composites 4 and 5 it was lower (
Table 4); this correlates with activity of the samples in methane oxidation (
Figure 7a). At T > 750 °C, the highest H
2 consumption up to 600 °C was observed for sample 3 with a stronger modification of phases and a higher expected density of vacancies and interphase boundaries, which increase the reducibility of the samples, the oxygen transfer from the bulk to the surface, and the rate of oxygen heteroexchange according to [
11,
36], which affect the samples’ activity. Therefore, for high-temperature applications in oxidative catalytic reactions, the one-pot prepared composite may be attractive. Furthermore, the as-prepared composite material may be very attractive for SOFC application due to its high mixed conductivity according to [
3,
18].
4. Conclusions
The catalytic properties of LaFe0.4Ni0.6O3/CeO2 two-phase composite materials in oxidative reactions strongly depend on the details of their preparation that influence their reducibility and reaction conditions.
In the low-temperature (<600 °C) oxidation process (CO oxidation), the composites are very attractive because they are more active than perovskite or fluorite phases at nearly the same specific surface areas of the samples. There is a correlation between the activity and content of weakly bound surface oxygen species. A higher activity was demonstrated by the composite prepared via the mechanical treatment of the precursors of the perovskite and fluorite phases.
In the middle-temperature (600–750 °C) methane oxidation, perovskite is more attractive due to higher activity that correlates with its higher reducibility up to 400 °C.
In the high-temperature (>750 °C) methane oxidation, the one-pot prepared composite becomes attractive, in spite of its lower specific surface area, probably due to a higher content of vacancy in the bulk and interphase boundaries increasing the reducibility of the sample up to 600 °C.


