
Can Severe Plastic Deformation Tune Nanocrystallization in Fe-Based Metallic Glasses?
 , ,
, ,  ,
,  and
and
Abstract
:1. Introduction
2. Materials and Methods
3. Results
3.1. Alloy A—Fe73.9Cu1Nb3Si15.5B6.6
3.2. Alloy B—Fe81.2Co4Si0.5B9.5P4Cu0.8
4. Discussion
5. Summary and Conclusions
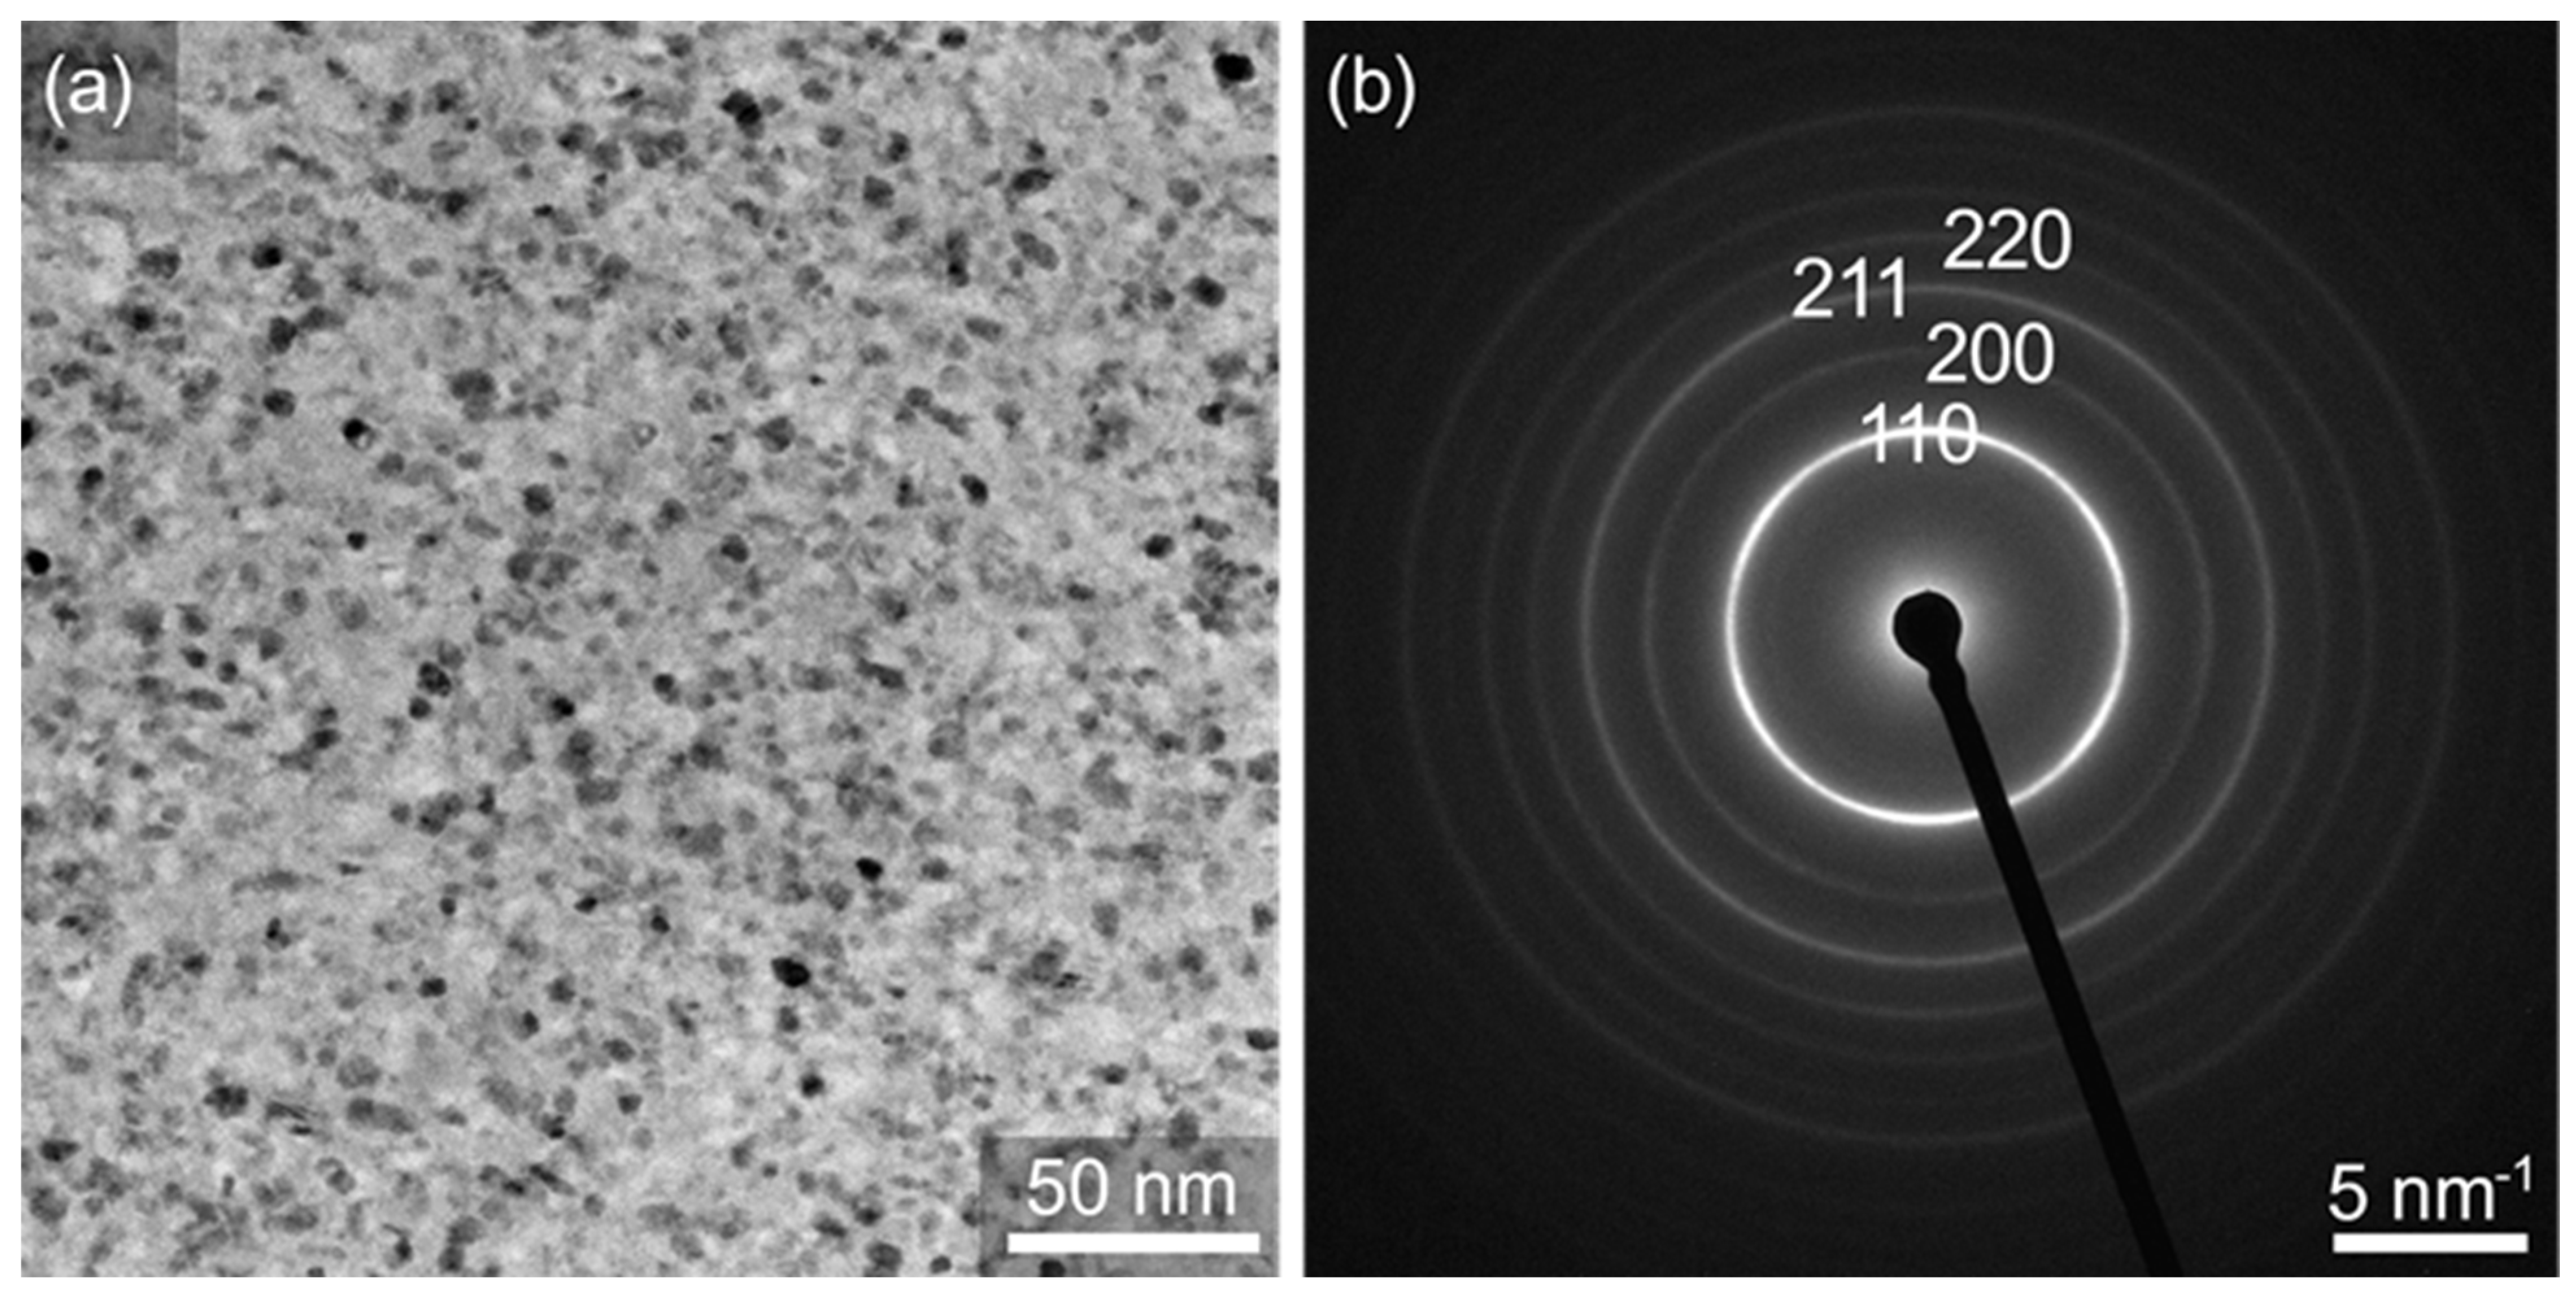
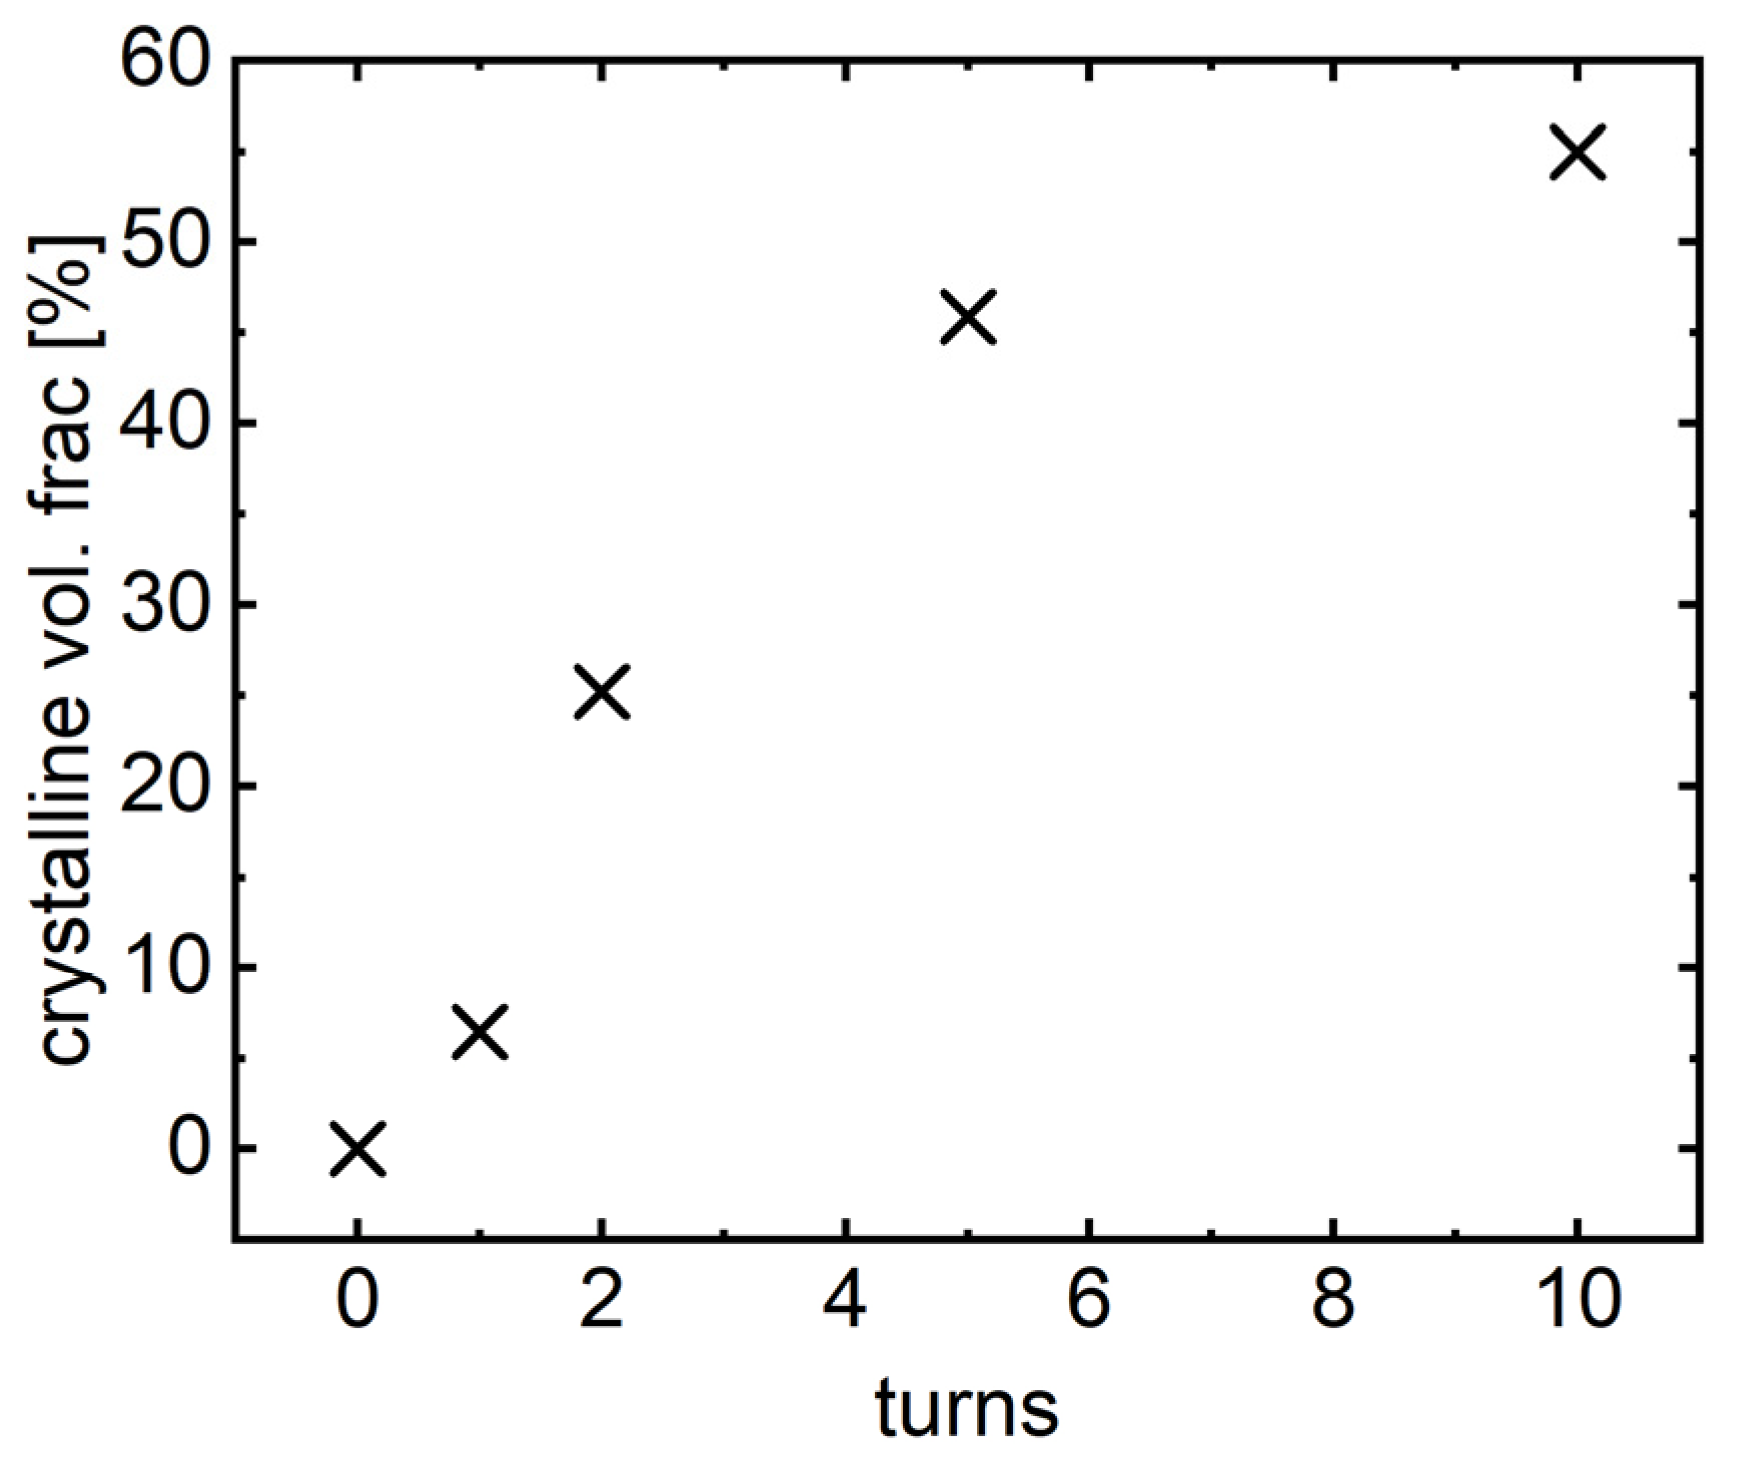
- For alloy B (“Makino” Fe81.2Co4Si0.5B9.5P4Cu0.8) it is even possible to partially crystallize it as α-Fe precipitates at room temperature by means of HPT, with an upper limit of about 50 vol.% crystallinity of crystals with about 6 nm size. This crystal size is significantly lower than that received so far by conventional annealing procedures; moreover, HPT opens better possibilities for precise tuning of crystallinity and crystal size, which seems important for the tuning of the magnetic properties as well.
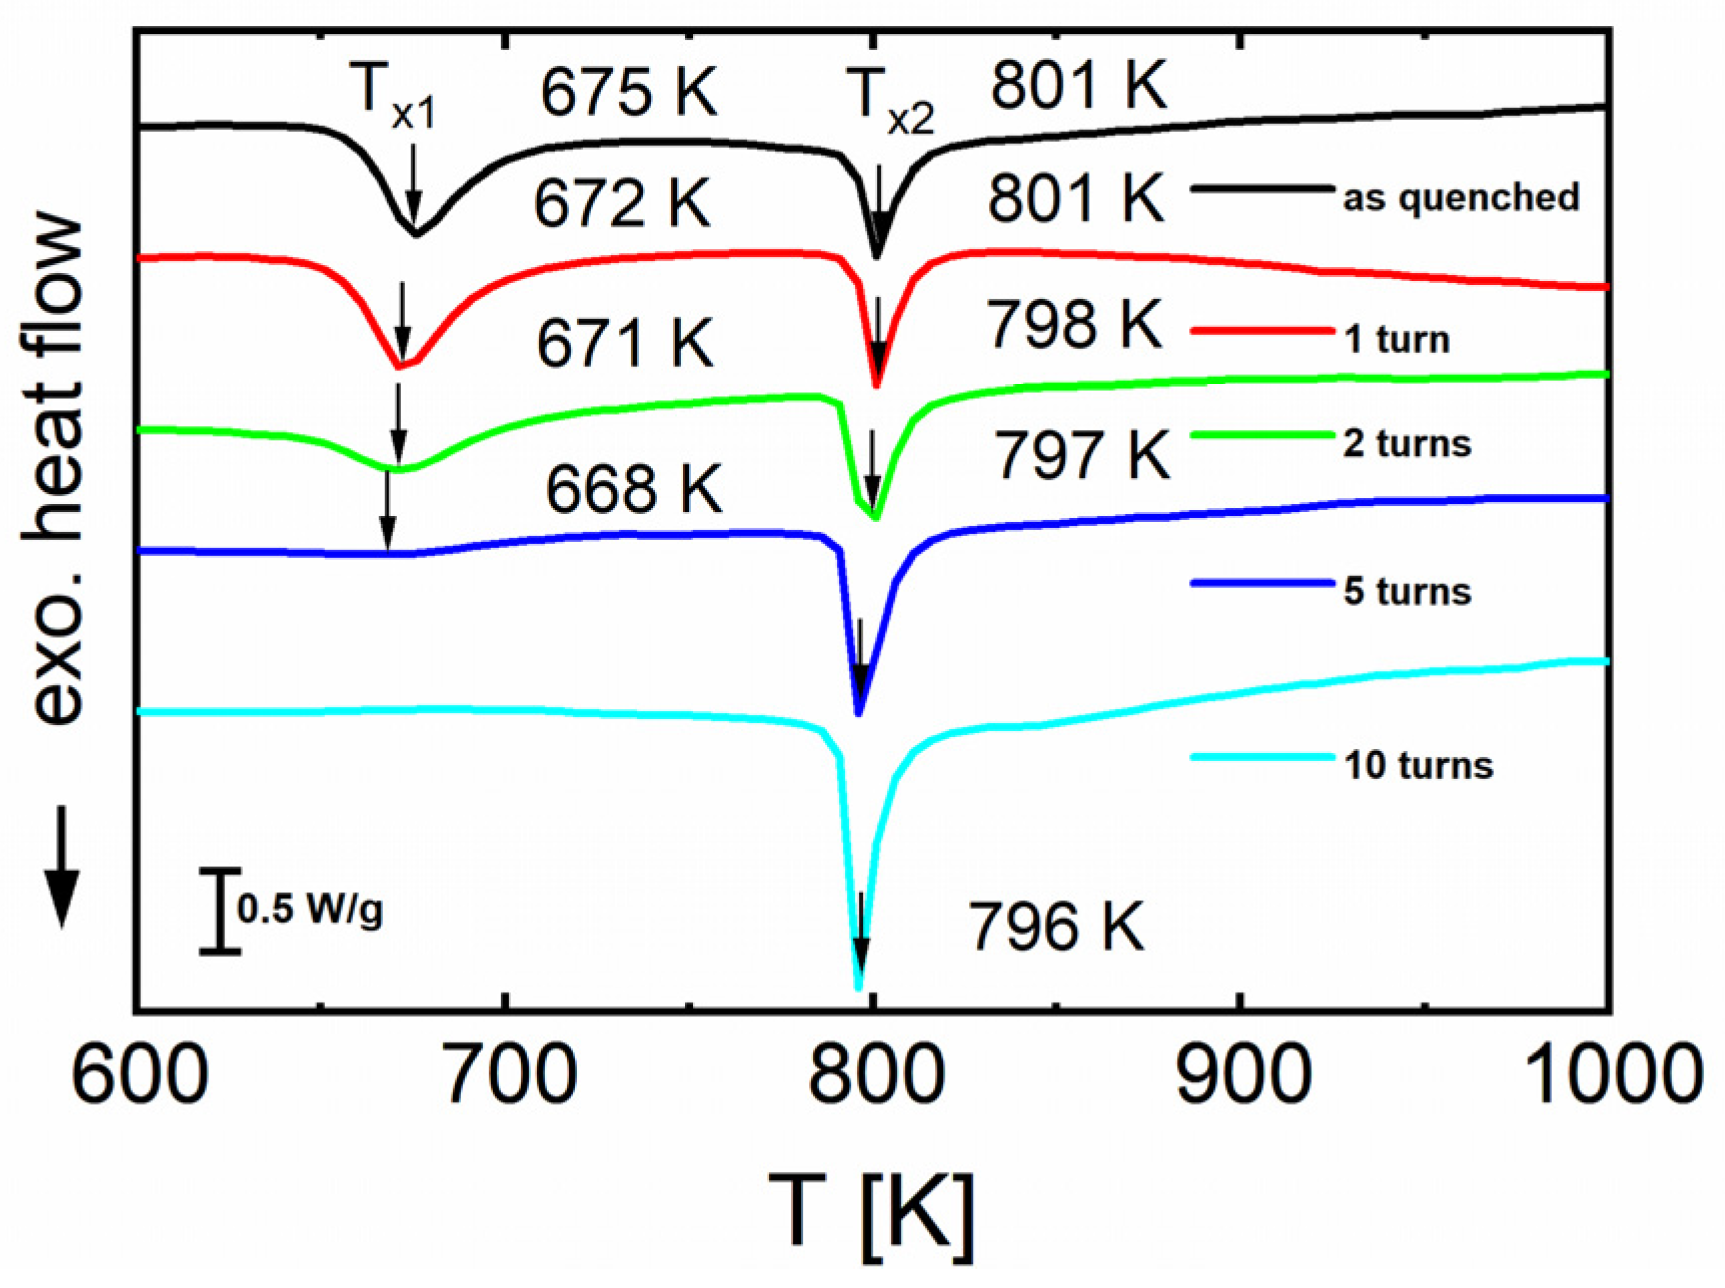
- For alloy A (“Vitroperm” Fe73.9Cu1Nb3Si15.5B6.6), HPT crystallization is not possible even at the highest HPT parameter values chosen, because of the quasi-simultaneous crystallization of two phases and compositional differences between crystalline and amorphous phases in case of alloy A (“Vitroperm”) compared to the case of alloy B (“Makino”) alloy. These large differences result in a kinetic barrier that cannot be overcome by HPT deformation.
Author Contributions
Funding
Institutional Review Board Statement
Informed Consent Statement
Data Availability Statement
Acknowledgments
Conflicts of Interest
Appendix A

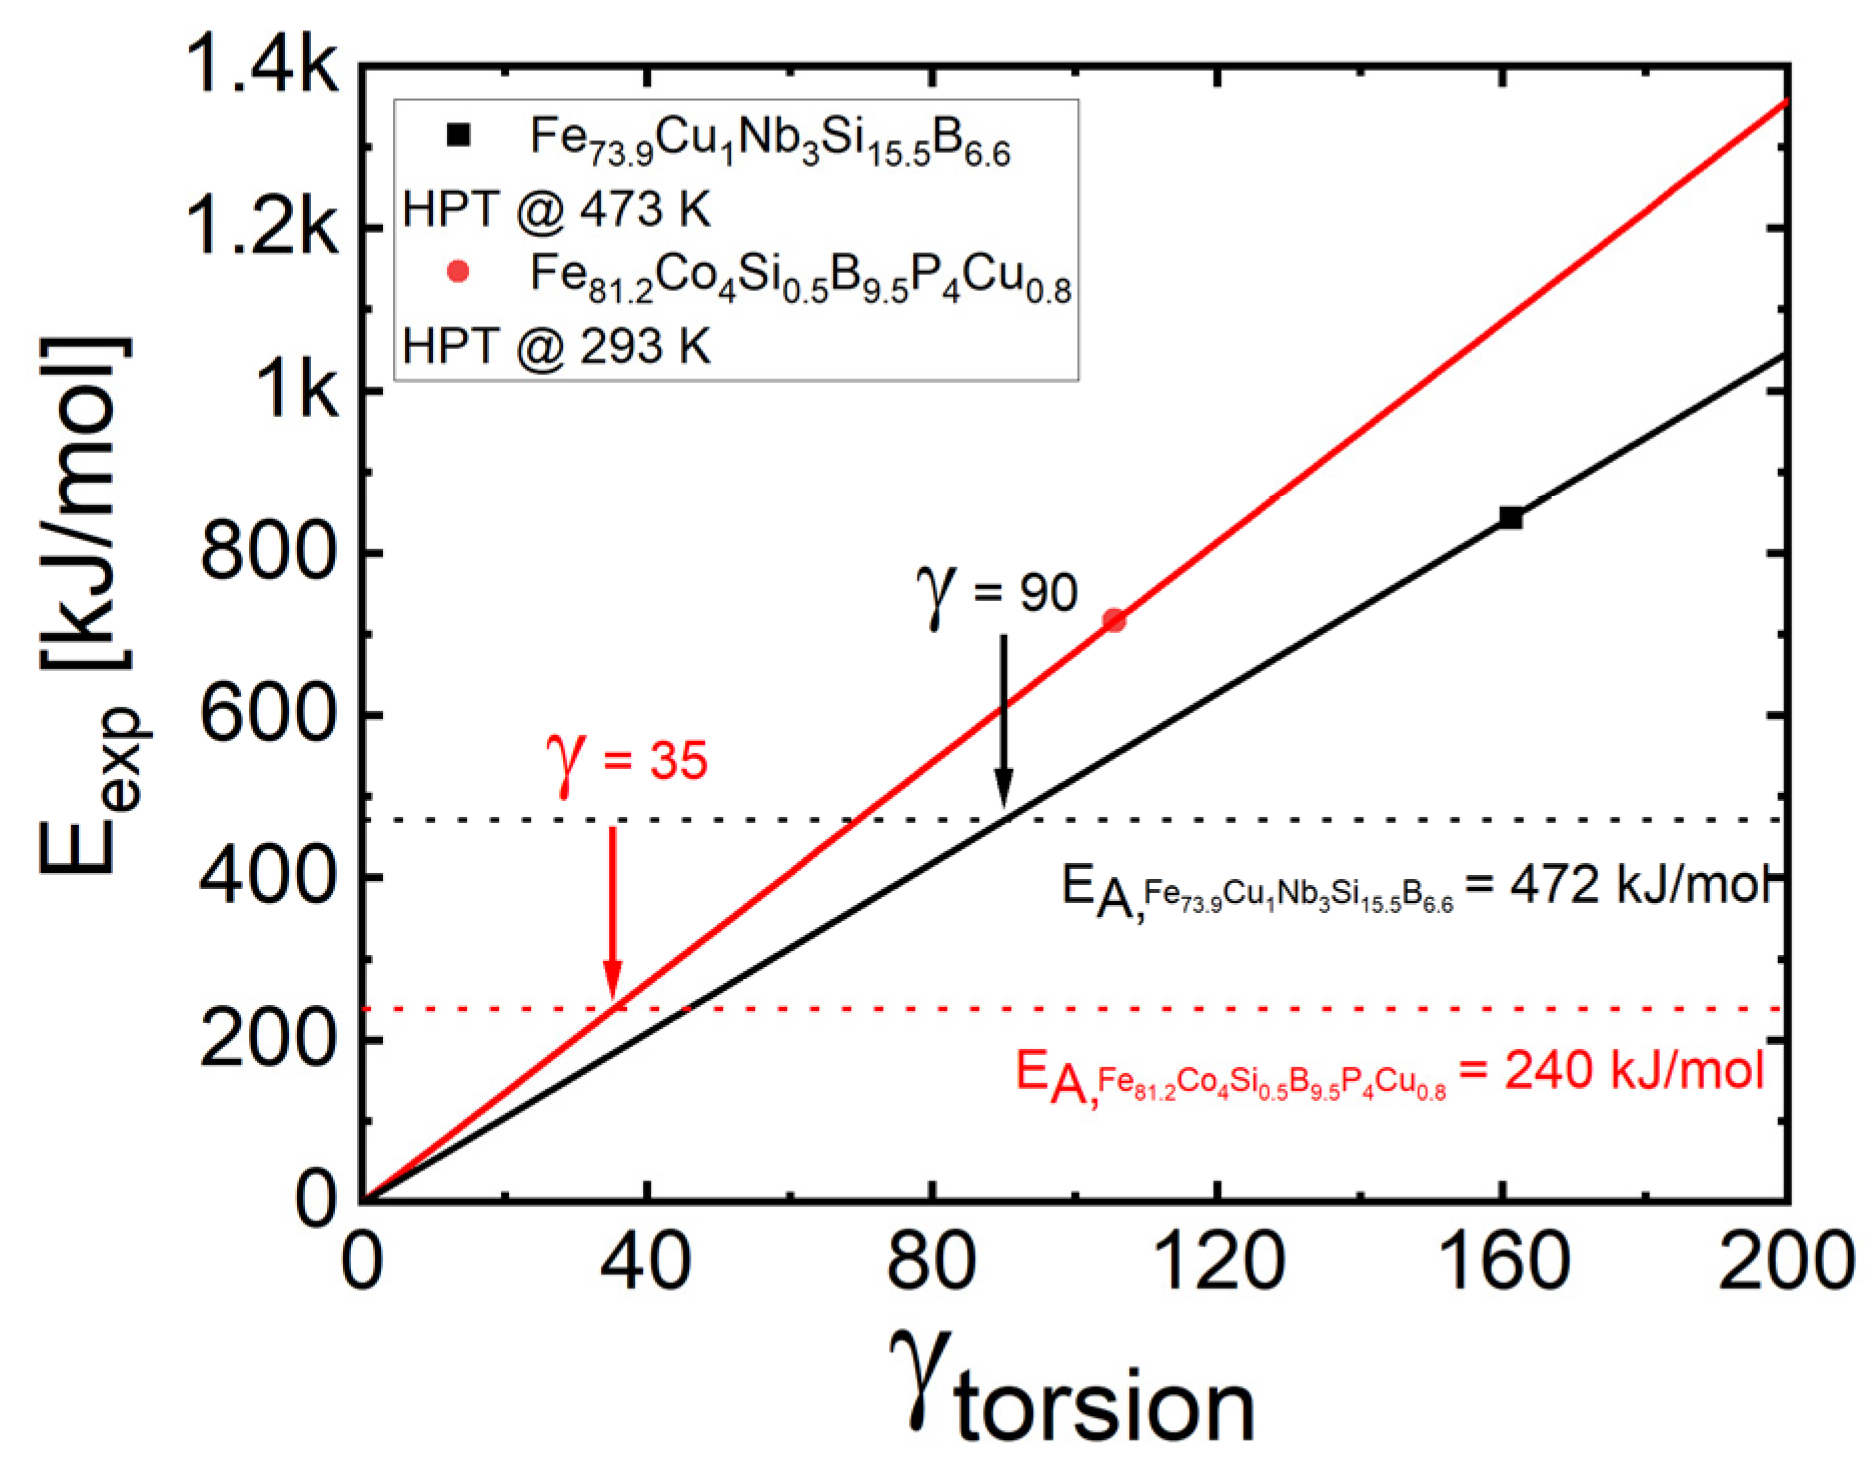
| Number of Turns | Thickness [µm] | Torsional Shear Stress [MPa] | Torsional Shear Strain [1] | Eexp @ 453 K [kJ/mol] |
|---|---|---|---|---|
| 1 | 156 | 673.4 | 161 | 844.2 |
| 2 | 87 | 578 | 3027.7 | |
| 5 | 70 | 1795 | 9407.4 | |
| 10 | 74 | 3396 | 17,797.7 |
| Number of Turns | Thickness [µm] | Shear Stress [MPa] | Shear Strain | Eexpend @ RT [kJ/mol] |
|---|---|---|---|---|
| 1 | 238 | 897.8 | 106 | 716.8 |
| 2 | 146 | 344 | 2337.1 | |
| 5 | 116 | 1083 | 7353.8 | |
| 10 | 100 | 2513 | 17,060.7 |
References
- Makino, A. Nanocrystalline soft magnetic Fe–Si–B–P–Cu alloys with high B of 1.8–1.9 T contributable to energy saving. IEEE Trans. Magn. 2012, 48, 1331–1335. [Google Scholar] [CrossRef]
- Yoshizawa, Y.; Oguma, S.; Yamauchi, K. New Fe-based soft magnetic alloys composed of ultrafine grain structure. J. Appl. Phys. 1988, 64, 6044–6046. [Google Scholar] [CrossRef]
- Groessinger, R.; Sato-Turtelli, R.; Duong, V.H.; Kuß, C.; Polak, C.; Herzer, G. Temperature dependence of the magnetostriction in α-Fe(100-x)Six and FINEMET type alloys. J. Metastab. Nanocryst. Mater. 1999, 1, 135–142. [Google Scholar] [CrossRef]
- Kuhnt, M.; Marsilius, M.; Strache, T.; Polak, C.; Herzer, G. Magnetostriction of nanocrystalline (Fe,Co)–Si–B–P–Cu alloys. Scr. Mater. 2017, 130, 46–48. [Google Scholar] [CrossRef]
- Kuhnt, M. Structural and Magnetic Characterization of Fe–Si–B–P–Cu Alloys. Ph.D. Thesis, Technische Universität, Darmstadt, Germany, 2019. [Google Scholar] [CrossRef]
- Flohrer, S.; Herzer, G. Random and uniform anisotropy in soft magnetic nanocrystalline alloys (invited). J. Magn. Magn. Mater. 2010, 322, 1511–1514. [Google Scholar] [CrossRef]
- Ayers, J.D.; Harris, V.G.; Sprague, J.A.; Elam, W.T.; Jones, H.N. On the formation of nanocrystals in the soft magnetic alloy Fe73.5Nb3Cu1Si13.5B9. Acta Mater. 1998, 46, 1861–1874. [Google Scholar] [CrossRef]
- Herzer, G.; Hilzinger, H.R. Surface crystallisation and magnetic properties in amorphous iron rich alloys. J. Magn. Magn. Mater. 1986, 62, 143–151. [Google Scholar] [CrossRef]
- Xue, Z.; Li, X.; Sohrabi, S.; Ren, Y.; Wang, W. Magnetic properties in Finemet-type soft magnetic toroidal cores annealed under radial stresses. Metals 2020, 10, 122. [Google Scholar] [CrossRef]
- Günther, W. Stress annealing process suitable for the production of low permeable nanocrystalline tape wound cores. J. Magn. Magn. Mater. 2005, 290–291, 1483–1486. [Google Scholar] [CrossRef]
- Herzer, G.; Flohrer, S.; Polak, C. Effect of stress annealing on the saturation magnetostriction of nanocrystalline Fe73.5Cu1Nb3Si15.5B7. IEEE Trans. Magn. 2010, 46, 341–344. [Google Scholar] [CrossRef]
- Herzer, G. Magnetic field-induced anisotropy in nanocrystalline Fe–Cu–Nb–Si–B alloys. J. Magn. Magn. Mater. 1994, 133, 248–250. [Google Scholar] [CrossRef]
- Gavrilović, A.; Minić, D.M.; Rafailović, L.D.; Angerer, P.; Wosik, J.; Maričić, A.; Minić, D.M. Phase transformations of Fe73.5Cu1Nb3Si15.5B7 amorphous alloy upon thermal treatment. J. Alloys Compd. 2010, 504, 462–467. [Google Scholar] [CrossRef]
- Abrosimova, G.; Aronin, A.; Matveev, D.; Pershina, E. Nanocrystal formation, structure and magnetic properties of Fe–Si–B amorphous alloy after deformation. Mater. Lett. 2013, 97, 15–17. [Google Scholar] [CrossRef]
- Zehetbauer, M.; Zhu, Y.T. Bulk Nanostructured Materials; Wiley-VCH Weinheim: Hoboken, NJ, USA, 2008; ISBN 978-3-527-31524-6. [Google Scholar]
- Edalati, K.; Bachmaier, A.; Beloshenko, V.A.; Beygelzimer, Y.; Blank, V.D.; Botta, W.J.; Bryła, K.; Čížek, J.; Divinski, S.; Enikeev, N.A.; et al. Nanomaterials by severe plastic deformation: Review of historical developments and recent advances. Mater. Res. Lett. 2022, 10, 163–256. [Google Scholar] [CrossRef]
- Meng, F.; Tsuchiya, K.; Ii, S.; Yokoyama, Y. Reversible transition of deformation mode by structural rejuvenation and relaxation in bulk metallic glass. Appl. Phys. Lett. 2012, 101, 121914. [Google Scholar] [CrossRef]
- Bridgman, P.W. Effects of high shearing stress combined with high hydrostatic pressure. Phys. Rev. 1935, 48, 825–847. [Google Scholar]
- Spieckermann, F.; Şopu, D.; Soprunyuk, V.; Kerber, M.B.; Bednarcik, J.; Schökel, A.; Rezvan, A.; Ketov, S.; Sarac, B.; Schafler, E.; et al. Structure-dynamics relationships in cryogenically deformed bulk metallic glass. Nat. Commun. 2022, 13, 127. [Google Scholar] [CrossRef]
- Hono, K.; Hiraga, K.; Wang, Q.; Inoue, A.; Sakurai, T. The microstructure evolution of a Fe73.5Si13.5B9Nb3Cu1 nanocrystalline soft magnetic material. Acta Metall. Mater. 1992, 40, 2137–2147. [Google Scholar] [CrossRef]
- Herzer, G. Chapter 3: Nanocrystalline soft magnetic alloys. In Handbook of Magnetic Materials; Elsevier: Amsterdam, The Netherlands, 1997. [Google Scholar] [CrossRef]
- Khakwani, S.; Antoni, M.; Rabensteiner, A.; Schafler, E.; Grössinger, R.; Zehetbauer, M. Bulk nanocrystalline soft magnetic Fe–Si–X alloys achieved through severe plastic deformation. Materials 2022. to be submitted. [Google Scholar]
- Makino, A.; Kubota, T.; Yubuta, K.; Inoue, A.; Urata, A.; Matsumoto, H.; Yoshida, S. Low core losses and magnetic properties of Fe85-86Si1-2B8P4Cu1 nanocrystalline alloys with high B for power applications. J. Appl. Phys. 2011, 109, 07A302. [Google Scholar] [CrossRef]
- Stoica, M.; Eckert, J.; Roth, S.; Zhang, Z.F.; Schultz, L.; Wang, W.H. Mechanical behavior of Fe65.5Cr4Mo4Ga4P12C5B5.5 bulk metallic glass. Intermetallics 2005, 13, 764–769. [Google Scholar] [CrossRef]
- Glezer, A.M.; Shurygina, N.A. Amorphous-Nanocrystalline Alloys; Taylor & Francis Group: Boca Raton, FL, USA, 2017. [Google Scholar] [CrossRef]
- Minnert, C.; Kuhnt, M.; Bruns, S.; Marshal, A.; Pradeep, K.G.; Marsilius, M.; Bruder, E.; Durst, K. Study on the embrittlement of flash annealed Fe85.2B9.5P4Cu0.8Si0.5 metallic glass ribbons. Materials 2017, 156, 252–256. [Google Scholar] [CrossRef]
- Kovac, J.; Petrovič, P.; Fechová, E.; Füzer, J.; Kollár, P. Magnetic properties of the FINEMET type powder prepared by long time milling. Phys. Stat. Solidi (a) 2002, 189, 859–863. [Google Scholar] [CrossRef]
- Csach, K.; Miškuf, J.; Juríková, A.; Janák, G. Influence of plastic deformation on nanocrystallization of Finemet alloy. Acta Phys. Pol. A 2010, 118, 820–822. [Google Scholar] [CrossRef]
- Pershina, E.A.; Abrosimova, G.E.; Aronin, A.S.; Matveev, D.V. Evolution of magnetic properties of amorphous Fe78Si13B9 alloy during deformation and subsequent heat treatment. Phys. Solid State 2015, 57, 234–238. [Google Scholar] [CrossRef]
- Aronin, A.; Abrosimova, G.; Matvev, D.; Rybchenko, O. Structure and properties of nanocrystalline alloys prepared by high pressure torsion. Rev. Adv. Mater. Sci. 2010, 25, 52–57. [Google Scholar]
- Abrosimova, G.E.; Aronin, A.S.; Dobatkin, S.V.; Zver’kova, I.I.; Matveev, D.V.; Rybchenko, O.G.; Tat’yanin, E.V. Nanocrystallization of an amorphous Fe80B20 alloy during severe plastic deformation. Phys. Solid State 2007, 49, 1034–1039. [Google Scholar] [CrossRef]
- Antoni, M.; Spieckermann, F.; Soprunyuk, V.; Chawake, N.; Sarac, B.; Zalesak, J.; Polak, C.; Gammer, C.; Pippan, R.; Zehetbauer, M.; et al. Effect of high pressure torsion on crystallization and magnetic properties of Fe73.9Cu1Nb3Si15.5B6.6. J. Magn. Magn. Mater. 2021, 525, 167679. [Google Scholar] [CrossRef]
- Scheriau, S.; Zhang, Z.; Kleber, S.; Pippan, R. Deformation mechanisms of a modified 316L austenitic steel subjected to high pressure torsion. Mater. Sci. Eng. A 2011, 528, 2776–2786. [Google Scholar] [CrossRef]
- Pippan, R.; Scheriau, S.; Hohenwarter, A.; Hafok, M. Advantages and limitations of HPT: A review. Mater. Sci. For. 2008, 584–586, 16–21. [Google Scholar] [CrossRef]
- Beygelzimer, Y.; Kulagin, R.; Toth, L.S.; Ivanisenko, Y. The self-similarity theory of high pressure torsion. Beilstein J. Nanotechnol. 2016, 7, 1267–1277. [Google Scholar] [CrossRef]
- Warren, B.E. X-ray Diffraction; Dover Publications: New York, NY, USA, 1990; ISBN 978-0-486-66317-3. [Google Scholar]
- Spaepen, F. A microscopic mechanism for steady state inhomogeneous flow in metallic glasses. Acta Metall. Mater. 1977, 25, 407–415. [Google Scholar] [CrossRef]
- Shivaee, H.A.; Hosseini, H.R.M. Advanced isoconversional kinetics of nanocrystallization in Fe73.5Si13.5B9Nb3Cu1 alloy. Thermochim. Acta 2009, 494, 80–85. [Google Scholar] [CrossRef]
- Kissinger, H.E. Reaction kinetics in differential thermal analysis. Anal. Chem. 1957, 29, 1702–1706. [Google Scholar] [CrossRef]
- Angell, C.A. Formation of glasses from liquids and biopolymers. Science 1995, 267, 1924–1935. [Google Scholar] [CrossRef]
- Vorhauer, A.; Pippan, R. On the onset of a steady state in body-centered cubic iron during severe plastic deformation at low homologous temperatures. Metall. Mater. Trans. A 2007, 39, 417–429. [Google Scholar] [CrossRef]
- Schniewind, J.D. Strain-Rate Sensitivity in High Pressure Torsion of Steel, Iron and Nickel. Ph.D. Thesis, University of Vienna, Vienna, Austria, 2021. [Google Scholar] [CrossRef]
- Boucharat, N.; Hebert, R.; Rösner, H.; Valiev, R.Z.; Wilde, G. Synthesis routes for controlling the microstructure in nanostructured Al88Y7Fe5 alloys. J. Alloys Compd. 2007, 434–435, 252–254. [Google Scholar] [CrossRef]
- Kovács, Z.; Henits, P.; Zhilyaev, A.P.; Révész, Á. Deformation induced primary crystallization in a thermally non-primary crystallizing amorphous Al85Ce8Ni5Co2 alloy. Scr. Mater. 2006, 54, 1733–1737. [Google Scholar] [CrossRef]
- Révész, Á.; Hóbor, S.; Szabó, P.J.; Zhilyaev, A.P.; Kovács, Z. Deformation induced crystallization in an amorphous Cu60Zr20Ti20 alloy by high pressure torsion. Mater. Sci. Eng. A 2007, 460–461, 459–463. [Google Scholar] [CrossRef]
- Chu, F.; Wu, K.; Meng, Y.; Edalati, K.; Lin, H.-J. Effect of high-pressure torsion on the hydrogen evolution performances of a melt-spun amorphous Fe73.5Si13.5B9Cu1Nb3 alloy. Int. J. Hydrogen Energy 2021, 46, 25029–25038. [Google Scholar] [CrossRef]
- Dos Santos, D.S.; dos Santos, D.R. Crystallization kinetics of Fe–B–Si metallic glasses. J. Non Cryst. Solids 2002, 304, 56–63. [Google Scholar] [CrossRef]
- Antoni, M.; Spieckermann, F.; Plutta, N.; Ramasamy, P.; Polak, C.; Kunca, B.; Skorvanek, I.; Pippan, R.; Zehetbauer, M.; Eckert, J. Influence of high pressure torsion on the magnetic properties of two Fe-based metallic glasses. Nanomaterials 2023. to be submitted. [Google Scholar]
- Stüwe, H.-P.; Turck, H. Zur Messung von Fliesskurven im Torsionsversuch. Int. J. Mater. Res. 1964, 55, 699–703. [Google Scholar] [CrossRef]


| Fe73.9Cu1Nb3Si15.5B6.6 (Alloy A) | Fe81.2Co4Si0.5B9.5P4Cu0.8 (Alloy B) | |
|---|---|---|
| Number of stacked ribbons | 50 | 30 |
| Deformation temperature | 200 °C (473 K) | Room temperature (293 K) |
| Deformation speed | 0.2 turns/min | 0.1 turns/min |
| Deformation pressure | 4 GPa | 3 GPa |
| Number of turns | 1, 2, 5 and 10 | |
| Final thickness range | 70–156 µm | 100–238 µm |
Disclaimer/Publisher’s Note: The statements, opinions and data contained in all publications are solely those of the individual author(s) and contributor(s) and not of MDPI and/or the editor(s). MDPI and/or the editor(s) disclaim responsibility for any injury to people or property resulting from any ideas, methods, instructions or products referred to in the content. |
© 2023 by the authors. Licensee MDPI, Basel, Switzerland. This article is an open access article distributed under the terms and conditions of the Creative Commons Attribution (CC BY) license (https://creativecommons.org/licenses/by/4.0/).
Share and Cite
Antoni, M.; Spieckermann, F.; Plutta, N.; Gammer, C.; Kapp, M.; Ramasamy, P.; Polak, C.; Pippan, R.; Zehetbauer, M.J.; Eckert, J. Can Severe Plastic Deformation Tune Nanocrystallization in Fe-Based Metallic Glasses? Materials 2023, 16, 1260. https://0-doi-org.brum.beds.ac.uk/10.3390/ma16031260
Antoni M, Spieckermann F, Plutta N, Gammer C, Kapp M, Ramasamy P, Polak C, Pippan R, Zehetbauer MJ, Eckert J. Can Severe Plastic Deformation Tune Nanocrystallization in Fe-Based Metallic Glasses? Materials. 2023; 16(3):1260. https://0-doi-org.brum.beds.ac.uk/10.3390/ma16031260
Chicago/Turabian StyleAntoni, Monika, Florian Spieckermann, Niklas Plutta, Christoph Gammer, Marlene Kapp, Parthiban Ramasamy, Christian Polak, Reinhard Pippan, Michael J. Zehetbauer, and Jürgen Eckert. 2023. "Can Severe Plastic Deformation Tune Nanocrystallization in Fe-Based Metallic Glasses?" Materials 16, no. 3: 1260. https://0-doi-org.brum.beds.ac.uk/10.3390/ma16031260