
GHz—THz Dielectric Properties of Flexible Matrix-Embedded BTO Nanoparticles
 , , ,
, , ,  and
and
Abstract
:1. Introduction
2. Materials and Methods
2.1. Synthesis and Fabrication of Different Flexible Polymer-Ceramic Nanocomposites
2.1.1. BaTiO3 Nanoparticle Fabrication
2.1.2. BaTiO3-Gelatin Nanocomposites Preparation
2.1.3. Epoxy Nanocomposite Preparation
2.1.4. SBS Nanocomposite
2.2. Characterization Method
3. Results
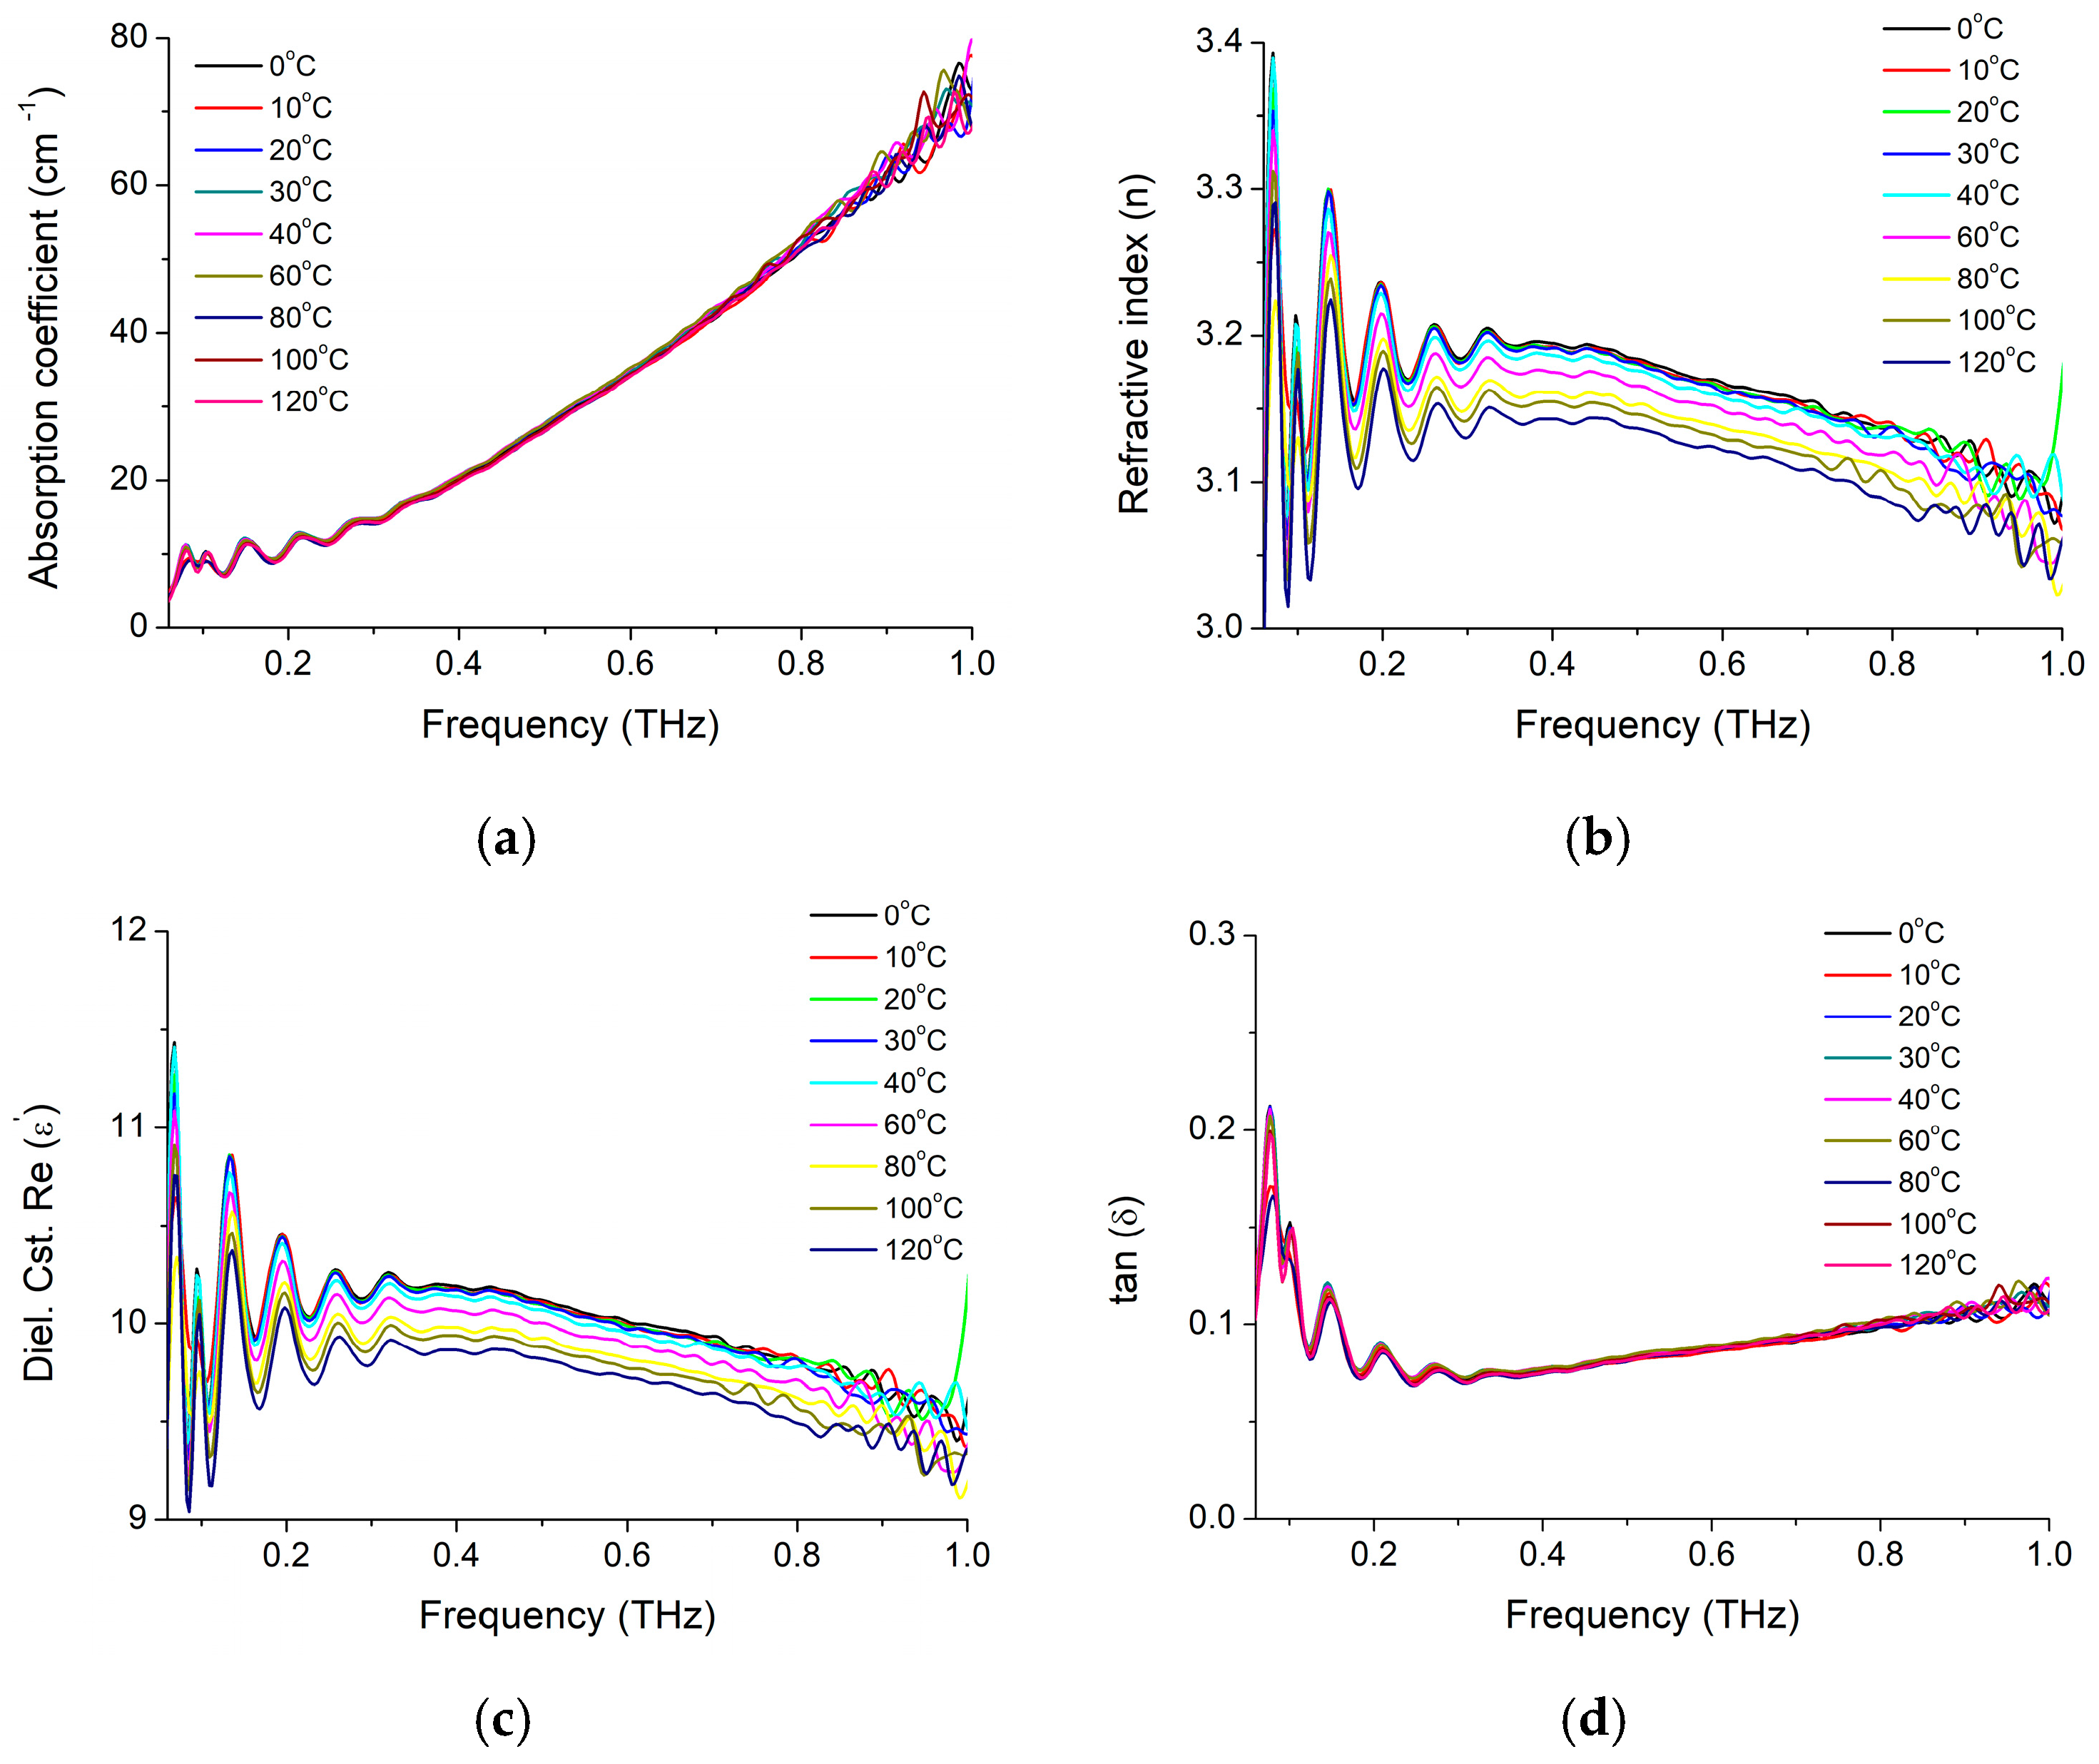
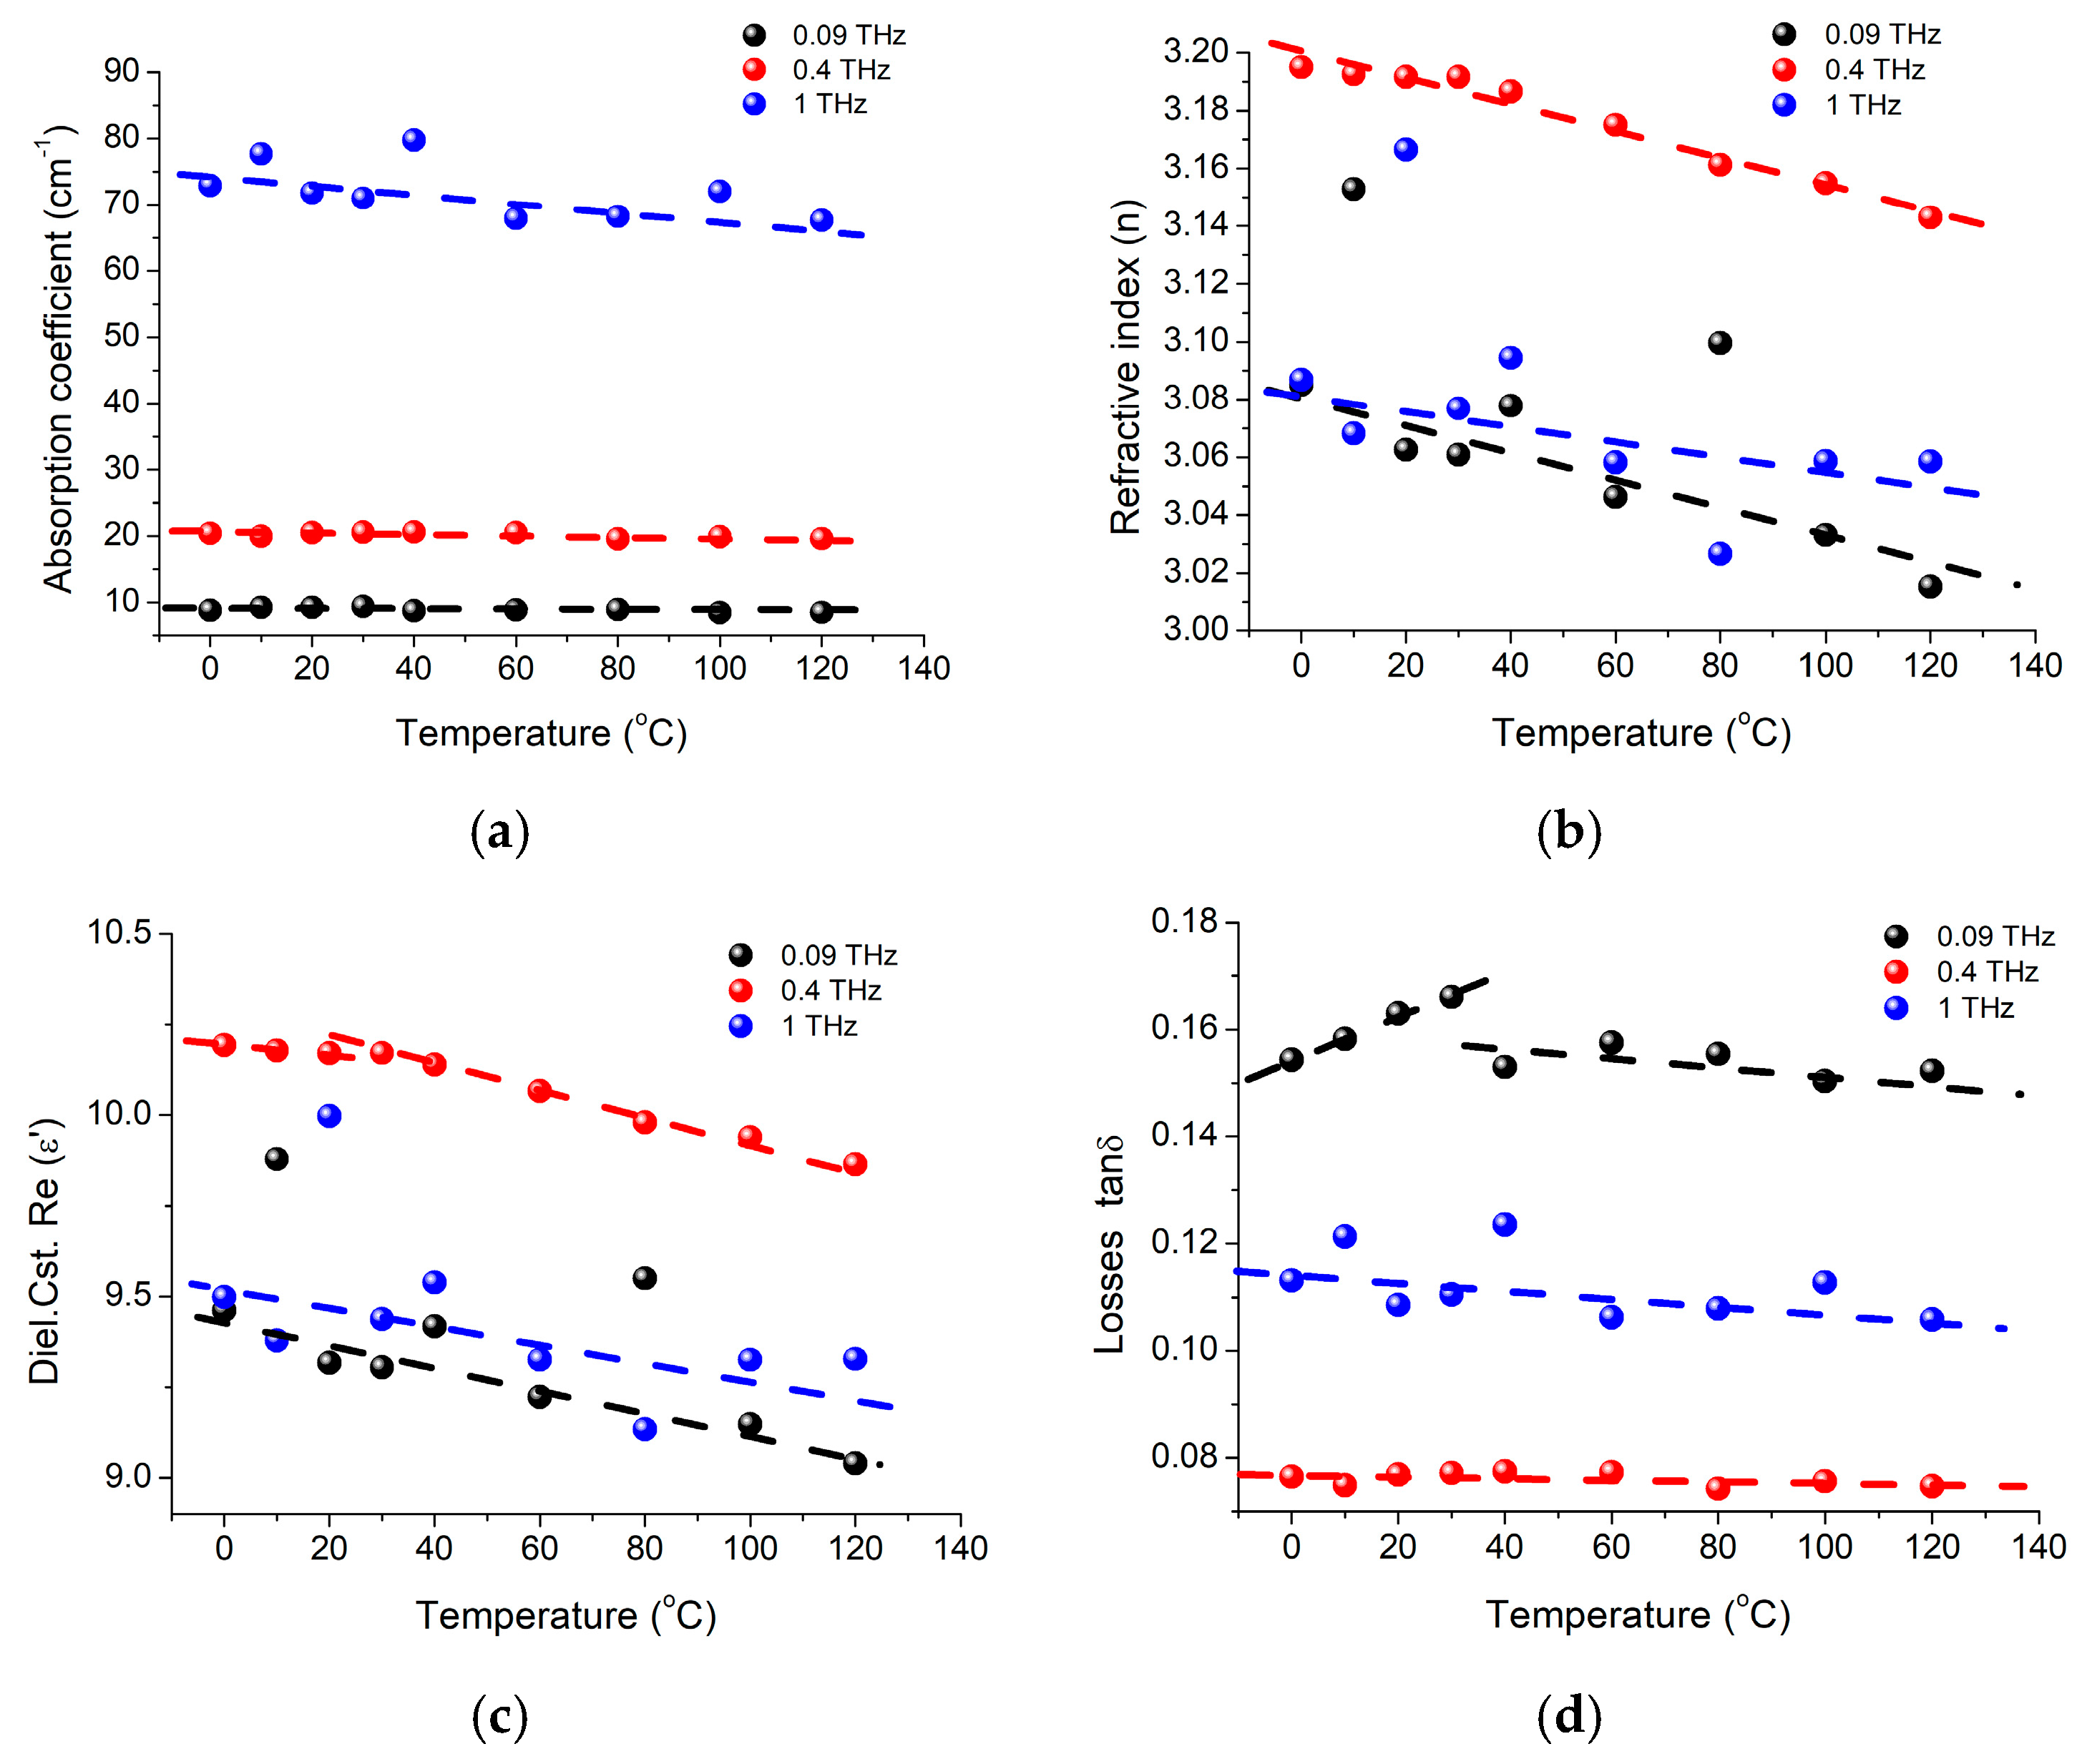
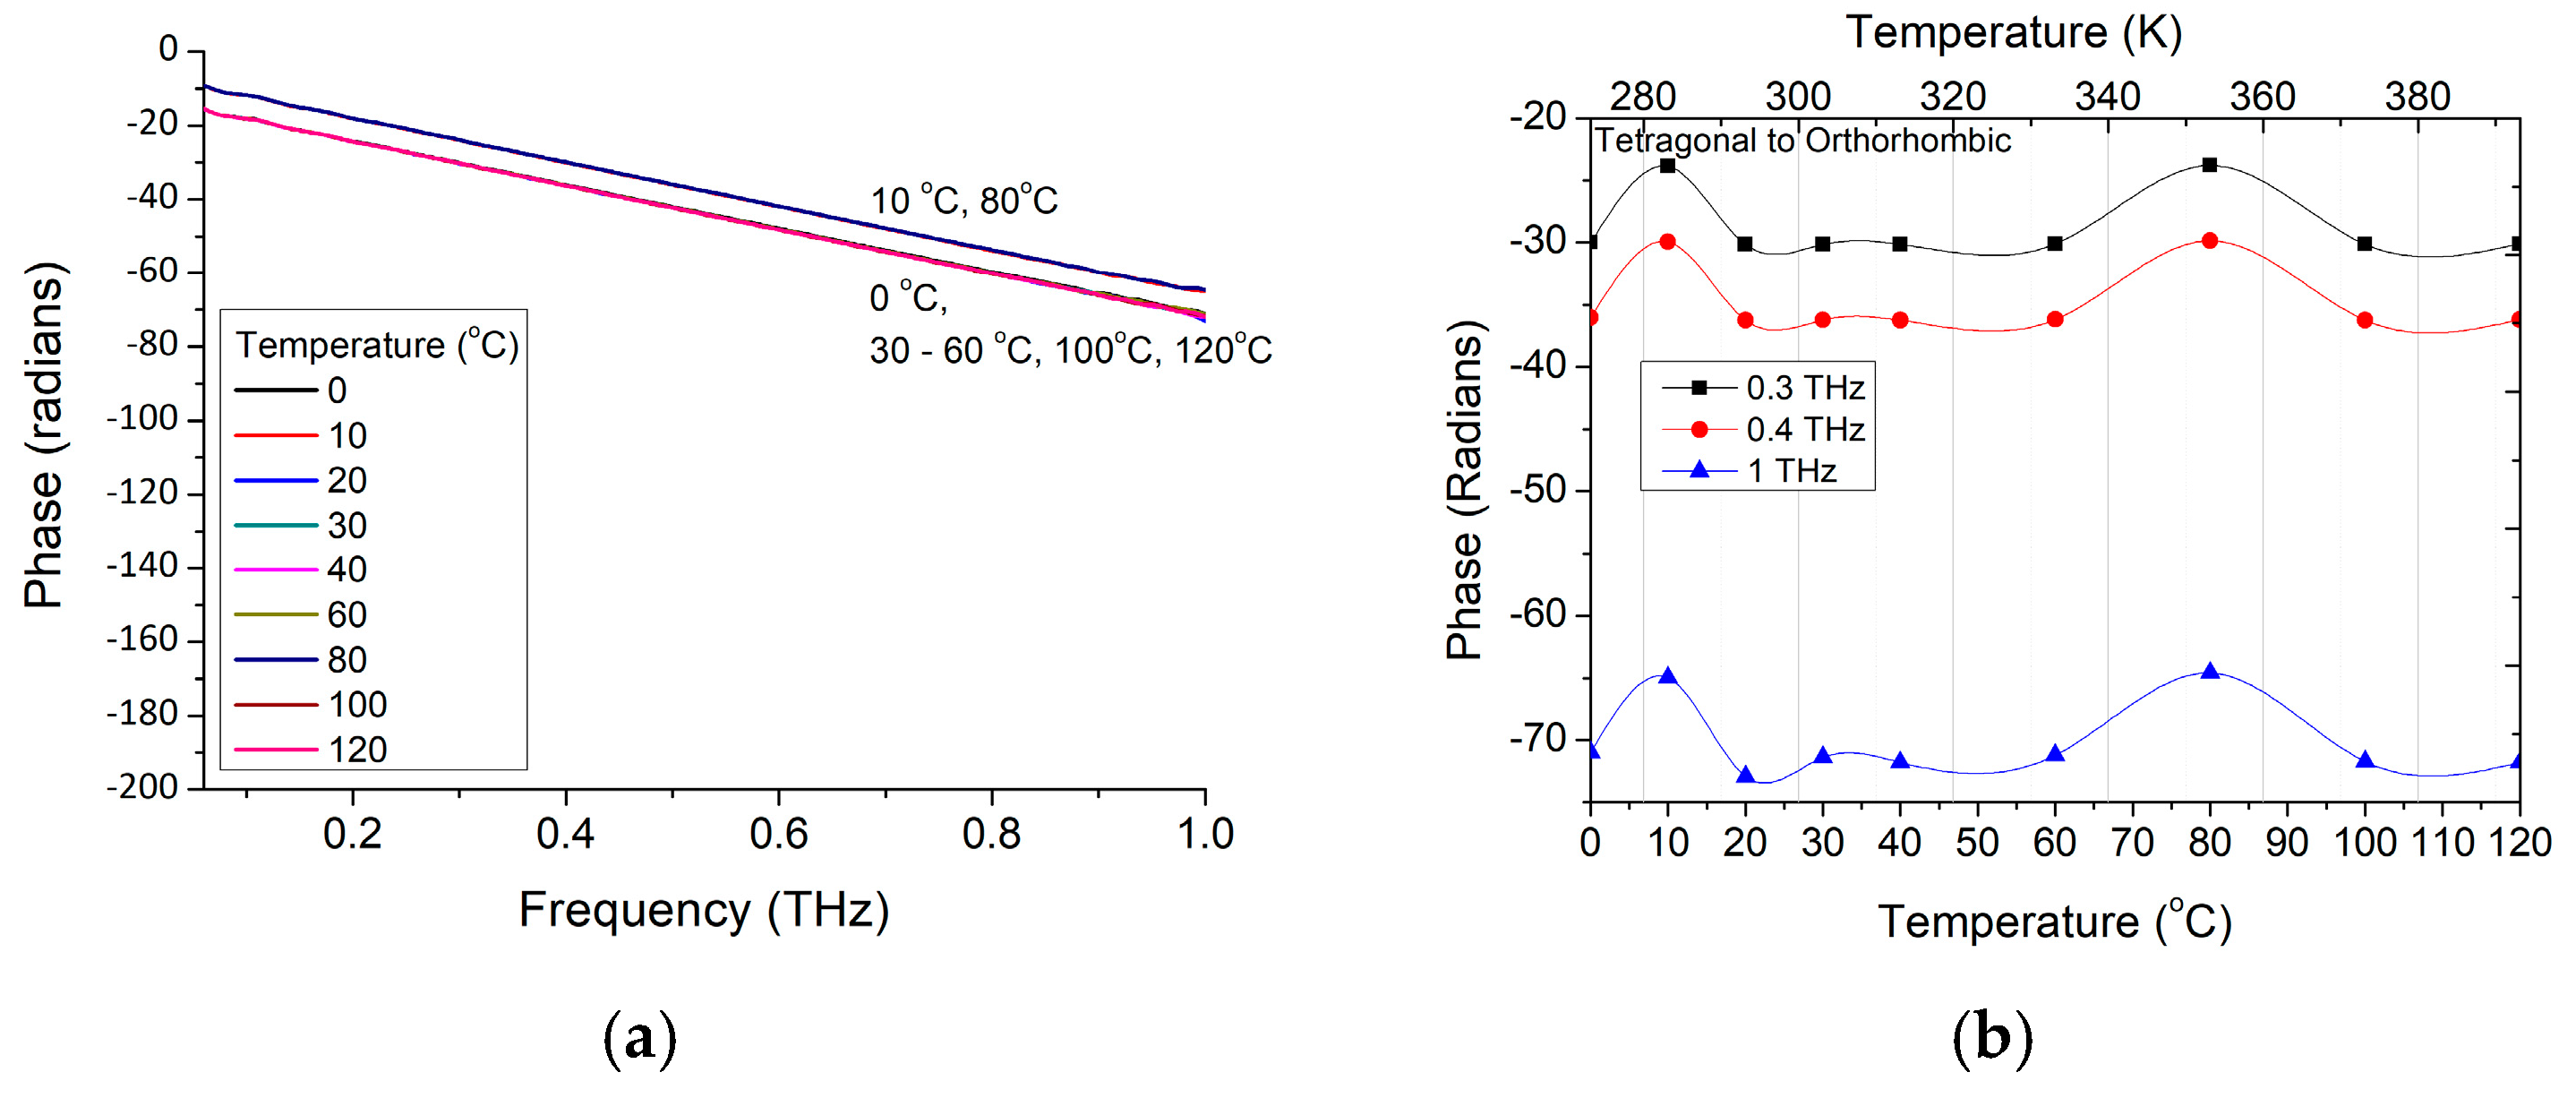
3.1. BTO Properties
3.2. Dielectric Properties of Flexible Polymer-Ceramic Nanocomposites Based on BaTiO3 NP
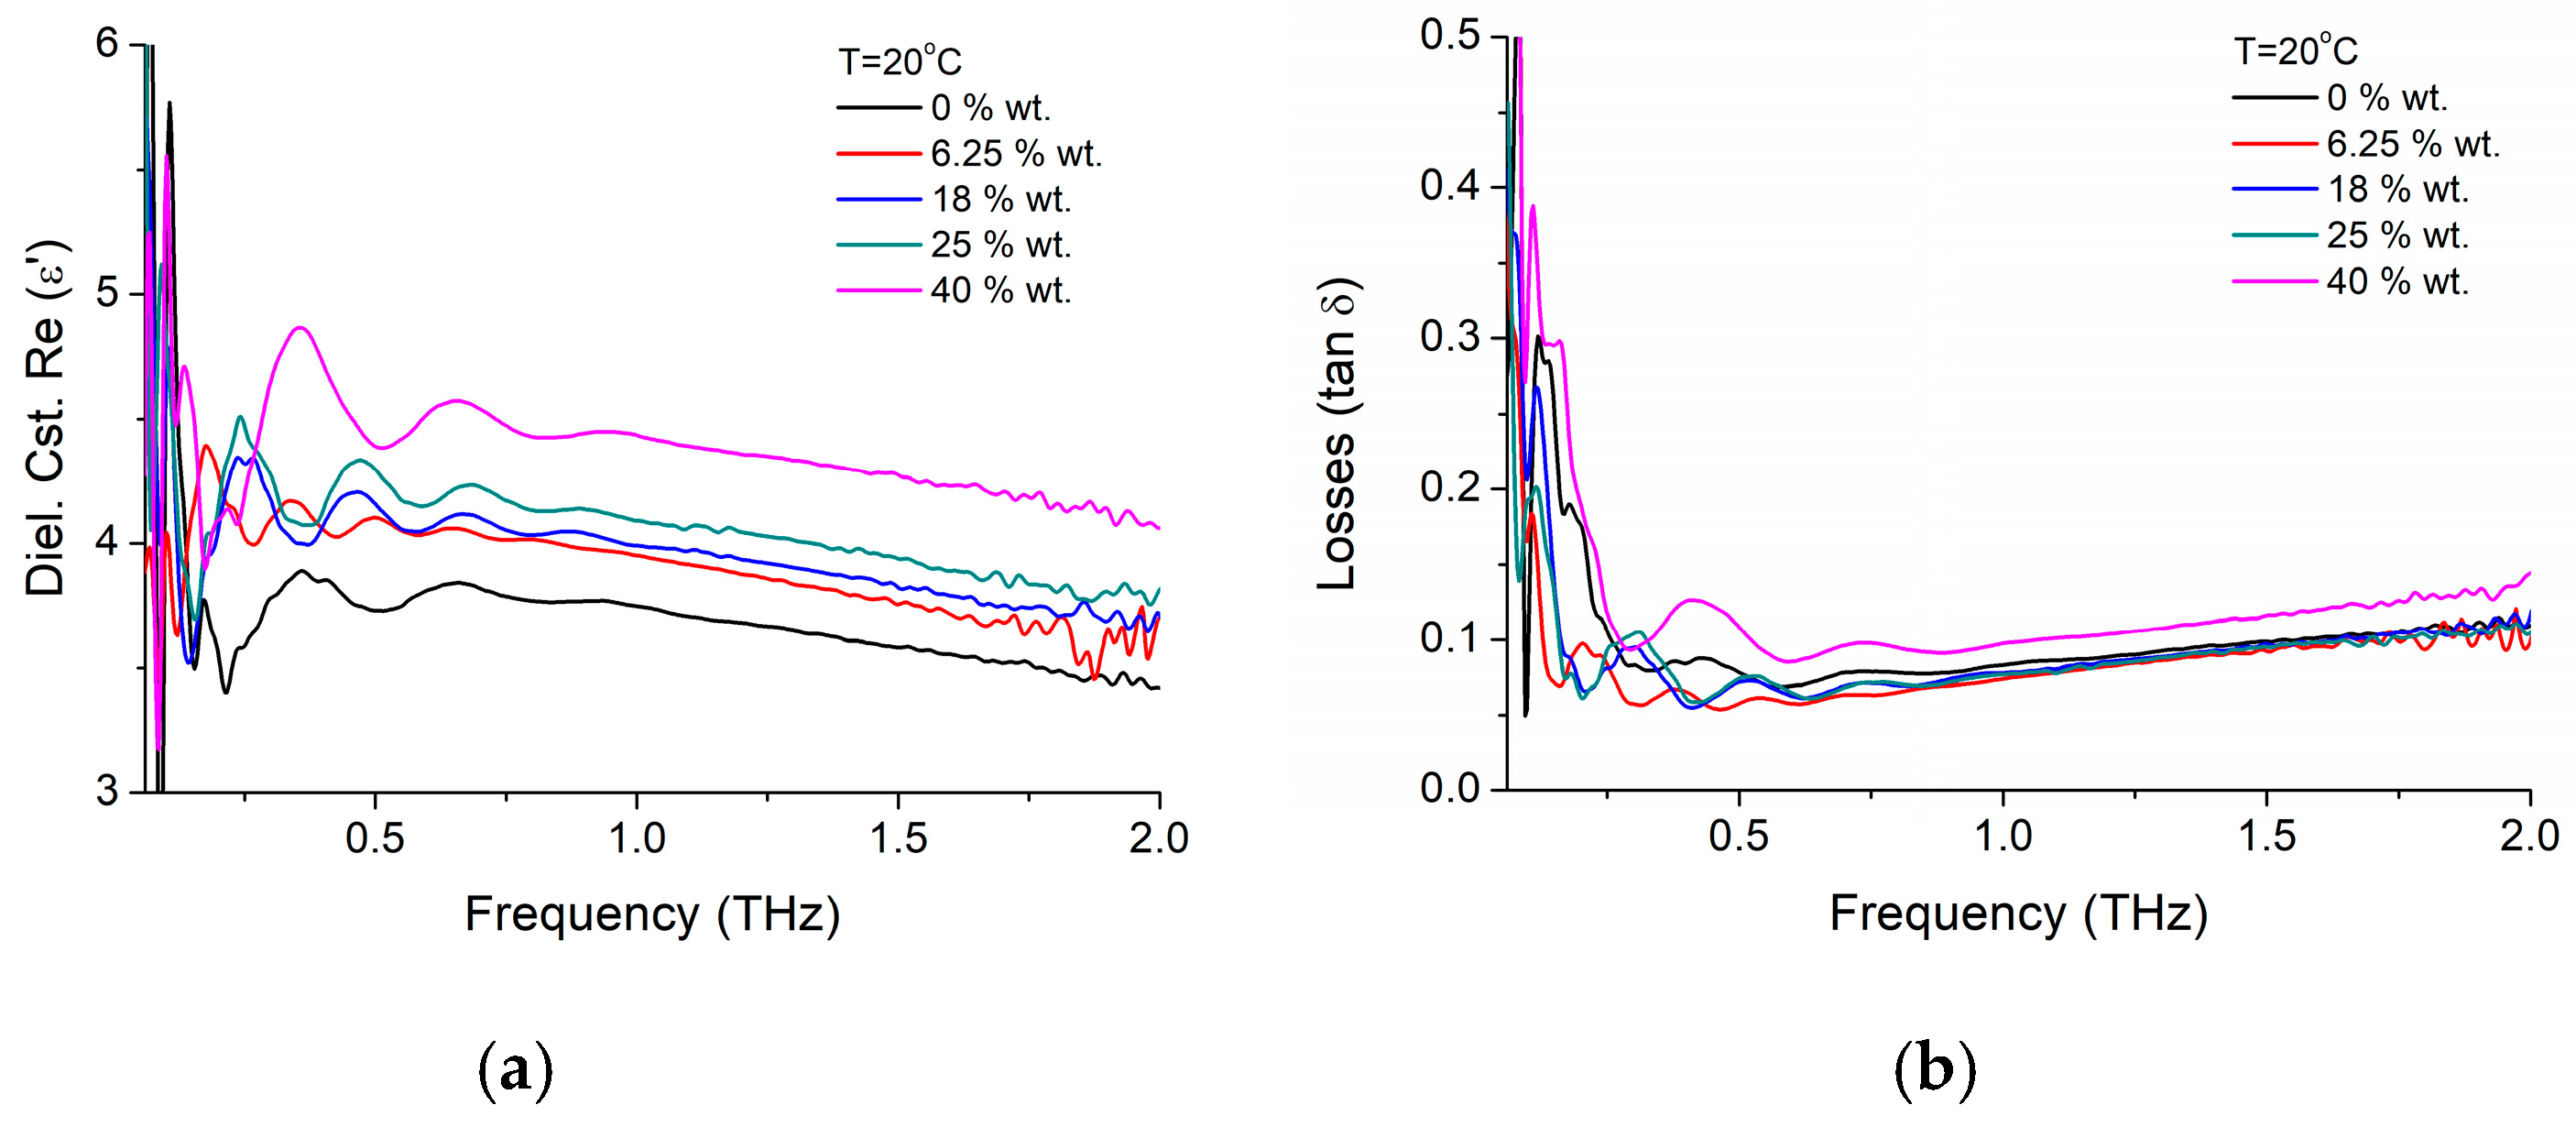
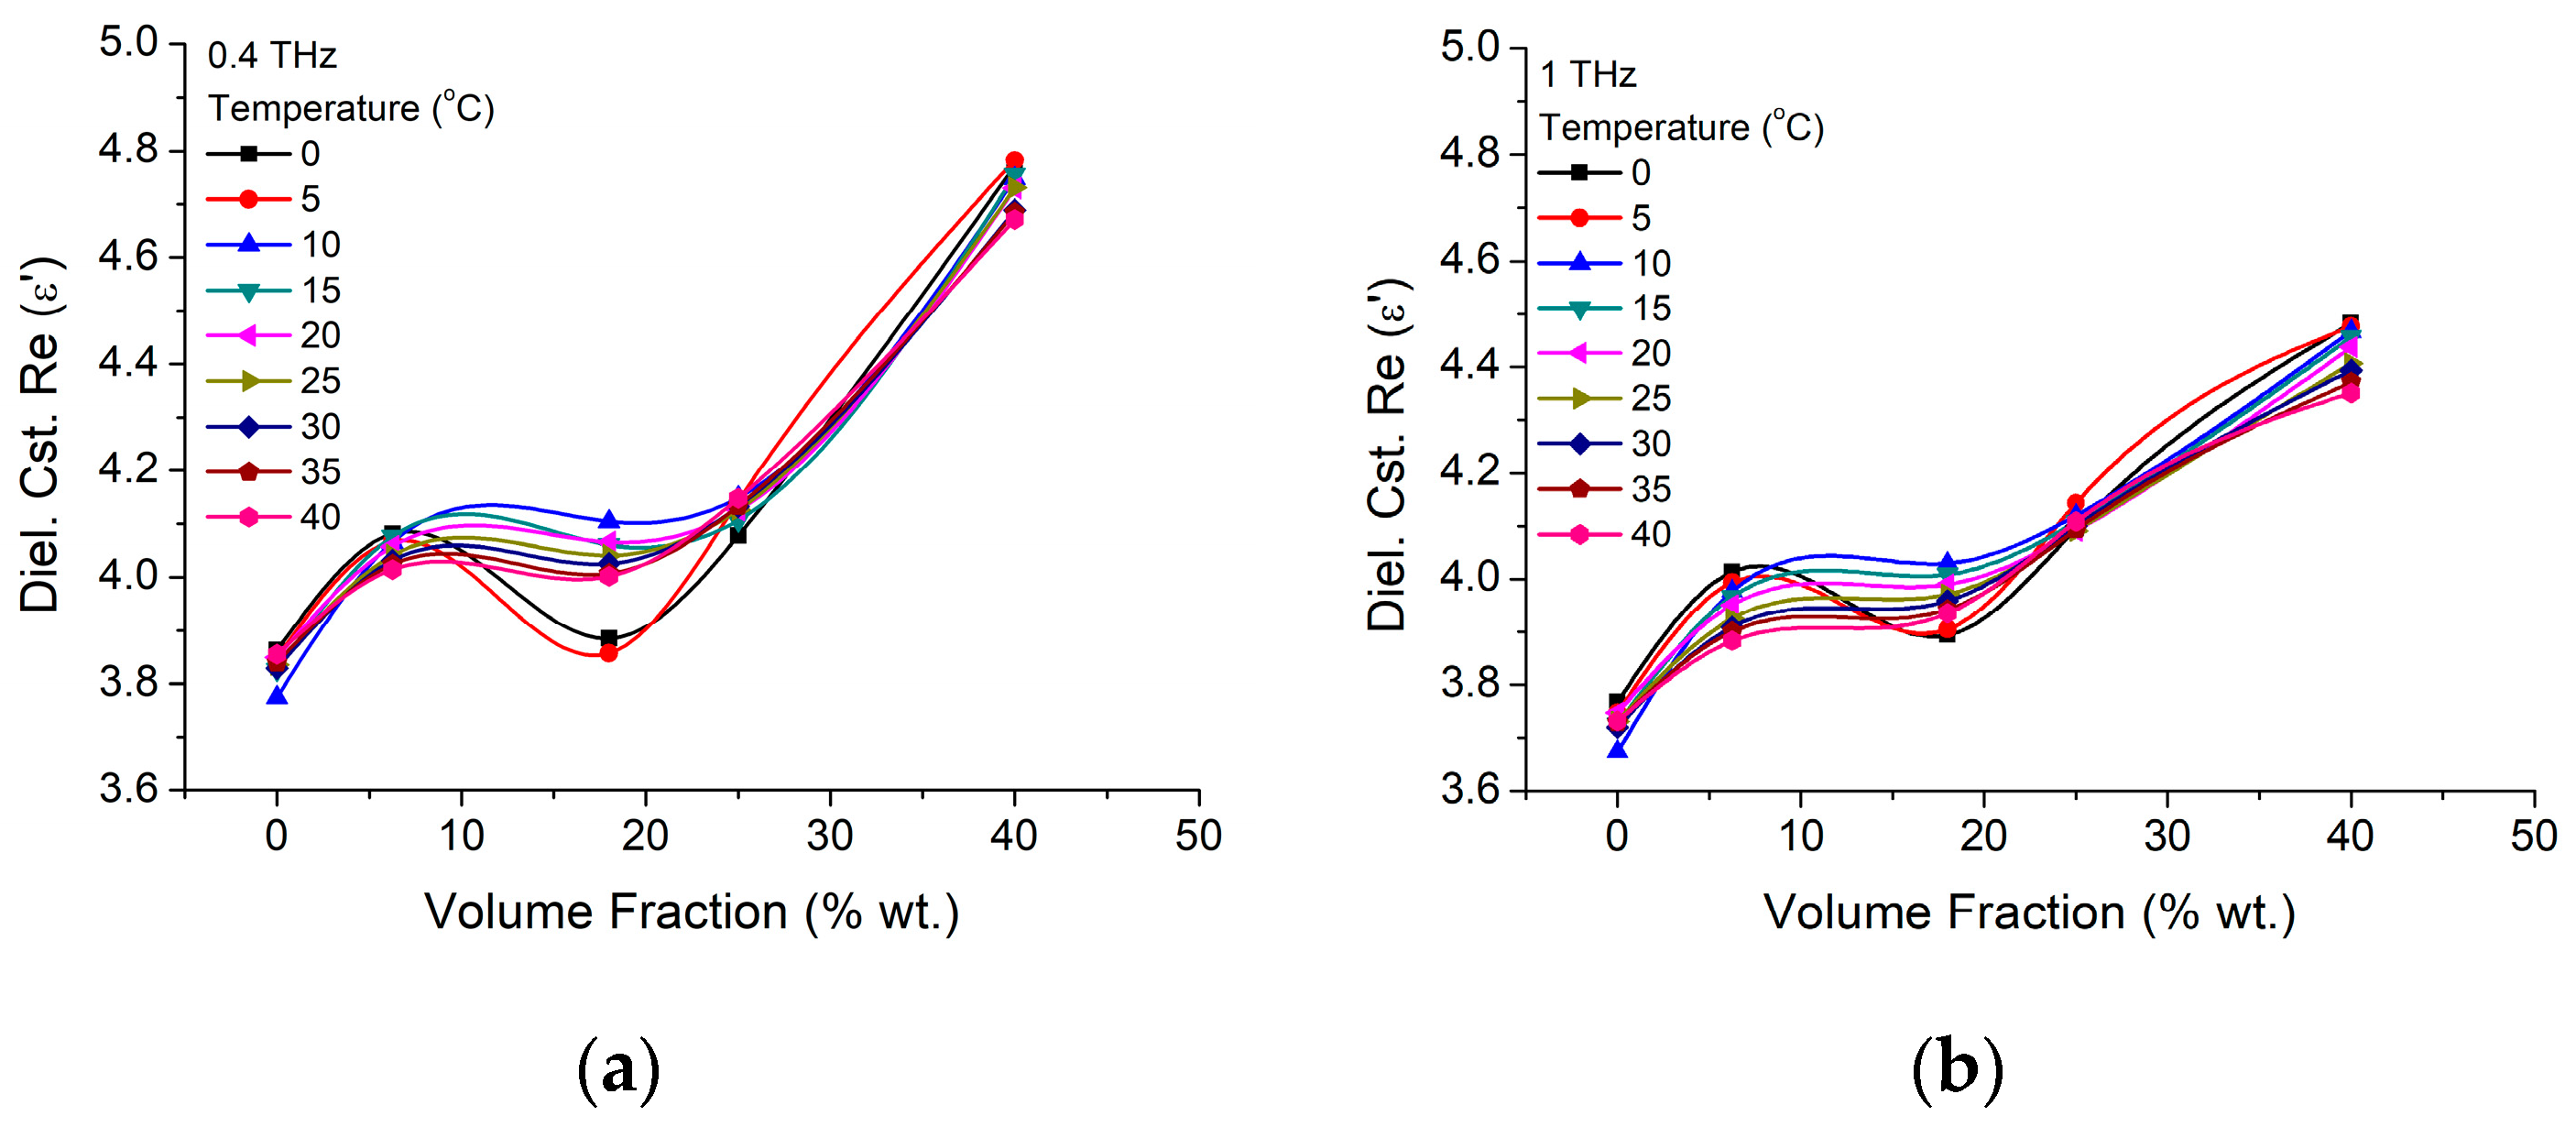
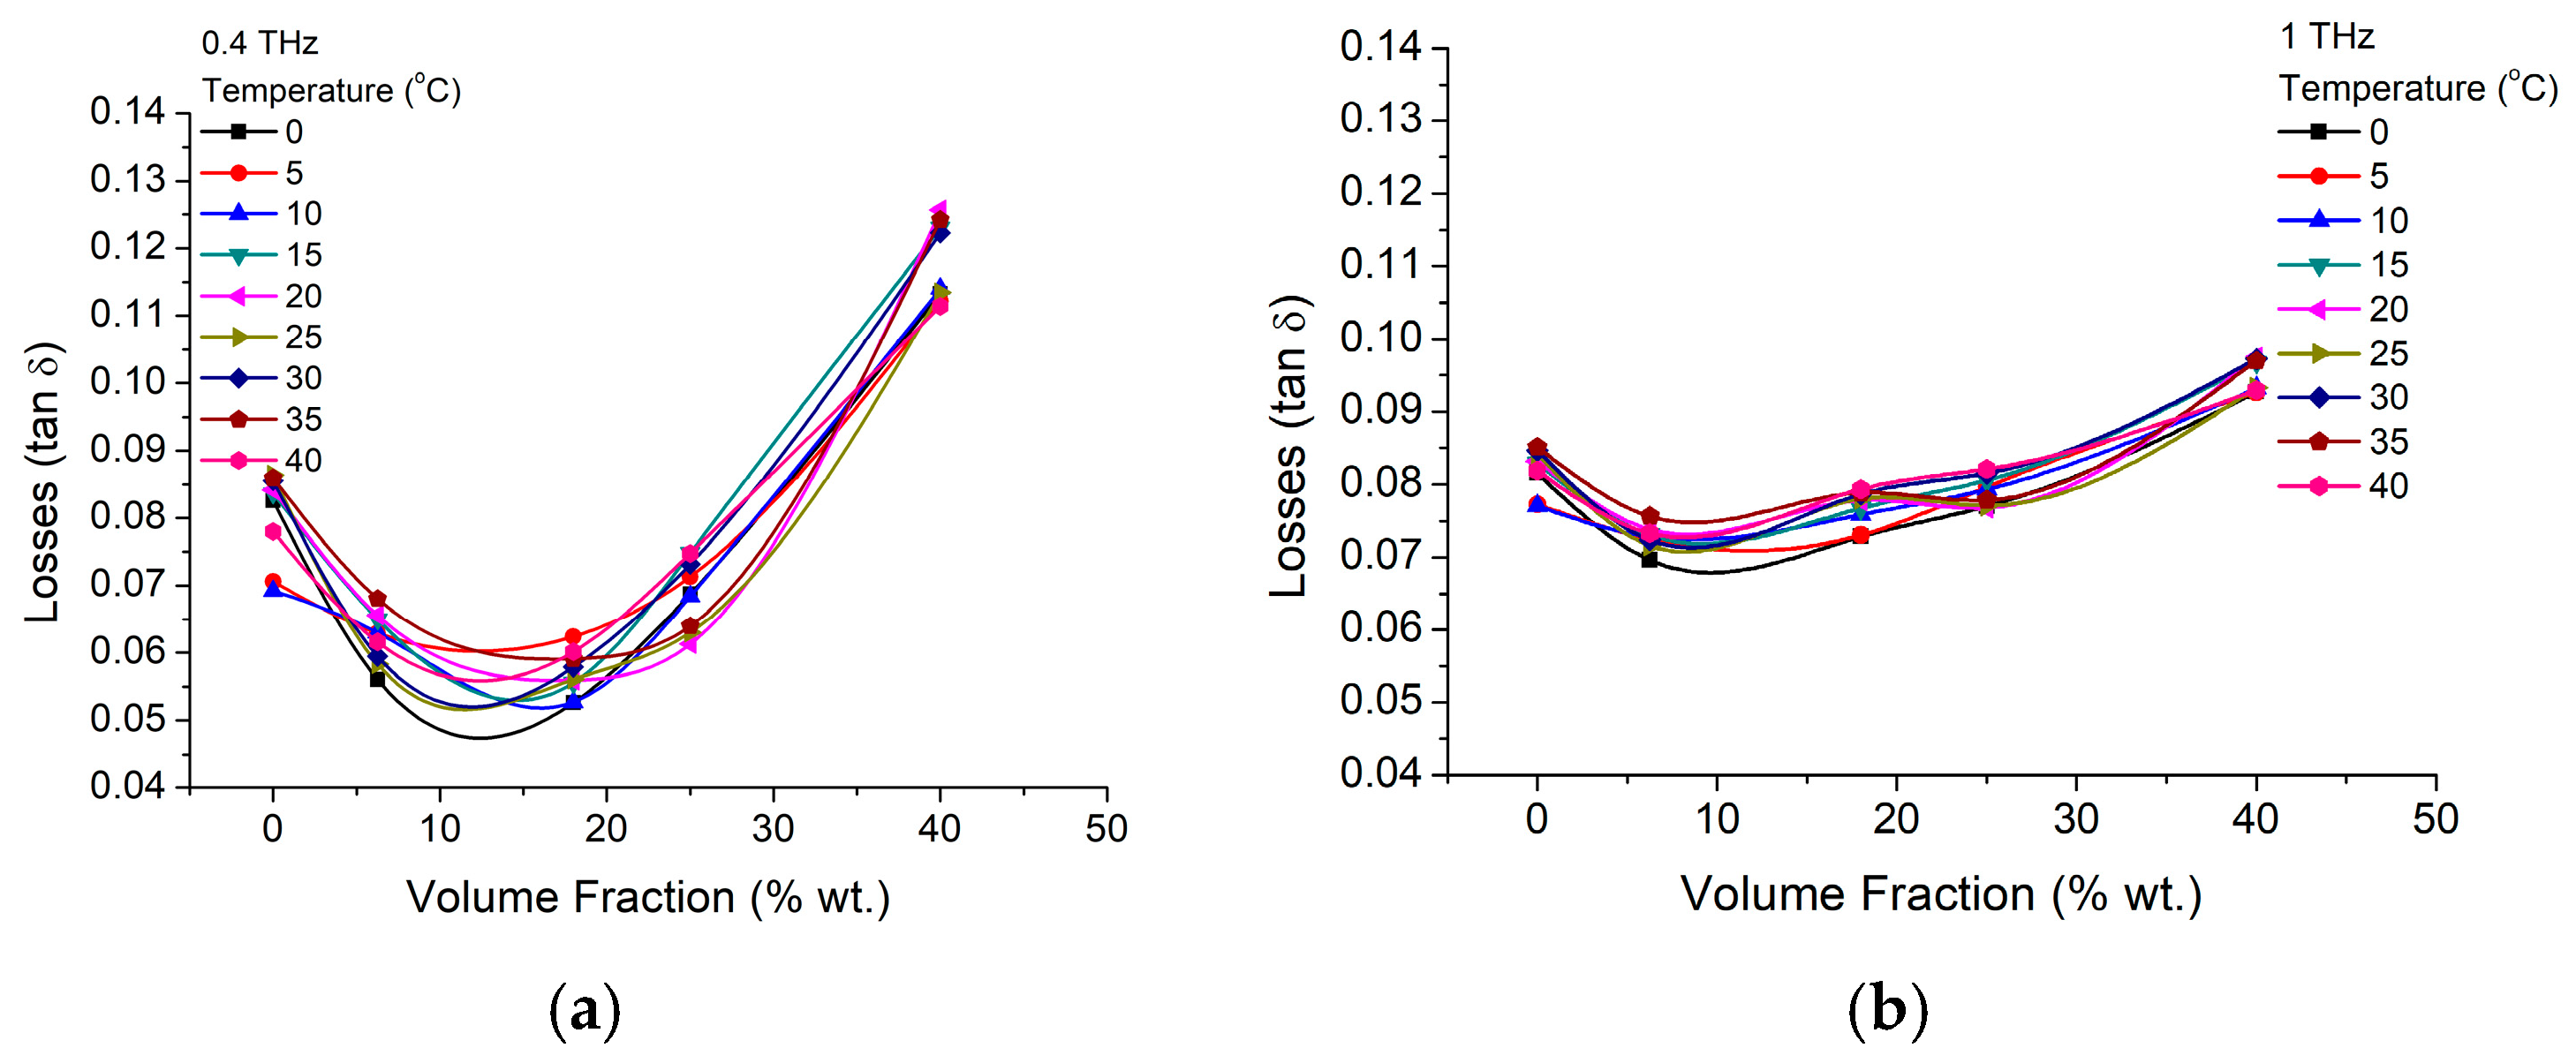
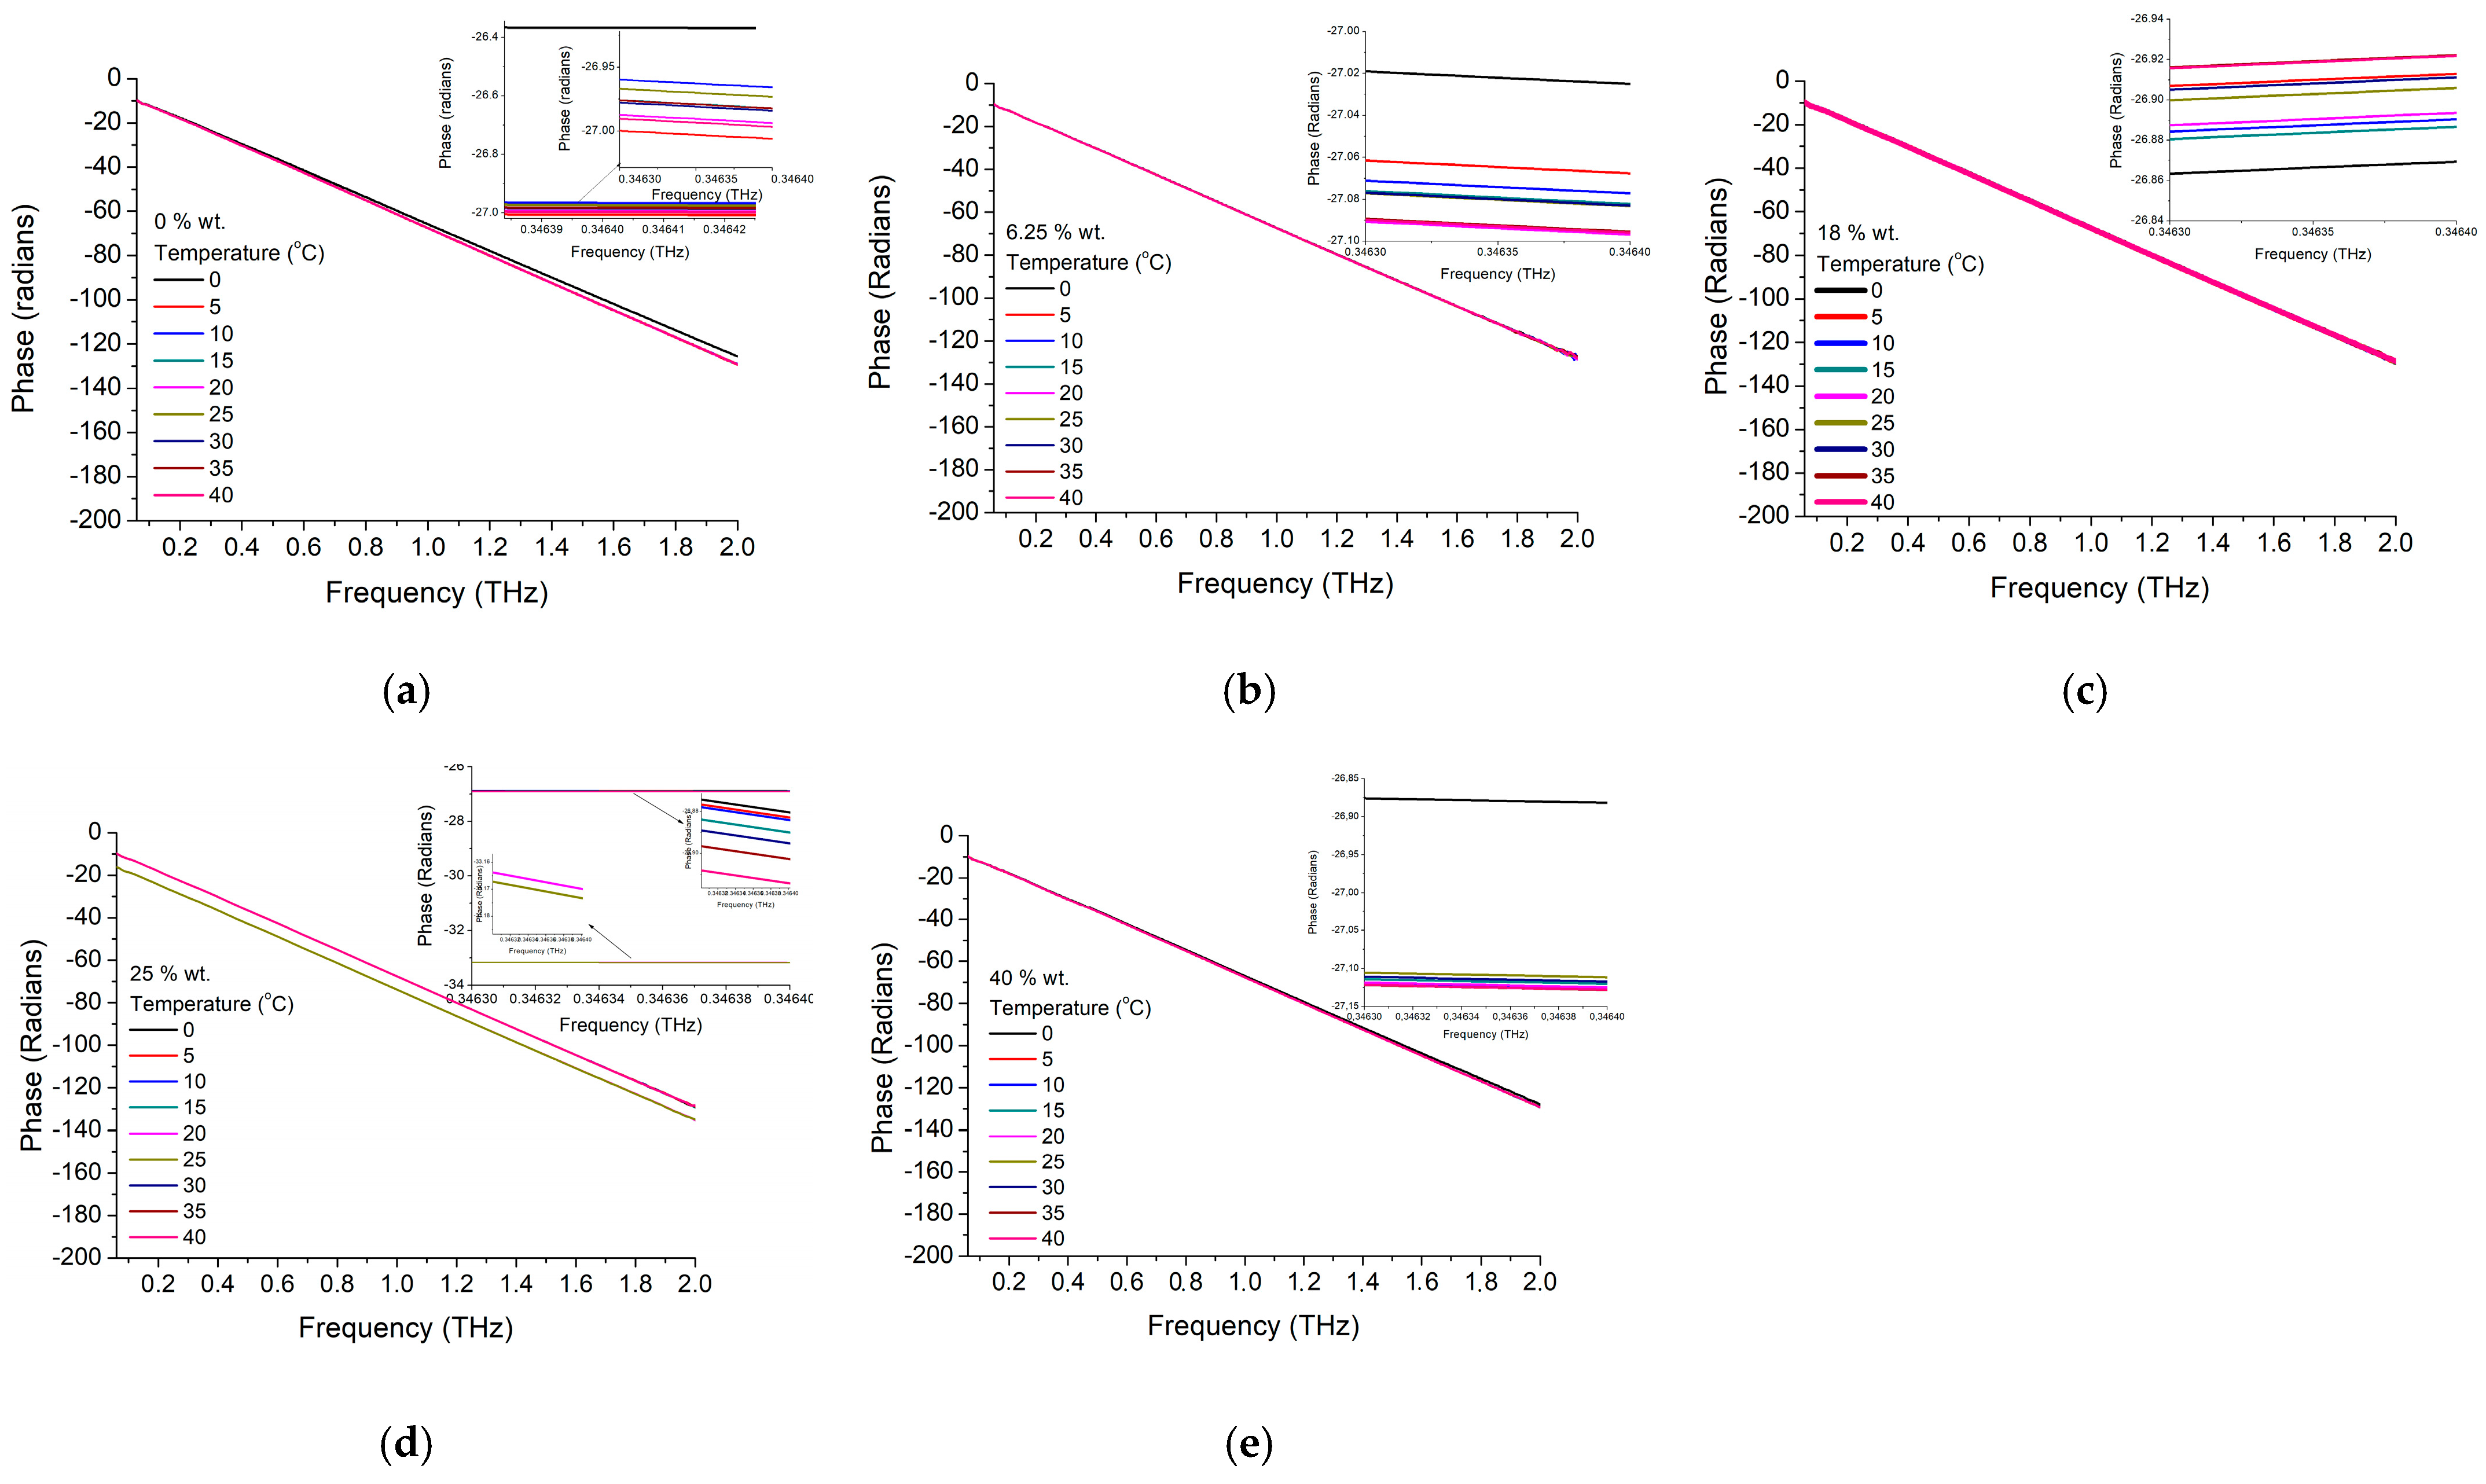
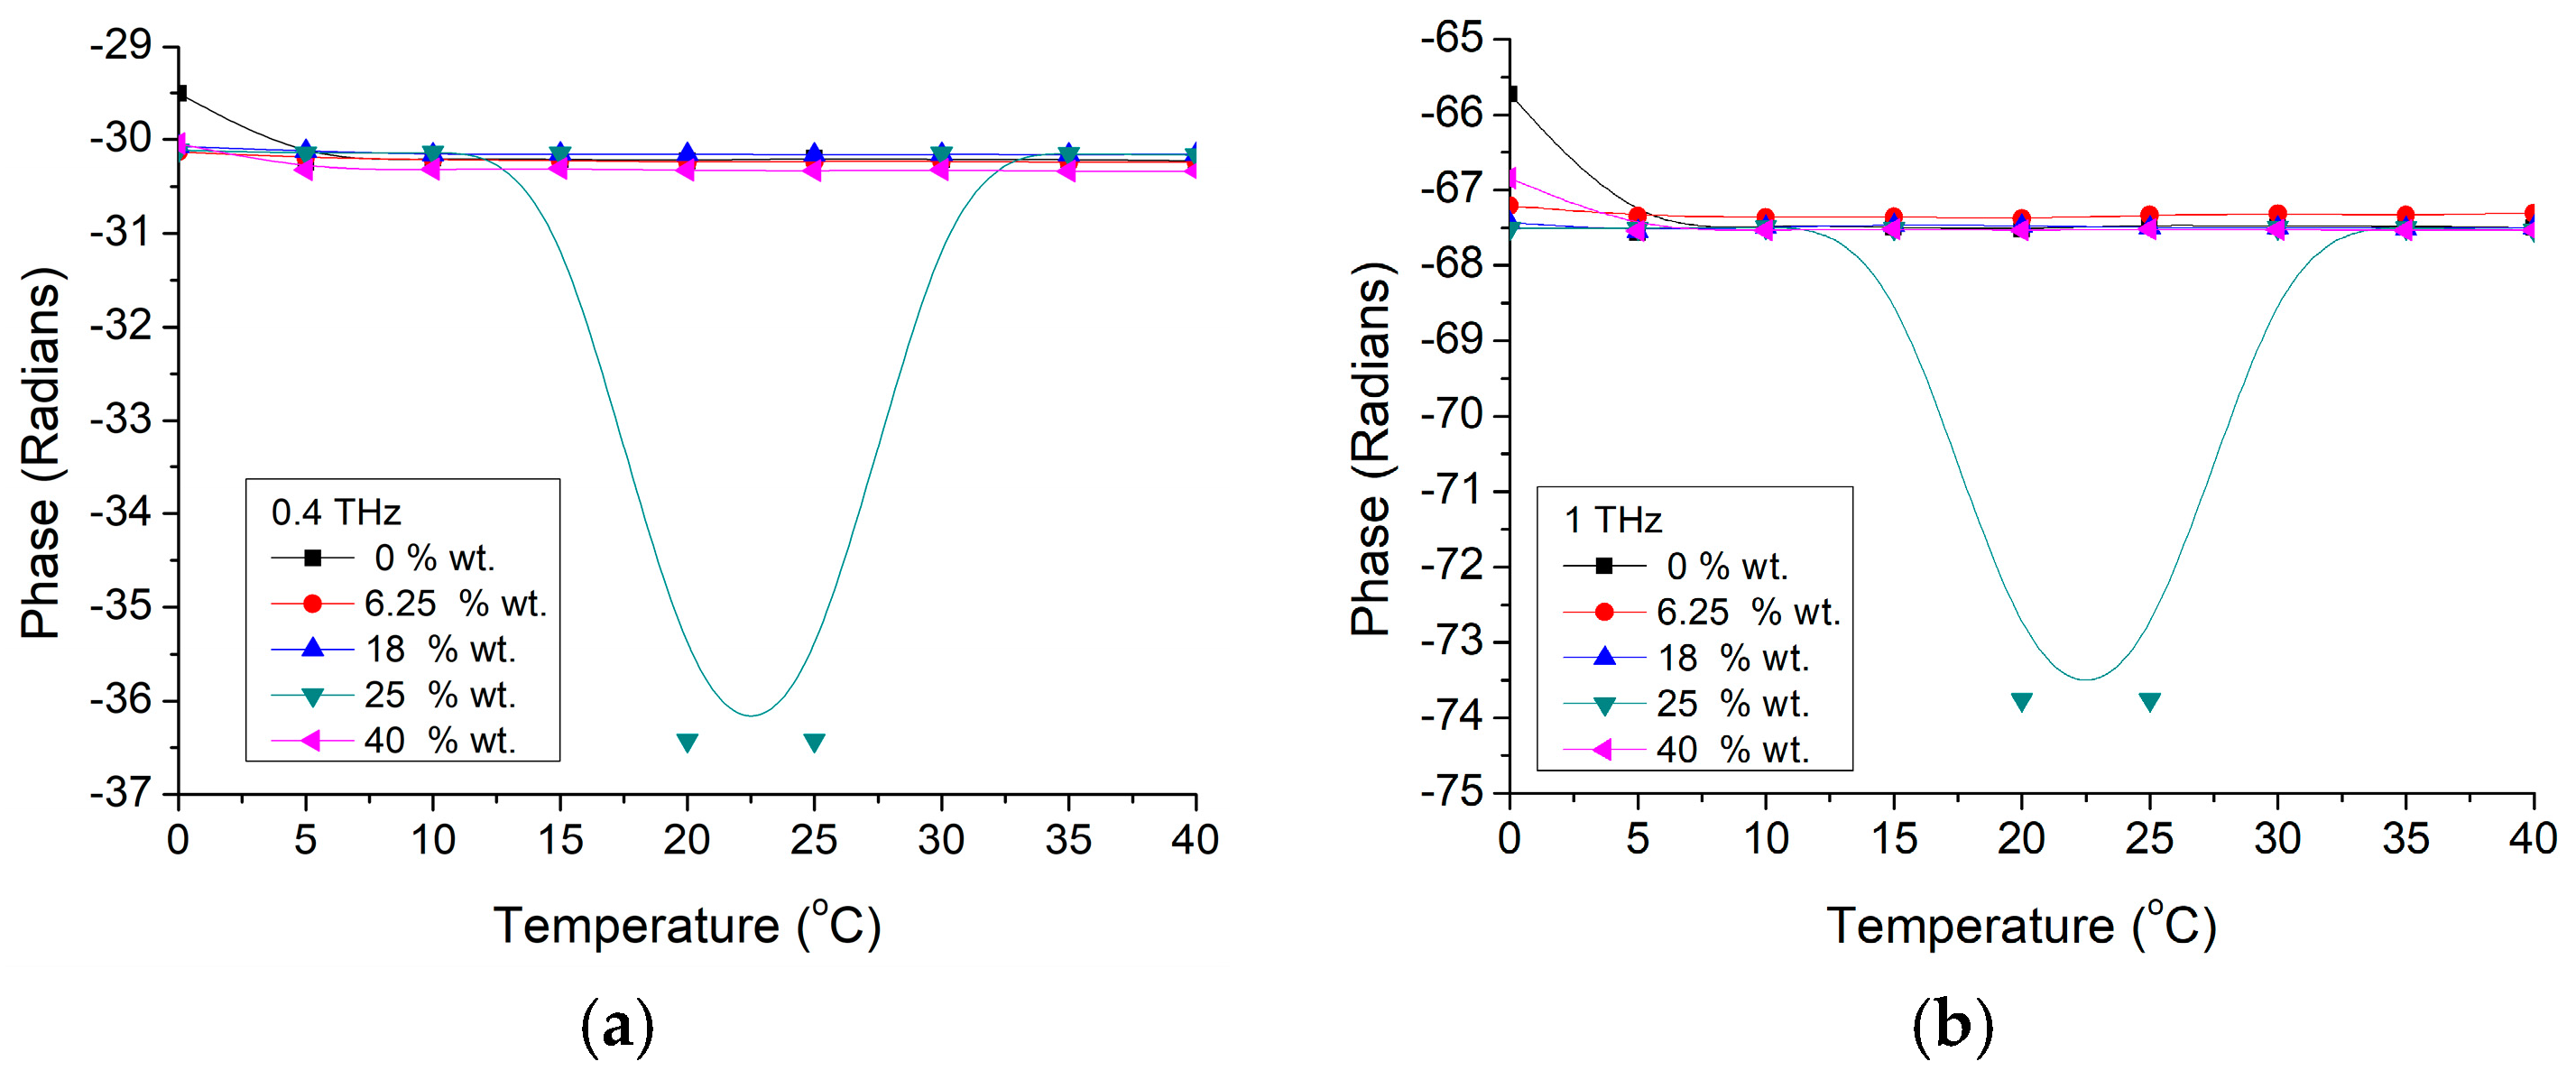
3.2.1. Gelatin Nanocomposite
3.2.2. Epoxy Nanocomposite
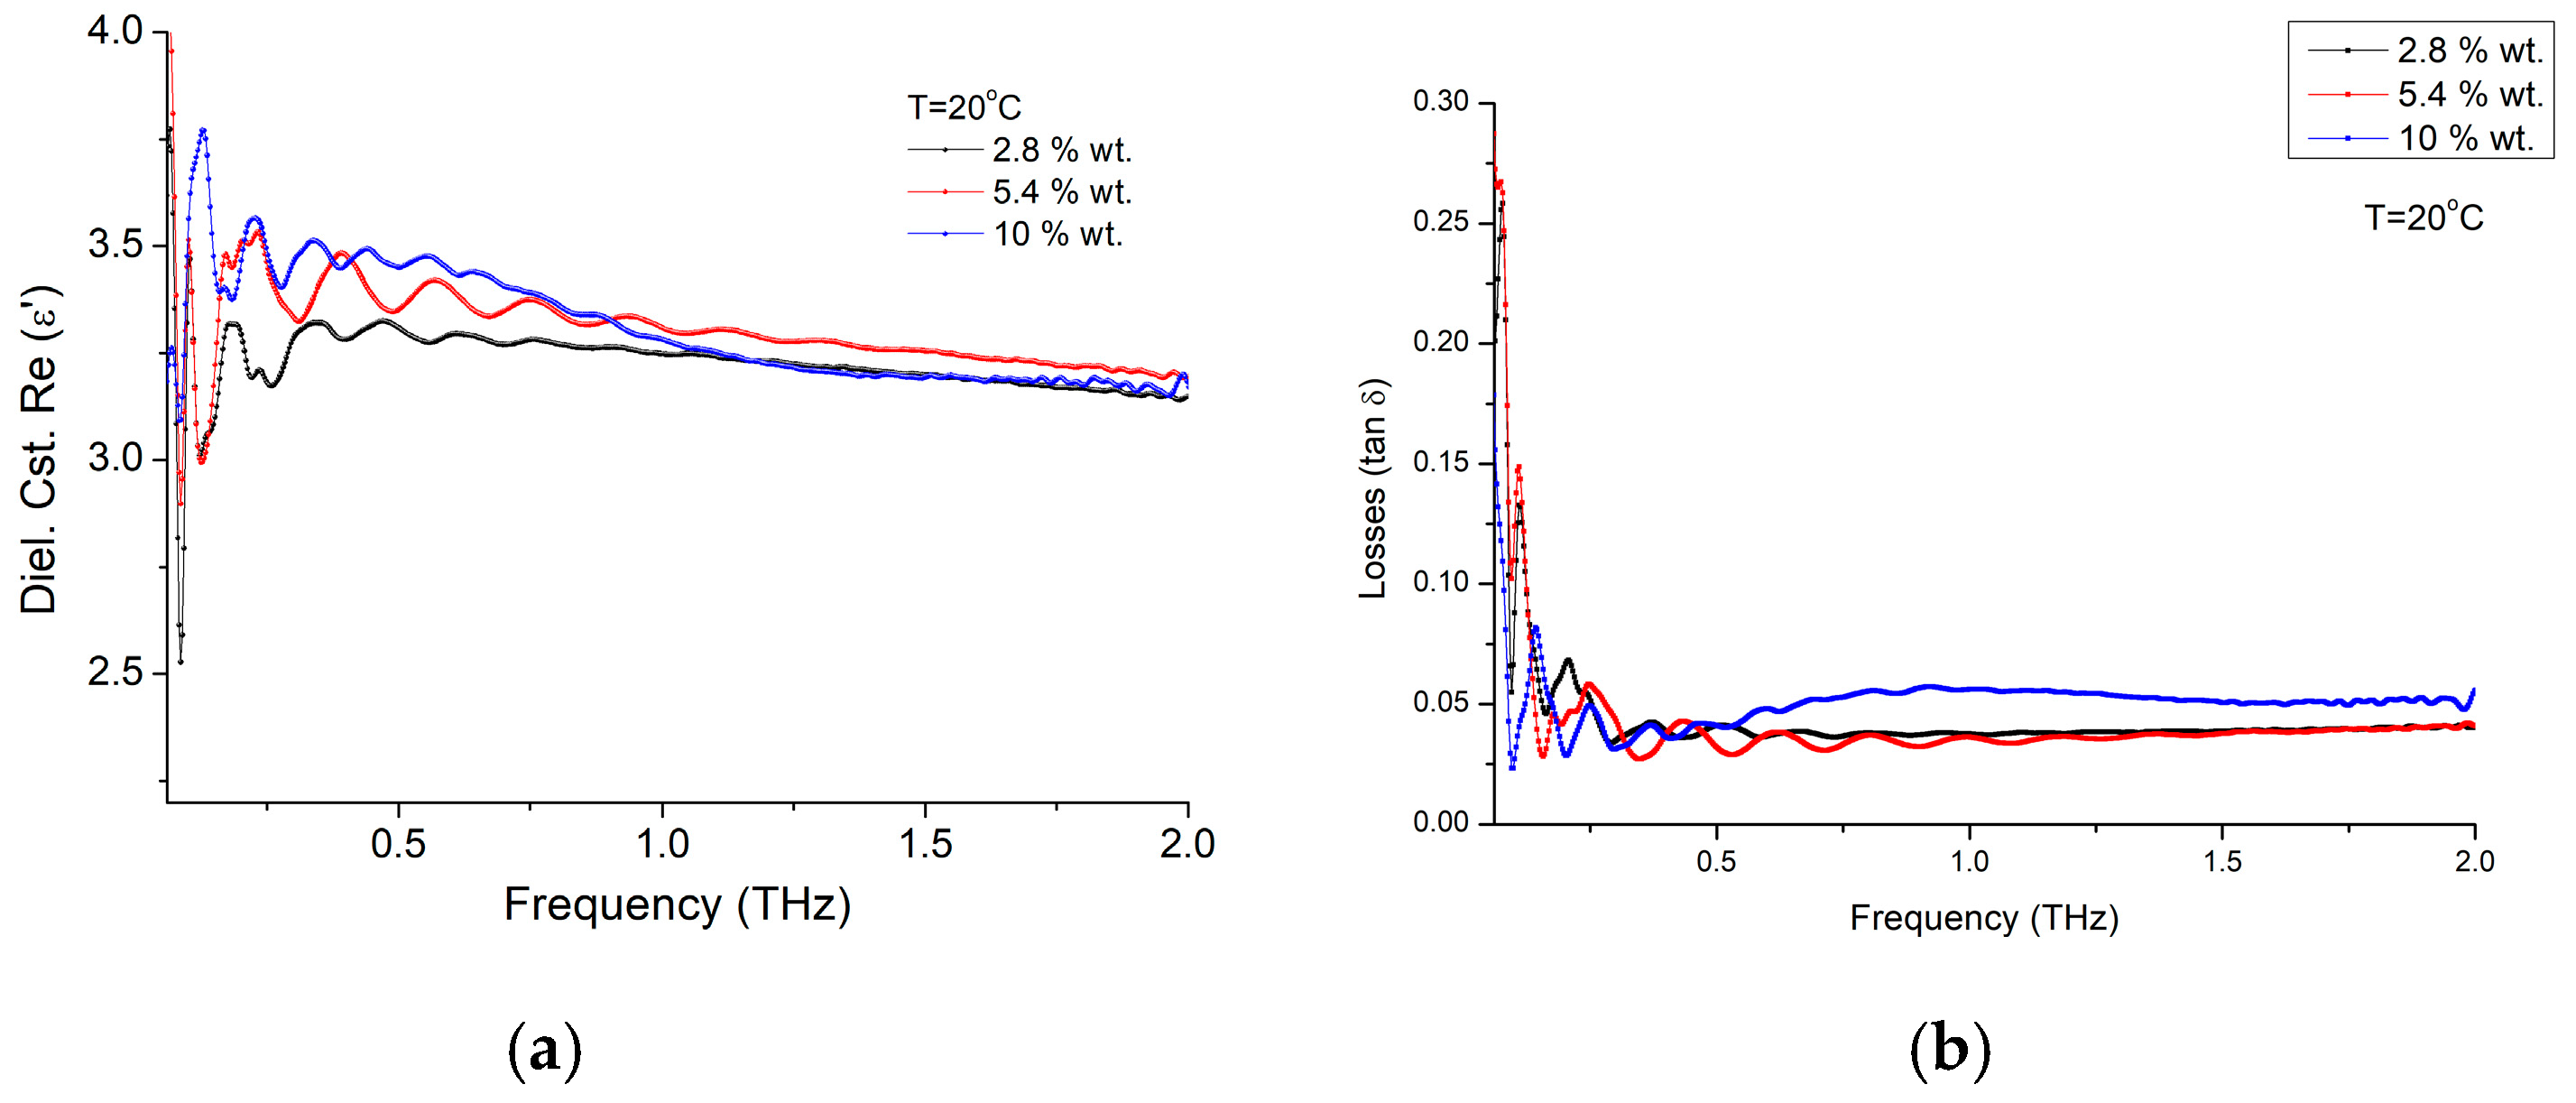
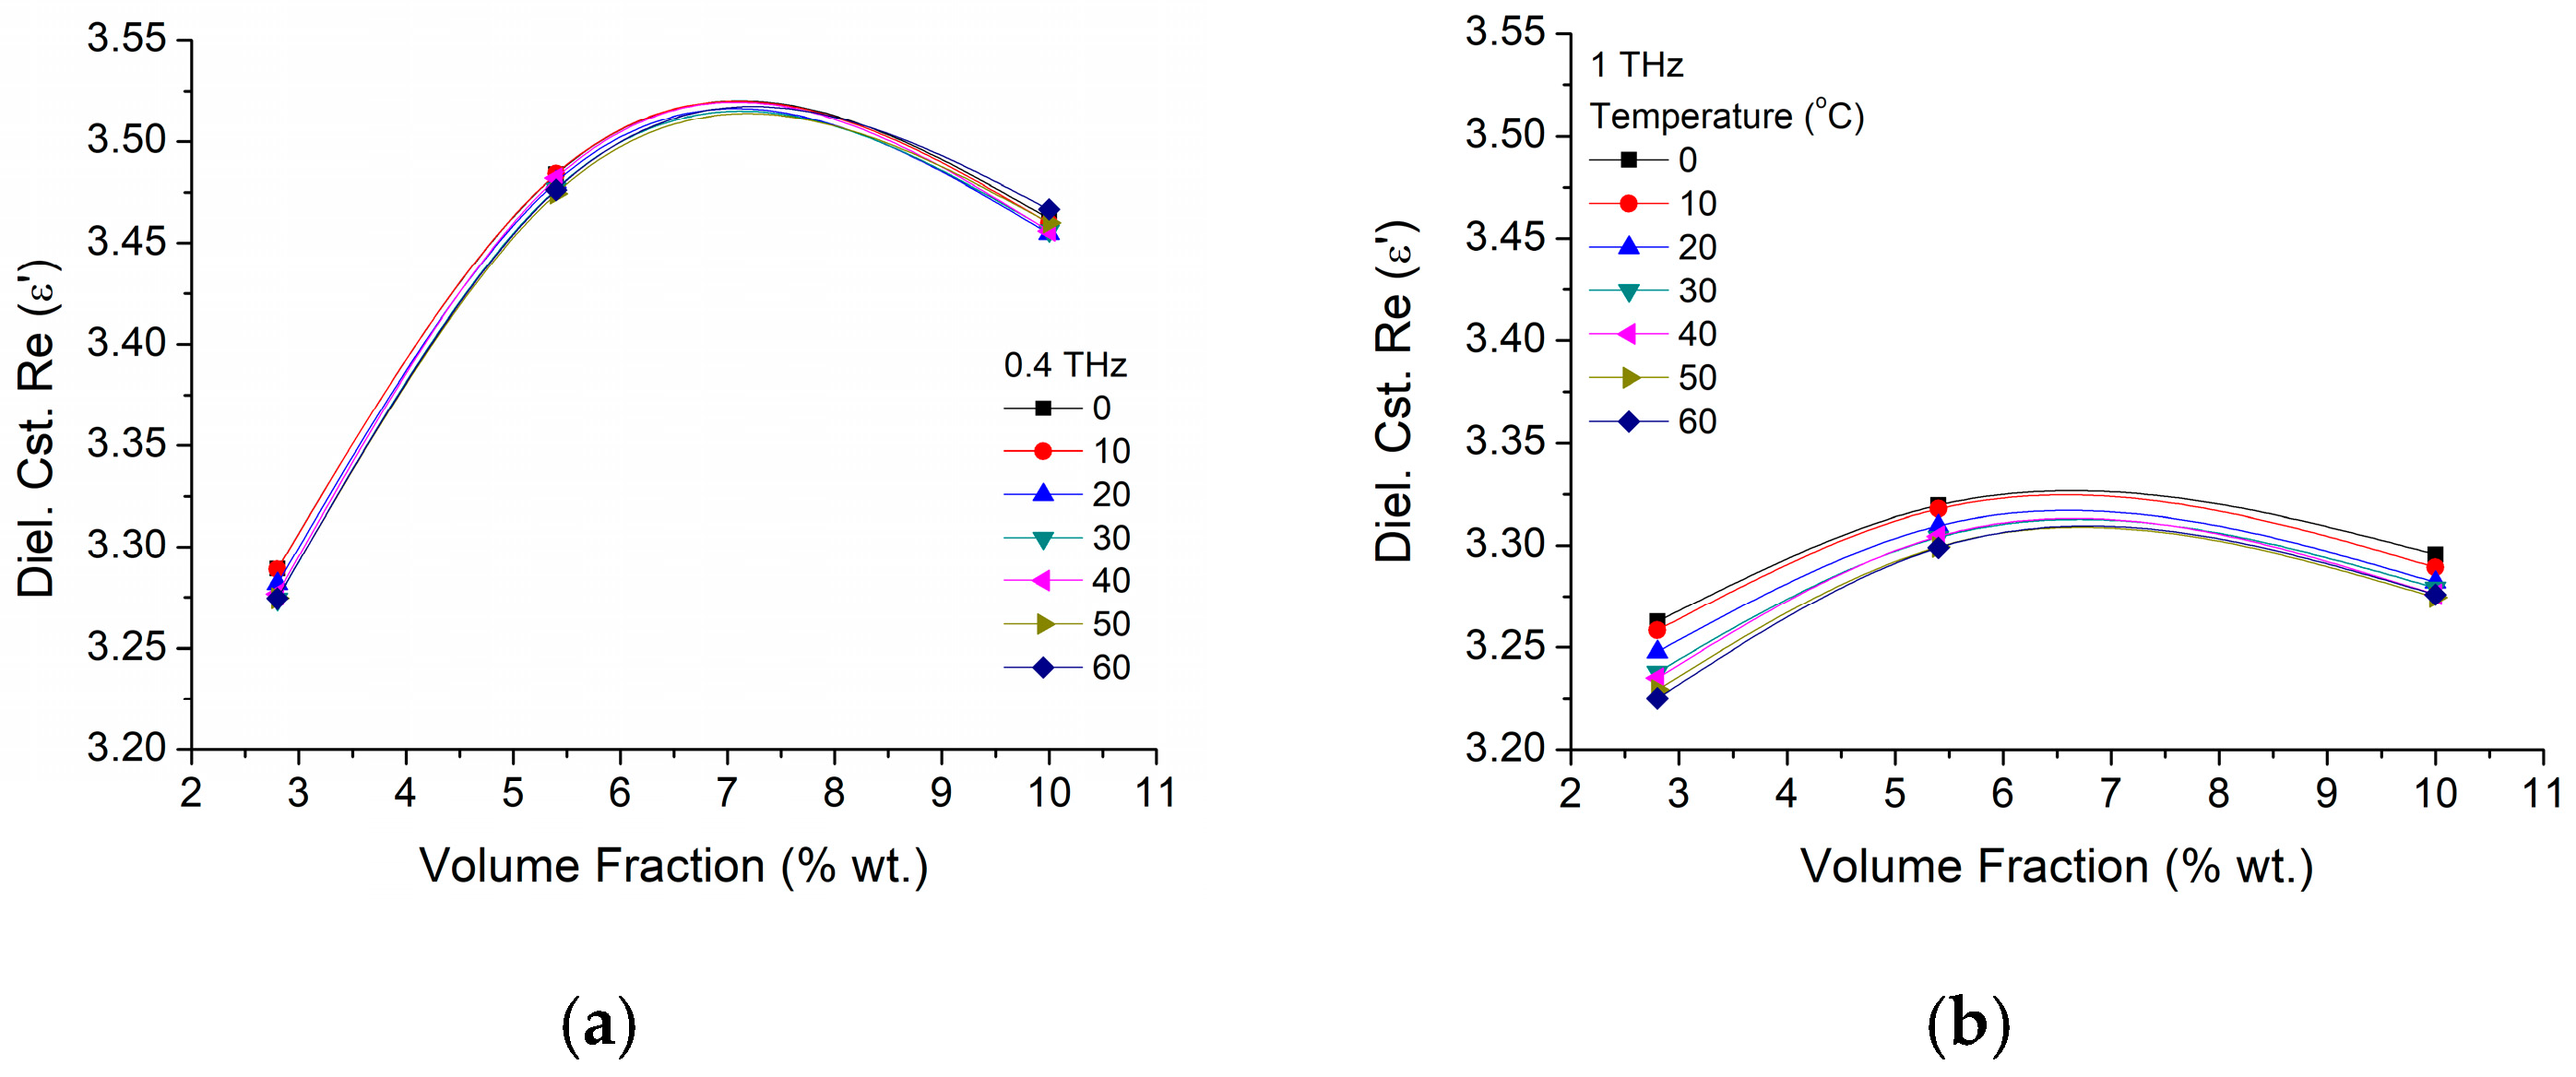
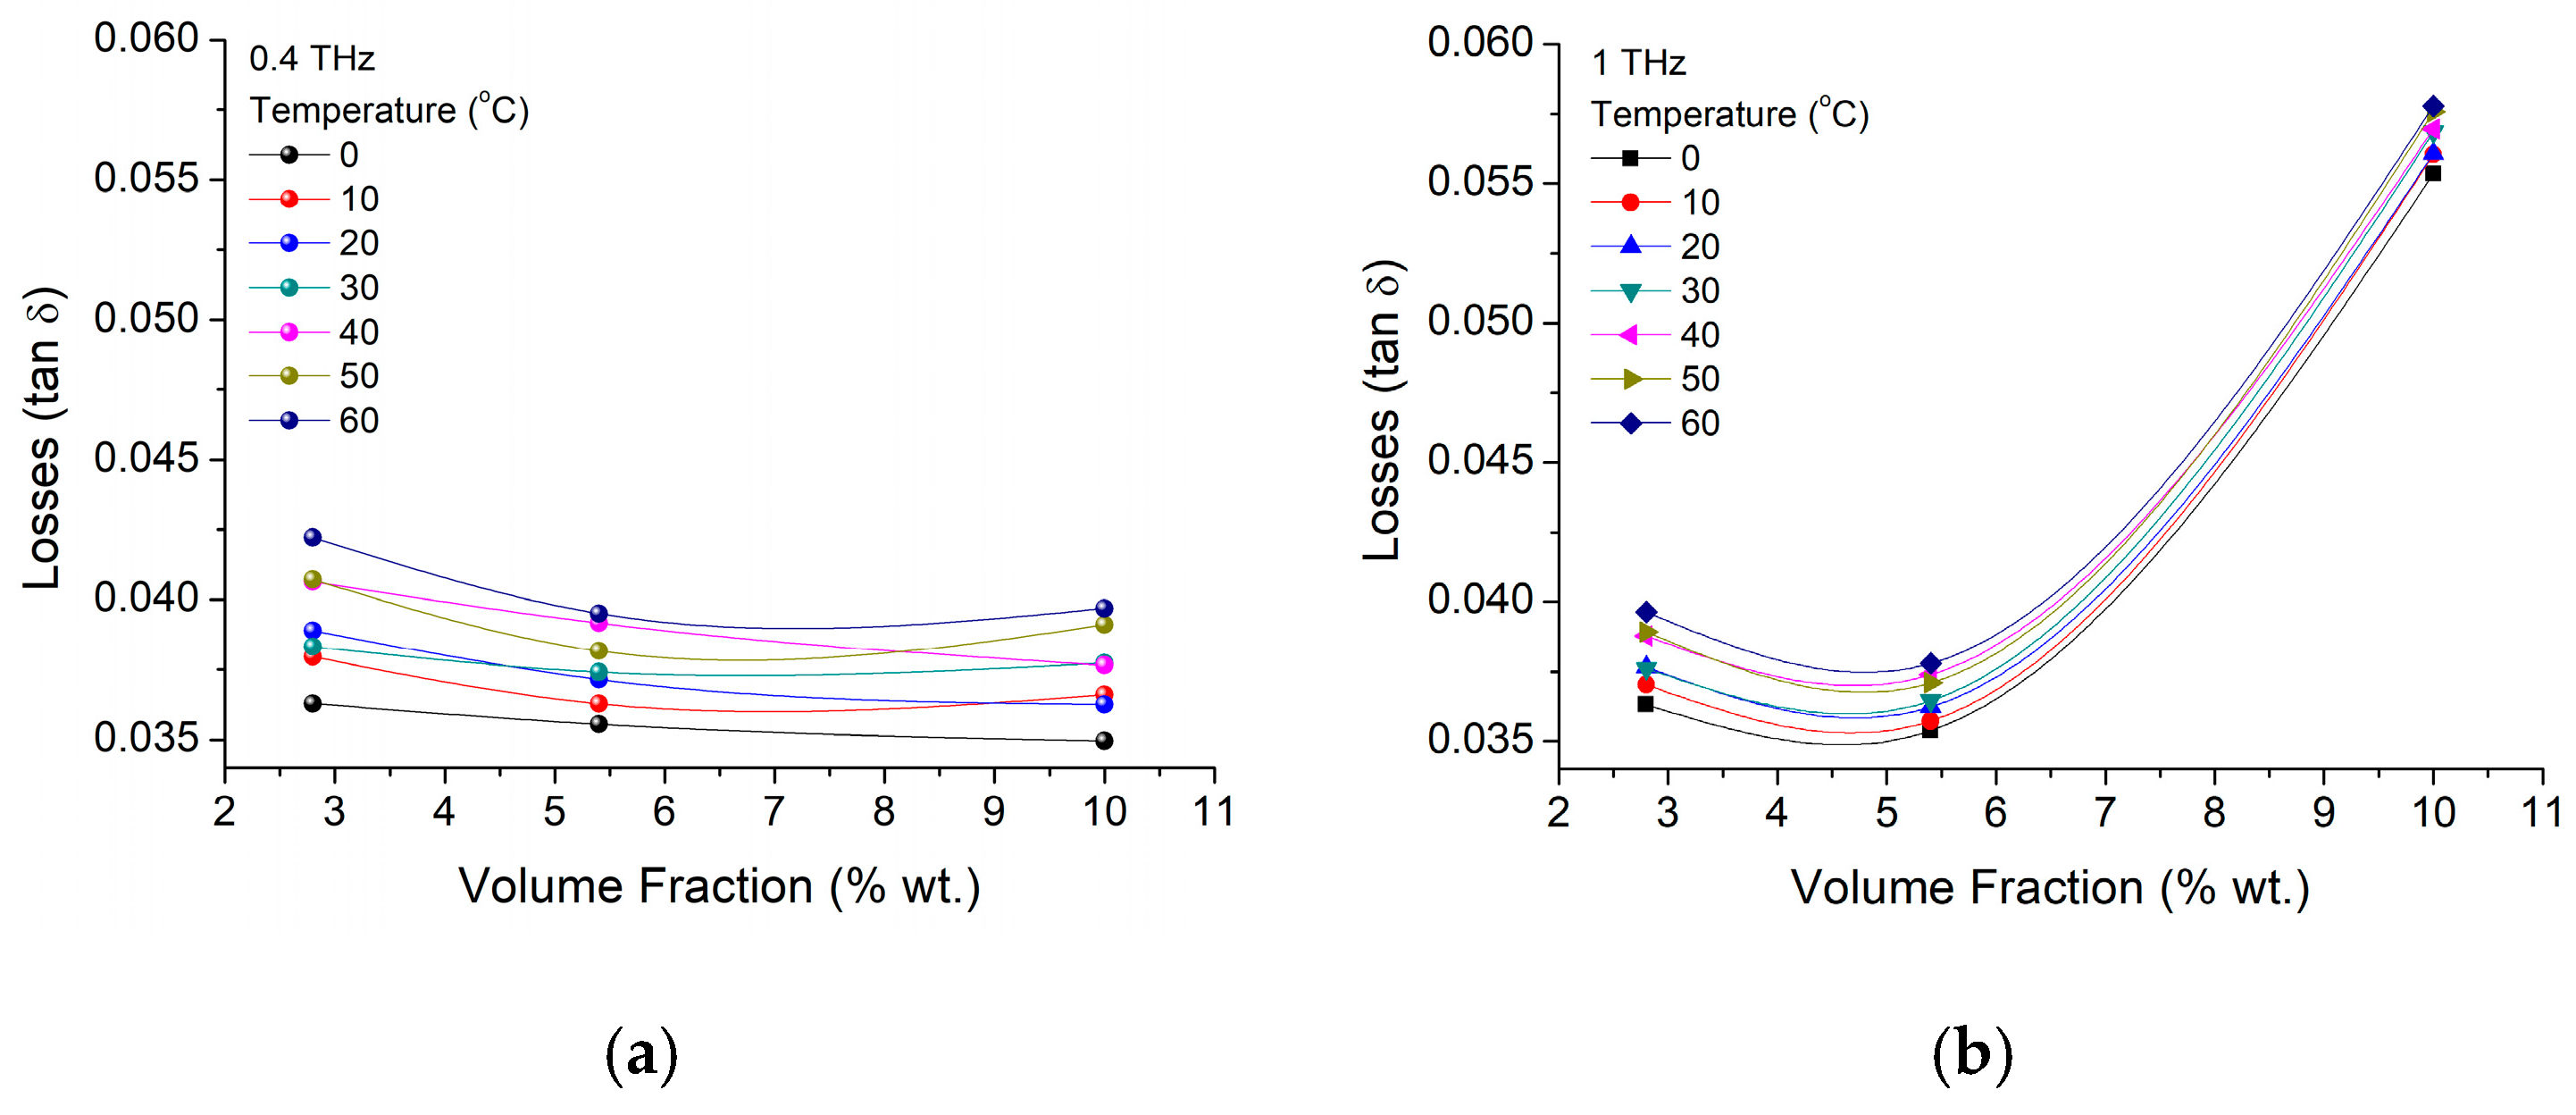
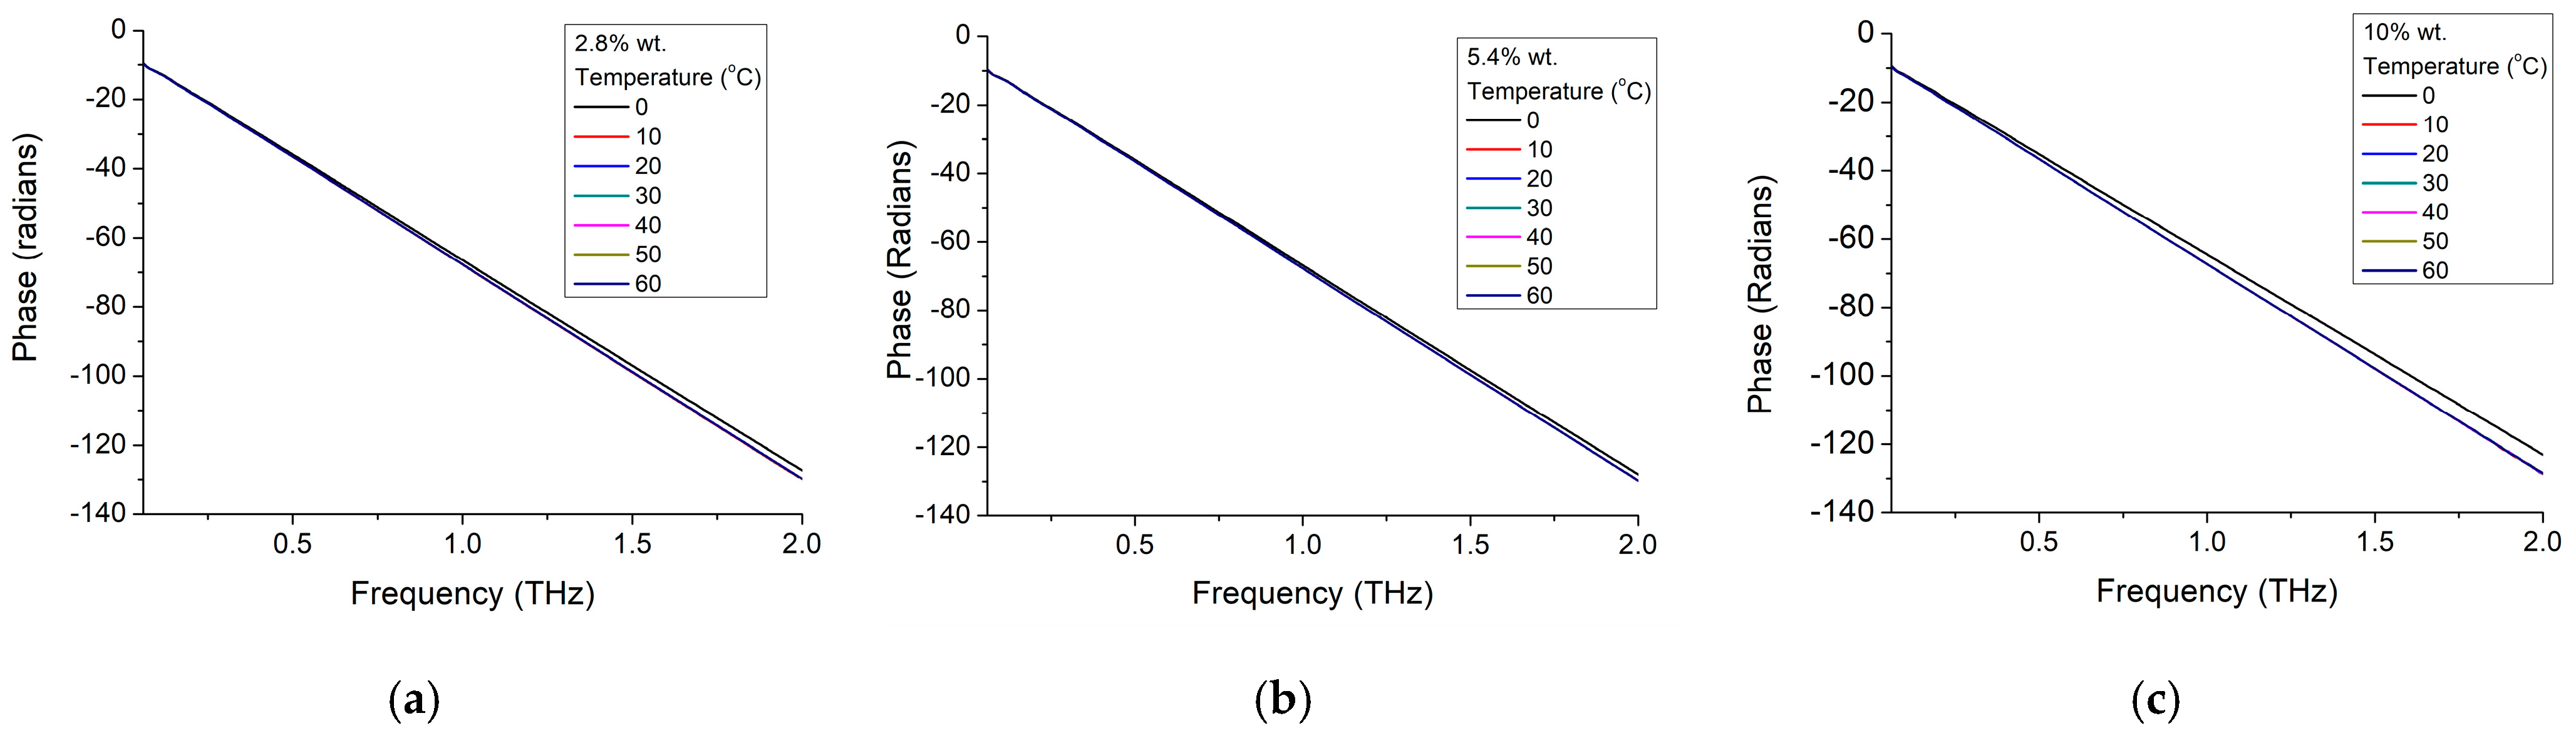
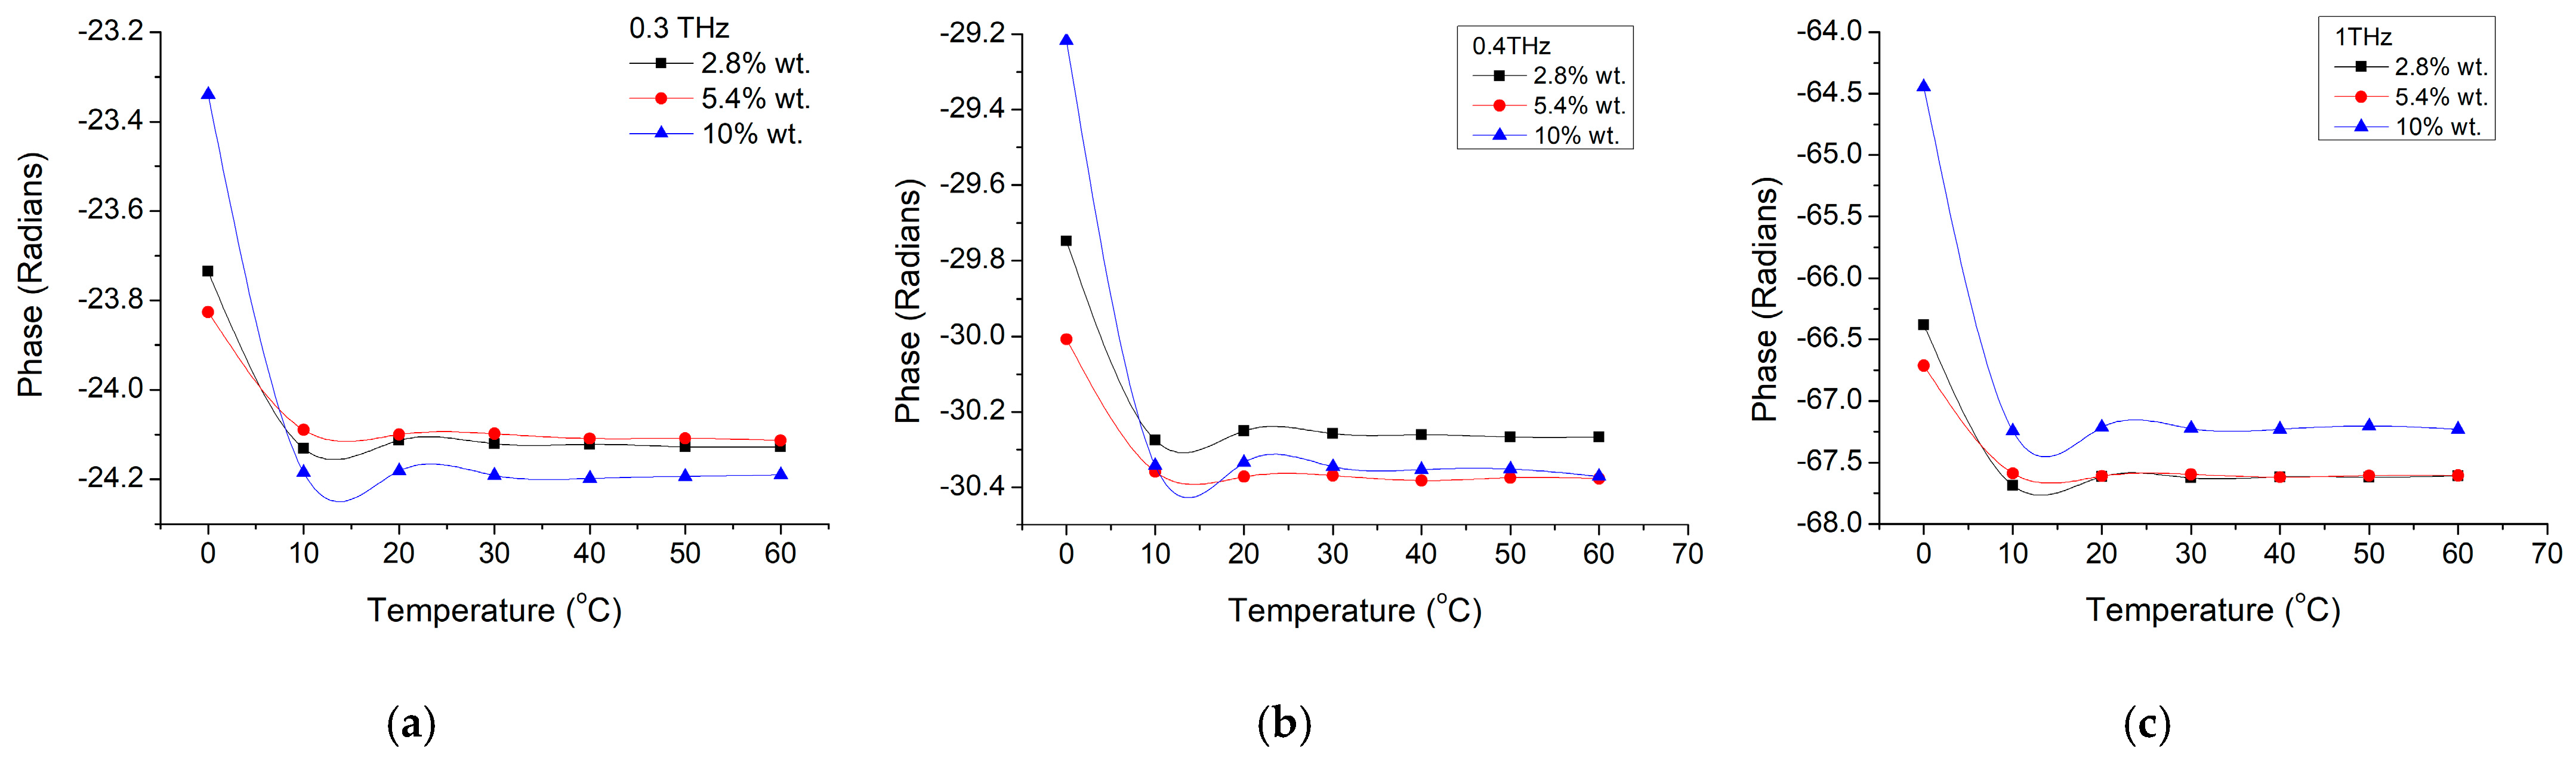
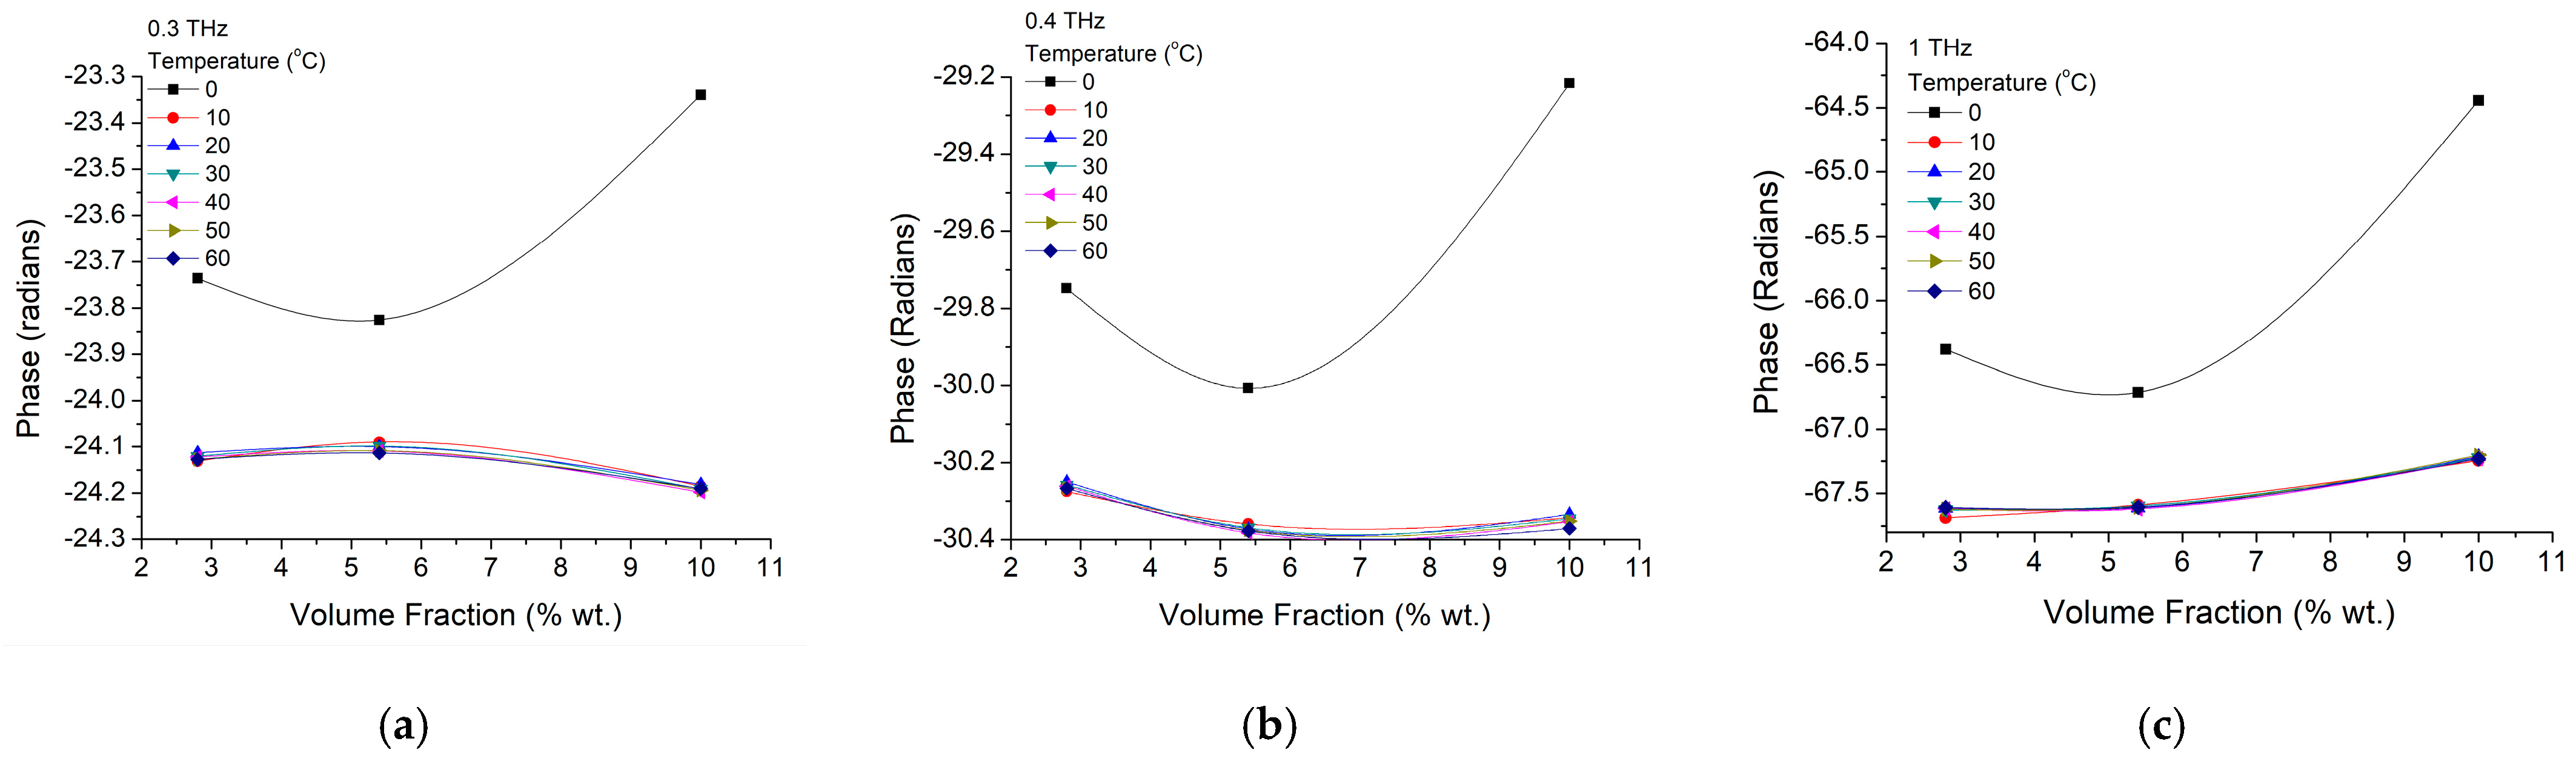
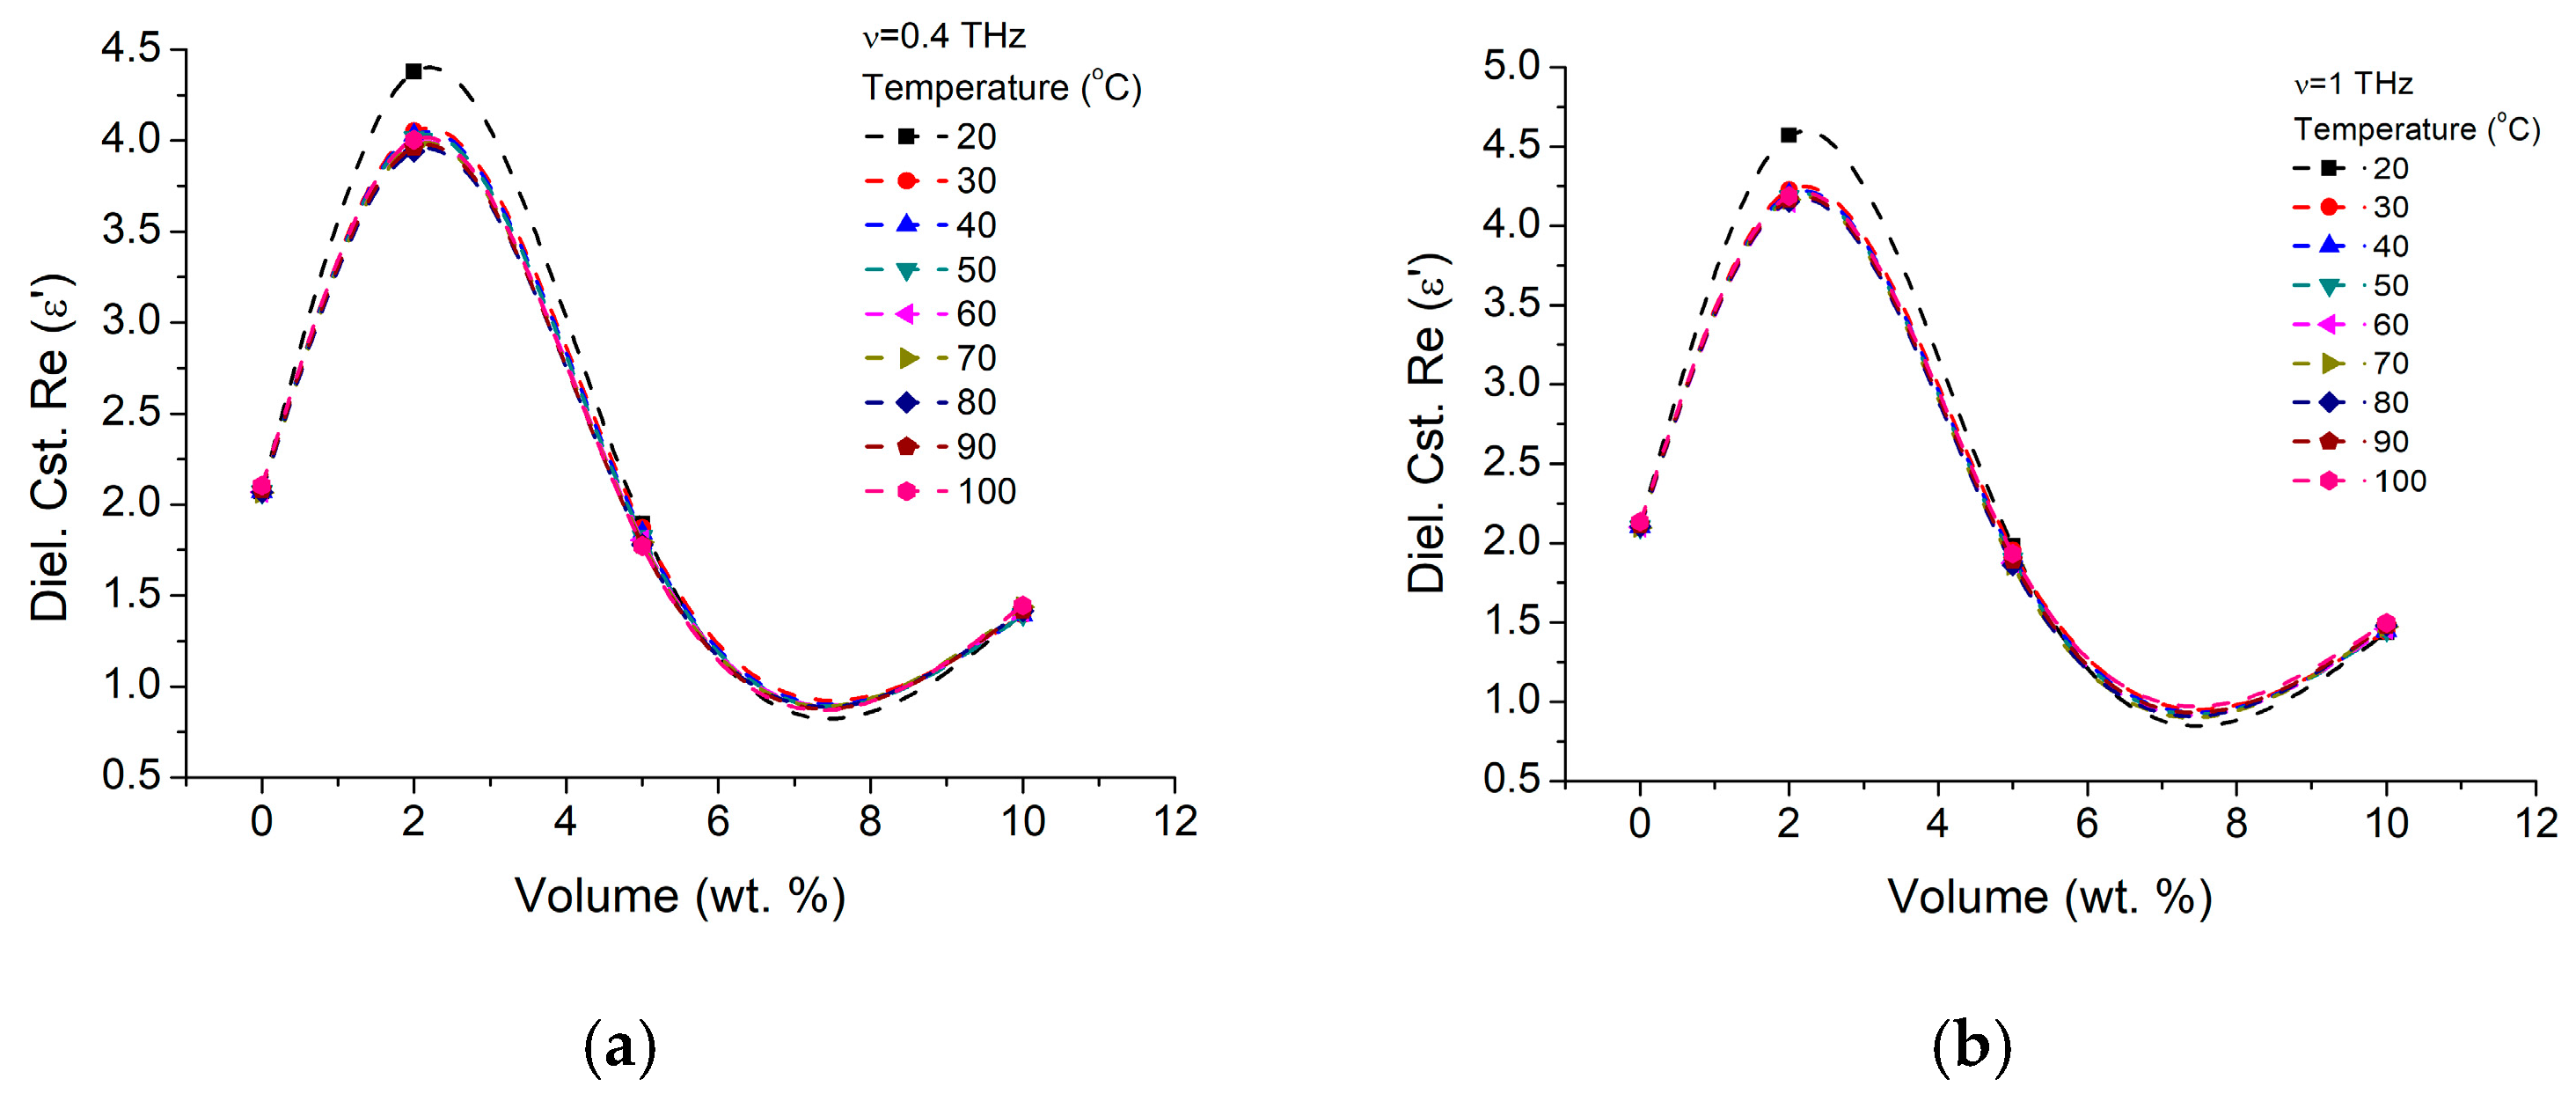
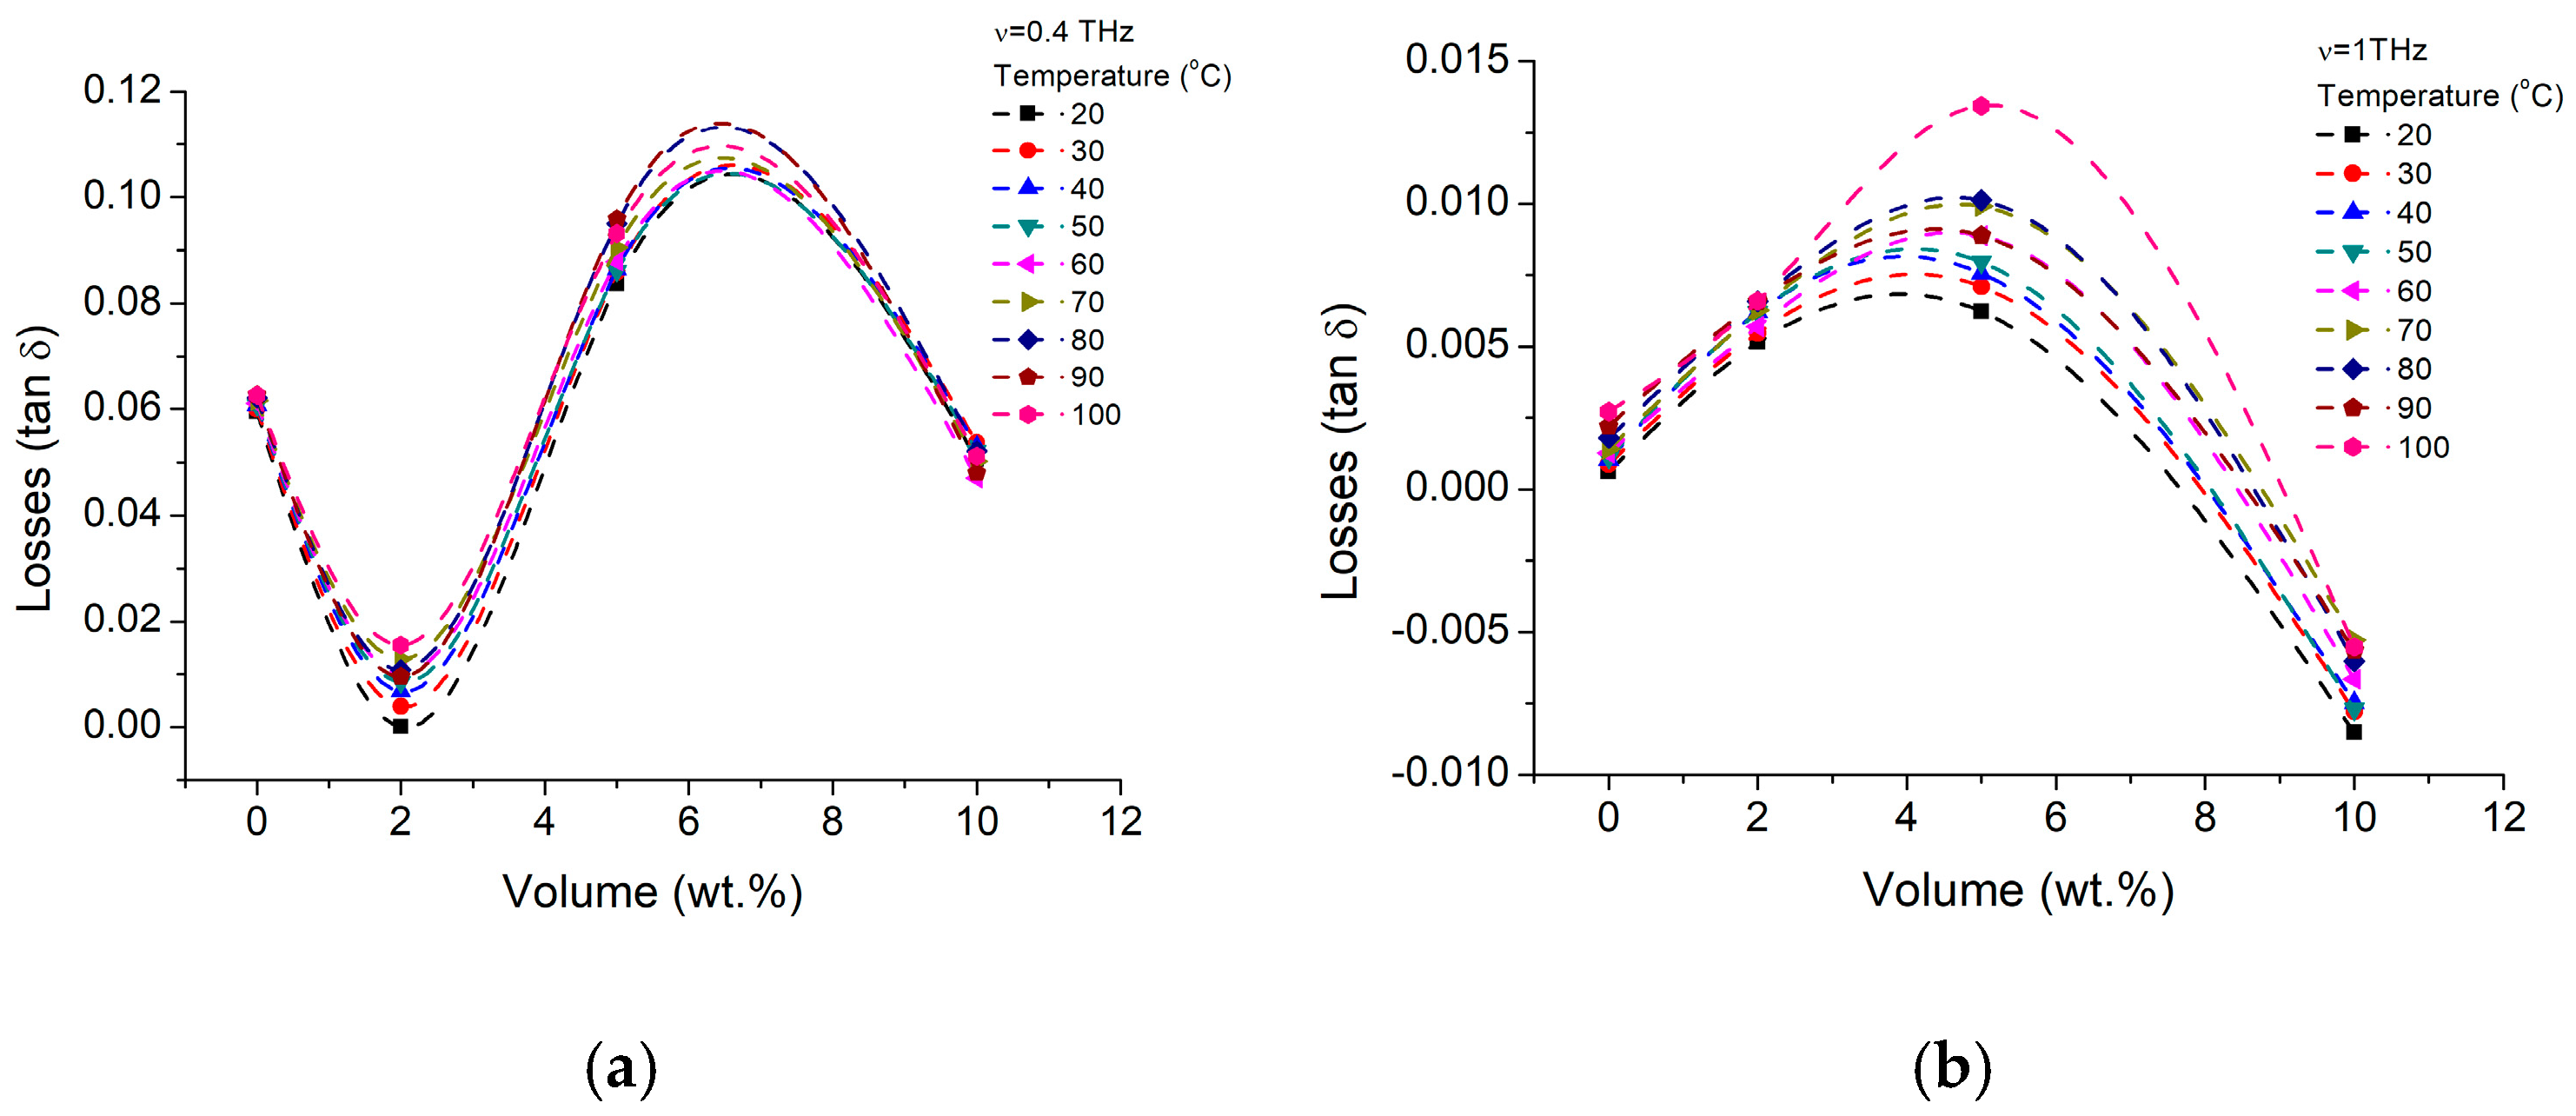
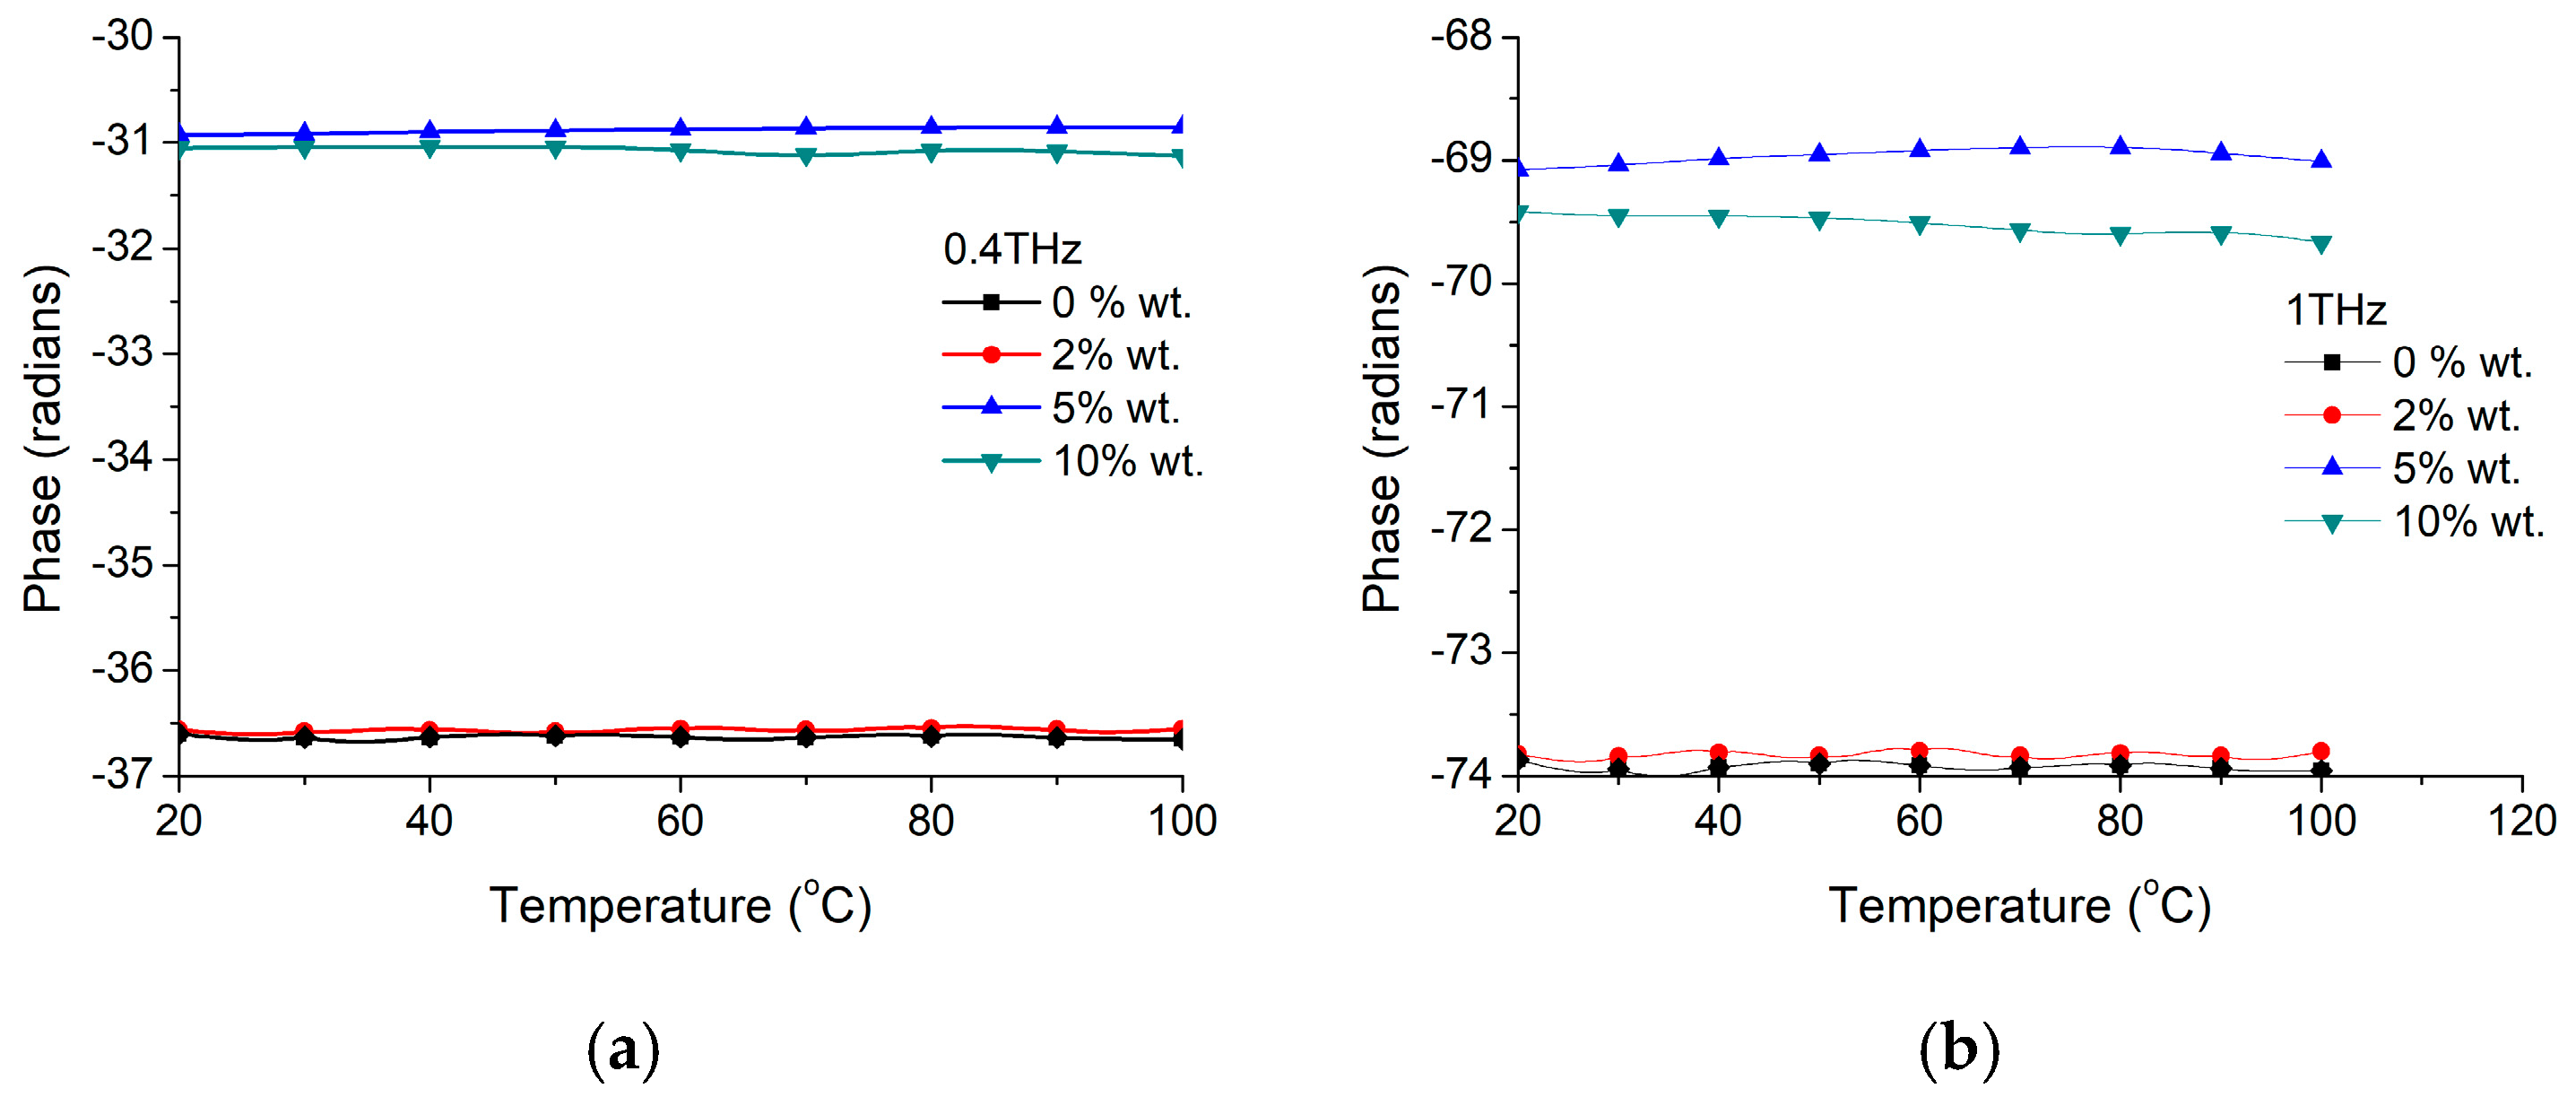
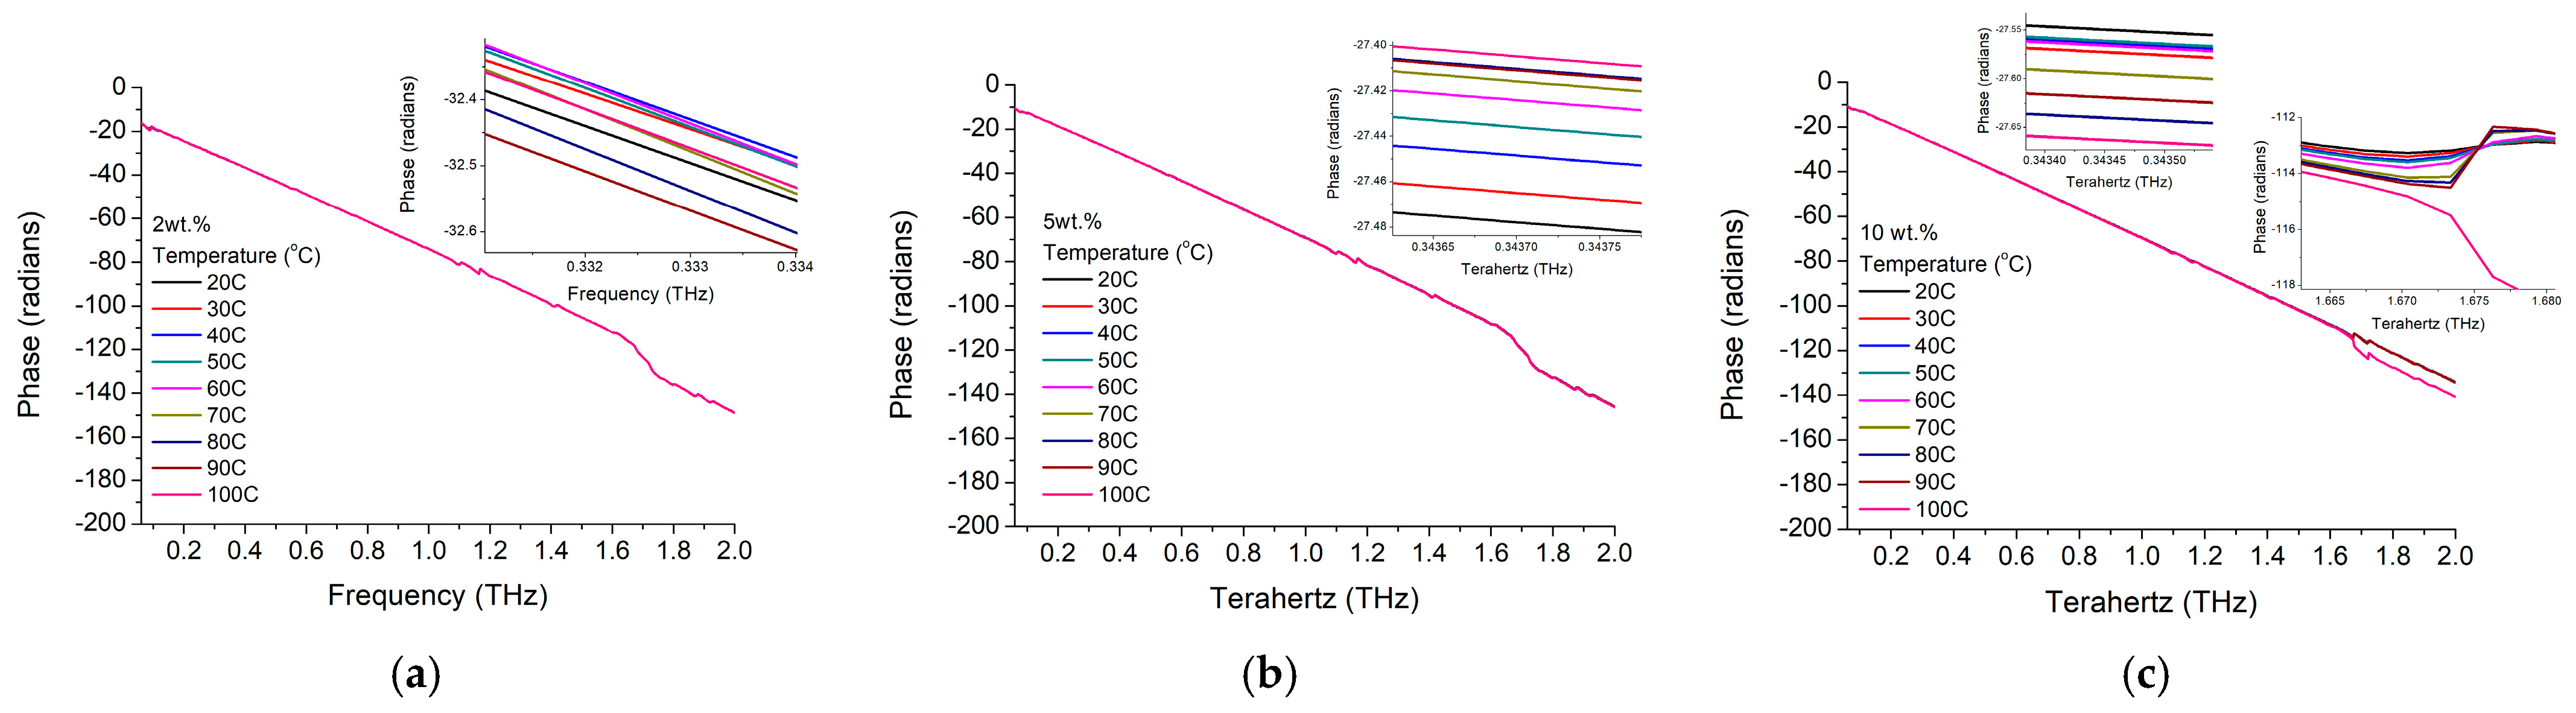
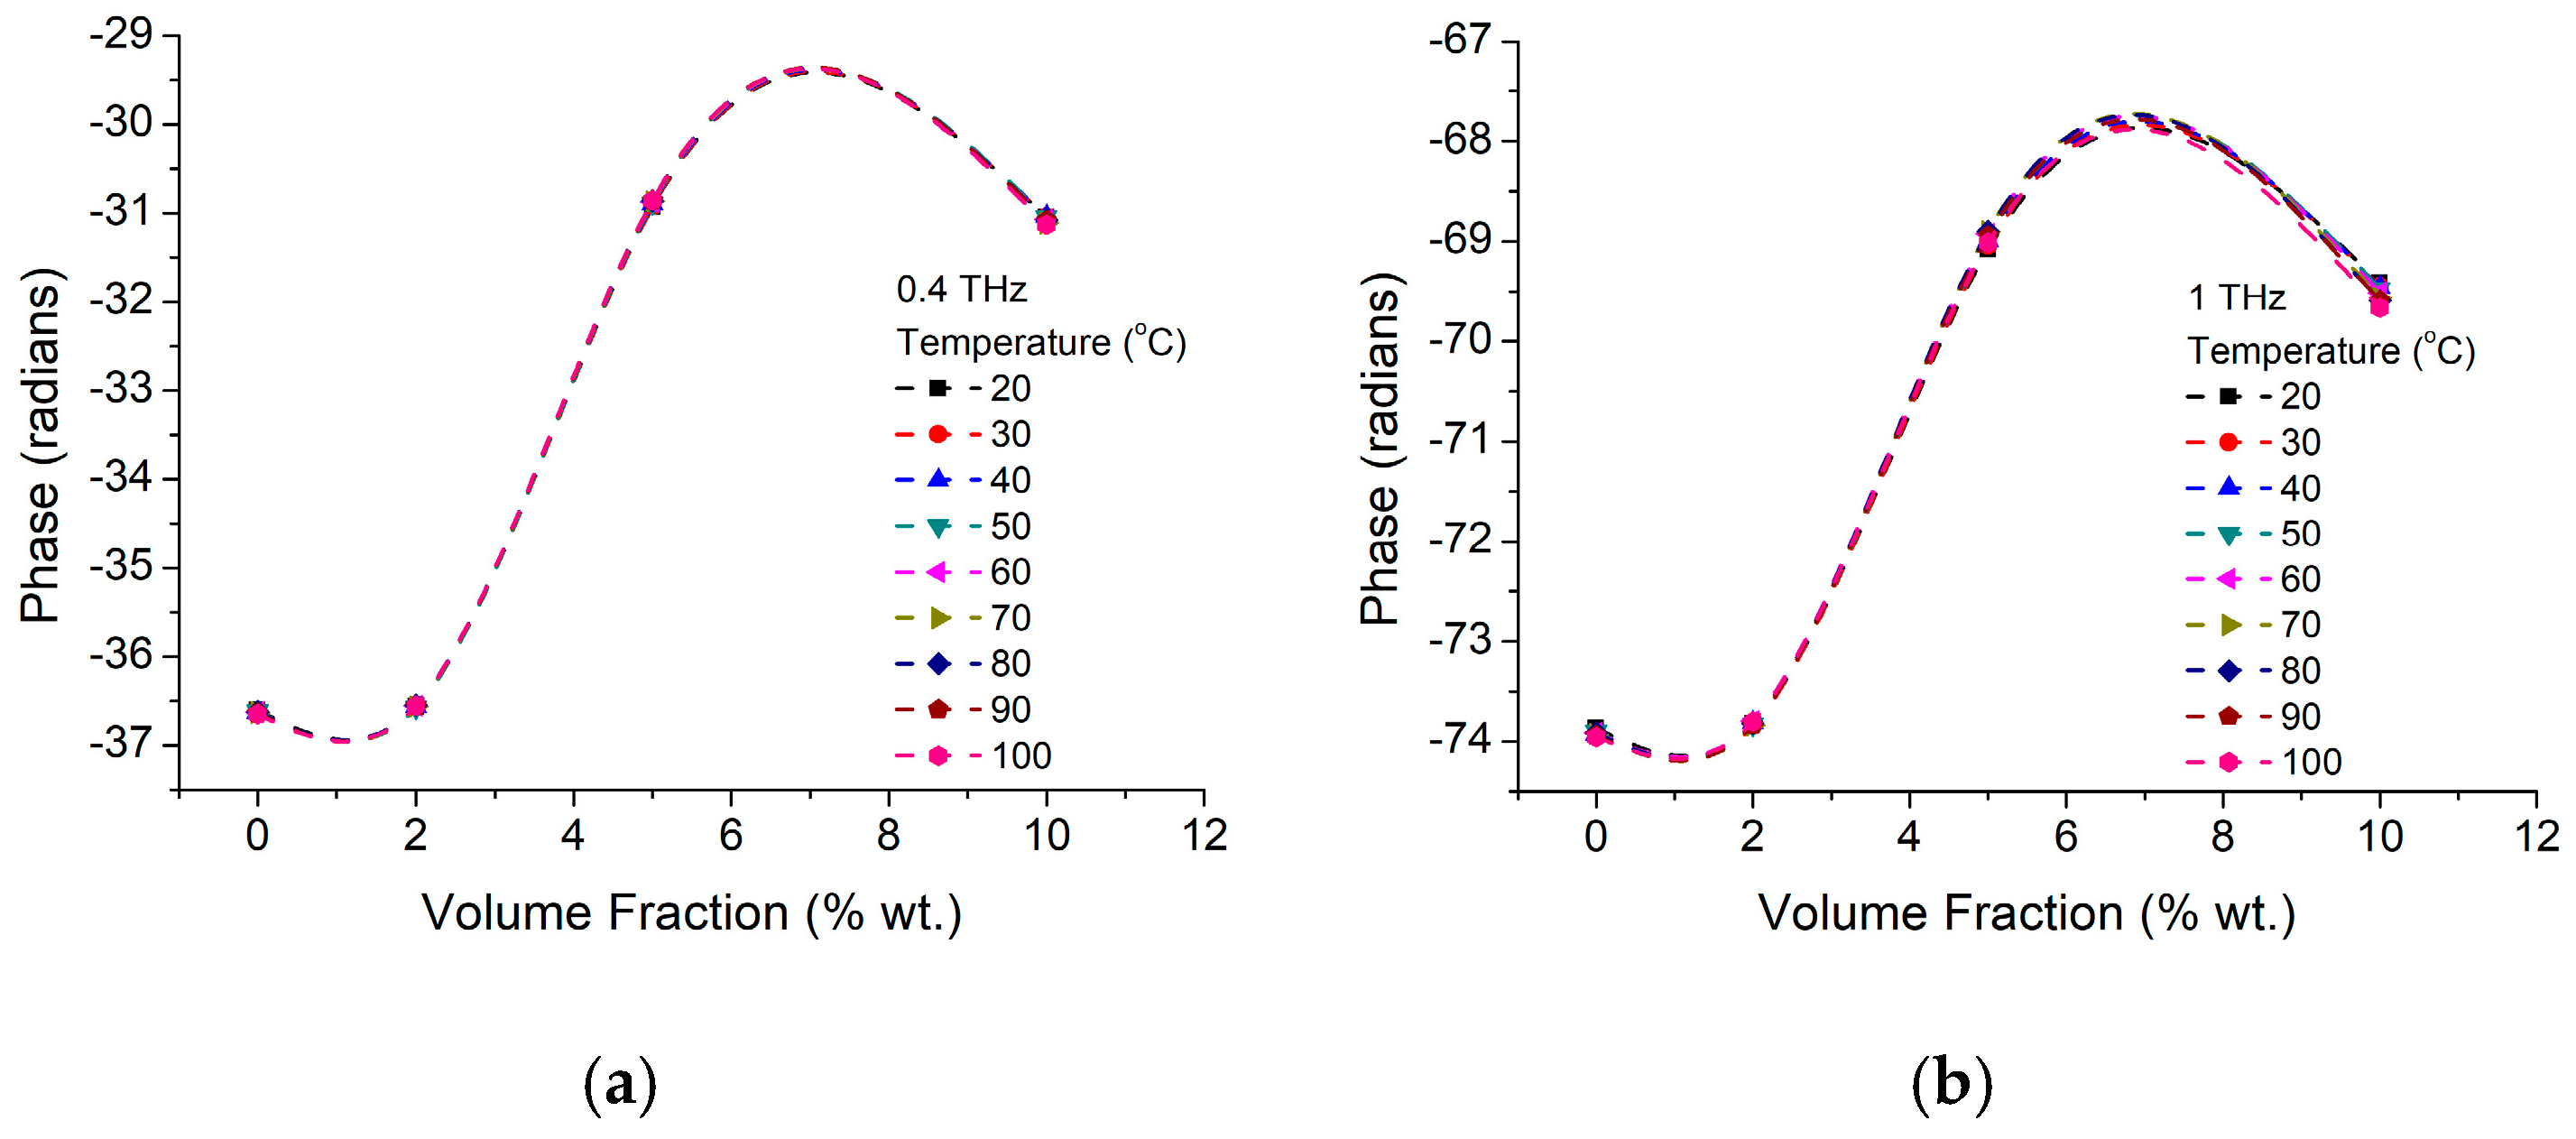
3.2.3. SBS Nanocomposite
4. Summary and Conclusions
Author Contributions
Funding
Institutional Review Board Statement
Informed Consent Statement
Data Availability Statement
Acknowledgments
Conflicts of Interest
References
- Kalinin, S.V.; Bonnell, D.A.; Alvarez, T.; Lei, X.; Hu, Z.; Ferris, J.H.; Zhang, Q.; Dunn, S. Atomic Polarization and Local Re-activity on Ferroelectric Surfaces: A New Route toward Complex Nanostructures. Nano Lett. 2002, 2, 589–593. [Google Scholar] [CrossRef]
- Mikolajick, T.; Slesazeck, S.; Mulaosmanovic, H.; Park, M.H.; Fichtner, S.; Lomenzo, P.D.; Hoffmann, M.; Schroeder, U. Next generation ferroelectric materials for semiconductor process integration and their applications. J. Appl. Phys. 2021, 129, 100901. [Google Scholar] [CrossRef]
- Park, B.H.; Kang, B.S.; Bu, S.D.; Noh, T.W.; Lee, J.; Jo, W. Lanthanum-substituted bismuth titanate for use in non-volatile memories. Nat. Cell Biol. 1999, 401, 682–684. [Google Scholar] [CrossRef]
- Martin, L.W.; Rappe, A.M. Thin-film ferroelectric materials and their applications. Nat. Rev. Mater. 2017, 2, 16087. [Google Scholar] [CrossRef]
- Johnson, C.J. Some dielectric and electro-optic properties of batio3 single crystals. Appl. Phys. Lett. 1965, 7, 221. [Google Scholar] [CrossRef]
- He, D.; Xing, X.; Qiao, L.; Volinsky, A.A. Temperature change effect on BaTiO3 single crystal surface potential around domain walls. Appl. Surf. Sci. 2014, 311, 837–841. [Google Scholar] [CrossRef]
- Yuan, G.; Chen, J.; Xia, H.; Liu, J.; Yin, J.; Liu, Z. Ferroelectric domain evolution with temperature in BaTiO3 film on (001) SrTiO3 substrate. Appl. Phys. Lett. 2013, 103, 62903. [Google Scholar] [CrossRef]
- He, D.; Tang, X.; Liu, Y.; Liu, J.; Du, W.; He, P.; Wang, H. Phase Transition Effect on Ferroelectric Domain Surface Charge Dynamics in BaTiO3 Single Crystal. Materials 2021, 14, 4463. [Google Scholar] [CrossRef] [PubMed]
- Pashkin, A. Terahertz Spectroscopy of Ferroelectrics and Related Materials. Ph.D. Thesis, Charles University, Prague, Czech Republic, 2004. [Google Scholar]
- Hao, Y.; Wang, X.; Bi, K.; Zhang, J.; Huang, Y.; Wu, L.; Zhao, P.; Xu, K.; Lei, M.; Li, L. Significantly enhanced energy storage performance promoted by ultimate sized ferroelectric BaTiO3 fillers in nanocomposite films. Nano Energy 2017, 31, 49. [Google Scholar] [CrossRef]
- Makino, K.; Kato, K.; Saito, Y.; Fons, P.; Kolobov, A.V.; Tominaga, J.; Nakano, T.; Nakajima, M. Terahertz spectroscopic characterization of Ge2Sb2Te5 phase change materials for photonics applications. J. Mater. Chem. C 2019, 7, 8209–8215. [Google Scholar] [CrossRef]
- Caruntu, D.; Kavey, B.; Paul, S.; Bas, A.; Rotaru, A.; Caruntu, G. Dielectric properties of solution-processed BaTiO3–styrene butadiene styrene nanocomposite films. CrystEngComm 2020, 22, 1261–1272. [Google Scholar] [CrossRef]
- Ciomaga, C.; Horchidan, N.; Padurariu, L.; Stirbu, R.; Tiron, V.; Tufescu, F.; Topala, I.; Condurache, O.; Botea, M.; Pintilie, I.; et al. BaTiO3 nanocubes-Gelatin composites for piezoelectric harvesting: Modeling and experimental study. Ceram. Int. 2022, 48, 25880–25893. [Google Scholar] [CrossRef]
- Wan, F.; Han, J.; Zhu, Z. Dielectric response in ferroelectric BaTiO3. Phys. Lett. A 2008, 372, 2137–2140. [Google Scholar] [CrossRef]
- Karvounis, A.; Timpu, F.; Vogler-Neuling, V.V.; Savo, R.; Grang, R. Barium Titanate Nanostructures and Thin Films for Photonics. Adv. Opt. Mater. 2020, 8, 2001249. [Google Scholar] [CrossRef]
- Lian, Z.; Chen, D.; Li, S. Investigation on the Correlation between Dispersion Characteristics at Terahertz Range and Dielectric Permittivity at Low Frequency of Epoxy Resin Nanocomposite. Polymers 2022, 14, 827. [Google Scholar] [CrossRef] [PubMed]


| Sample | ε′ | ε″ |
|---|---|---|
| BTO pellet 900 μm thickness | ||
| 100% | 9–11.5 (0.06–1 THz), 9.45 (1 THz) | 0.5–2 (0.06–1 THz), 0.99 (1 THz) |
| BTO—SBS | ||
| 0% | 1–2.5 (0.06–2 THz), 2.1 (1 THz) | 0.001–0.6 (0.06–2 THz), 0.007 (2 THz) |
| 2% 10 nm | 1.7–5.3 (0.06–2 THz), 4.1–4.5 (2 THz) | 0.1–1.6 (0.06–2 THz), 0.07 (2 THz) |
| 2% 20 nm | 0.8–2.7 (0.06–2 THz), 2 (2 THz) | 0.4–0.5 (0.06–2 THz), 0.025 (2 THz) |
| 5% 10 nm | 0.3–7 (0.06–0.1 THz), 1.96 (2 THz) | 0.3–5.5 (0.06–0.1 THz), 0.3 (0.1–2 THz) |
| 5% 20 nm | 0.2–6.5 (0.06–0.1 THz), 1.95 (2 THz) | 0.1–2.4 (0.06–2 THz), 0.016 (2 THz) |
| 10% 10 nm | 0.6–2.4 (0.06–2 THz) 1.44 (2 THz) | 0–0.7 (0.06–2 THz) 0.007 (2 THz) |
| 10% 20 nm | 3.8–0.04 (0.06–2 THz) 1.35 (2 THz) | 0.05–2 (0.06–2 THz) 0.002 (2 THz) |
| BTO—Gelatin | ||
| 0% | 2.2–5.7 (0.06–2 THz), 3.43 (2 THz) | 0.1–1.5 (0.06–2 THz), 0.37 (2 THz) |
| 6.25% | 3.5–4.5 (0.06–2 THz), 3.66 (2 THz) | 0.2–1.6 (0.06–2 THz), 0.34 (2 THz) |
| 18% | 3.5–5 (0.06–2 THz), 3.55 (2 THz) | 0.2–1 (0.06–2 THz), 0.37 (2 THz) |
| 25% | 3.6–5.3 (0.06–2 THz), 3.9 (2 THz) | 0.3–1.3 (0.06–2 THz), 0.44 (2 THz) |
| 40% | 3.9–6.6 (0.06–2 THz), 4.11 (2 THz) | 0.4–2.4 (0.06–2 THz), 0.53 (2 THz) |
| BTO- epoxy | ||
| 0% | 2.6–2.8 (0.06–2 THz) [16] | 0–0.15 (0.06–2 THz) [16] |
| 2.8% | 2.6–3.5 (0.06–2 THz), 3.16 (2 THz) | 0.1–0.4 (0.06–2 THz), 0.13 (2 THz) |
| 5.4% | 2.9–4.2 (0.06–2 THz), 3.2 (2 THz) | 0.09–1.4 (0.06–2 THz), 0.13 (2 THz) |
| 10% | 3–3.7 (0.06–2 THz), 3.19 (2 THz) | 0.08–0.7 (0.06–2 THz), 0.16 (2 THz) |
Disclaimer/Publisher’s Note: The statements, opinions and data contained in all publications are solely those of the individual author(s) and contributor(s) and not of MDPI and/or the editor(s). MDPI and/or the editor(s) disclaim responsibility for any injury to people or property resulting from any ideas, methods, instructions or products referred to in the content. |
© 2023 by the authors. Licensee MDPI, Basel, Switzerland. This article is an open access article distributed under the terms and conditions of the Creative Commons Attribution (CC BY) license (https://creativecommons.org/licenses/by/4.0/).
Share and Cite
Mihai, L.; Caruntu, G.; Rotaru, A.; Caruntu, D.; Mykhailovych, V.; Ciomaga, C.E.; Horchidan, N.; Stancalie, A.; Marcu, A. GHz—THz Dielectric Properties of Flexible Matrix-Embedded BTO Nanoparticles. Materials 2023, 16, 1292. https://0-doi-org.brum.beds.ac.uk/10.3390/ma16031292
Mihai L, Caruntu G, Rotaru A, Caruntu D, Mykhailovych V, Ciomaga CE, Horchidan N, Stancalie A, Marcu A. GHz—THz Dielectric Properties of Flexible Matrix-Embedded BTO Nanoparticles. Materials. 2023; 16(3):1292. https://0-doi-org.brum.beds.ac.uk/10.3390/ma16031292
Chicago/Turabian StyleMihai, Laura, Gabriel Caruntu, Aurelian Rotaru, Daniela Caruntu, Vasyl Mykhailovych, Cristina Elena Ciomaga, Nadejda Horchidan, Andrei Stancalie, and Aurelian Marcu. 2023. "GHz—THz Dielectric Properties of Flexible Matrix-Embedded BTO Nanoparticles" Materials 16, no. 3: 1292. https://0-doi-org.brum.beds.ac.uk/10.3390/ma16031292