Article

Determining a Carbon Reference Level for a High-Forest-Low-Deforestation Country

1
International Institute for Applied Systems Analysis (IIASA), 2361 Laxenburg, Austria
2
KU Leuven - Catholic University of Leuven, 3000 Leuven, Belgium
3
Sustainable Development Solutions Network (SDSN), 75009 Paris, France
4
Technical REDD+ Secretariat (ST-REDD), Ministry of the Environment (MINEPDED), Yaoundé, Cameroon
5
UNIQUE forestry and land use GmbH, 79098 Freiburg, Germany
6
Albert Ludwig University of Freiburg, 79085 Freiburg im Breisgau, Germany
7
US Forest Service (USFS), P.O. Box 14 Brazzaville, Republic of Congo
*
Author to whom correspondence should be addressed.
Submission received: 30 September 2019 / Revised: 19 November 2019 / Accepted: 20 November 2019 / Published: 2 December 2019
(This article belongs to the Special Issue Remote Sensing Technology Applications in Forestry and REDD+)

Abstract

:
Research Highlights: A transparent approach to developing a forest reference emissions level (FREL) adjusted to future local developments in Southern Cameroon is demonstrated. Background and Objectives: Countries with low historical deforestation can adjust their forest reference (emission) level (FREL/FRL) upwards for REDD+ to account for likely future developments. Many countries, however, find it difficult to establish a credible adjusted reference level. This article demonstrates the establishment of a FREL for southern Cameroon adjusted to societal megatrends of strong population—and economic growth combined with rapid urbanization. It demonstrates what can be done with available information and data, but most importantly outlines pathways to further improve the quality of future FREL/FRL’s in light of possibly accessing performance-based payments. Materials and Methods: The virtual FREL encompasses three main elements: Remotely sensed activity data; emission factors derived from the national forest inventory; and the adjustment of the reference level using a land use model of the agriculture sector. Sensitivity analysis is performed on all three elements using Monte Carlo methods. Results: Deforestation during the virtual reference period 2000–2015 is dominated by non-industrial agriculture (comprising both smallholders and local elites) and increases over time. The land use model projections are consistent with this trend, resulting in emissions that are on average 47% higher during the virtual performance period 2020–2030 than during the reference period 2000–2015. Monte Carlo analysis points to the adjustment term as the main driver of uncertainty in the FREL calculation. Conclusions: The available data is suitable for constructing a FREL for periodic reporting to the UNFCCC. Enhanced coherence of input data notably for activity data and adjustment is needed to apply for a performance-based payment scheme. Expanding the accounting framework to include forest degradation and forest gain are further priorities requiring future research.

1. Introduction

The REDD+ mechanism was designed to reward countries financially for reducing emissions from deforestation and forest degradation (DD), which significantly contributes to total greenhouse gas (GHG) emissions worldwide [1]. REDD+ also includes the promotion of sustainable management of forests and increasing and conserving forest carbon stocks [2]. The underlying idea is that avoided deforestation offers a large and very cost-effective potential to curb GHG emissions [3,4]. To measure progress in this regard, a benchmark measure is needed to define how much would be emitted in the absence of REDD+ interventions. This benchmark is called a forest reference level (FRL) or forest reference emission level (FREL). The former refers to an accounting framework where forest gain is considered, the latter refers to forest loss only. FRL/FREL was institutionalized in the Warsaw Framework as one of the four elements required to participate in REDD+ [5].
The establishment of a FRL/FREL is preceded by a number of important policy-related decisions including a national definition of what constitutes a forest; the scale in terms of geographical coverage where FRL/FREL for sub-national jurisdictions or regions can be developed as an interim measure en route to developing a national baseline (Decision 1/CP.16 - FCCC/CP/2010/7/Add.1); the scope of the FRL/FREL in terms of the relevant activities causing changes in forest carbon stock, the carbon pools and the gases to be considered; and a reference period in the recent past. Together, these decisions provide the framework for measuring the area extent of change (activity data or AD) and emission factors (EF), which is the difference between carbon stored before and after conversion of forest to another land use. The combination of AD x EF for a given scale, scope, and period results in a historic baseline. Some countries such as Brazil and Indonesia used these historical baselines as their FREL, i.e., as the benchmark to measure their progress towards reducing future emissions from deforestation. Historical deforestation rates are very high for these two countries.
The thus established FRL/FREL can then be submitted to the United Nations Framework Convention on Climate Change (UNFCCC) for technical assessment. This is to assess the degree to which information provided is in accordance with the guidelines for submissions of information on FREL/FRL and offer a facilitative, non-intrusive, technical exchange of information on the construction of the FREL/FRL (FCCC/CP/2013/10/Add.1.). The information provided (including historical information) should be guided by the most recent Intergovernmental Panel on Climate Change (IPCC) guidance and be transparent, complete, consistent, and accurate (FCCC/CP/2011/9/Add.2).
Many countries and jurisdictions such as so-called high-forest-low-deforestation (HFLD) countries, which are characterized by high remaining forest cover and comparatively low rates of deforestation, dispose of atypical starting situations for REDD+ [6]. Historical rates of deforestation alone are inadequate to define an FRL/FREL for HFLD countries, especially in cases where there are clear indications of changes (increase) in drivers of DD. The risk of using a historical baseline in HFLD countries is that the efforts necessary to contain future deforestation could be underestimated. The FRL/FREL will therefore have to take socioeconomic development into consideration, which influence the trajectories of future drivers of change and the effort to be compensated will have to be based on the effectiveness of national/international policies and measures to address these.
However, the potential for inflation of the FRL/FREL and the subsequent creation of “hot air” when historical baselines are adjusted, have been the subject of much thinking about design principles [7,8,9] and criticism of applied methodologies [10,11,12,13]. How to define a benchmark for emissions remains an issue in the era of the Paris Agreement where many countries mention REDD+ in their Nationally Determined Contributions (NDC’s) [14] and state that GHG emissions from land use, land-use change and forestry (LULUCF) are likely to increase in the future under the business-as-usual scenario [15,16]. Methodologies used to justify a perceived increase of future emissions vary greatly and often go unreported [15,16].
Engagement in REDD+ will ultimately depend on a country’s capacity to demonstrate the level of emissions from forests with and without REDD+ interventions. The lack of data or capacity, or both, to measure, project, and monitor emissions has been put forward as a possible major hindrance, notably for African countries, to effectively participate in REDD+ [17,18,19,20,21], although the stepwise approach of improving reference levels as new and better data become available (See COP decision 12/CP17) recommended by the UNFCCC, largely facilitates the task. Globally, more than 30 countries have already submitted FREL/FRLs to the UNFCCC for technical assessment, some of which have also claimed upwards adjustment [16]. The methodology used to justify the upwards adjustment is often poorly documented.
This paper focuses on the development of a virtual subnational FRL as an interim measure towards the development of a national FRL for Cameroon. Southern Cameroon serves as a case study area since it is facing a bundle of societal megatrends that are poised to have an impact on the still very high forest cover in coming years: The country’s economy has recovered from the crisis of the early 2000s [22,23,24]; the local population is growing rapidly, especially in urban centers where the population tends to have different food consumption patterns; and the area is known as a bread basket for export to neighboring Gabon, Republic of the Congo, and Equatorial Guinea. These trends, combined with continued low agricultural yields, are generally expected to drive agriculture further into forest areas [25,26,27,28].
From the perspective of a stepwise approach towards the development of a national FREL, the study uses available datasets to establish an adjusted subnational FREL for Cameroon and critically analyses future steps for improving the FREL as the country aims to access performance-based finance. The working hypothesis underlying the adjustment term of the FREL is that there is a clear set of quantifiable variables related to the development of a society leading to forest conversion that can be projected into the future [29] while aiming at a high degree of transparency. The methodology for FREL development presented in this paper is easily replicable in other HFLD countries.

2. Materials and Methods
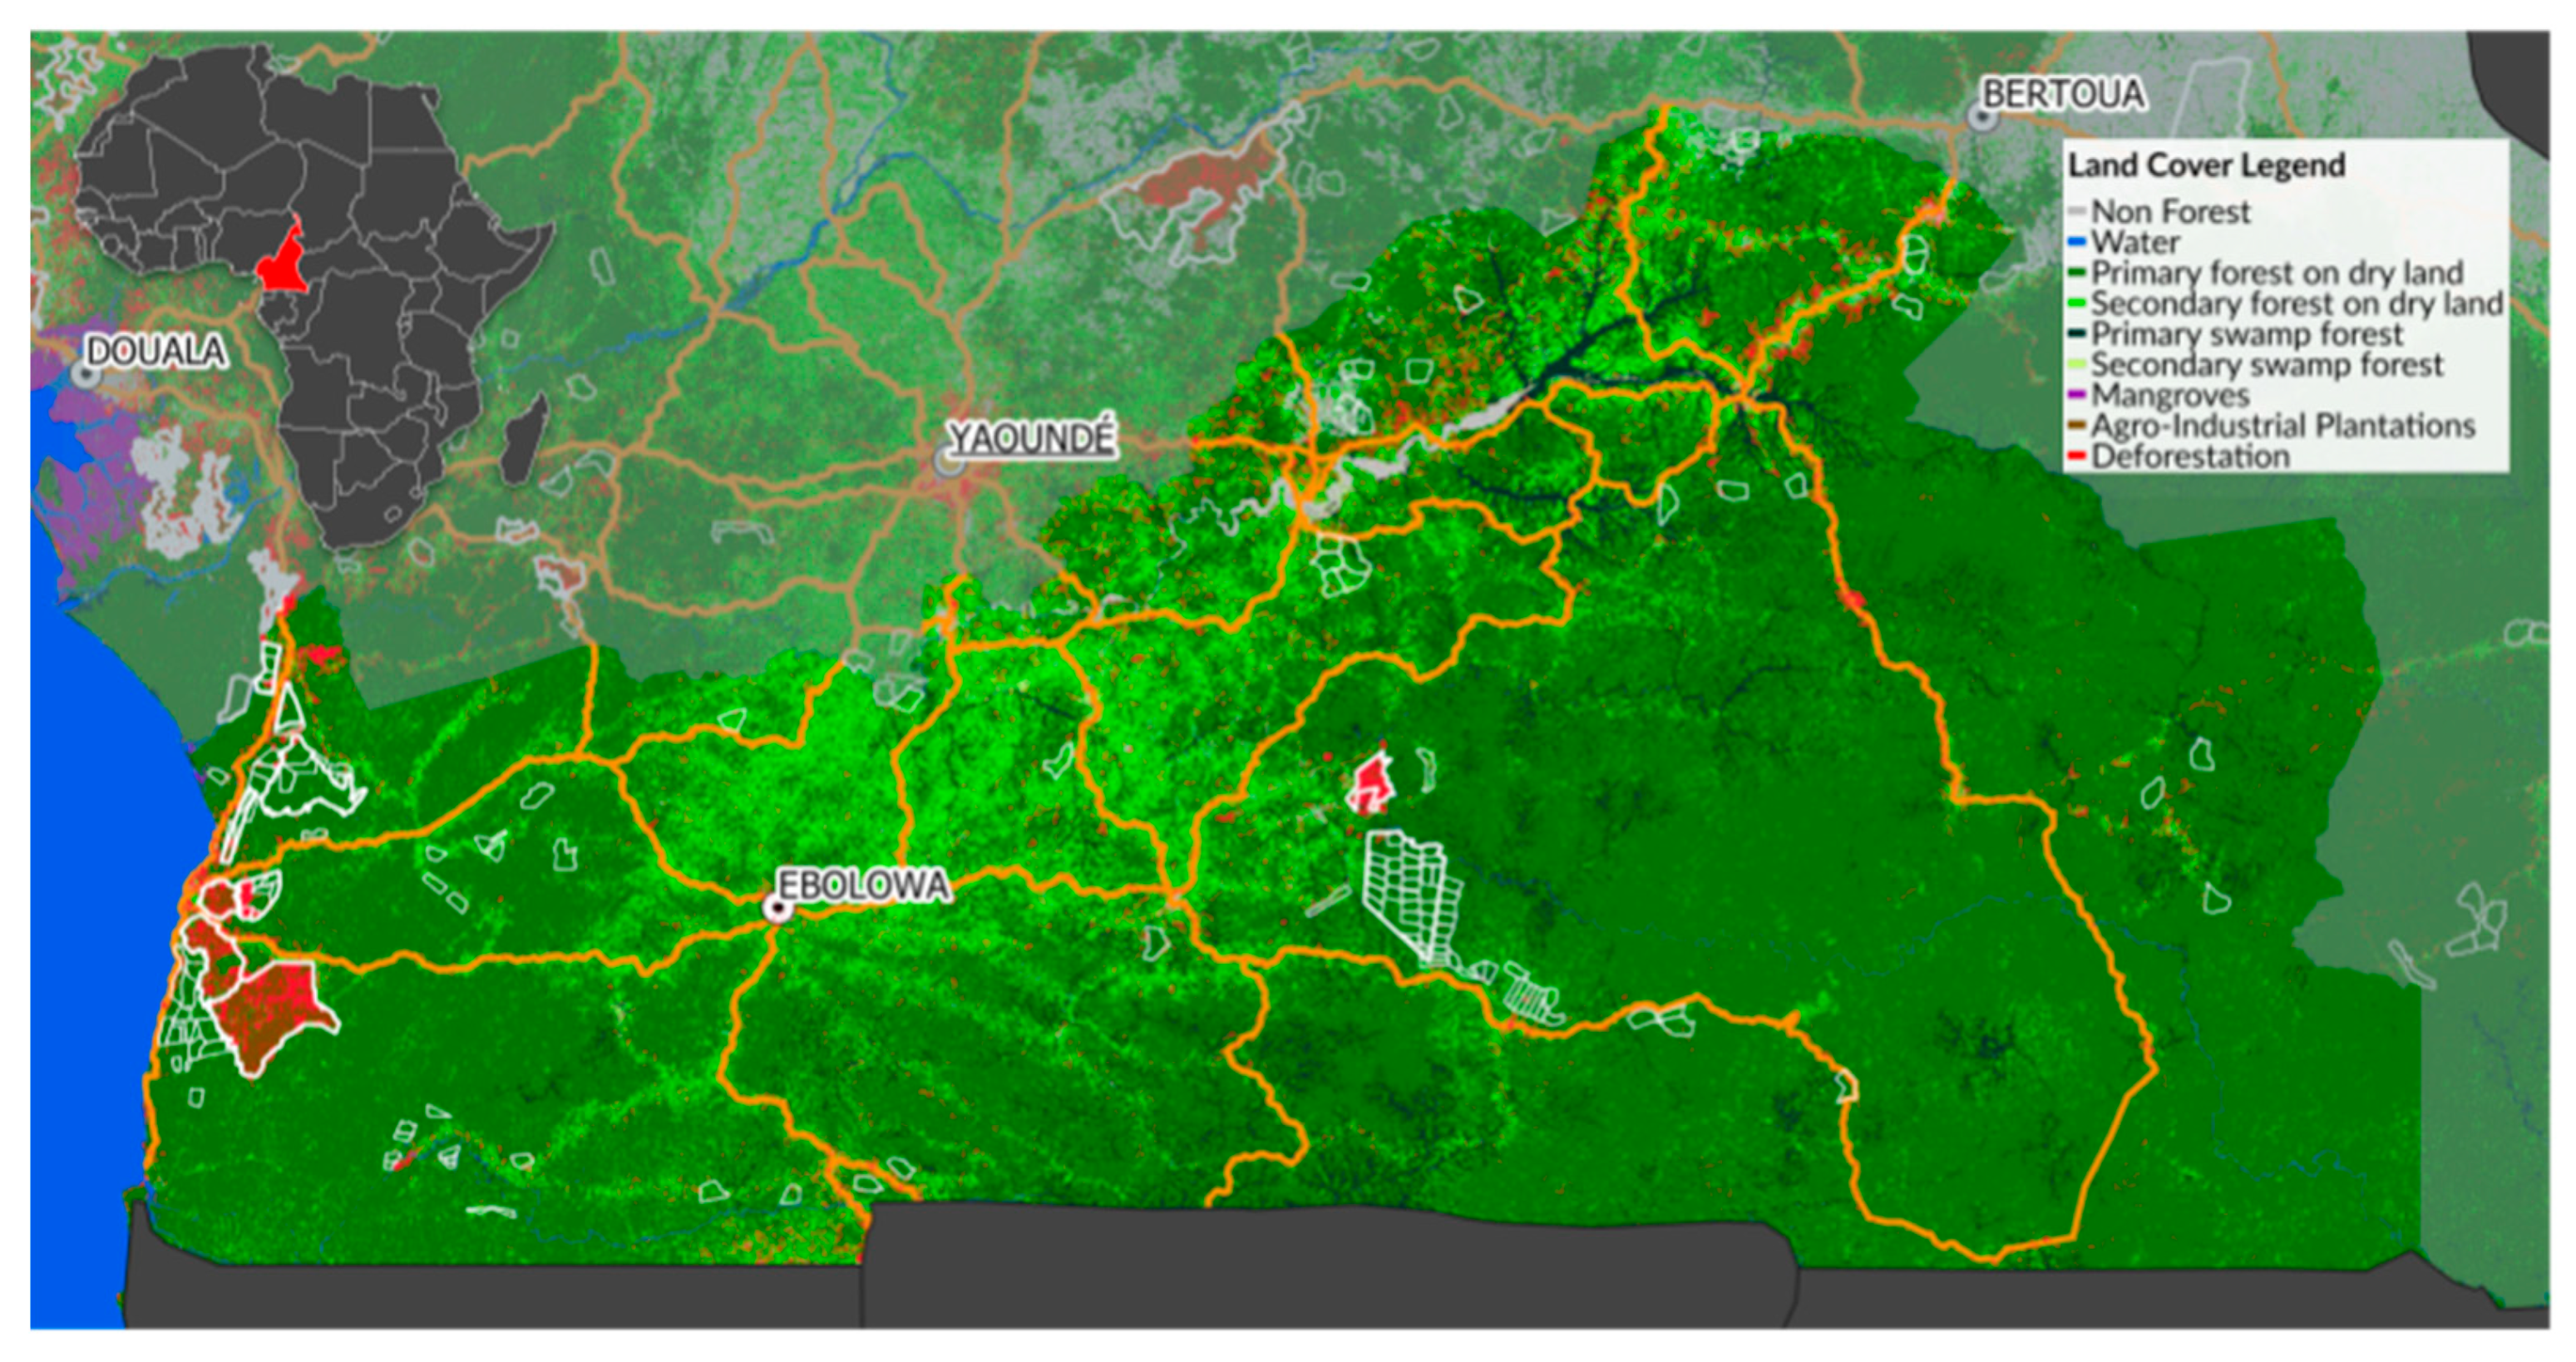
The study area is presented in Section 2.1 and a set of policy-related working definitions adopted by the country is presented in Section 2.2. These are the boundary conditions for the establishment of the subnational FREL. The virtual reference level for the reporting period 2020–2030 for the study area is computed based on historical emissions derived from activity data (Section 2.3) combined with emission factors (Section 2.4) and adjusted to national circumstances using a land use model (Section 2.5). The approach to sensitivity analysis of all components of the FREL is presented in Section 2.6.

2.1. The Study Area

The study area encompasses seven (out of a total of 58) administrative divisions located in the humid tropical part of southern Cameroon (Figure 1). It covers a total area of 9.3 million ha, which is equivalent to the land area of Hungary. The climate is dominated by ample rainfall of 1500–4000 mm per year, which allows for the growth of moist evergreen forests that cover close to 90% of the study area [30].
The population density of around 14 people per km2 is relatively low and concentrated around the coast and in towns and villages along the road to the capital city Yaoundé, located around 50 km north of the boundary of the study region. The main drivers of deforestation in the region are shifting smallholder agriculture, agro-industrial plantations that mainly focus on tree crops and the expansion of transport infrastructure [31].

2.2. Working Definitions: Scale, Scope, Forest Definition, and Virtual Reporting Periods

Cameroon’s draft national REDD+ strategy provides the theoretical working definitions that frame the conditions under which an FRL/FREL can be developed. In the scope of REDD+ in Cameroon, the term “forest” is defined by three criteria: Crown cover of 10% or more, an attainable tree height of 3 m or more, and a patch size of 0.5 ha or more. Mono-specific tree crops such as plantations of oil palm, rubber, and full-sun cocoa are explicitly excluded from the forest definition. The country also considers all eligible REDD+ activities (reducing emissions and increasing removals) in their draft strategy. All carbon pools should be considered in the establishment of the FRL, with an emphasis on accounting for significant pools at a Tier 2 level. CO2 is the most relevant GHG in the forestry sector but in specific cases CH4 and N2O may also be considered. The country has not formally fixed a reference period and a performance period.
The establishment of an FRL is further constrained by available data. First, there is no dataset available to reliably trace the degradation or gain of forests, which restricts the scope of this article to establishing an FREL of CO2 emissions from deforestation only, where other gases potentially emerging from smaller fires are considered negligible. Pools are restricted to above and below-ground biomass due to the uncertainty associated with more liable pools. This study uses the periods 2000–2015 and 2020–2030 as virtual reference and reporting periods, respectively, based on the availability of relevant datasets. “Virtual” reference and reporting periods refer to the working definition made in the context of this article as opposed to the political decision that lies in the sovereignty of the country.

2.3. Remote Sensing of Activity Data

Activity data was derived from a countrywide reference land cover map for a base year (2000) and the assessment of forest loss over the reference period (2000–2015), clipped to the extent of the study area. The reference maps for 2000 and 2015 were developed using a hierarchical supervised decision tree-based wall-to-wall mapping methodology implemented in PCI Geomatica Software. The assessment was run on a composite of 10,517 terrain corrected (L1T) Landsat images (bands 3,4,5,7) with low cloud coverage sourced from the United States Geological Survey (USGS) Earth Explorer and resulted in seven thematic classes: (1) Primary and (2) secondary terra firma and (3) primary and (4) secondary swamp forests, (5) mangroves, (6) agro-industrial plantations of perennial crops, (7) non-forest land, and (8) forest loss since the year 2000. The workflow largely builds on a recent study conducted in the Democratic Republic of the Congo [32]. A minimum mapping unit of 0.5 ha compliant with the national forest definition was applied to forest loss areas to eliminate small-scale degradation and natural disturbances from the resulting deforestation map for 2000–2015. The assessment of accuracy, deforestation dynamics within the 2000–2015 period and identification of drivers of deforestation was performed using a stratified random sampling method [33,34]. To that end, 348 dated reference samples from Landsat and high-resolution images from Google Earth were collected, visually interpreted, and used to validate the reference and the forest change map, respectively [32]. The pre-defined protocol for the assessment of drivers of deforestation distinguishes eleven classes and is presented in Appendix B alongside a link to the online sample visualization.

2.4. Emission Factors from the National Forest Inventory

Emission factors were developed on the basis of the country’s first, and thus far only, national forest inventory (NFI) performed during the years 2003–2004 [35]. Tree biomass in Cameroon was inventoried using 204 valid census tracts distributed according to a systematic stratified sample design across the country - 45 of which are located inside the study region. Tree biomass in both forest and non-forest (such as agroforests, fallows, tree plantations, etc.) areas was considered, although non-forest classes are only sparsely present in the final sample.
Re-analyzed for the purpose of REDD+, the NFI data allows for distinguishing carbon stocks in five land cover types in the study area: (1) Forest, (2) settlements, (3) grassland, (4) fallow land, (5) annual crops, and (6) perennial crops. Carbon stocks were calculated by combining data and information on tree diameter and tree height from the NFI with pan-tropical allometric equations [36] and proxy shoot-to-root ratios for moist tropical forests [37]. Emission factors were computed as the difference between initial forest carbon stocks of the living biomass and the carbon stocks left in the vegetation after forest conversion and presented in the results section. Further details on NFI data and assessments can be found in the background report [38].

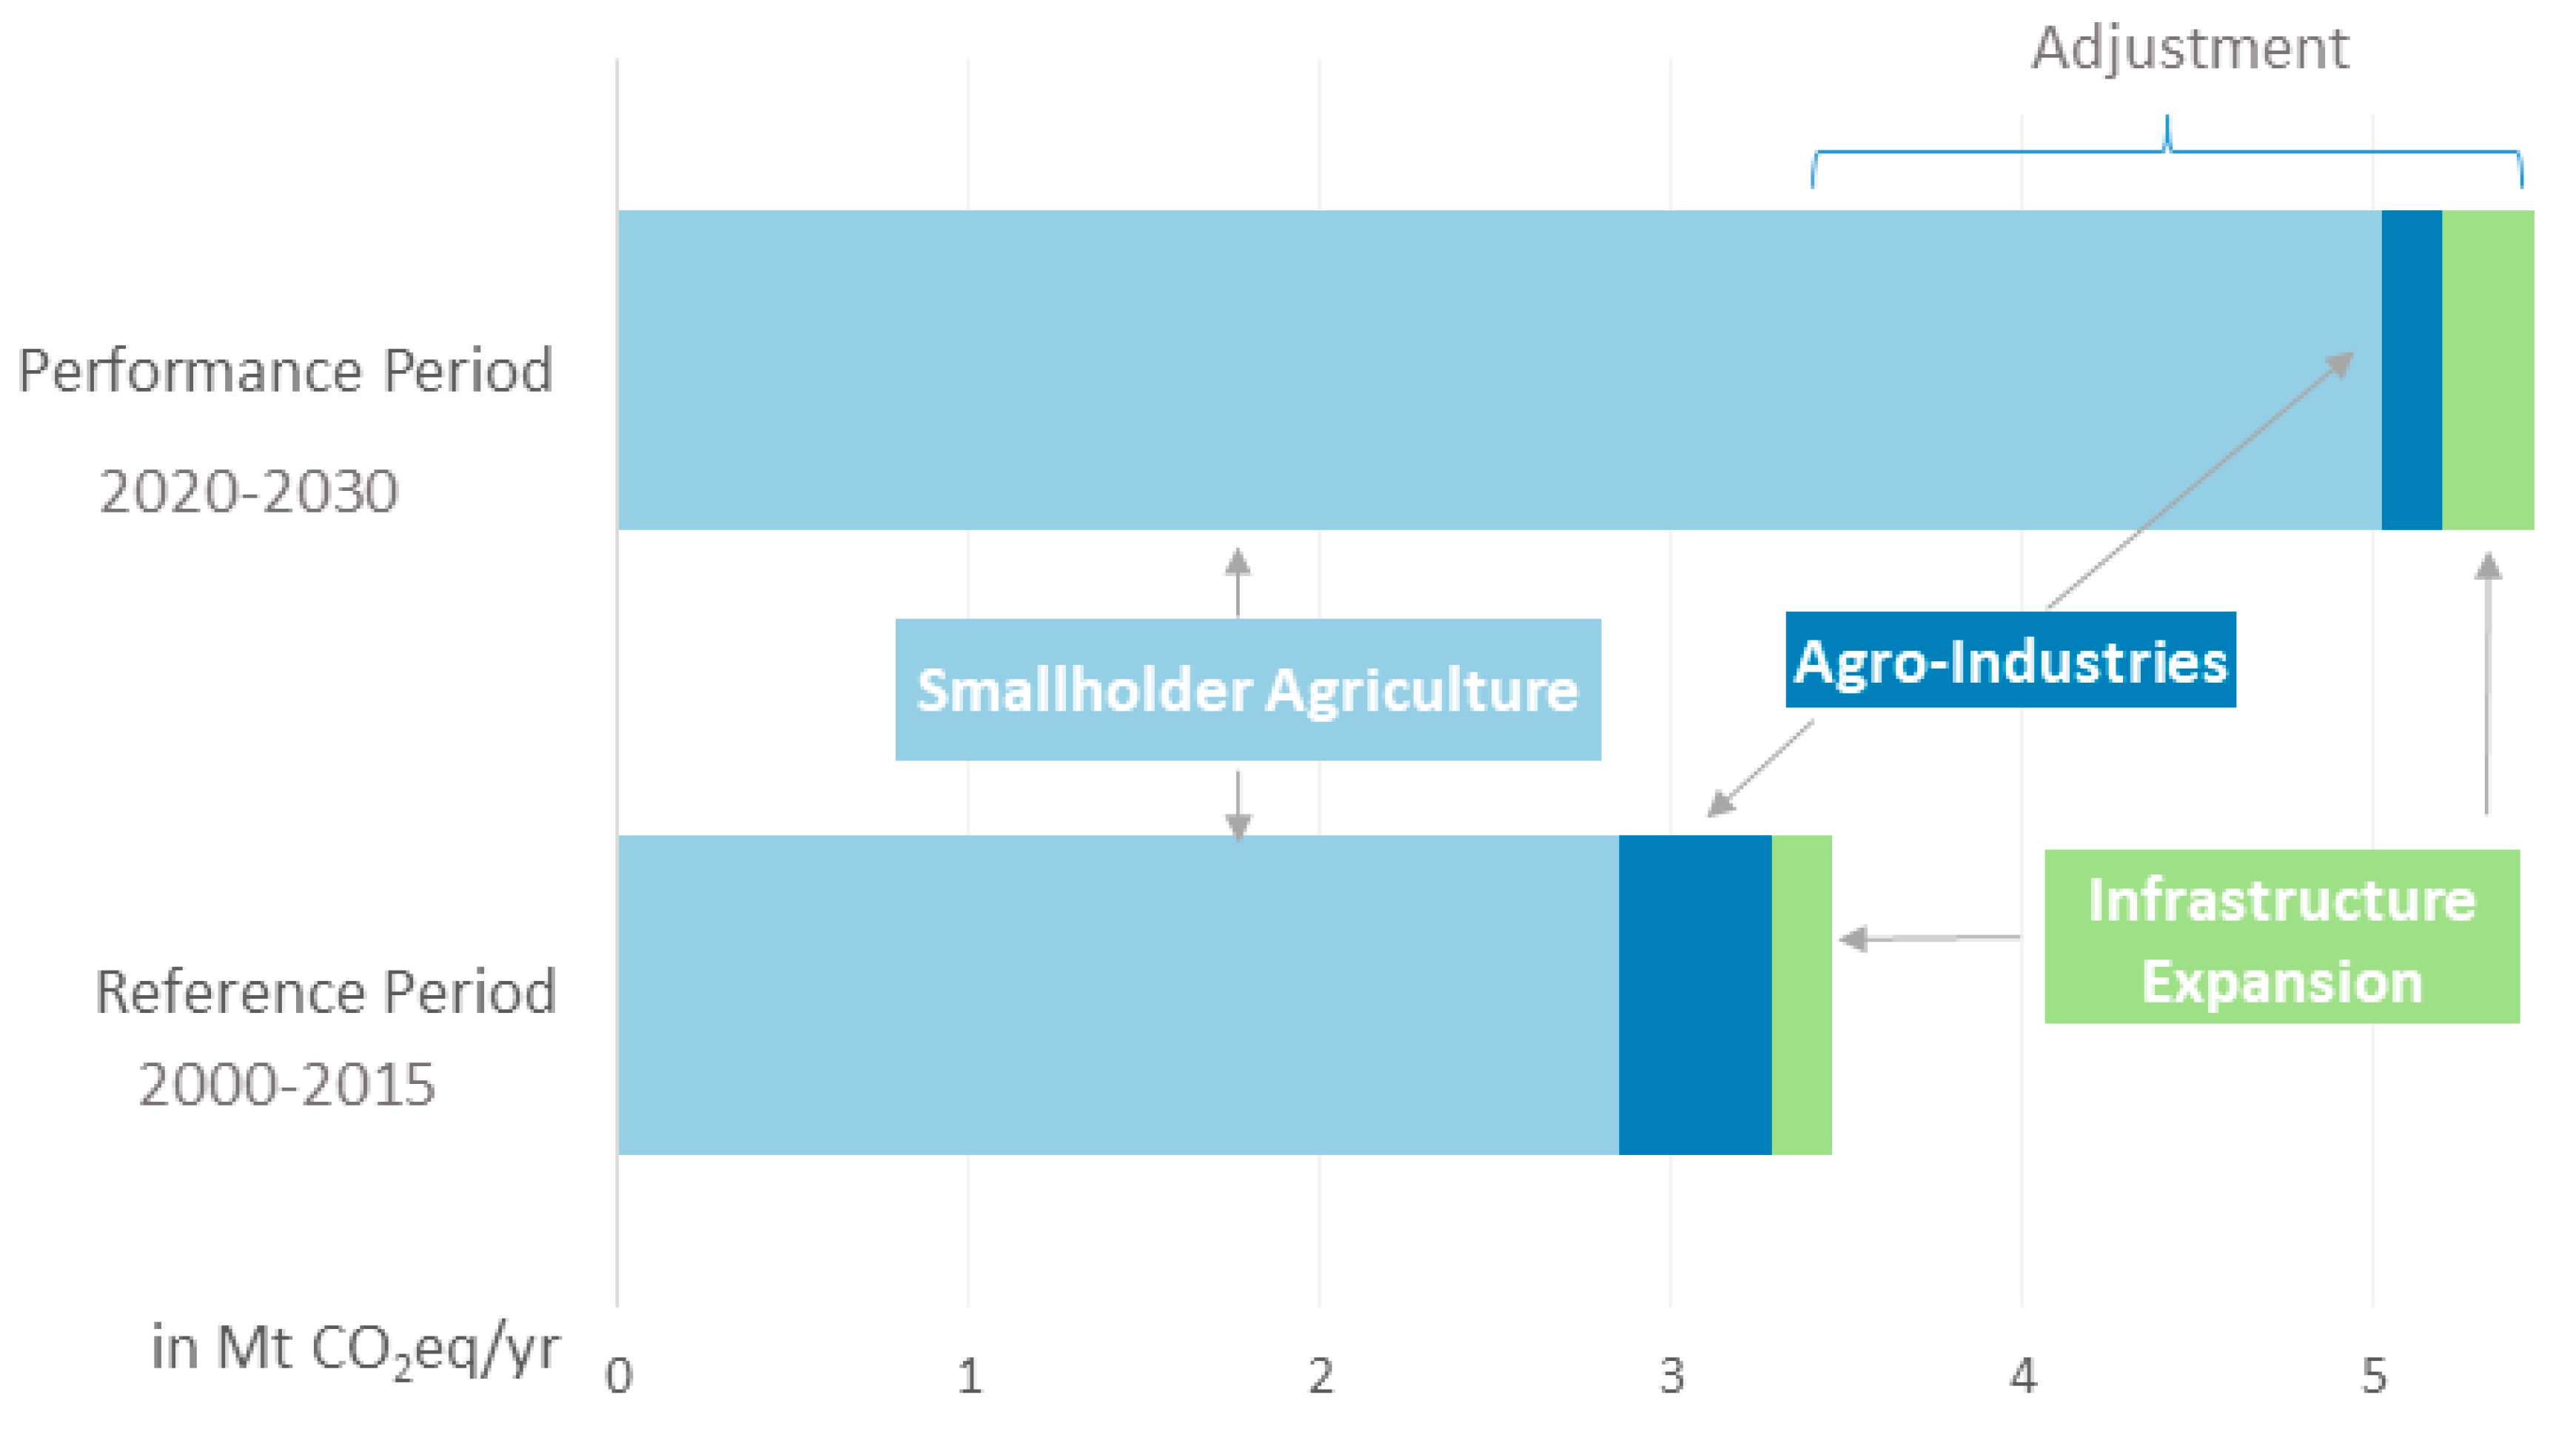
2.5. Adjustment of the Reference Level to National Circumstances

Given that non-industrial agriculture is by far the main driver of deforestation in the region [39], the main adjustment of the reference level was calculated for non-industrial agriculture using a land use model. The model’s rationale builds on demand for agricultural products that needs to be satisfied by a matching supply. The model is implemented in MS Excel and is available for download from http://dare.iiasa.ac.at/56. It provides results in five-year intervals from 2000 until 2030 for each of the five agro-ecological zones of Cameroon [40] and the study area, and in terms of the contributions of the 15 most prevalent agricultural crops in the country (see a list of crops in the annex). The model comprises six computation steps, each of which is parameterized using available data for Cameroon: (1) Population, (2) food and feed consumption, (3) trade within Cameroon and with the rest of the world, (4) agricultural production, (5) cultivated area, and (6) resulting forest cover change.

2.5.1. Population

Demographic development plays a key role in the land use model. It is fed by national data and projections by division (third administrative level) and separately for urban and rural areas. In this study, towns with more than 50,000 inhabitants are considered urban areas. Population data for the years 1987 and 2005 is available from the national population censuses conducted by the Central Bureau of Census and Population Studies of Cameroon (BUCREP).
The population for reference year 2000 of the FREL is calculated based on 1987 census data and the average growth rate between 1987 and 2005. Existing population projections according to the shared socioeconomic pathway (SSP) [41,42] scenario number 3 of the SSP Framework were used to project the population growth available from the censuses to the future for the years after 2005 until the end of the virtual performance period in 2030. Rather than the middle-of-the road scenario SSP2, SSP3 is used as it is very close to the official national population projections [43]. SSP scenarios about future population growth for Cameroon are only available at the national level and were therefore used to project national data in the future only.
The data shows that the population in the study area has increased from 706,000 people at the time of the first census in 1987 to 1.05 million in 2005 with the share of the urban population increasing from 16% in 1987 to 22% in 2015. According to the SSP3 scenario, the population will increase further to 1.33 million by 2030, with 38% of the population living in urban areas.

2.5.2. Consumption

Living conditions and relative wealth in Cameroon are improving with an average of 4.2% GDP growth per annum over the last 10 years [44]. This has direct repercussions on people’s dietary habits. Income growth and urbanization, for instance, lead to changes in consumption such as a more diverse diet that includes a larger share of animal protein, fats, and oils (a phenomenon known as Bennett’s Law [45]).
Data on diets for the different regions of Cameroon comes from the UN World Food Program [46] and projected to the future using GDP projections from the World Bank and income elasticities for food consumption [47] that translate into future diets specific to Cameroon. These socioeconomic changes result in a projected increased per-capita consumption of beans and groundnuts (+35% each until 2030), bananas and plantains (+27%), as well as pork and poultry (+45%).
The resulting per capita consumption, combined with population projections result in an estimate of future food consumption that can be met either by local production, imports from other regions of the country, or imports from other countries.

2.5.3. Trade

The model considers flows of agricultural goods within Cameroon, as well as to and from neighboring countries and the international market. Trade of crops and foodstuff with third countries is documented by national publications [48] and the Food and Agriculture Organization Corporate Statistical Database (FAOSTAT). Statistics on internal trade within Cameroon are not available and therefore estimated as the complement of local agricultural production needed to feed the local population. The share of the consumption in each of the five agro-ecological zones (AEZ) and rural/urban area that is satisfied by each source, that is local, each other AEZ or the rest of the world. This estimation is made according to three guiding principles: (1) The (over) supply status of a certain crop; (2) the proximity of the other regions with the importing region; and (3) it is assumed that imported goods from other countries mostly go to the urban areas. Further, the shares of imported versus locally produced food are assumed to be constant over time.

2.5.4. Agricultural Production

Production in each region is computed based on the local demand times the share that is domestically produced in case the region is a net importer, plus the sum of the shares of the region in the consumption of other regions times their projected level of consumption if the region is a net exporter. The local demand for crops is the sum of the demand for human consumption and for animal feed such as poultry.
A significant share of production is lost or wasted at different stages in the value chain [49,50]. This leads to a higher computed production compared to the computed consumption requirement. According to the Food and Agriculture Organization (FAO) [51], post-harvest losses reached 32% of the cassava production in 2010. For periods beyond 2010, constant post-harvest losses shares are assumed.

2.5.5. Harvested Area and Arable Land

Once the production level is computed, the harvested area results from dividing production by agricultural yields. Yields in the model are specified per administrative region based on data from the ministry of Agriculture’s (MINADER), the AGRISTAT statistics report series, and counter-checked with country-level production data from FAOSTAT. Yields are kept constant at reported levels for future projections.
In order to compute the impact on arable land, two other parameters are used: (1) The average number of harvests per year and (2) the share of fallow land in total arable land. The average number of harvests per year is crop and region specific and is taken from the AGRISTAT reports over 2000–2004. The area that lies fallow is mainly driven by the fallow period, which varies with the population density, that is to say, fallow periods are shorter in densely populated areas [52]. Furthermore, fallow periods are longer in humid tropical regions than in drier savannah areas. In the model these are capped to two years (fallow multiplier: 1). A typology of fallow periods is presented in Table 1, where the resulting fallow coefficient is applied in the model. No fallow period is assumed for perennial crops such as oil palms, cocoa, rubber, and banana plantations.
At this stage, the model predicts the amount of arable land required to satisfy the demand for food and feed, which are the key drivers of deforestation, in intervals of five years.

2.5.6. Deforestation and Emissions

Forest clearing is a direct result of cropland expansion into forest areas. However, the share of cropland claimed from forests as opposed to other, non-forested lands varies from one region to another and is determined by the availability of non-forest land. For Cameroon, the share of new cropland claimed from forest ranges from 6% in the Far North region, which is dominated by open vegetation, to 90% for the tropical humid zone [53]. For the study area in southern Cameroon, the same study finds a share of 85% of new cropland claimed from forest.
Next, projected deforestation is combined with carbon stocks for the land cover types presented in Section 3.2. Carbon stock values are derived from the first and thus far only NFI performed in 2003 [35] (see details in Section 2.4). In this context, the results of the NFI are preferred over those of other studies, since reporting for REDD+ requires a long-term monitoring framework where carbon stocks can be traced over time using one coherent methodology.

2.5.7. Model Validation—Comparison of Model Results with Observed Variables

Obtaining a good match of model results with independently observed data is key in terms of making a credible argument for an adjustment to national circumstances. To this end, checks that allow the comparison of intermediary model outputs at each calculation step with independent statistics—such as agricultural production computed by the model as described in 2.5—is compared with statistical data from the ministry of agriculture (MINADER) or the FAO.
The deforestation dynamics computed by the model are also compared to data from available remote sensing products such as that used to define activity data as described in Section 2.3 and independent global-scale remote sensing products [54,55] clipped to the extent of the study area.

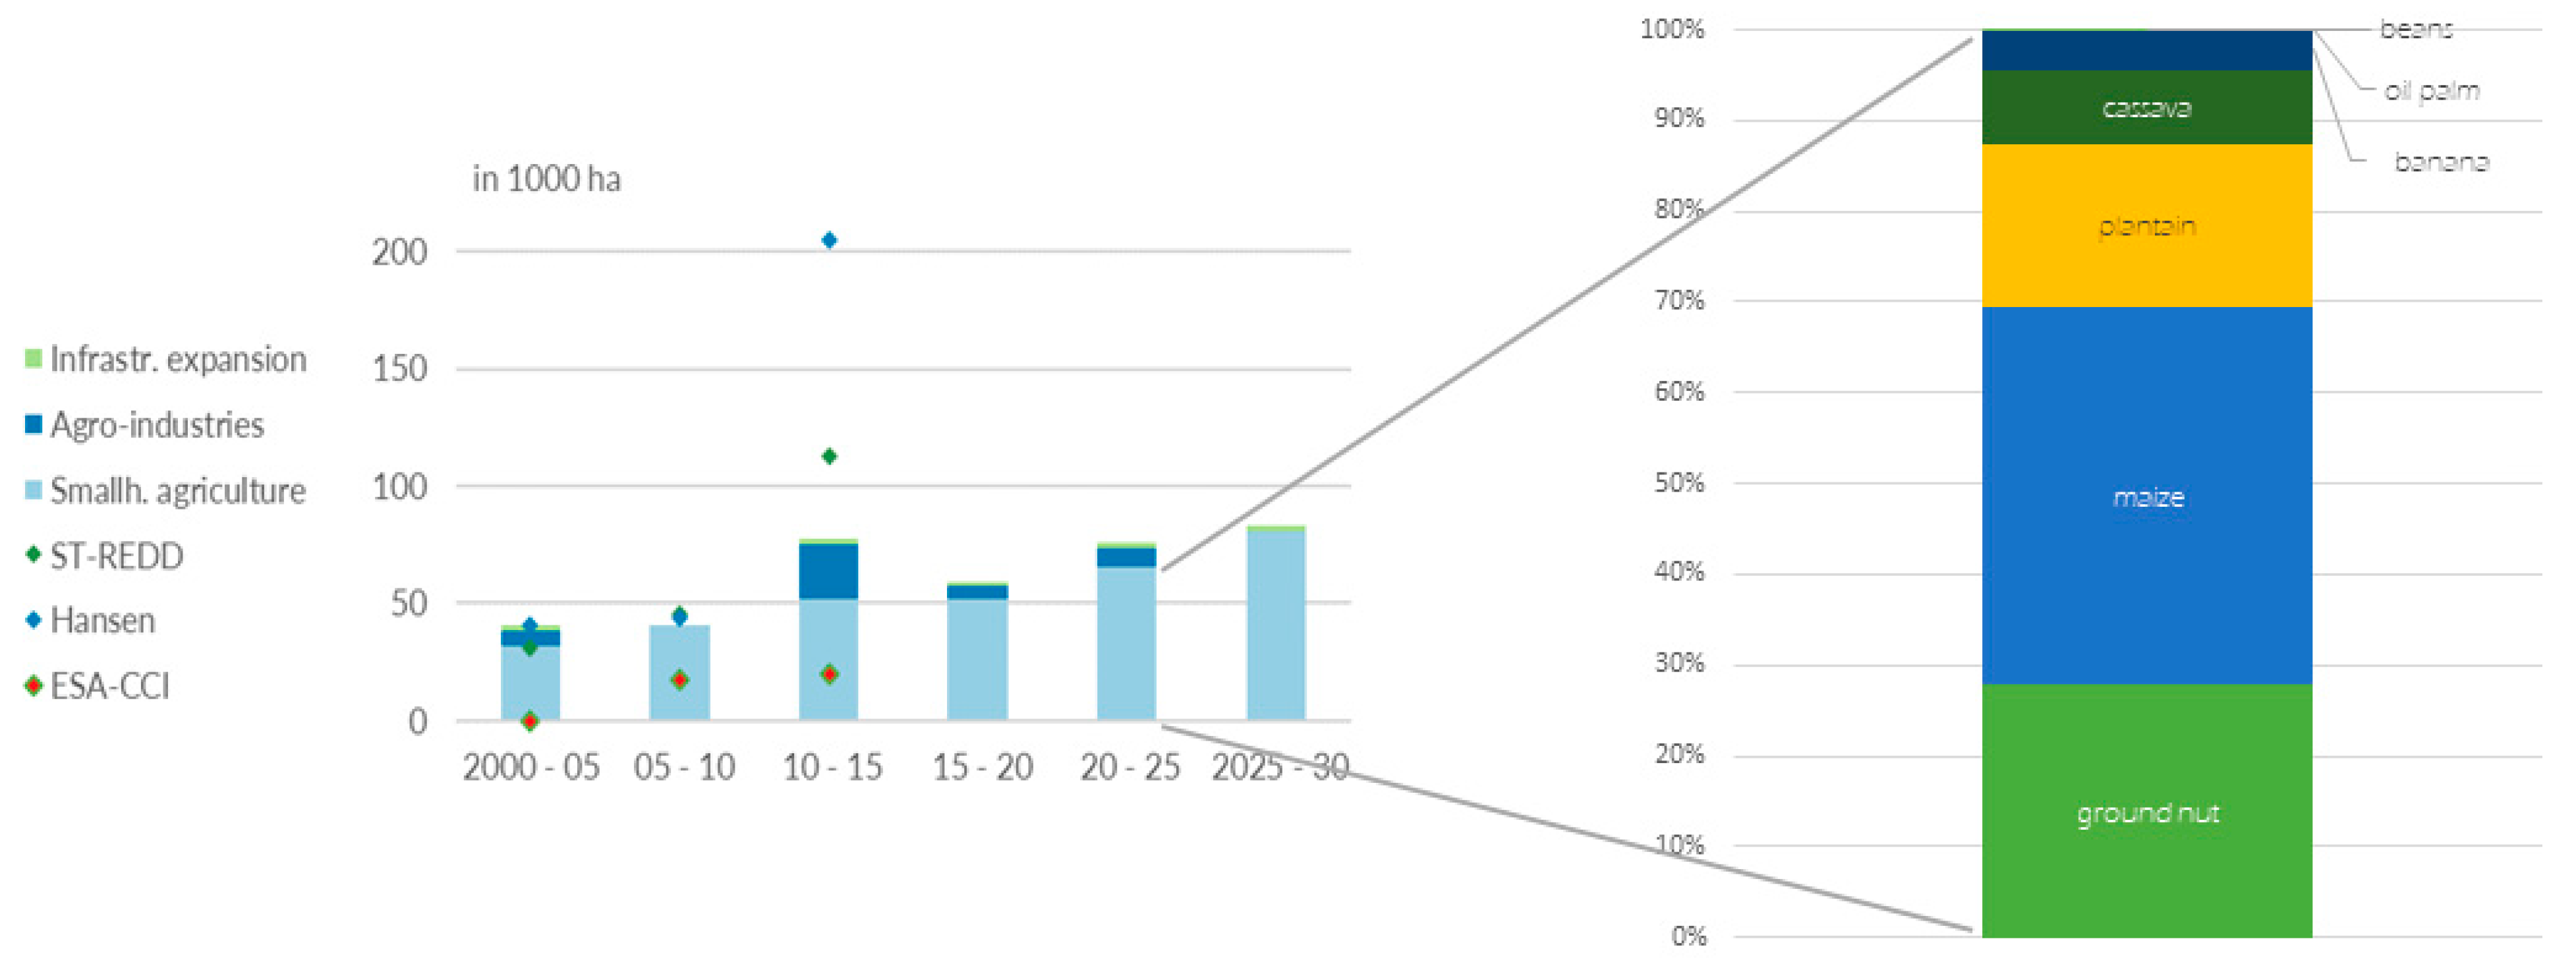
2.5.8. Projecting Other Drivers—Industrial Agriculture and Infrastructure

The expansion of industrial agriculture and infrastructure in the context of Cameroon are based on discrete political decisions, and their future impact is estimated in terms of legal claims to land clearing. Legal claims to clearing land takes the form of sales of standing volumes (SSVs) that allow for unsustainable wood harvesting, and typically precedes the establishment of agro-industrial plantations and infrastructure projects [56,57]. That being said about land allocation, future land use in these areas is uncertain as only a small fraction of planned agricultural development projects in the country are actually implemented [58].
A total of 66,971 ha of SSVs that are almost entirely (97%) covered by forests are currently located inside concession areas flagged for the development of agro-industrial oil palm and rubber plantations, while another 17,980 ha are allocated around the Kribi deep water port to make way for port infrastructure. To account for the uncertainty associated with the development of these areas, it is conservatively assumed that only 10% of SSVs will be cleared and replaced by perennial crops and infrastructure for agro-industrial concessions and the deepwater port, respectively, by 2035.

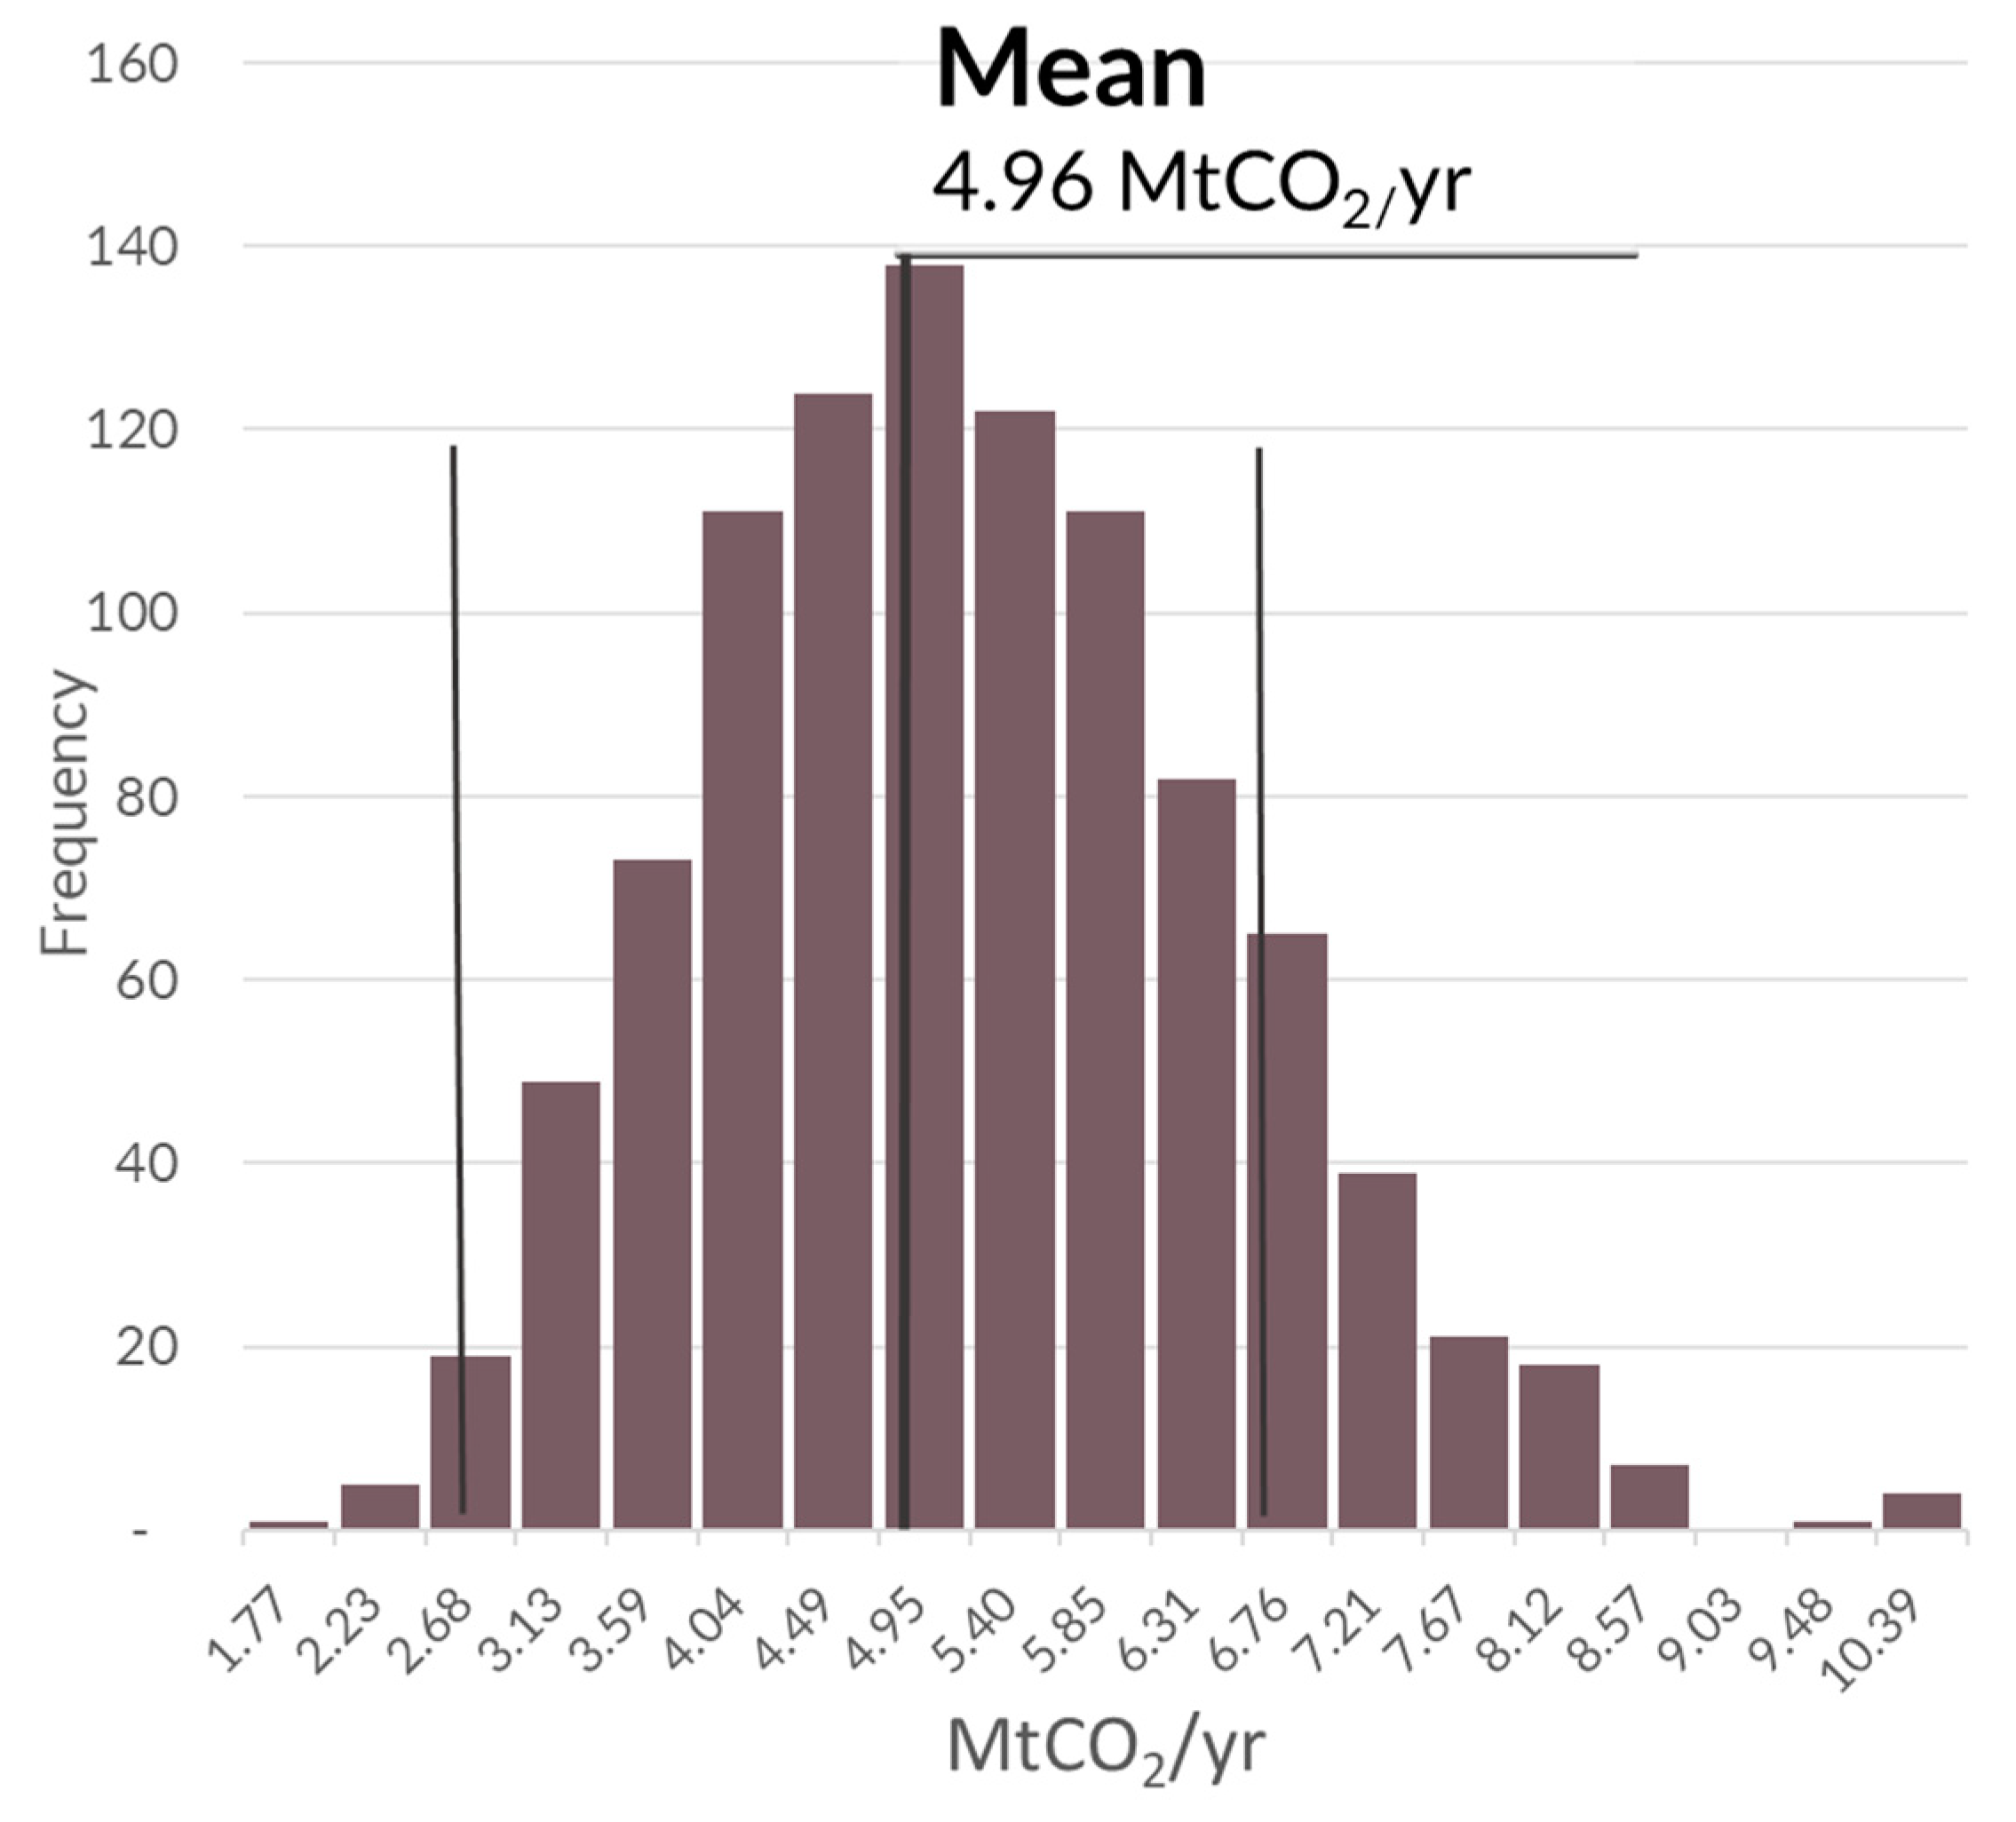
2.6. Sensitivity Analysis of Input Data and Methods

Monte Carlo methods iterate greenhouse gas calculations many times where input variables randomly take different values from the variables AD*EF*Adjustment (Adj hereafter) in each iteration according to a pre-defined probabilistic distribution. The resulting solution space for the FRL emerges from a random combination of input variables and therefore gives a complete picture of the uncertainties associated with the FRL calculation.
For the southern Cameroon case study, a Monte Carlo analysis with 1000 iterations was defined based on the arithmetic mean and the standard deviation at a 90% confidence interval for a normal distribution of the AD, EF, and Adj variables listed in Table 2. For the adjustment term, the variation comes from the deployment of alternative SSP scenarios. From the optimistic SSP 1 “Sustainability” with moderate population and GDP growth to the most pessimistic SSP 5 scenario “Conventional development”, a gap of 9% for population, and 21% for GDP, respectively, can be observed for the year 2030. It should be noted that this is a somewhat simplified assessment for demonstration purposes: For AD it only considers smallholder deforestation, for EF two biomass pools (before and after conversion as opposed to land use specific ones) and various socioeconomic development scenarios leading to varying adjustment factors (as opposed to variation of each input variable).
Data describing the mean and the shape of AD is sourced from the remote sensing exercise described in Section 2.3, which is backed by 127 validation points. EF is composed of biomass in a forest before conversion (50 sample plots) and biomass after conversion (26 sample plots), where the latter is an average over annual and perennial cropland (see Section 3.2). The variation of the adjustment term is calculated from the standard deviation across the six scenarios of socioeconomic pathways for Cameroon (Table 2, Line 4 - Adj).

3. Results

3.1. Forest Loss during the Reference Period 2000–2015

Remotely sensed deforestation accounts for 219,948 ha (14,633 ha/yr or 0.16% per annum of the initial forest cover) over the period 2000–2015 with a standard error of 10.45%. The analysis of drivers of deforestation revealed that the expansion of industrial agriculture, notably palm oil and rubber plantations, contributed 30,128 ha (13.7%), while the expansion of infrastructure—notably the deep water port of Kribi and various projects involving the construction or upgrading of roads, contributed 10,260 ha or 4.7%. Non-industrial agriculture with 159,037 ha or more than 72%, contributed the most by far to forest loss during the reference period 2000–2015. Almost 10% of forest clearings cannot be clearly attributed to an anthropogenic driver and are therefore not further considered as relevant for REDD+ (Table 3).
Trend analysis further shows a strong increase from 36,807 ha of forest loss from 2000–2005, to 48,737 during 2005–2010 and 134,403 ha during 2010–2015. The relative standard error of remotely sensed forest loss at a 90% confidence interval is 60. These results are in the range of other remote sensing products available for Cameroon (Figure 2, different colored dots).

3.2. Emission Factors from the NFI

Emission factors are developed from the difference in above- and below-ground biomass between forest and the land use after clearing, as derived from the NFI. The highest EF is associated with the conversion of forest to built-up areas where all the forest carbon (490 tCO2/ha) is lost (Table 4). Transitions of forest to grassland, annual crops, and fallow/wasteland are also emissions intensive. Perennial cropland houses more than half of the carbon stored in forests and therefore have a relatively low EF of 226.8 tCO2/ha. Uncertainties are smallest in the forest class with a standard error of 4.3% but are significantly higher for the agricultural land cover classes that relate to the lower number of NFI sample plots located in these land cover classes.

3.3. Adjustment of the Reference Level to National Circumstances

The rate of forest clearing is projected to increase in the future. This results in projected cleared areas of 15,900 ha/yr on average through 2020–2030 across all anthropogenic drivers of deforestation, which is 20% above the remotely sensed deforestation rate during the 2000–2015.
Non-industrial agriculture is responsible for the majority of the projected increase. Fueled by increases in population and consumption rates, the land use model predicts an increasing demand for land for the virtual performance period 2020–2030. This leads to projected forest loss from non-industrial agriculture of 14,600 ha/yr, which is 3900 ha/yr (+76%) higher than during the virtual reference period of 2000–2015 (Figure 2, left; light blue bar). This increase occurs gradually where the model for the period 2000-2015 estimates an average cleared area of 8300 ha/yr which then increases to 13,100 ha/yr during 2020–2025 and 16,100 ha/yr in the following period 2025–2030.
This expansion of non-industrial agriculture is mainly fueled by staple crops such as groundnuts, corn, cassava, plantains and bananas, and to a lesser extent by smallholder oil palm plantations and beans (Figure 2, right). Further drivers of deforestation include the expansion of infrastructure (almost constantly at 2500 ha/yr accounting for 16% of total deforestation), and industrial plantations that contribute substantially (12,300 ha or 14% of total deforestation) but are assumed to slow down to 780 ha or 5% during the performance period. As a result, the overall projected deforestation for the virtual performance period is 3250 ha/yr (26%) higher than during the virtual reference period.
Both historical and projected deforestation, as presented in Figure 2 are translated into emissions by applying the relevant emission factors derived from carbon stocks presented in Table 4.
The resulting forest reference level (Figure 3) for the virtual performance period 2020–2030 with 5.63 MtCO2/yr is 1.26 MtCO2/yr or 29% higher than the emissions for the reference period. This adjustment is driven by the expansion of smallholder agriculture, from which the associated annual emissions are projected to increase by 48% from 2020–2030, as compared to the virtual reference period 2000–2015.

3.4. Sensitivity of the Reference Level to Input Data

The spread of the results of the Monte Carlo analysis as shown in Figure 4. gives an indication of the sensitivity of the reference level calculation (AD*EF*Adj) where the adjustment term varies across five SSP scenarios. The resulting distribution is skewed to the right (with a skew factor of around 0.40) as can be expected due to the multiplication of normally distributed variables. The assumption of a normal distribution of the data can however be maintained since the skew factor is predominantly < 0.5 [59]. The mean FREL is 4.96 MtCO2/year and the confidence interval is ± 2.19 MtCO2/yr at a 90% confidence level (the z-score multiplier for the SD is 1.64). This means that the true mean value for the FREL lies between 2.73 and 6.78 MtCO2/yr in 90% of the iterations. The aggregated variation of the reference level expressed as the coefficient of the variation (SD divided by the mean) is 27%.

4. Discussion

This article demonstrates the establishment of a forest reference emission level (FREL) adjusted to national circumstances using southern Cameroon as a case study. The results show that during the virtual reference period of 2000–2015, deforestation was mostly driven by the expansion of smallholder agriculture. Using a land use model based on food and feed consumption, deforestation is projected to the future using a virtual performance period spanning 2015–2030, thus leading to an adjusted FREL that lies 26% above historical emission levels over the virtual reference period. There is a great number of parameters in the land use model—population growth, agricultural yields, food losses, to name a few–-that influence the future demand for land. A sensitivity analysis of activity data, emission factors, and the adjustment factor computed with the land use model using Monte Carlo techniques demonstrates that at a 90% confidence level calculated from 1000 calculation iterations, the FREL’s coefficient of variation (CV) is ± 27%, while the CV of its single components varies between 7% and 43%. The remainder of this section is structured into two blocks: The first reviews the limitations of the approach and the uncertainties of the results, whereas the second block discusses the policy implications derived from the findings.

4.1. Uncertainties and Limitations of Approach and Results

Increasing domestic food consumption is the main driver of deforestation. This finding complements and confirms the conclusions of other pieces of research showing that the expansion of non-industrial agriculture is the principle driver of land conversion. This fact has been confirmed through various methodologies including analyses through the political economy lens [60,61,62], expert knowledge [25], analyses of the spatial drivers of deforestation [39,63], scenario trend projection [64] and, last but not least, a review of the Congo Basin countries’ submissions to the UNFCCC [65]. In this study the non-industrial agriculture sector comprises smallholders and medium-sized “elites” landowners without distinction. Local or urban elites are gaining importance in the land use sector in Cameroon [63,66,67]. Not distinguishing between both agent groups is nevertheless justifiable because both groups respond to the same immediate market signals, which are subject to increasing demand for food and feed, as depicted in the land use model (Section 2.5). The results of this study show a relatively modest and even decreasing proportion of agro-industrial plantations. This is due to the conservative methodology adopted: Only clearings with a legal basis, provided by the allocation of sales of standing volumes, are projected to be cleared within the ten years timeframe of the study. This is in line with approved proposals for performance-based jurisdictional REDD+ funding provided by other countries [68,69]. Moreover, the allocation of new concessions is a political endeavor [70] with discretionary elements unknown to the public and therefore neither scale nor location can be predicted in sufficient detail to contribute to an FREL.
Consistency of the FREL with a GHG monitoring system is a challenge for many REDD+ countries [71]. A GHG monitoring system should allow the consistent tracking of AD, EF, and adjustments over time, meaning that each land cover transition should find its respective emission and adjustment factors. The currently available data does not allow for this consistency. This has to do with the aimed-for granularity of the analysis (Tier 3), which generally increases the complexity of monitoring [72] and in this case, over-stretches the degree of granularity of the available data.
For example, the national forest definition (Section 2.2) considers oil palm plantations as non-forest. Activity data (Section 2.3) map agro-industrial oil palm plantations but fail to map out the smallholder oil palm plantations that supply up to two-thirds of the national palm oil harvest [40,73] but are nonetheless classified as forest (if established before 2000) or deforestation in the currently available land cover map. This is mainly due to the technical difficulty of the task and the fact that technical advances in reliably mapping oil palm plantations at different scales have only recently become available [74,75]. Acknowledging this lack, the land use model used for the adjustment of the FREL (Section 2.5) relies on national statistics of oil palm supply rather than on the AD and uses emission factors (Section 2.4) developed for all perennial crops. However, the emission factor for perennial crops is partly derived from sample plots located within cocoa agro-forests. These are, however, considered forests according to the national forest definition (Section 2.2) and should therefore be accounted for as forest degradation. More generally, currently available AD data maps deforestation with unknown post-forest land use that inhibits the application of land use specific EF derived from the NFI, in other words no EF can be associated with remotely sensed deforestation but the land use following the clearing would need to be determined. Further, a definition of land use after conversion, rather than land cover, generally results in lower estimated deforested area as temporarily unstocked areas such as fallow are not considered [76]. Assessment of the land use should potentially be done a few years after clearing, to ensure the correct post-forest land use (or forest regrowth) is identified.
The uncertainty of the FREL calculation is considerable but within the range of results of comparable studies. The coefficient of variation as a measure of uncertainty in biomass estimates ranges from 7% for remaining forest to 27% for cropland. To put this in context, the IPCC recommends applying a default uncertainty of ± 75% for its default (Tier 1) emission factors. Global biomass maps—when aggregated to the national level for Cameroon—and the FAO’s forest resources assessment (FAO FRA) yield relatively consistent results with differences across sources being in the range of 7% to 16% [77]. The authors however also note that on a local scale, differences across global maps are significantly higher. The land use modeling approach to adjusting the FRL certainly increases the transparency of the adjustment term as compared to other approaches. It is an approach that requires a wide range of input data, which raises questions about data reliability beyond the scale of the sensitivity analysis performed in Section 2.6. The literature does notably point out potential problems with national datasets relating to population [78,79] and international trade [80]. Further, challenges relate to data on domestic trade, consumption rates and the characterization of complex multi-crop and multi cropping cycle systems, and the general political situation and stability that could evolve in the next 15 years.
Pertinent datasets and information are not available at present. The UNFCCC reporting guidelines stipulate that all significant gases, pools, and activities shall be covered [16] where the threshold for “significant” is often defined as 10% of total emissions [81]. Forest degradation is a significant source of emissions, as suggested by both qualitative national analyses [25,31] and global studies [25,82,83], the latter placing forest degradation in the range of 25% of total land-based emissions. The main drivers of forest degradation are—listed in decreasing order of available documentation—industrial logging aimed at the international timber market [57,84,85], cocoa encroaching into forests [86,87,88], informal logging for the domestic and regional timber market [89,90,91,92,93,94,95,96], and fuel wood collection [97,98]. None of these drivers of degradation is considered in this study because they are not assessed by activity data mapping and only the industrial logging and cocoa is tracked by national export statistics. In addition, it is not possible to retrieve emission factors for degradation from the one-time national forest inventory performed in 2003/2004. Moreover, not included is forest gain, which is the main element absent from many countries’ submissions to the UNFCCC [65,71]. In the case of southern Cameroon, the forest definition (threshold ≥ 10% canopy cover), available AD and EF from the one-time NFI, as well as the dynamic nature of clearing and regrowth in the shifting cultivation landscape [95,99] make it challenging to effectively report on forest gain.
GHG reporting should be fit for the specific purpose. The virtual FREL described in this paper would qualify for the comparatively lenient requirements of jurisdictional REDD+ results reporting to the UNFCCC. This process is a facilitative, non-intrusive, technical exchange of information rather than a critical assessment of data and approach. However, this FREL requires further improvement, if the aim is to obtain performance-based payments such as those offered by the FCPF Carbon Fund [81]. This is notably due to the lack of coherence between AD, EF, and adjustment as listed above in this section and the resulting use of Tier 1 proxies in the absence of alternative national data. Further, the crediting period should start no longer than two years after the end of the reference period [81], not five years as is the case in this virtual reference level.

4.2. Policy Implications

As outlined in Section 2.1, a number of policy-related choices preceded the virtual FREL developed in this article. Most are straightforward as they adopted the widest possible definition. The forest definition and the scale of the project, however, deserve further discussion.
Forest definitions should be tailored to the specific policy question they address [100]. The current forest definition for Cameroon as stated in the forest code does not have any quantitative parameters. The definition used for the FAO forest resources assessment (FAO FRA) set a high bar of 30% canopy cover to what is considered forest. In contrast, the forest working definition in place for REDD+ and other climate change-related processes in Cameroon aims to cover the widest possible ranges of forest with a minimum canopy cover of 10%. The choice of either forest definition has minimal effects on the forest area in the dense evergreen forests of southern Cameroon which easily fulfill both canopy cover thresholds. It will, however, make a difference in the open forests of the savannah-like northern regions of the country [31,101]. More importantly, picking the appropriate forest definition is crucial for Cameroon as a whole to be or not be considered an HFLD country and is expected to provide preferential access to climate finance [81,102]. While the working definition of forests for REDD+ has not yet been officially adopted in political circles, the entire issue of multiple and conflicting forest definitions raises questions of legitimacy given that each definition serves only the specific needs of the policy process that is en vogue at a given time [103,104].
High-level political risks are pending in the current project area that might drive future deforestation beyond the regular development trajectory. The development of the Heveasud plantation (Figure 1a,b), for instance, is not completed yet and information about the area to be cleared or logged unsustainably [57] in the future is not available. There have also been other development projects initiated but then stalled, such as the Mballam iron ore mine and the associated Kribi-Mballam railway stretching 500 km through thus far densely forested zones of the virtual project area [105,106]. On the other hand, considering these projects for the FREL is difficult to justify, given the low implementation rate of large-scale projects in the past [58]. The ongoing conflict in the Northwest and Southwest administrative regions of the country has had negative impacts on agricultural production and expansion in the conflict region, which might lead to some forest regrowth there. On the other hand, recent agricultural statistics point to a leakage of agricultural production away from the conflict zone to other parts of the country. Implicitly, the socioeconomic pathways underlying the Monte Carlo analysis likely cover the effects of this regional conflict.
To date, 39 countries have submitted FREL’s, some of which have also claimed adjustment. The most commonly used approach in doing so is projecting trends of past deforestation into the future, which is generally considered a robust and conservative approach. Does the modeling approach presented here give rise to “formulating incredibly high deforestation scenarios” [13], as has been reported for other HFLD countries? Not for our case of Southern Cameroon. The average modeled deforestation for the virtual performance period 2020–2030 is 15,900 ha/yr, which is +50% above the reference period 2000–2015 but is exactly equal to deforestation observed in the period 2005–2015. Hence, shortening the reference period from 15 to the last 10 years (which is often the recommended duration of a reference period suggested by performance-based payment schemes [81]) would have the same effect on a reference level as deploying the mechanistic land use model, but without the benefits of having the breakdown per supply chain of the drivers of deforestation.
The scenarios underlying the most contested reference levels proposed for HFLD countries or regions (see for instance [10,13]) follow an ad-hoc narrative, i.e., “what would happen if…?”. This approach differs significantly from the bottom-up, data driven approach presented here, which stands in the scientific tradition of mechanistic land use modeling (for instance [29,107]). For other countries and jurisdictions to capitalize on this methodology, solid data on population, food, and feed consumption and agriculture and wood production are needed. For countries with a low population and low level of agricultural activity, the methodology presented here will yield in low adjustments of the reference level (see [108]).

5. Conclusions and Recommendations

This article aims at determining a transparent FREL adjusted to likely future developments and highlights significant uncertainties associated with this process. Adjustment of reference levels, such as other outcomes of international climate negotiations [109], are sometimes perceived as loopholes putting actual GHG reductions at risk [10]. In that sense, this article contributes to narrowing these loopholes by proposing a transparent approach to determining a FREL adjusted to future circumstances.
This section, consequently, focuses on making concrete suggestions for improving each element of the FREL with the ultimate objective of developing a FREL for a performance-based payment program.
To that end, the overall objective is to create a GHG monitoring system that consistently spans across all components (AD, EF, and adjustment) of a FREL, subject to TCCA principles and policy-related decisions described in Section 2.2.
Creating and improving the necessary data, information and infrastructure is costly and funding is limited. This section therefore aims to define priorities for future working directions.

5.1. Priorities for Improving Activity Data

The alignment of forest definition and AD mapping would also require differentiating natural forest from mono-specific plantations such as rubber and oil palms in the activity data. The technical feasibility of doing so has been demonstrated for other regions in Cameroon [27,110]. Further, the proof of concept is also made for distinguishing cocoa agroforests from full sun cocoa [111], which will be a requirement for aligning the forest definition and AD for REDD+ in the country.
The reference map of all six IPCC classes should place more emphasis on mapping agricultural land uses, given its role as a primary driver of deforestation. The reference map should split agriculture at least by annual and perennial crops with very different carbon densities (see Table 4). Radar-based systems with the capacity to penetrate clouds and detect canopy texture features (such as Sentinel 1) enable the differentiation of different crops and have been applied both in research [111,112,113] and in an operational context [111,114].
Forest loss mapping of all REDD+ activities: AD mapping should encompass all D’s in REDD: Deforestation and forest degradation, as well as carbon stock enhancement.
Deforestation mapping should allow to trace the fate of cleared forest patches, as having data about land use after forest clearing is critical in terms of choosing the relevant emission factor. This will require a frequent update of the reference land cover map, which appears possible using radar sensors such as Sentinel 1 [111,112,115] and the definition of cut-off dates [116,117] given the often rapid consequential transitions between various land uses. For example, perennial plantains are often planted immediately after clearing [118] since they seem to benefit from the nutrient cocktail remaining in the wood ashes but after around three years they are replaced by other (often annual) crops. In short, spatially explicit tracking of drivers of deforestation and degradation across all relevant sectors will be needed.
Forest gain mapping will require long-term time series analysis to retrieve stand age data [119] combined with long-term forest inventory plots [120]. The inclusion of forest gain and/or forest stock enhancement would allow Cameroon to be one of the few REDD+ countries to report an FRL to the UNFCCC, which would testify to a significant improvement in reporting capacity [71]. It should also be noted that defining forest by a minimum crown cover of ≥ 10% might be an impediment to tracking forest gain in the dense forest areas of southern Cameroon [100].
Mapping of deforestation is mandatory. Activity data other than deforestation can be assessed according to two methods: remote sensing, which gives direct evidence of the extent and intensity of an activity [121,122,123], or through the use of proxy data. Using proxy data means that emissions from degradation are inferred from land use activity intensities, typically national statistics on forest use, such as national wood harvest. To assess emissions from selective logging, for instance, national wood harvesting data is combined with biomass expansion factors plus a logging damage factor to the remaining forest stand [57,124,125]. Proxy data are only as reliable as the statistics, which underpin them. Another, issue using proxy data is the overlap of different land uses in space and time. For instance, logging for timber and fuel wood for the local market occurs primarily in fallow areas [95], which have already been cleared once and accounted for as such and therefore pose the risk of double-counting.
The combination of both methods as demonstrated on the local scale [123] might improve results. Acknowledging the technical difficulty of detecting degradation, using forest fragmentation and the associated decrease in tree height and biomass in degraded forest edges has been proposed as a robust spatially explicit workaround [126].

5.2. Priorities for Improving Emission Factors and the Next NFI

A long-term network of forest inventory plots will be a requirement for measuring progress towards sustainable forest management and the enhancement of carbon stocks [120], which necessitates a rapid repetition of the NFI dating from 2003/2004.
Spatial misalignment errors of EF and AD should be avoided by using a stratified approach focused on moist and dry forest regions and systematic sampling inside the strata to ensure adequate coverage of forest types proportional to their area coverage with a higher density compared to the NFI from 2003/2004.
Implementation of a cost-effective NFI repetition cycle of 5-10 years building on the clusters and plots from the NFI 2003/3004 will be key to allow assessment of the change in carbon storage. A too long time-lapse since the last assessment should be avoided to not diminish the value of the NFI 2003/2004.
Densifying the sample grid is important in order to represent (1) all five agro-ecological zones of Cameroon, (2) all land use classes, and (3) drivers of deforestation and forest degradation with due statistical representation.
Forest degradation and enhancement of forest carbon stocks, as well as changes in the carbon stocks in remaining forests need to be, and can be, assessed by repeated measurements of the sample plots.
Balancing density and frequency: There should be a reasonable balance of the number of inventory plots and a short (ideally five-year) repetition cycle to enable a timely assessment of forest degradation and enhancement.
Technical and financial resources to the forest inventory unit in the ministry in charge of forestry should be made available to enable it carry out forest inventory in a repetitive manner 5.3. Adjustment to National Circumstances
Demographic dynamics are expected to be better represented by including data from the third national census of 2015. Alternatively, the possibility of using remotely sensed population data should be exploited [127].
Reliable agricultural statistics at the best possible granular level of detail should be collected. Previously, agricultural statistics were available at the department level in Cameroon but in recent years statistics are only available at the regional level—this is a major degradation of data availability.
Drivers of forest degradation should be represented in the model once relevant AD and EF data become available. This should encompass industrial and smallholder logging, cocoa, and fuel wood consumption.

5.3. From UNFCCC Reporting to Performance-Based Payments

The enhancement of coherence both at the institutional- and technical level are major priorities. Moreover, a content analysis of approved applications for performance-based payments from Central- and West Africa [128] and associated technical assessment reports have revealed simplification as an overarching strategy.
This is true for activity data mapping where a re-aggregated binary forest-non-forest land cover map, for example, yields higher accuracies than a thematic one [128]. This is also true for adjusting reference levels: Declaring deforestation for agro-industrial concessions in the most remote parts of the country as “planned” [68] might indeed appear more intuitive than going to lengths in elucidating the socioeconomic drivers underlying deforestation.
When it comes to ex-ante estimation of emissions reductions (ER’s), the focus will probably need to be put on two to three well-organized supply chains (such as cocoa, oil palm, or industrial logging) with high potential to reduce emissions. The land use modelling approach offers a convenient framework for quantification potential ER’s at the design stage of an ER program, notably for supply chains pursuing a land-sparing strategy. Thereby, projected yield increases resulting from REDD+ interventions translate into potential land sparing, moderated by a discount factors for imperfect translation of yield improvements to spared land. It should be noted, however, that the short-term policy framework of performance-based payment schemes (for instance, the FCPF prescribes a performance period of five years) will make effective implementation and results delivery by REDD+ a major challenge.

Author Contributions

Conceptualization, J.P., B.M. and R.S.; methodology, J.P.; software, A.M. (Aline Mosnier) (land use model), J.P. (Monte Carlo analysis), T.N. (Remote Sensing) and M.D. (NFI assessment); validation, A.M. (Aline Mosnier) (land use model), J.P. (Monte Carlo analysis), T.N. and A.M. (Achille Momo) (Remote Sensing); resources, R.S.; writing—original draft preparation, J.P.; writing—review and editing, B.M., F.K.; visualization, J.P.; supervision, B.M; project administration, F.K.; funding acquisition, F.K.

Funding

This work was supported by the RESTORE+ Project (www.restoreplus.org) which is part of the International Climate Initiative (IKI), supported by the Federal Ministry for the Environment, Nature Conservation, Building and Nuclear Safety (BMU) based on a decision adopted by the German Bundestag. JP and AM received funding under service contracts of MINEPDED and the FCPF. The re-analysis of the national forest inventory data performed by MD was funded by the SilvaCarbon Program (egsc.usgs.gov/silvacarbon).

Acknowledgments

This work was supported by the RESTORE+ Project (www.restoreplus.org) which is part of the International Climate Initiative (IKI), supported by the Federal Ministry for the Environment, Nature Conservation, Building and Nuclear Safety (BMU) based on a decision adopted by the German Bundestag. J.P. and A.M. received supplementary funding under service contracts of MINEPDED and the FCPF. The re-analysis of the national forest inventory data performed by M.D. was funded by the SilvaCarbon Program (egsc.usgs.gov/silvacarbon).

Conflicts of Interest

The authors declare no conflict of interest.

Appendix A

Table A1. Results of the land use model in terms of cropland expansion 2000–2035 for the Southern Cameroon Area (in 1000 ha per 5-year period).
2000–20052005–20102010–20152015–20202020–20252025–20302030–2035
Cassava4.849.598.525.685.997.227.99
Mais5.136.649.558.7511.6315.5719.47
Beans0.020.020.030.020.010.010.00
Millet/Sorghum0.000.000.000.000.000.000.00
Oil palm0.340.330.520.510.600.670.73
Plantain4.825.166.688.4311.2314.2217.67
Ground nuts4.574.616.317.639.2410.2211.66
Banana1.441.212.072.102.683.374.10
Cacao19.8423.0847.5715.5533.5633.5633.56
Cotton0.000.000.000.000.000.000.00

Appendix B

Table A2. List of crops represented in the model and classification as annual or perennial (only with regard to the Emission factor to apply).
Crop NameAnnual/Perennial (for EF Calculation)
BananaAnnual
BeansAnnual
CassavaAnnual
CocoaPerennial
Ground nutAnnual
MaizeAnnual
Oil palmPerennial
PlantainPerennial
RubberPerennial

Appendix C

Table A3. Protocol used to drivers assessment.
Disturbance ClassDescription of Disturbance
InfrastructureGeometric areas with very high reflectance value
CroplandsPermanent small and medium-scale agriculture
Logging (Road, selective) – IndustrialLocated inside allocated logging concessions; signs of logging infrastructure visible
MiningPermanent openings with high, stable reflectance
Natural (Wildfires, windfalls, river meandering and other natural disturbances)Immediate proximity to rivers; fires database
Non-industrial loggingVery short (annual) openings
Road constructionLinear shapes with high reflectance values
Smallholder clearingOpenings for smallholder agriculture (≤ca 1ha) visible for 2–3 years; remainder of all above
The collection of images is available from this website: http://glad.geog.umd.edu/Potapov/Cameroon/Cameroon_index_part2.html.

References

  1. IPCC. Climate Change and Land: An IPCC Special Report on Climate Change, Desertification, Land Degradation, Sustainable land Management, Food Security, and Greenhouse Gas Fluxes in Terrestrial Ecosystems; IPCC: Geneva, Switzerland, 2019. [Google Scholar]
  2. Pachauri, R.K.; Reisinger, A. Climate Change 2007: Synthesis Report. Contribution of Working Groups I, II and III to the Fourth Assessment Report of the Intergovernmental Panel on Climate Change; IPCC: Geneva, Switzerland, 2007. [Google Scholar]
  3. Griscom, B.W.; Adams, J.; Ellis, P.W.; Houghton, R.A.; Lomax, G.; Miteva, D.A.; Schlesinger, W.H.; Shoch, D.; Siikamäki, J.V.; Smith, P.; et al. Natural climate solutions. Proc. Natl. Acad. Sci. USA 2017. [Google Scholar] [CrossRef] [PubMed]
  4. Rockström, J.; Gaffney, O.; Rogelj, J.; Meinshausen, M.; Nakicenovic, N.; Schellnhuber, H.J. A roadmap for rapid decarbonization. Science 2017, 355, 1269–1271. [Google Scholar] [CrossRef] [PubMed]
  5. Fischer, R.; Hargita, Y.; Günter, S. Insights from the ground level? A content analysis review of multi-national REDD+ studies since 2010. Forest Policy Econ. 2016, 66, 47–58. [Google Scholar] [CrossRef]
  6. Da Fonseca, G.A.B.; Rodriguez, C.M.; Midgley, G.; Busch, J.; Hannah, L.; Mittermeier, R.A. No Forest Left Behind. PLoS Biol. 2007, 5, e216. [Google Scholar] [CrossRef] [PubMed]
  7. Obersteiner, M.; Huettner, M.; Kraxner, F.; McCallum, I.; Aoki, K.; Böttcher, H.; Fritz, S.; Gusti, M.; Havlik, P.; Kindermann, G.; et al. On fair, effective and efficient REDD mechanism design. Carbon Balance Manag. 2009, 4, 11. [Google Scholar] [CrossRef]
  8. Griscom, B.; Shoch, D.; Stanley, B.; Cortez, R.; Virgilio, N. Sensitivity of amounts and distribution of tropical forest carbon credits depending on baseline rules. Environ. Sci. Policy 2009, 12, 897–911. [Google Scholar] [CrossRef]
  9. Pirard, R.; Karsenty, A. Climate Change Mitigation: Should “Avoided Deforestation” Be Rewarded? J. Sustain. For. 2009, 28, 434–455. [Google Scholar] [CrossRef]
  10. Seyller, C.; Desbureaux, S.; Ongolo, S.; Karsenty, A.; Simonet, G.; Faure, J.; Brimont, L. The “virtual economy” of REDD+ projects: Does private certification of REDD+ projects ensure their environmental integrity? Int. For. Rev. 2016, 18, 231–246. [Google Scholar] [CrossRef]
  11. Karsenty, A.; Aubert, S.; Brimont, L.; Dutilly, C.; Desbureaux, S.; Ezzine de Blas, D.; Le Velly, G. The Economic and Legal Sides of Additionality in Payments for Environmental Services. Environ. Policy Gov. 2017, 27, 422–435. [Google Scholar] [CrossRef]
  12. Sax, S. Fears of a Dire Precedent as Brazil Seeks Results-based REDD+ Payment. 2019. Available online: https://news.mongabay.com/2019/02/fears-of-a-dire-precedent-as-brazil-seeks-results-based-redd-payment/ (accessed on 16 May 2019).
  13. Dezécache, C.; Salles, J.-M.; Hérault, B. Questioning emissions-based approaches for the definition of REDD+ deforestation baselines in high forest cover/low deforestation countries. Carbon Balance Manag. 2018, 13, 21. [Google Scholar] [CrossRef]
  14. Hein, J.; Guarin, A.; Frommé, E.; Pauw, P. Deforestation and the Paris climate agreement: An assessment of REDD+ in the national climate action plans. Forest Policy Econ. 2018, 90, 7–11. [Google Scholar] [CrossRef]
  15. Forsell, N.; Turkovska, O.; Gusti, M.; Obersteiner, M.; den Elzen, M.; Havlik, P. Assessing the INDCs’ land use, land use change, and forest emission projections. Carbon Balance Manag. 2016, 11, 26. [Google Scholar] [CrossRef] [PubMed]
  16. FAO. From Reference Levels to Results Reporting: REDD+ under the UNFCCC; 2018 update; FAO: Rome, Italy, 2018. [Google Scholar]
  17. Gizachew, B.; Duguma, L.A. Forest Carbon Monitoring and Reporting for REDD+: What Future for Africa? Environ. Manag. 2016, 58, 922–930. [Google Scholar] [CrossRef] [PubMed]
  18. Bucki, M.; Cuypers, D.; Mayaux, P.; Achard, F.; Estreguil, C.; Grassi, G. Assessing REDD+ performance of countries with low monitoring capacities: The matrix approach. Environ. Res. Lett. 2012, 7, 014031. [Google Scholar] [CrossRef]
  19. Pelletier, J.; Martin, D.; Potvin, C. REDD+ emissions estimation and reporting: Dealing with uncertainty. Environ. Res. Lett. 2013, 8, 034009. [Google Scholar] [CrossRef]
  20. Bos, A.B.; De Sy, V.; Duchelle, A.E.; Herold, M.; Martius, C.; Tsendbazar, N.-E. Global data and tools for local forest cover loss and REDD+ performance assessment: Accuracy, uncertainty, complementarity and impact. Int. J. Appl. Earth Obs. Geoinf. 2019, 80, 295–311. [Google Scholar] [CrossRef]
  21. Romijn, E.; De Sy, V.; Herold, M.; Böttcher, H.; Roman-Cuesta, R.M.; Fritz, S.; Schepaschenko, D.; Avitabile, V.; Gaveau, D.; Verchot, L.; et al. Independent data for transparent monitoring of greenhouse gas emissions from the land use sector – What do stakeholders think and need? Environ. Sci. Policy 2018, 85, 101–112. [Google Scholar] [CrossRef]
  22. Mertens, B.; Sunderlin, W.D.; Ndoye, O.; Lambin, E.F. Impact of Macroeconomic Change on Deforestation in South Cameroon: Integration of Household Survey and Remotely-Sensed Data. World Dev. 2000, 28, 983–999. [Google Scholar] [CrossRef]
  23. Bikie, H.; Ndoye, O.; Sunderlin, W.D. L’Impact de la Crise Economique sur les Systemes Agricoles et la Changement du Couvert Forestier Dans la Zone Forestiere Humide du Cameroun; CIFOR Occasional Paper; CIFOR: Bogor Indonesia, 2000. [Google Scholar] [CrossRef]
  24. Ndoye, O.; Kaimowitz, D. Macro-economics, markets and the humid forests of Cameroon, 1967–1997. J. Mod. Afr. Stud. 2000, 38, 225–253. [Google Scholar] [CrossRef]
  25. Tegegne, Y.T.; Lindner, M.; Fobissie, K.; Kanninen, M. Evolution of drivers of deforestation and forest degradation in the Congo Basin forests: Exploring possible policy options to address forest loss. Land Use Policy 2016, 51, 312–324. [Google Scholar] [CrossRef]
  26. Ordway, E.M.; Asner, G.P.; Lambin, E.F. Deforestation risk due to commodity crop expansion in sub- Saharan Africa. Environ. Res. Lett. 2017, 12, 044015. [Google Scholar] [CrossRef]
  27. Ordway, E.M.; Naylor, R.L.; Nkongho, R.N.; Lambin, E.F. Oil palm expansion at the expense of forests in Southwest Cameroon associated with proliferation of informal mills. Nat. Commun. 2019, 10, 114. [Google Scholar] [CrossRef] [PubMed]
  28. Carodenuto, S.; Merger, E.; Essomba, E.; Panev, M.; Pistorius, T.; Amougou, J. A Methodological Framework for Assessing Agents, Proximate Drivers and Underlying Causes of Deforestation: Field Test Results from Southern Cameroon. Forests 2015, 6, 203–224. [Google Scholar] [CrossRef]
  29. Stehfest, E.; van Zeist, W.-J.; Valin, H.; Havlik, P.; Popp, A.; Kyle, P.; Tabeau, A.; Mason-D’Croz, D.; Hasegawa, T.; Bodirsky, B.L.; et al. Key determinants of global land-use projections. Nat. Commun. 2019, 10, 2166. [Google Scholar] [CrossRef]
  30. WWF. Africa: Cameroon, Central African Republic, Gabon, and Republic of the Congo. Available online: https://www.worldwildlife.org/ecoregions/at0126 (accessed on 17 May 2019).
  31. République du Cameroun. Analyse Approfondie Des Options Strategiques Susceptibles De Regler La Deforestation Et La Degradation Dans Rapport Final Analyse Approfondie Des Options Strate- Giques Susceptibles De Regler La Defores- Rapport Final; Republic of Cameroon: Yaoundé, Cameroon, 2017. [Google Scholar]
  32. Potapov, P.V.; Turubanova, S.A.; Hansen, M.C.; Adusei, B.; Broich, M.; Altstatt, A.; Mane, L.; Justice, C.O. Quantifying forest cover loss in Democratic Republic of the Congo, 2000-2010, with Landsat ETM+ data. Remote Sens. Environ. 2012, 122, 106–116. [Google Scholar] [CrossRef]
  33. Olofsson, P.; Foody, G.M.; Stehman, S.V.; Woodcock, C.E. Making better use of accuracy data in land change studies: Estimating accuracy and area and quantifying uncertainty using stratified estimation. Remote Sens. Environ. 2013, 129, 122–131. [Google Scholar] [CrossRef]
  34. Olofsson, P.; Foody, G.M.; Herold, M.; Stehman, S.V.; Woodcock, C.E.; Wulder, M.A. Good practices for estimating area and assessing accuracy of land change. Remote Sens. Environ. 2014, 148, 42–57. [Google Scholar] [CrossRef]
  35. Abena, J.C.; Medjo, R.; Blaise, J.; Salomon, P.; Méfé, N.; Salomon, B.; Fonweban, J.; Lekealem, J. Évaluation des Ressources Forestières Nationales du Cameroun; FAO: Rome, Italy, 2005. [Google Scholar]
  36. Chave, J.; Condit, R.; Aguilar, S.; Hernandez, A.; Lao, S.; Perez, R. Error propagation and scaling for tropical forest biomass estimates. Philos. Trans. R. Soc. B Biol. Sci. 2004, 359, 409–420. [Google Scholar] [CrossRef]
  37. Mokany, K.; Raison, J.; Prokushkin, A. Critical analysis of root: Shoot ratios in terrestrial biomes. Glob. Chang. Biol. 2006, 12, 84–96. [Google Scholar] [CrossRef]
  38. Dees, M. Analysis of Cameroon NFI 2003–2004 for REDD+ Reporting; [Unpublished]; Republic of Cameroon: Yaoundé, Cameroon, 2018. [Google Scholar]
  39. Tyukavina, A.; Hansen, M.C.; Potapov, P.; Parker, D.; Okpa, C.; Stehman, S.V.; Kommareddy, I.; Turubanova, S. Congo Basin forest loss dominated by increasing smallholder clearing. Sci. Adv. 2018, 4, eaat2993. [Google Scholar] [CrossRef] [Green Version]
  40. Ngom, E.; Ndjogui, E.; Nkongho, R.N.; Iyabano, A.; Levang, P.; Miaro, L., III; Feintrenie, L. Diagnostic du Secteur élæicole au Cameroun; CIRAD: Yaoundé Cameroun, 2014. [Google Scholar] [CrossRef]
  41. UN-DESA. World Population Prospects - Population Division-United Nations. 2019. Available online: https://population.un.org/wpp/Graphs/ (accessed on 12 July 2019).
  42. KC, S.; Lutz, W. The human core of the shared socioeconomic pathways: Population scenarios by age, sex and level of education for all countries to 2100. Glob. Environ. Chang. 2017, 42, 181–192. [Google Scholar] [CrossRef] [PubMed] [Green Version]
  43. Dayang, R.; Minya, J. Caracteristiques de l’habitat et Cadre de vie des Populations; BUCREP: Yaoundé, Cameroon, 2015. [Google Scholar]
  44. The World Bank DataBank. 2019. Available online: https://databank.worldbank.org/home.aspx (accessed on 12 July 2019).
  45. Bennett, M.K. Wheat in National Diets. Wheat Stud. 1941, 18. [Google Scholar] [CrossRef]
  46. PAM Cameroon. Analyse Globale de la Sécurité Alimentaire et de la Vulnerabilité (2007); WFP: Yaoundé, Cameroon, 2007. [Google Scholar]
  47. Muhammad, A.; D’Souza, A.; Meade, B.; Micha, R.; Mozaffarian, D. The Influence of Income and Prices on Global Dietary Patterns by Country, Age, and Gender; The World Bank: Washington, DC, USA, 2017. [Google Scholar]
  48. Nkendah, R.; Ako, E.; Tamokwe, B.; Nzouessin, C.; Njoupouognigni, M.; Melingui, E.; Azeufouet, A. Le Commerce Transfrontalier Informel des Produits Agricoles et Horticoles Entre le Cameroun et ses Voisins de la CEMAC: Implications sur la Sécurité Alimentaire Sous régionale; Économie rurale Investment Climate and Business Environment Research Fund (ICBE-RF): Dakar, Sénégal, 2011; p. 324. [Google Scholar]
  49. Gromko, D.; Abdurasulova, G. Climate Change Mitigation and Food Loss and Waste Reduction: Exploring the Business Case; CCAFS: Wageningen, The Netherlands, 2018; p. 54. [Google Scholar]
  50. HLPE-CFS. Food Losses and Waste in the Context of Metropolitan Food and Nutrition Security; HLPE-CFS: Rome, Italy, 2014. [Google Scholar]
  51. FAOSTAT FAOSTAT Gateway. 2019. Available online: http://www.fao.org/faostat/en/#home (accessed on 12 July 2019).
  52. Raintree, J.B.; Warner, K. Agroforestry pathways for the intensification of shifting cultivation. Agrofor. Syst. 1986, 4, 39–54. [Google Scholar] [CrossRef]
  53. IGN. France Cartographies Forestières Historiques et Détaillées du Cameroun Résultats Statistiques Finaux; IGN: Paris, France, 2015. [Google Scholar]
  54. Defourny, P.; Bontemps, S.; Lamarche, S.; Brockmann, C.D.; Wevers, J.; Boettcher, M.; Santoro, M.; Kirches, G.; Moreau, I. Land Cover CCI Product User Guide Version 2.0; ESA: Louvain-la-Neuve, Belgium, 2017. [Google Scholar]
  55. Hansen, M.C.; Potapov, P.V.; Moore, R.; Hancher, M.; Turubanova, S.A.; Tyukavina, A.; Thau, D.; Stehman, S.V.; Goetz, S.J.; Loveland, T.R.; et al. High-resolution global maps of 21st-century forest cover change. Science 2013, 342, 850–853. [Google Scholar] [CrossRef] [Green Version]
  56. Sartoretto, E.; Henriot, C.; Bassalang, M.; Nguiffo, S. How Existing Legal Frameworks Shape Forest Conversion to Agriculture; FAO: Rome, Italy, 2017. [Google Scholar]
  57. Cerutti, P.O.; Poufoun, J.N.; Karsenty, A.; Eba’a, R.; Atyi, A.; Nasi, R.; Fomete Nembot, T. The technical and political challenges of the industrial forest sector in Cameroon. Int. For. Rev. 2016, 18 (Suppl. 1), 25–39. [Google Scholar] [CrossRef]
  58. Feintrenie, L. Agro-industrial plantations in Central Africa, risks and opportunities. Biodivers. Conserv. 2014, 23, 1577–1589. [Google Scholar] [CrossRef]
  59. Bulmer, M.G. Principles of Statistics; Dover Publications: New York, NY, USA, 1979. [Google Scholar]
  60. Tchatchou, B.; Sonwa, D.; Ifo, S.; Tiani, A. Deforestation and Forest Degradation in the Congo Basin: State of Knowledge, Current Causes and Perspectives; CIFOR: Bogor, Indonesia, 2015. [Google Scholar]
  61. Dkamela, G.P.; Brockhaus, M.; Djiegni, F.K.; Schure, J.; Mvondo, S.A. Lessons for REDD + from Cameroon’s past forestry law reform: A political economy analysis. Ecol. Soc. 2014, 19, 30. [Google Scholar] [CrossRef] [Green Version]
  62. Megevand, C.; Dulal, H.; Braune, L.; Wekhamp, J. Deforestation Trends in the Congo Basin; Open Konwledge Repository: Washington, DC, USA, 2013. [Google Scholar]
  63. Austin, K.G.; González-Roglich, M.; Schaffer-Smith, D.; Schwantes, A.M.; Swenson, J.J. Trends in size of tropical deforestation events signal increasing dominance of industrial-scale drivers This. Environ. Res. Lett. 2017, 12. [Google Scholar] [CrossRef]
  64. Galford, G.L.; Soares-Filho, B.S.; Sonter, L.J.; Laporte, N. Will passive protection save Congo forests? PLoS ONE 2015, 10, e0128473. [Google Scholar] [CrossRef]
  65. Sandker, M.; Lee, D.; Crete, P.; Sanz-Sanchez, M. Emerging Approaches to Forest Reference Emission Levels and/or Forest Reference Levels for REDD+; FAO: Rome, Italy, 2014. [Google Scholar]
  66. Njogui, T.E.; Levang, P. Elites urbaines, élaiculture et question foncière au Cameroun. Territoires d’Afrique 2013, 5, 35–46. [Google Scholar]
  67. Levang, P. Le Développement du Palmier à Huile au Cameroun: Entre Accaparements Massifs, Agro-industries, élites et Petits Planteurs; CIRAD, IRD: Montpellier, France, 2012. [Google Scholar]
  68. République du Congo. Document de Programme de Réductions des Émissions (ER-PD). Programme de Réduction des Émissions dans la Sangha et la Likouala, République du Congo Date; Republic of Congo: Brazzaville, Republic of Congo, 2017. [Google Scholar]
  69. Forest Carbon Partnership Facility (FCPF). Emission Reductions Program Document (ER-PD) East Kalimantan Jurisdictional Emission Reductions Program, Indonesia; The World Bank: Washington, DC, USA, 2018. [Google Scholar]
  70. Sonkoue, M.; Nguiffo, S. Apes, Crops and Communities: Land Concessions and Conservation in Cameroon; IIED Briefing: London, UK, 2019. [Google Scholar]
  71. FAO. From Reference Levels to Results Reporting: REDD+ under the UNFCCC; FAO: Rome, Italy, 2017. [Google Scholar]
  72. GOFC-GOLD. A Sourcebook of Methods and Procedures for Monitoring and Reporting Anthropogenic Greenhouse Gas Emissions and Removals Associated with Deforestation, Gains and Losses of Carbon Stocks in Forests Remaining Forests, and Forestation, COP22-1st ed.; Achard, F., Boschetti, L., Brown, S., Brady, M., DeFries, R., Grassi, G., Herold, M., Mollicone, D., Mora, B., Pandey, D., et al., Eds.; Wageningen University: Wageningen, The Netherlands, 2016. [Google Scholar]
  73. Nkongho, R.; Nchanji, Y.; Tataw, O.; Levang, P. Less oil but more money! Artisanal palm oil milling in Cameroon. Afr. J. Agric. Res. 2014, 9, 1586–1596. [Google Scholar]
  74. Chong, K.L.; Kanniah, K.D.; Pohl, C.; Tan, K.P. A review of remote sensing applications for oil palm studies. Geo-Spat. Inf. Sci. 2017, 20, 184–200. [Google Scholar] [CrossRef] [Green Version]
  75. Miettinen, J.; Gaveau, D.L.A.; Liew, S.C. Comparison of visual and automated oil palm mapping in Borneo. Int. J. Remote Sens. 2019, 40, 8174–8185. [Google Scholar] [CrossRef]
  76. Molinario, G.; Hansen, M.C.; Potapov, P.V.; Tyukavina, A.; Stehman, S.; Barker, B.; Humber, M. Quantification of land cover and land use within the rural complex of the Democratic Republic of Congo. Environ. Res. Lett. 2017, 12, 104001. [Google Scholar] [CrossRef] [Green Version]
  77. Mitchard, E.T.; Saatchi, S.S.; Baccini, A.; Asner, G.P.; Goetz, S.J.; Harris, N.L.; Brown, S. Uncertainty in the spatial distribution of tropical forest biomass: A comparison of pan-tropical maps. Carbon Balance Manag. 2013, 8, 10. [Google Scholar] [CrossRef]
  78. Randall, S.; Coast, E. The quality of demographic data on older Africans. Demogr. Res. 2016, 34, 143–174. [Google Scholar] [CrossRef] [Green Version]
  79. Randall, S. Visibilité et invisibilité statistique en Afrique. Afr. Contemp. 2016, 258, 41. [Google Scholar] [CrossRef]
  80. Richer, E. Trade Data Overview: Cameroon; Forest Trends: Prague, Czech Republic, 2016. [Google Scholar]
  81. FCPF. Carbon Fund Methodological Framework. The Forest Carbon Partnership Facility. 2016. Available online: https://www.forestcarbonpartnership.org/carbon-fund-methodological-framework (accessed on 3 January 2019).
  82. Pearson, T.R.H.; Brown, S.; Murray, L.; Sidman, G. Greenhouse gas emissions from tropical forest degradation: An underestimated source. Carbon Balance Manag. 2017, 12, 3. [Google Scholar] [CrossRef] [Green Version]
  83. Maria Roman-Cuesta, R.; Rufino, M.; Herold, M.; Butterbach-Bahl, K.; Rosenstock, T.S.; Herrero, M.; Ogle, S.; Li, C.; Poulter, B.; Verchot, L.; et al. Hotspots of gross emissions from the land use sector: Patterns, uncertainties, and leading emission sources for the period 2000–2005 in the tropics. Biogeosciences 2016, 13, 4253–4269. [Google Scholar] [CrossRef] [Green Version]
  84. Tsanga, R.; Lescuyer, G.; Cerutti, P.O. What is the role for forest certification in improving relationships between logging companies and communities? Lessons from FSC in Cameroon. Int. For. Rev. 2014, 16, 14–22. [Google Scholar] [CrossRef]
  85. Cerutti, P.O.; Suryadarma, D.; Nasi, R.; Forni, E.; Medjibe, V.; Delion, S.; Bastin, D. The impact of forest management plans on trees and carbon: Modeling a decade of harvesting data in Cameroon. J. For. Econ. 2017, 27, 1–9. [Google Scholar] [CrossRef]
  86. Alemagi, D.; Duguma, L.; Minang, P.A.; Nkeumoe, F.; Feudjio, M.; Tchoundjeu, Z. Intensification of cocoa agroforestry systems as a REDD plus strategy in Cameroon: Hurdles, motivations, and challenges. Int. J. Agric. Sustain. 2015, 13, 187–203. [Google Scholar] [CrossRef]
  87. Nijmeijer, A.; Lauri, P.-É.; Harmand, J.-M.; Saj, S. Carbon dynamics in cocoa agroforestry systems in Central Cameroon: Afforestation of savannah as a sequestration opportunity. Agrofor. Syst. 2019, 93, 851–868. [Google Scholar] [CrossRef]
  88. Nijmeijer, A.; Lauri, P.E.; Harmand, J.M.; Freschet, G.T.; Essobo Nieboukaho, J.D.; Fogang, P.K.; Enock, S.; Saj, S. Long-term dynamics of cocoa agroforestry systems established on lands previously occupied by savannah or forests. Agric. Ecosyst. Environ. 2019, 275, 100–111. [Google Scholar] [CrossRef]
  89. Lescuyer, G.; Cerutti, P.O.; Mendoula, E.E.; Eba, R.; Nasi, R. Chainsaw milling in the Congo Basin. In European Tropical Forest Research Network (ETFRN) News, 52nd ed.; Wit, M., van Dam, J., Cerutti, P.O., Lescuyer, G., Kerrett, R., Mckeown, J.P., Eds.; Tropenbos International: Wageningen, The Netherlands, 2010; pp. 121–128. [Google Scholar]
  90. Cerutti, P.O.; Eba’a Atyi, R.; Mendoula, E.E.; Gumbo, D.; Lescuyer, G.; Moombe, K.; Tsanga, R.; Walker, J. Sub-Saharan Africa’s invisible timber markets. ITTO Trop. For. Update 2017, 26, 3–5. [Google Scholar]
  91. Cerutti, P.O.; Lescuyer, G. The Domestic Market for Small-Scale Chainsaw Milling in Cameroon Present Situation, Opportunities and Challenges; CIFOR: Bogor, Indonesia, 2011. [Google Scholar]
  92. Bayol, N.; Anquetil, F.; Bile, C.; Bollen, A.; Bousquet, M.; Castadot, B.; Cerruti, P.; Kongape, J.A.; Leblanc, M.; Lescuyer, G.; et al. Filière bois d’oeuvre et gestion des forêts naturelles: Les bois tropicaux et les forêts d’Afrique centrale face aux évolutions des marchés. In Les Forêts du Bassin du Congo–État des Forêts 2013; de Wasseig. Neufchâteau: Weyrich, Belgique, 2014. [Google Scholar]
  93. Cerutti, P.O.; Tacconi, L.; Lescuyer, G.; Nasi, R. Cameroon’s Hidden Harvest: Commercial Chainsaw Logging, Corruption, and Livelihoods. Soc. Nat. Resour. 2013, 26, 539–553. [Google Scholar] [CrossRef]
  94. Cerutti, P.O.; Mbongo, M.; Vandenhaute, M. State of the timber sector in Cameroon (2015); FAO and CIFOR: Rome, Italy; Bogor, Indonesia, 2016. [Google Scholar]
  95. Robiglio, V.; Lescuyer, G.; Cerutti, P.O. From Farmers to Loggers: The Role of Shifting Cultivation Landscapes in Timber Production in Cameroon. Small-Scale For. 2013, 12, 67–85. [Google Scholar] [CrossRef]
  96. CIFOR, I. Domestic Markets, Cross-Border Trade and the Role of the Informal Sector in Côte d’Ivoire, Cameroon and the Democratic Republic of the Congo; CIFOR Report for ITTO: Yokohama, Japan, 2016. [Google Scholar]
  97. Eba’a Atyi, R.; Ngouhouo Poufoun, J.; Mvondo Awono, J.-P.; Ngoungoure Manjeli, A.; Sufo Kankeu, R. Economic and social importance of fuelwood in Cameroon. Int. For. Rev. 2016, 18, 52–65. [Google Scholar] [CrossRef]
  98. Schure, J.; Marien, J.-N.; De Wasseige, C.; Drigo, R.; Salbitano, F.; Dirou, S.; Nkoua, M. Contribution of woodfuel to meet the energy needs of the population of Central Africa: Prospects for sustainable management of available resources. In The Forests of the Congo Basin-State of the Forest 2010; Publications Office of the European Union: Luxembourg, 2012; pp. 109–122. [Google Scholar] [CrossRef]
  99. Kanmegne, J. Slash and Burn Agriculture in the Humid Forest Zone of Southern Cameroon: Soil Quality Dynamics, Improved Fallow Management and Farmers’ Perceptions; Wageningen University: Wageningen, The Netherlands, 2004. [Google Scholar]
  100. Chazdon, R.L.; Brancalion, P.H.S.; Laestadius, L.; Bennett-Curry, A.; Buckingham, K.; Kumar, C.; Moll-Rocek, J.; Vieira, I.C.G.; Wilson, S.J. When is a forest a forest? Forest concepts and definitions in the era of forest and landscape restoration. Ambio 2016, 45, 538–550. [Google Scholar] [CrossRef]
  101. Bouvet, A.; Mermoz, S.; Le Toan, T.; Villard, L.; Mathieu, R.; Naidoo, L.; Asner, G.P. An above-ground biomass map of African savannahs and woodlands at 25 m resolution derived from ALOS PALSAR. Remote Sens. Environ. 2018. [Google Scholar] [CrossRef]
  102. Heads of Delegation. Krutu of Paramaribo Joint Declaration on HFLD Climate Finance Mobilization. In Heads of Delegation and Representatives of High Forest Cover and Low Deforestation; Heads of Delegation: Paramaribo, Surinam, 2019. [Google Scholar]
  103. Verchot, L.V.; Zomer, R.; Van Straaten, O.; Muys, B. Implications of country-level decisions on the specification of crown cover in the definition of forests for land area eligible for afforestation and reforestation activities in the CDM. Clim. Chang. 2007, 81, 415–430. [Google Scholar] [CrossRef]
  104. Romijn, E.; Ainembabazi, J.H.; Wijaya, A.; Herold, M.; Angelsen, A.; Verchot, L.; Murdiyarso, D. Exploring different forest definitions and their impact on developing REDD+ reference emission levels: A case study for Indonesia. Environ. Sci. Policy 2013, 33, 246–259. [Google Scholar] [CrossRef]
  105. Business in Cameroon. Portuguese Company Mota-Engil to Build Mbalam-Kribi Railway. Business in Cameroon. 2014. Available online: https://www.businessincameroon.com/mining/0706-4873-portuguese-company-mota-engil-to-build-mbalam-kribi-railway (accessed on 17 July 2019).
  106. Business in Cameroon. Mbalam Mining Agreement between Australian Sundance Resources and Cameroon Lapsed. Business in Cameroon. 2019. Available online: https://www.businessincameroon.com/finance/3101-8808-mbalam-mining-agreement-between-australian-sundance-resources-and-cameroon-lapsed (accessed on 17 July 2019).
  107. Valin, H.; Sands, R.D.; van der Mensbrugghe, D.; Nelson, G.C.; Ahammad, H.; Blanc, E.; Bodirsky, B.; Fujimori, S.; Hasegawa, T.; Havlik, P.; et al. The future of food demand: Understanding differences in global economic models. Agric. Econ. 2014, 45, 51–67. [Google Scholar] [CrossRef]
  108. Mosnier, A.; Mant, R.; Pirker, J.; Bodin, P.; Ndinga, R.; Tonga, P.; Havlik, P.; Bocqueho, G.; Maukonen, P.; Obersteiner, M.; et al. Modelling Land Use Changes in the Republic of the Congo 2000–2030. A report by the REDD-PAC Project; IIASA, COMIFAC, UNEP-WCMC: Laxenburg, Austria; Yaounde, Cameroon; Cambridge, UK, 2015. [Google Scholar]
  109. Maraseni, T.; Reardon-Smith, K. Meeting National Emissions Reduction Obligations: A Case Study of Australia. Energies 2019, 12, 438. [Google Scholar] [CrossRef] [Green Version]
  110. Ordway, E.M.; Naylor, R.L.; Nkongho, R.N.; Lambin, E.F. Oil palm expansion in Cameroon: Insights into sustainability opportunities and challenges in Africa. Glob. Environ. Chang. 2017, 47, 190–200. [Google Scholar] [CrossRef]
  111. Wielaard, N. Satellite Imaging Making Deforestation-Free Cocoa Possible—Satelligence. 2019. Available online: https://satelligence.com/news/satellite-imaging-makingdeforestation-free-cocoa (accessed on 19 June 2019).
  112. Bégué, A.; Arvor, D.; Bellon, B.; Betbeder, J.; de Abelleyra, D.; PD Ferraz, R.; Lebourgeois, V.; Lelong, C.; Simões, M.; R Verón, S. Remote Sensing and Cropping Practices: A Review. Remote Sens. 2018, 10, 99. [Google Scholar] [CrossRef] [Green Version]
  113. Reiche, J.; Verhoeven, R.; Verbesselt, J.; Hamunyela, E.; Wielaard, N.; Herold, M. Characterizing Tropical Forest Cover Loss Using Dense Sentinel-1 Data and Active Fire Alerts. Remote Sens. 2018, 10, 777. [Google Scholar] [CrossRef] [Green Version]
  114. Starling Verify your Forest Impact. 2019. Available online: https://www.starling-verification.com/#ourTestimonies (accessed on 27 September 2019).
  115. Reiche, J.; Hamunyela, E.; Verbesselt, J.; Hoekman, D.; Herold, M. Improving near-real time deforestation monitoring in tropical dry forests by combining dense Sentinel-1 time series with Landsat and ALOS-2 PALSAR-2. Remote Sens. 2018, 204, 147–161. [Google Scholar] [CrossRef]
  116. Gaveau, D.; Sloan, S.; Molidena, E.; Yaen, H.; Sheil, D.; Abram, N.K.; Ancrenaz, M.; Nasi, R.; Quinones, M.; Wielaard, N.; et al. Four Decades of Forest Persistence, Clearance and Logging on Borneo. PLoS ONE 2014, 9, e101654. [Google Scholar] [CrossRef] [Green Version]
  117. Austin, K.G.; Mosnier, A.; Pirker, J.; McCallum, I.; Fritz, S.; Kasibhatla, P.S. Shifting patterns of oil palm driven deforestation in Indonesia and implications for zero-deforestation commitments. Land Use Policy 2017, 69, 41–48. [Google Scholar] [CrossRef] [Green Version]
  118. Kotto-Same, J.; Moukam, A.; Njomgang, R.; Tiki-Manga, T.; Tonye, J.; Diaw, C.; Gockowski, J.; Hauser, S.; Weise, S.; Nwaga, D.; et al. Alternatives to Slash-and-Burn: Summary Report and Synthesis of Phase II in Cameroon; ICRAF: Nairobi, Kenya, 2002. [Google Scholar]
  119. Chazdon, R.; Broadbent, E.N.; Rozendaal, D.M.A.; Bongers, F.; Zambrano, A.M.A.; Aide, T.M.; Balvanera, P.; Becknell, J.M.; Boukili, V.; Brancalion, P.H.; et al. Carbon sequestration potential of second-growth forest regeneration in the Latin American tropics. Sci. Adv. 2016, 2. [Google Scholar] [CrossRef] [PubMed] [Green Version]
  120. Poorter, L.; Bongers, F.; Aide, T.M.; Almeyda Zambrano, A.M.; Balvanera, P.; Becknell, J.M.; Boukili, V.; Brancalion, P.H.; Broadbent, E.N.; Chazdon, R.L.; et al. Biomass resilience of Neotropical secondary forests. Nature 2016, 530, 211–214. [Google Scholar] [CrossRef] [PubMed]
  121. Hirschmugl, M.; Steinegger, M.; Gallaun, H.; Schardt, M. Mapping Forest Degradation due to Selective Logging by Means of Time Series Analysis: Case Studies in Central Africa. Remote Sens. 2014, 6, 756–775. [Google Scholar] [CrossRef] [Green Version]
  122. Kleinschroth, F.; Laporte, N.; Laurance, W.F.; Goetz, S.; Ghazoul, J. Road expansion and persistence in forests of the Congo Basin. Nat. Sustain. 2019. [Google Scholar] [CrossRef]
  123. Sufo Kankeu, R.; Sonwa, D.J.; Eba’a Atyi, R.; Moankang Nkal, N.M. Quantifying post logging biomass loss using satellite images and ground measurements in Southeast Cameroon. J. For. Res. 2016, 27, 1415–1426. [Google Scholar] [CrossRef]
  124. République du Congo. Niveau des Emissions de Référence pour les Forêts-Soumission au Secrétariat CCNUCC; République du Congo: Brazzaville, Republic of Congo, 2016. [Google Scholar]
  125. Mosnier, A.; Mant, R.; Pirker, J.; Makoudjou, A.; Awono, E.; Bodin, B.; Gillet, P.; Havlik, P.; Obersteiner, M.; Kapos, V.; et al. Modelling Land Use Changes in Cameroon 2000–2030; IIASA: Laxenburg, Austria, 2016. [Google Scholar]
  126. Shapiro, A.C.; Aguilar-Amuchastegui, N.; Hostert, P.; Bastin, J.-F. Using fragmentation to assess degradation of forest edges in Democratic Republic of Congo. Carbon Balance Manag. 2016, 11, 11. [Google Scholar] [CrossRef] [PubMed]
  127. Wardrop, N.A.; Jochem, W.C.; Bird, T.J.; Chamberlain, H.R.; Clarke, D.; Kerr, D.; Bengtsson, L.; Juran, S.; Seaman, V.; Tatem, A.J. Spatially disaggregated population estimates in the absence of national population and housing census data. Proc. Natl. Acad. Sci. USA 2018, 115, 3529–3537. [Google Scholar] [CrossRef] [Green Version]
  128. Republic of Côte d’Ivoire. Emissions Reduction Program Document for Taï National Park; Republic of Côte d’Ivoire: Abidjan, Côte d’Ivoire, 2019. [Google Scholar]
Figure 1. Overview of land cover and land allocation in the study area. Land allocation in the form of agro-concessions (thick white outline) and unsustainable logging concessions (Sales of Standing Volumes - SSVs; thin white outline) are located at the coast and in the center of the area.
Forests 10 01095 g001
Figure 2. Reconstructed and projected deforestation from the land use model (stacked bars) as observed by three independent remote sensing products (diamond symbols) on the left and decomposition of modeled non-industrial agricultural drivers per crop (stacked % chart on the right).
Forests 10 01095 g002
Figure 3. Projected emissions during the performance period (top bar) are 29% higher than emissions during the reference period (left bar); the increase is driven by expanding smallholder agriculture for which emissions are projected to increase by 48%.
Forests 10 01095 g003
Figure 4. The results of 1000 Monte Carlo iterations of the reference level calculation; the mean (bold black line) lies within the 2-tailed standard deviation (α = 0.1; thin black lines).
Forests 10 01095 g004
Table 1. Typology of fallow duration as a function of population density in Cameroon. Source: Modified after Gillet et al. (2014).
Population Density (inhab./km2)Cultivation vs. Fallow DurationFallow Multiplier
<202y cultivation, 7y fallow3.5
20–302y cultivation, 5y fallow2.5
>302y cultivation, 3y fallow1.5
Table 2. Activity data, emission factor, and adjustment variables drive the uncertainty of a forest reference level.
DomainPotential Source of Error to AnalyzeUnitNumber of SamplesMeanSD (CV)
ADDeforestation observed 2000–2015ha/year12710,6021837 (17%)
EFForest biomass samplingtCO2/ha45490.1335.39 (7%)
EFNon-Forest biomass samplingtCO2/ha26174.9948 (27%)
AdjPotential development trajectoriesAdjustment multiplier(dimensionless)61.440.12 (42%)
SD = Standard Deviation; CV = Coefficient of Variation (SD/mean); Mean = Arithmetic mean; Adjustment multiplier: Applied to historical smallholder deforestation.
Table 3. Per-driver presentation of the area and proportion of remotely-sensed deforestation observed during the reference period.
Driver of Deforestation (2000–2015) AreaStandard Error (%)
(ha)%
Non-industrial agriculture159,03772.3
Infrastructure10,2604.7
Industrial agriculture30,12813.7
Other20,5219.3
Total219,94710010.45
Table 4. Emission factors and associated uncertainty for five land use transitions developed from the NFI.
Transition of Forest toEmission Factor (tCO2/ha) *Standard Error (±%)
Annual crops **347.714.1
Perennial crops226.831.2
Fallow land332.111.2
Grassland462.35.9
Built-up areas490.14.3
* Comprised of above ground biomass (AGB) and belowground biomass (BGB). ** Comprising 15 crops listed in Table A2 in the annex.

