Article

Detecting Growth Phase Shifts Based on Leaf Trait Variation of a Canopy Dipterocarp Tree Species (Parashorea chinensis)

1
CAS Key Laboratory of Tropical Forest Ecology, Xishuangbanna Tropical Botanical Garden, Chinese Academy of Sciences, Mengla, Menglun 666303, China
2
Center for Plant Ecology, Core Botanical Gardens, Chinese Academy of Sciences, Mengla, Menglun 666303, China
3
Department of Life Sciences, University of Chinese Academy of Sciences, Beijing 100049, China
4
National Forest Ecosystem Research Station at Xishuangbanna, Xishuangbanna Tropical Botanical Garden, Chinese Academy of Sciences, Mengla, Menglun 666303, China
*
Author to whom correspondence should be addressed.
Submission received: 25 September 2020 / Revised: 17 October 2020 / Accepted: 26 October 2020 / Published: 29 October 2020
(This article belongs to the Special Issue Relationship between Forest Ecophysiology and Environment)

Abstract

:
Canopy species need to shift their adaptive strategy to acclimate to very different light environments as they grow from seedlings in the understory to adult trees in the canopy. However, research on how to quantitively detect ecological strategy shifts in plant ontogeny is scarce. In this study, we hypothesize that changes in light and tree height levels induce transitions in ecological strategies, and growth phases representing different adaptive strategies can be classified by leaf trait variation. We examined variations in leaf morphological and physiological traits across a vertical ambient light (represented by the transmittance of diffuse light, %TRANS) and tree height gradient in Parashorea chinensis, a large canopy tree species in tropical seasonal rainforest in Southwestern China. Multivariate regression trees (MRTs) were used to detect the split points in light and height gradients and classify ontogenetic phases. Linear piecewise regression and quadratic regression were used to detect the transition point in leaf trait responses to environmental variation and explain the shifts in growth phases and adaptive strategies. Five growth phases of P. chinensis were identified based on MRT results: (i) the vulnerable phase, with tree height at less than 8.3 m; (ii) the suppressed phase, with tree height between 8.3 and 14.9 m; (iii) the growth release phase, with tree height between 14.9 and 24.3 m; (iv) the canopy phase, with tree height between 24.3 and 60.9 m; and (v) the emergent phase, with tree height above 60.9 m. The suppressed phase and canopy phase represent “stress-tolerant” and “competitive” strategies, respectively. Light conditions drive the shift from the “stress-tolerant” to the “competitive” strategy. These findings help us to better understand the regeneration mechanisms of canopy species in forests.

1. Introduction

Ecological strategies represent adaptations to the intensity of environmental filters involving competition, stress and disturbance [1]. When considered as an operating process for resource allocation, plants’ ecological strategies can be expected to shift from seedling to mature stages [1]. Differences in light requirements among tree species underlie the major changes in vegetation composition during succession [2,3]. Compared with pioneers and understory species, canopy tree species exhibit a greater change in tree stature, and very different light environments occur as they grow up from seedlings and saplings in the understory to adult trees in the canopy. Several forest tree species have different light requirements throughout their developmental stages [4], and ontogenetic variation in traits has received research attention in evaluating the adaptive strategies of specific species [5]. The adaptive strategies of canopy species throughout their ontogeny cannot be characterized by a single style.
Grime [6] proposed that there are three primary adaptive strategies in plants (CSR theory): (1) C-selected strategy, usually with long life span and large organ size, which maximizes resource acquisition to improve competitiveness in stable and productive habitats; (2) R-selected strategy, in which more resources are invested in rapid growth to avoid frequent disturbance events; and (3) S-selected strategy, which favors resource conservation for survival in resource-poor environments. These ecological strategies are expected to be habitat- and stage-specific [7] and are widely accepted in classifying inter-species functional types [8]. However, although CSR theory could also be used to evaluate adaptive strategies in ontogeny [1], it is rarely applied to explain the ontogenetic shifts of adaptive strategies in specific species, especially for tall species in forest canopies.
Leaf morphophysiological traits are the most sensitive indicators of in situ microenvironmental changes from the understory to the canopy life stages of individual species [9], and this leaf trait-based method can be used to classify adaptive strategies in the different growth phases of canopy species. Pierce et al. [10] summarized three main extreme trait syndromes concerned with adaptive strategies: (i) tall plants with large leaves, intermediate leaf economics and intermediate flowering start and flowering period (C-selected strategy); (ii) short plants with small leaves, conservative leaf economic trait values (e.g., low specific leaf area and leaf nitrogen concentrations) and a brief reproductive phase (S-selected strategy); and (iii) short plants with small leaves, highly acquisitive leaf economics and early, prolonged reproductive development (R-selected strategy). This triangle suggests that leaf traits reflect key components of the leaf economics spectrum, and leaf size could provide “a dependable common reference frame for the quantitative comparison of the wider primary adaptive strategies of plants from highly contrasting habitats” [11].
For trees in closed-canopy forests, light levels associated with canopy position and local tree crowding are a major axis of ontogenetic environmental change [12]. As a result, forest tree species have different light requirements throughout their developmental stages [4]. For canopy species at the community level, the leaf mass per area (LMA), photosynthetic capacity at the light saturation point (LSP), light compensation point (LCP) and maximal net assimilation rate (Amax) increase with light availability and tree height [13]. These effects are associated with positive responses of Rubisco, total nitrogen and light-harvesting complex (LHC) polypeptide contents to the vertical light gradient [4]. Not only the light conditions in a habitat but also inherent ontogenetic traits such as size or height growth could also lead to variations in traits [5]. An increasing canopy height can increase hydraulic limitations of the leaf structure, which can increase the leaf tissue density and cell wall thickness and reduce the mesophyll air space, potentially restricting mesophyll conductance to CO2 and photosynthesis [14]. As a result, leaf structure or defense-related traits such as LMA, leaf thickness and leaf carbon content increased monotonically with tree height [15]. Moreover, age- and size-dependent declines in leaf nitrogen concentration and Amax in tall trees were reported [16,17], and reproductive onset [15,18] over the canopy layer could lead plants to invest more resources in competition and affect leaf morphological and physiological adaptations. All these variations in leaf traits throughout the life history of canopy species indicated the existence of strategic shifts in tree ontogeny.
Parashorea chinensis (formerly Shorea chinensis or Shorea wantianshuea), in the family Dipterocarpaceae, is a dominant canopy tree species in the Xishuangbanna tropical seasonal rainforest. Adult individuals of P. chinensis occur in the emergent layer at a height of approximately 60 m [19,20,21]. P. chinensis begins reproducing at 30–40 cm diameter at breast height (DBH) and approximately 60–80 years old [22]; the largest individuals can reach 1.5 m DBH and over 180 years old [23]. P. chinensis is a typical canopy species with shade-tolerant seedlings; previous studies suggested that irradiance is not a limiting factor for seed germination of P. chinensis, and partial shading favored seedling growth [24]. He et al. [25] reported that leaf morphological traits such as LMA have a positive relation with tree height of P. chinensis in the canopy layer, but we still need more ontogenetic evidence to explain the variations in strategy from understory to canopy. In this study, a canopy crane was used to measure morphology and photosynthesis-related leaf traits of sample trees of P. chinensis in the forest at different life stages. The following hypotheses were tested: (1) insufficient ambient light in the understory leads to a stress-tolerant strategy in P. chinensis, and with the growth in tree height, the increased light conditions induce a shift from stress-tolerant strategy to release growth; (2) with the continuous height growth above the main canopy, hydraulic limitation limits plant growth and changes the adaptive strategy to relatively competitive; (3) all these shifts in adaptive strategy can be detected by variation in leaf traits, and based on the threshold level of light or height, the ontogenetic growth of P. chinensis can be classified into several phases. To test these hypotheses, variations in both morphological traits (LMA, leaf area and leaf thickness) and physiological traits (leaf dark respiration rate (Rd), Amax, LCP, LSP, leaf nitrogen content and carbon-nitrogen ratio (C:N ratio)) across a vertical ambient light and tree height (sapling to adult) gradient in P. chinensis were examined, and different growth phases of P. chinensis were also detected by quantitative evaluation of leaf traits in response to height and light variance.

2. Materials and Methods

2.1. Study Area

This study was performed in a tropical seasonal rainforest in Xishuangbanna, Southwestern China (101°34′ E, 21°36′ N). This region is predominated by a typical monsoon climate that alternates between a dry season (November–April) and a rainy season (May–October). The mean air temperature is 21.8 ℃, and the mean annual precipitation is 1493 mm [20].
The tropical seasonal rainforest in this area is distributed in lowlands, valleys and hills with sufficient water supply [19]. The emergent layer of the forest in the present study was dominated by P. chinensis; its canopy can reach an average height > 45 m and approaches approximately 60 m for individuals in the emergent layer. P. chinensis also showed the largest basal area among all the tree species in the 20 ha Xishuangbanna tropical seasonal rainforest dynamics plot (XTRDP) [20]. The main canopy layer (approximately 30 m high) is dominated by Sloanea tomentosa, Pometia pinnata (formerly Pometia tomentosa) and Semecarpus reticulatus [20].
The canopy crane in the same tropical seasonal rainforest (TCT7015-10E, Zoomlion Heavy Industry, Changsha, China) was built in December 2014, approximately 300 m away from the XTRDP. The maximum operational height of this crane is 80 m (the maximum canopy height around the crane is approximately 60 m), and the jib length is 60 m (Figure 1). Centered at the base of the crane, a 120 m × 120 m ancillary plot was established for plant species inventory in 2014. A total of 6928 individuals of 217 woody tree species with a DBH ≥ 1 cm were recorded in the plot of 1.44 ha, and P. chinensis had the highest relative importance values (21.73%) (Table S1). The forest structure and species composition in the crane plot are similar to those in the XTRDP [20].
A total of 21 P. chinensis individuals from 0.6 to 66.5 m tall (with diffuse transmittance from 0.30% to 100%) in the plot were sampled and measured from October to November in 2016 and September to October in 2017, at the end of the rainy season, which is also the main growing season for most local plants. The weather had enough sunny days so we could operate the crane and conduct measurements in the field. In total, 34 workdays were actually taken for field measurements. The tree height of each selected individual was measured with a tape measure from the crane.

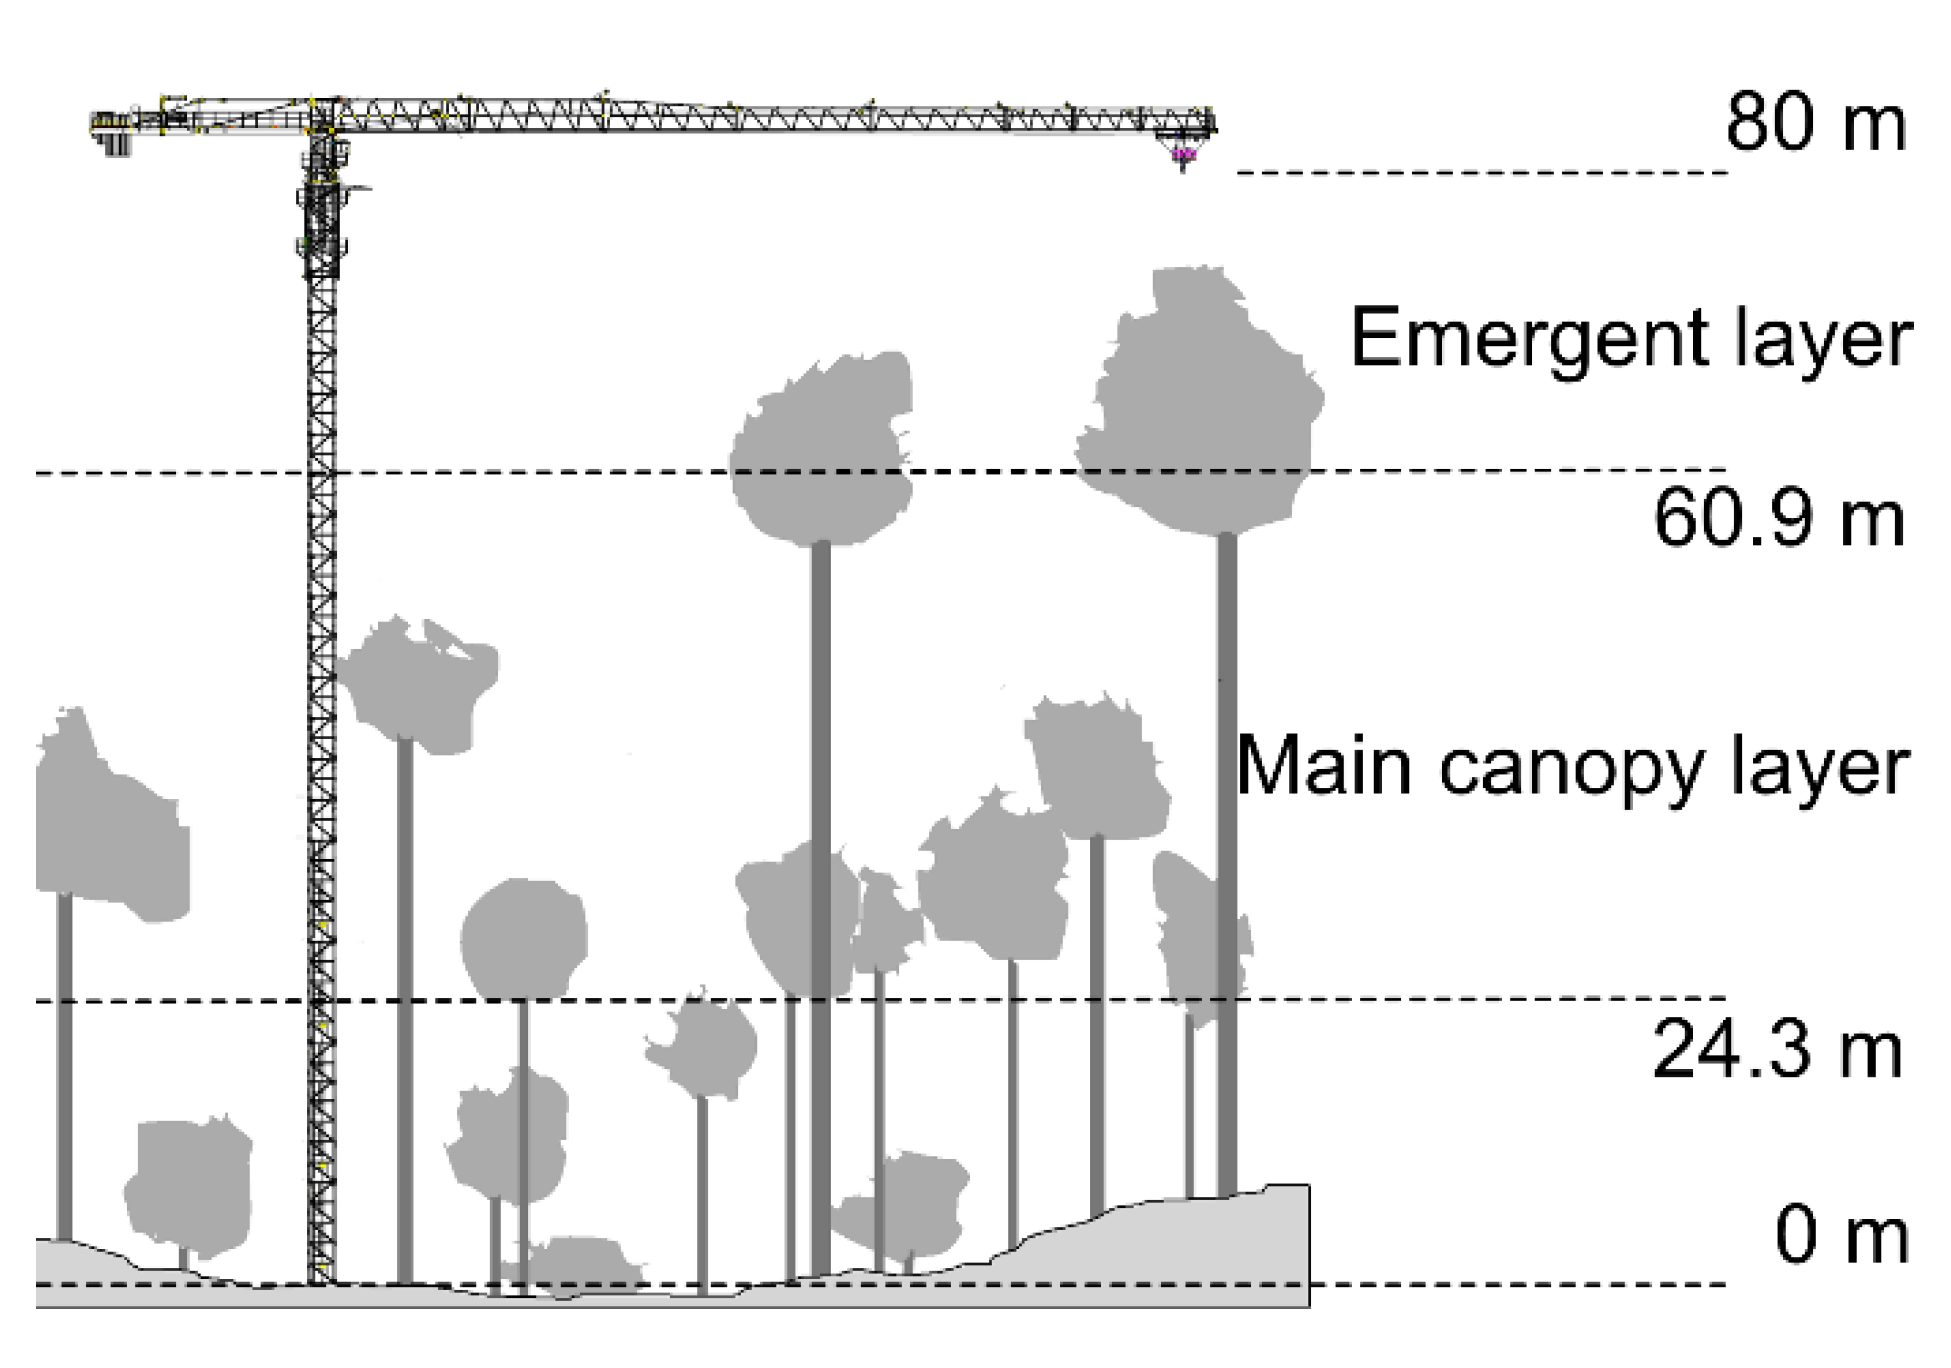
2.2. Light Conditions

The spatial and temporal distribution of light in the understory is quite heterogeneous, and the measurement of direct light becomes difficult for long time spans or with too many samples [26]. Indirect measurements, such as the transmittance of diffuse light (%TRANS, sometimes presented as the diffuse non-interceptance, DIFN), are also acceptable to estimate light conditions. A methodological comparison previously showed that %TRANS measured with LAI-2000 has a good fit with directly measured long-term PPFD in the understory of a tropical forest [26]. In the present study, we measured %TRANS above each sampled tree with LAI-2200 (LI-COR, Inc., Lincoln, NE, USA), an upgraded vision of LAI-2000 (LI-COR, Inc., Lincoln, NE, USA). Open sky measurements were collected on top of the crane, and each individual was measured at the crown top with five repeats. A 270° view cap was used to prevent the crane jib from obstructing the view. The repeated measurements of each individual were used to adjust the open sky measurements with FV2200 software (LI-COR, Inc., Lincoln, NE, USA) and to estimate diffuse transmittance.

2.3. Leaf Dark Respiration Rate (Rd)

Five leaves on sun-exposed terminal shoots were selected from the upper- and outermost crown of each individual, and all measurements (including Rd, light-response curve, leaf area, thickness, LMA, leaf nitrogen and carbon) were performed in same leaf. Prior to sunset (approximately 6.00 p.m.) on the day before the respiration measurements, the leaves were covered with thin aluminum foil so that they were not exposed to sunlight until the measurements. The abaxial side was not completely covered to allow free gas exchange. Because the leaves were covered overnight, the effects on respiration of light-enhanced dark respiration [27] and light-induced metabolites and respiratory gene expression [28] were avoided in the measurements.
The Rd was measured using a portable infrared gas analyzer (LI-6400, LI-COR Inc., Lincoln, NE, USA) at ambient humidity of 60%–90%, while the CO2 concentration was maintained at 400 ppm with the built-in CO2 mixer. The block temperature of the LI-6400 instrument was set to the ambient temperature in this study, approximately 26.9 ± 3.5 ℃ (mean value ± standard deviation), and the vapor pressure deficit (VPD) in the cuvette was maintained at 1.1 ± 0.3 kPa. The system stability was assessed by “stableF” in LI-6400 output, which indicated the comprehensive stability of CO2, H2O and flow in the cuvette, and the value varied from 0 to 1 (1 = stable, 0 = not) (LI-COR 2011). In this measurement, the stability is 0.9 ± 0.1.
Each leaf was measured for 1 min (recorded every 3 s) the following morning (between 8:00 a.m. and 11.00 a.m.) at ambient temperature, and a mean value of 1 min was used as the Rd for each leaf.
After the Rd measurement, leaves with their shoots were cut, and the bases were immersed in deaerated water and transported to the laboratory for additional trait measurements.

2.4. Light-Response Curve

The swinging of the crane basket made it difficult to measure a light-response curve in situ, because this measurement requires clamping a leaf for more than one hour and the photosynthesis of P. chinensis decreased at midday [29]; the use of detached shoots could eliminate these immediate effects of path length and gravity on gas exchange [30]. In this study, we used detached shoots to isolate the influence of any height-related trends in foliar structure on the various gas exchange parameters, a method applied in previous studies on P. chinensis [31]. Although excised branches lead to a reduction in photosynthetic rate and respiration rate [32], the purpose of this study was to detect the tendency of variation in leaf traits between ontogenetic phases rather than measuring the absolute value of traits, so the systematic bias from excising branches was acceptable. The Rd_area in situ and the respiration rate under 0 μmol∙m−2∙s−1 PPFD in the light-response curve (Rd_area’) were consistent, with little bias due to excision (Figure S1).
The light-response curve (A-Q curve) was measured with a LI-6400 instrument equipped with a 6400–02B LED source and CO2 injector. The cuvette CO2 was set to 400 ppm, the relative humidity was 40%–70%, the air flow was 500 μmol∙s−1, the leaf temperature was approximately 30 ℃, the VPD was 1.3 ± 0.4 kPa, and the system stability was 0.9 ± 0.1. After light adaptation under 1000 μmol∙m−2 s−1 (the adaptation time depended on the stomatal situation and was often more than 30 min), the PPFD gradient was set as follows: 1800, 1500, 1200, 900, 600, 300, 150, 70, 30, 15, and 0 μmol∙m−2 s−1. The leaves were allowed to equilibrate for at least 3 min under each PPFD gradient based on the stability of stomatal conductance (gs) (the fluctuation of gs in same leaf in same gradient during 1 min was 1.9 ± 1.7 mmol m−2∙s−1). The instrument was matched before the measurement in each PPFD gradient. The branch samples were measured within 8 h of excision.
The following model was used to analyze the A-Q curve [33]:
A n = A max ( 1 C 0 · e α   ·   PPFD   ·   A max 1 )
where Amax is the area-based maximal net assimilation rate, α is the efficiency of the quantum yield in weak light, and C0 is a constant.
The LSP and LCP calculations were performed using the following equations [33]:
LCP = Amax × ln (C0) × α−1
LSP = Amax × ln (100 × C0) × α−1

2.5. Leaf Mass per Area (LMA), Leaf Nitrogen, and Carbon

After the gas exchange measurements, the leaf lamina thickness of fresh leaves was determined using a digital caliper (accuracy: 0.01 mm, No. 111–101–40, Guanglu Co., Guilin, China) based on the mean value of three repetitive measurements across the lamina while avoiding major veins. The areas of the leaves were measured with a leaf area meter (LI-3000C, LI-COR Inc., Lincoln, NE, USA). After then, all leaves were dried at 60 °C in an oven for 3 days and the leaf dry mass was measured. The petiole of P. chinensis is short (1–3 cm), and we included it in the measurement of leaf area and leaf mass.
The dried leaves were then pulverized, and the leaf nitrogen and carbon contents were determined with an elemental analyzer (Vario ISOTOPE Cube, Elementar Analysensysteme GmbH, Langenselbold, Germany) at the Central Laboratory of Xishuangbanna Tropical Botanical Garden, Chinese Academy of Sciences. Photosynthetic nitrogen use efficiency (PNUE) was calculated by the ratio of the area-based maximal net assimilation rate to leaf nitrogen content per area (Narea) [34].

2.6. Statistical Analysis

The value of light intensity was log-transformed in this study, for light often shows a curved, asymptotic relationship with height [13] and LMA [5,35].
We used multivariate regression trees (MRTs) to cluster growth phases. This method is applied to analyze complex ecological data that may include imbalanced or missing values, nonlinear relationships between variables, and high-order interactions [36]. Height and ln(%TRANS) were explanatory variables, and leaf traits including LCP, LSP, PNUE, C:N ratio, leaf thickness, LMA, Rd_area, Amax_area, Narea, Rd_mass, Amax_mass, Nmass, and leaf area were response variables in MRTs. All variables were standardized in this analysis.
Regression trees are summarized by their size (the number of leaves) and overall fit. Fit is defined by relative error (RE): the total impurity of the leaves divided by the impurity of the root node (the undivided data). RE gives an over-optimistic estimate of how accurately an MRT will predict new data, and predictive accuracy is better estimated from the cross-validated relative error (CVRE). CVRE varies from zero for a perfect predictor to close to one for a poor predictor [36].
The size of the MRT was selected by cross-validation that generates a series of MRTs with only marginally worse predictive ability than the best predictive MRT. From this series, the smallest MRT within one standard error of the best is often selected (the 1-SE rule; [37]).
Because of the discontinuous variation of light availability with increasing tree height, traits such as LMA and leaf area may be highly correlated with light in the lower crown, but the relationships become weaker in the upper crown [5,38]. Hence, linear approaches such as multiple regression could not be used to distinguish the effects of height versus light on these variables [38]. Therefore, linear piecewise regression was used to model traits vs. height (or ln(%TRANS)) to determine the stage at which the trait value may not respond to increasing height (or ln(%TRANS)) levels. Model parameters are presented in Tables S2 and S3.
To better predict the “hump-shaped” variation in traits such as area-based maximal net assimilation rate (Amax_area), leaf area, and the C:N ratio with increasing tree height, quadratic regressions (traits = β0 + β1 × height + β2 × height2) were also used, and the model parameters are presented in Table S4. R program v3.6.0 [39] was used for this data analysis, and MRTs were constructed using the “mvpart” package in R.

3. Results

3.1. Tree Size and Light Availability

Quadratic regressions described the positive relationship between DBH and tree height of P. chinensis very well (height = 2.8598 + 0.8863 × DBH – 0.0030 × DBH2, r2 = 0.973, F = 362.1, P < 0.01; Figure 2). Considering that the tree height could better reflect the effect of hydrostatic limitation, we selected tree height instead of DBH to represent tree size in this study.
Light availability was promoted as a result of increasing tree height up to 27.4 m (r2 = 0.804, F = 54.14, P < 0.01; Figure 3; Table S2), and the transmittance of diffuse light varied from 0.3% at 3.7 m to 100% at ≥ 21.2 m. When a tree grew higher than 27.4 m, the linear model became nonsignificant (r2 = 0.262, F = 3.12, P = 0.13).

3.2. Growth Phases

Based on the 1-SE rule, the CVRE result generated an MRT size of five leaves (when size of tree = 5, CVRE ± SE = 0.544 ± 0.086, RE = 0.204; Figure 4). Four splits were presented in MRT (Figure 5): %TRANS determined the first split (18.33%), and other splits were mainly driven by tree height (8.3, 24.3, 60.9 m; Figure 5).

3.3. Leaf Morphological Trait Transition Point of P. chinensis

LMA had a positive relationship with both tree height (Figure 6a) and light gradient (Figure 6b). The piecewise regression indicated that the LMA of P. chinensis increased significantly with tree height growth up to 21.2 m, although the slope of the linear model decreased at tree heights above 21.2 m (with height < 21.2 m, slope = 2.0735, r2 = 0.853, F = 70.81, P < 0.001; with height ≥ 21.2 m, slope = 0.8900, r2 = 0.490, F = 7.72, P = 0.03; Figure 6a). Increasing light also significantly promoted LMA in the understory (with ln(%TRANS) < −0.278 or diffuse transmittance < 75.73%, r2 = 0.721, F = 34.7, P < 0.001; Figure 6b).
Although the negative relationship between leaf area and tree height above the main canopy layer appeared to be nonsignificant in the linear piecewise regression (with height < 9.1 m, r2 = 0.864, F = 45.27, P < 0.01; with height ≥ 9.1 m, P > 0.05; Figure 6c), quadratic regression of leaf area vs. tree height showed a significant effect (r2 = 0.671, F = 21.35, P < 0.001) and indicated that the highest leaf area appeared at a height of 37.1 m (Table S4).
Leaf area had a significant linear relationship with increasing diffuse light in the understory (with ln(%TRANS) < −0.132 or diffuse transmittance < 87.63%, slope = 10.766, r2 = 0.601, F = 22.06, P < 0.001). After the tree crown was exposed to high light conditions with diffuse transmittance ≥ 87.63%, the leaf area decreased with increasing ln(%TRANS) (Figure 6d). The quadratic regression detected that leaf area vs. ln(%TRANS) had a lower r2 (r2 = 0.449, F = 9.13, P < 0.01) than leaf area vs. tree height (Table S4).
Leaf thickness could increase linearly with increasing tree height (with height < 59.6 m, r2 = 0.595, F = 24.54, P < 0.001 (Figure 6e)), but the linear relationship between leaf thickness and diffuse transmittance was not significant (Figure 6f). Quadratic regression also indicated that leaf thickness and tree height had positive relationship during the whole life history (Figure 6e), and the lowest thickness appeared at 2.50% diffuse transmittance (Figure 6f; Table S4) at the height of around 6.3 m (converted by ln(%TRANS)-height model in Table S2).

3.4. Physiological Trait Transition Point of P. chinensis

Rd_area showed the lowest value at 57.3 m in the quadratic model (Figure 7a), and the height-related piecewise linear model of Rd_area was divided into two parts at 17.5 m (Figure 7a). Rd_area had only one unique significant linear relationship throughout almost all light gradients in piecewise linear regression (Figure 7b).
Amax_area had a “hump-shaped” correlation with tree height growth, a transition point in linear piecewise regression at an intermediate position in the whole height gradient (42.1 m; Figure 7c), and a similar peak value in the quadratic regression of Amax_area vs. tree height (highest Amax_area = 10.7 μmol CO2 m−2 s−1 at 37.7 m high, r2 = 0.766, F = 33.66, P < 0.001). Amax_area had a significant linear correlation with light promotion in the understory (with ln(%TRANS) < −0.278 or diffuse transmittance < 75.73%, r2 = 0.760, F = 42.24, P < 0.001; Figure 7d), but the quadratic model of Amax_area vs. ln(%TRANS) had a lower r2 (r2 = 0.534, F = 12.45, P < 0.001) than leaf area vs. tree height (Table S4).
Narea had a positive relationship with tree height growth, but the slope of the linear model decreased at tree height ≥ 21.2 m (slope = 0.019, r2 = 0.459, F = 6.93, P < 0.05; Figure 7e). Only one significant linear model was detected in the understory (with ln(%TRANS) < −0.278 or diffuse transmittance < 75.73%, r2 = 0.660, F = 26.22, P < 0.001; Figure 7f).
The increase in tree height significantly reduced Rd_mass up to 17.5 m (r2 = 0.700, F = 26.73, P < 0.01), and the quadratic model indicated the lowest Rd_mass occurring at 43.5 m (Figure 8a). The quadratic term in quadratic regression of Rd_mass vs. ln(%TRANS) was nonsignificant (P > 0.05; Table S4), and Rd_mass linearly decreased throughout the process of light improvement (r2 = 0.719, F = 52.08, P < 0.01; Figure 8b).
Mass-based maximal net assimilation rate (Amax_mass) had a “hump-shaped” curve with both height (Figure 8c) and light (Figure 8d) gradient. Amax_mass had a significant negative relationship with tree height growth beginning at a height of 4.6 m (piecewise regression: r2 = 0.425, F = 12.09, P < 0.01; Figure 8c) or 43.5 m (quadratic regression: r2 = 0.778, F = 35.98, P < 0.001), and light condition improvement only significantly reduced Amax_mass once more than 3.5% of the transmittance consisted of diffuse light in piecewise linear regression (or −3.352 in ln(%TRANS); r2 = 0.606, F = 20.96, P < 0.01; Figure 8d), or 8.22% of diffuse transmittance in the quadratic model (r2 = 0.477, F = 10.14, P < 0.001, Table S4).
Nmass had the highest value at 39.9 m in the quadratic model (r2 = 0.494, F = 10.77, P < 0.001; Table S4). Piecewise linear regression showed a significant linear increase in Nmass with height growth up to 27.4 m (slope = 0.148, r2 = 0.478, F = 12.9, P < 0.01). Although the quadratic term in the quadratic model of Nmass vs. light was nonsignificant (P > 0.05, Table S4), Nmass only had a significant linear increase with ln(%TRANS) up to −1.808 (representing 16.4% transmittance; slope = 0.7143, r2 = 0.337, F = 6.074, P < 0.05), and the relationship between Nmass and higher height or light gradient was not significant in piecewise regression (Figure 8e,f).
The tendency of PNUE in terms of both height and light was quite similar to that of Amax_mass (Figure 8g,h), and the transition point of the linear piecewise regression in PNUE was 4.6 m in the height model and −3.65 ln(%TRANS) (representing 2.60% transmittance) in the light model. In quadratic regression, the transition point in PNUE was 25.3 m in the height model and 7.23% transmittance in the light model (Table S4).
LCP showed a positive relationship with height (Figure 9a) and light (Figure 9b) in either the linear or quadratic model. In piecewise regression, LCP was stable before the tree height reached 13.5 m (Figure 9a). Subsequently, it increased linearly with tree height growth (r2 = 0.706, F = 24.95, P < 0.001). Although LCP increased with improved light conditions and a transition point at 16.40% transmittance of diffuse light (ln(%TRANS) = −1.808) was observed in piecewise regression, no significant piecewise linear relationship was found between LCP and ln(%TRANS) (Figure 9b).
LSP showed a significantly linear increase with tree height up to 27.4 m (r2 = 0.751, F = 40.28, P < 0.001; Figure 9c), after which the trend became nonsignificant (r2 = 0.077, F = 1.50, P = 0.275). The quadratic model of LSP vs. tree height had a peak value at 41.8 m (Table S4). High light could significantly promote LSP in quadratic regression (r2 = 0.572, F = 14.36, P < 0.001), but the piecewise linear regression was nonsignificant (Figure 9d).
Linear piecewise regression showed a C:N ratio transition point at 27.4 m in the height-related model or 16.40% transmittance (or −1.808 in ln(%TRANS)) in the light-related model, but all the linear models were nonsignificant (P > 0.05; Figure 9e,f). By contrast, the relationship of the C:N ratio vs. height could be predicted by a significant quadratic model (r2 = 0.333, F = 5.99, P < 0.05), and the lowest predicted C:N ratio (18.30) appeared at a height of 37.8 m. In fact, the quadratic model of the C:N ratio vs. height had a higher r2 than the quadratic model of the C:N ratio vs. ln(%TRANS) (r2 = 0.198, F = 3.47, P > 0.05).

4. Discussions

4.1. Relationships between Variations in Leaf Traits

Photosynthetic traits such as respiration rate and LCP play an important role in determining a plant’s tolerance to low light levels [40]. P. chinensis has low LCP and Rd_area in the understory, which allows its seedlings and treelets to conserve carbon better than trees in the canopy stage and to gain carbon better, having net photosynthesis at lower light levels [41]. The trade-off between low respiration rates and high maximum photosynthetic rates of P. chinensis in habitat shift from understory to canopy reflected its change in adaptive strategy: conservation of carbon in shaded habitats, which indicates a “stress-tolerant” strategy; increased photosynthesis in high light environments, representing a competitive strategy. All the strategies described here were inferred only relative to ontogenetic adaptation in P. chinensis, which only reflected the similarity between the leaf traits in the different phases with those of the Grimes’ strategies.
Investing more nitrogen in proteins to limit the light saturation rate of photosynthesis can improve photosynthesis under high light conditions [42]; therefore, P. chinensis has higher Nmass and LSP under high light transmittance (Figure 5f). These increased photosynthetic activities could promote leaf respiration rate in the dark [43], leading to a close negative relationship between Rd_mass and the light gradient (Figure 8b).
Amax_area and LSP increased with tree height in understory but decreased in very tall trees, while Amax_mass and PNUE peaked at low %TRANS (3.50% for Amax_mass and 2.60% for PNUE) and then monotonically decreased with height (Figure 8c,g). This difference between area- and mass-based characteristics was similar to the findings in a previous report on other tropical canopy trees [44] and can probably be attributed to the finding that area-based characteristics mainly depend on LMA, while mass-based characteristics mainly depend on chlorophyll content per unit dry mass [42].
Although He et al. [25] reported that both leaf thickness and LMA have positive correlations with tree height of P. chinensis in the canopy layer, the increasing tendency with increased tree height differs between leaf thickness and LMA. Increasing height seems to be the main factor affecting leaf area throughout ontogeny (Figure 6e) and is correlated with a linear increase in leaf thickness of P. chinensis from seedlings to very tall trees. This pattern corresponds to an increase in palisade and mesophyll cells [42] and results in greater chlorophyll per unit dry mass with tree height growth. However, the leaf area of P. chinensis displayed a quadratic relation with height growth (Figure 6c), and the piecewise linear regression of LMA vs. tree height showed different slopes beginning at a height of 27.4 m (Figure 6a), which demonstrates that the effect of light conditions on LMA must be taken into account in the understory. Although hydraulic limitations with the height gradient can potentially limit leaf development as indicated by increasing LMA [14,35], high light availability could also lead to thicker leaves as a result of thicker palisade mesophyll cell layers, which maximize light capture [45]. The light gradient in the understory could enhance the sensitivity of LMA to the change in tree height, but after the tree crown overtopped the main canopy layer, the saturated light conditions could not further increase LMA. Both light and height conditions contributed to the ontogenetic variability of LMA.

4.2. Growth Phases and Adaptive Strategies of P. chinensis

MRT analysis showed that the leaf trait combinations throughout the ontogeny of P. chinensis could be divided into five phases. The first split was divided by the diffuse transmittance at 18.33%, which indicated the importance of ambient light conditions for leaf trait acclimation in the ontogeny of P. chinensis.
The other three splits were mainly driven by height, at 8.3, 24.3, and 60.9 m. The effects of tree size at 8.3 m may be combined with light acclimation because the height and light are always positively correlated in the understory and within the canopy [5]. The other two splits, at 24.3 and 60.9 m, occurred in trees exposed to a light-saturated environment; thus, other age-specific environmental filters, such as hydraulic limit and reproductive onset, are expected to drive selection towards specific resource-investment strategies for these specific height gradients.
With further combination with the transition points of linear piecewise regression (Tables S2 and S3) (or peak value of the quadratic regression, Table S4) in leaf traits vs. environmental factors, five phases in MRT were redefined as the vulnerable phase, suppressed phase, growth release phase, canopy phase, and emergent phase to better describe the growth strategies in different phases of P. chinensis. Split levels of height and corresponding diffuse transmittance are listed in Table 1.
Tree height less than 8.3 m or diffuse transmittance less than 3.94% (converted by ln(%TRANS)-height model; Table S2) characterize the vulnerable phase. PNUE and Amax_mass have similar transition points around the split point of diffuse transmittance (2.60% for PNUE and 3.50% for Amax_mass in piecewise linear regression, Table S3; 7.23% for PNUE and 8.22% for Amax_mass in quadratic regression, Table S4). Below these values, P. chinensis had a lower PNUE (Figure 8d,h) and Amax_mass (Figure 8b,f), probably due to the extremely low light intensity in the understory, which led to a larger fraction of investment of leaf nitrogen in light harvesting [42]. PNUE is quite closely related to the core leaf economic traits [34]. Low PNUE in the vulnerable phase might indicate that P. chinensis seedlings invested much less photosynthetic product into growth. Some studies have reported that minimum light requirements for species in dipterocarp forests is 1.7–5.2 mol m−2 d−1 or 6%–19% for sun [46]. We also observed that the height growth of P. chinensis seedlings after germination remained unchanged under low transmittance in a greenhouse [24], although high mortality caused by drought, herbivory, and missing occurred within 10 months after germination in the field [47], indicating that P. chinensis seedlings were quite vulnerable in this phase.
The highest PNUE and Amax_mass occurred in the transitional zone between the vulnerable phase and the suppressed phase and subsequently decreased with increasing tree height growth and light. A high PNUE indicates that treelet leaves partition more nitrogen to photosynthetic enzymes (such as Rubisco) [48] and/or have lower mesophyll resistance because of large air spaces and thin cell walls within the lamina [49]. Treelet leaves in the suppressed phase had the lowest Amax_area (Figure 7c,d) and the lowest Narea (Figure 7e,f), similar to saplings in the vulnerable phase, suggesting that the Amax_area in treelet leaves in the suppressed phase is severely limited by low nitrogen content [50]. In the suppressed phase, PNUE and Amax_mass exhibited a continuous and significant linear relationship with light (or height) variation until the canopy phase. That is, P. chinensis was physiologically flexible in its adaptation to light environmental change in the understory. Previous studies have reported that treelets of P. chinensis can survive in the understory for several years [51], which would be a consequence of this strategy, just as many other tropical canopy species can survive in the understory as seedlings or treelets for decades [52,53,54]. Tall seedlings of Shorea leprosula, S. parvifolia, and S. pauciflora in a Sabah rainforest also showed distinctly lower mortality than seedlings shorter than 50 cm [54]. Su [55] observed that seedlings of Pometia pinnata (formerly, P. tomentosa), another canopy tree species in the Xishuangbanna rainforest, had 99.6% mortality before reaching 1.5 m in height; beyond this height, mortality rapidly decreased and remained very low until physiological death, which Silvertown [56] described as Oscar Syndrome. In conclusion, in the suppressed phase, P. chinensis has conservative leaf economic trait values such as a smaller leaf area, lower Amax_area, and lower area-based leaf nitrogen concentration during ontogenesis, and these characters may indicate that the suppressed phase is an S-selected (“stress-tolerant” strategy) phase [10].
P. chinensis had a lower but relatively stable LCP below 16.40% transmittance or 13.5 m in height (piecewise linear regression; Figure 9a,d), which is close to the split point between the suppressed phase and the growth release phase (18.33% transmittance or 14.9 m in height; Table 1). The lower LCP allowed the treelets and saplings to achieve positive carbon gains under lower light intensities [57]. Based on these findings, diffuse transmittance at 18.33% could be suggested as a threshold value dividing the suppressed phase from the growth release phase.
Most leaf traits, including LMA, Narea, Nmass, LSP, leaf area, Rd_area, and Rd_mass, showed significant variations with increasing tree height and light intensity in the growth release phase, in accordance with the hypothesis that tree juveniles exhibit greater intraspecific variability in ecological strategies than adults [1]. The rapid change in leaf traits caused by the improvement of the light environment is the most important feature for the growth release phase of P. chinensis and indicates the conversion of the adaptive strategy from the understory to the canopy.
When the tree crown completely entered the main canopy layer at 24.3 m, the growth release phase ended and the canopy phase began. Ambient light in the canopy phase was close to saturation, and hydraulic limitation was achieved because of increasing trunk height, leaf tissue density, and cell wall thickness and decreased mesophyll air space [14]. The decrease in Rd_mass (Figure 8a) and increase in Nmass (Figure 8e) with height growth were terminated in this phase (transition points: 17.5 m in Rd_mass and 27.4 m in Nmass, piecewise linear regression; Table 1). Furthermore, leaf area-related traits such as LMA (Figure 6a), Rd_area (Figure 7a), and Narea (Figure 7e) continued to vary with height growth, although the model slopes were already reduced (transition points: 21.2 m in LMA, 17.5 m in Rd_area and 21.2 m in Narea, piecewise linear regression; Table 1). The canopy phase had the largest leaf area and the highest Amax_area and Nmass throughout the life history of P. chinensis, implying the highest photosynthetic efficiency in this phase. The leaves of P. chinensis in the canopy layer displayed higher Amax_mass than other local Dipterocarp species [29]; this species does not suffer from irreversible photoinhibition in the uppermost canopy leaves [31]. Although hydraulic limitation becomes a major determinant of photosynthesis in the canopy layer in other tree species [58], Kenzo et al. [59,60] observed that high leaf nitrogen concentration and a well-developed mesophyll structure help to maintain high Amax in the upper-canopy leaves of dipterocarp canopy trees, which explains why the peak value of Amax_area occurred in the canopy phase. In short, the canopy phase was more similar to a C-selected (“competitive” strategy) phase, and higher LMA and Amax_area in this phase implied conservative growth and maximized resource acquisition to improve competitiveness in stable and productive habitats [6,10].
MRT suggests a final phase (emergent phase) at tree height over 60.9 m, which is correlated with the decrease in some leaf traits associated with carbon-gain, including Amax_area (Figure 7c), leaf area (Figure 6c), and leaf C:N ratios (Figure 9e); these traits showed “hump-shaped” patterns with increasing tree height. Quadratic regression predicted that these traits had peak values at specific heights (Amax_area at 37.7 m, leaf area at 37.1 m, and leaf C:N ratios at 37.8 m; Table S4) that were already emergent over the main canopy layer (approximately 30 m) and then decreased with the further growth in tree height. This strategy is similar to other mid- to late-successional species [15,61]. Age- and size-dependent declines in leaf nitrogen concentration could lead to a reduction in Amax in very tall trees [16,17]; this could be a reason for the decreasing Amax_area in the emergent phase. Increased reproductive allocation to nonstructural carbohydrates among very large trees [61] could explain the reduction in nitrogen and Amax, and the increase in leaf C:N ratios (Figure 9e) provides potential support for this hypothesis. Former research in P. chinensis reported that reproduction of this species occurs only after its crown emerges from the main canopy, with DBH approximately 30–40 cm [22], and dipterocarps in Malaysia have a reproductive size threshold of approximately 60 cm in primary forest [62]. This empirical evidence indicated that P. chinensis had a reproductive phase only when the individual became huge and tall enough. In addition, increased mechanical perturbation due to herbivory [63] and wind exposure [64] among large canopy trees is also a potential cause for the declines in leaf nitrogen content and photosynthetic capacity with size. Due to the limit of the crane jib (60 m long), we could sample very few individuals of emergent trees in this phase. More experiments are still required to better support our explanations of the emergent phase in the future.
P. chinensis has larger leaves in the canopy phase than in the suppressed phase and vulnerable phase, but in the emergent phase, leaf area again decreases (Figure 6b). Similar phenomena have been reported for canopy tree species in other tropical forests [18]. Energy-demanding and resource-limited old trees could undergo more morphological than biochemical acclimation [65], and a limited leaf area could better control the leaf temperature, rates of carbon dioxide uptake, and water loss for adaptive acclimation to ambient light promotion in the canopy [66]. The decrease in leaf size in the emergent phase may also be a result of the physiological effects of carbon allocation to reproductive structures [18,61].

5. Conclusions

As a canopy tree species, P. chinensis adapts to light environments both in the understory and canopy throughout its life history. Based on the different strategies of leaf traits during ontogenetic development in response to light and height, five phases of P. chinensis could be recognized: vulnerable phase, suppressed phase, growth release phase, canopy phase, and emergent phase. According to CSR theory [6] and ontogenetic shifts in leaf traits [1,8,10], the suppressed phase and canopy phase could be classified as “stress-tolerant” strategy and “competitive” strategy, respectively, although these strategies were inferred only relative to ontogenetic adaptation in P. chinensis. The vulnerable phase and growth release phase may also not fall into any specific strategies because the trait values in these two phases were quite dynamic: the former was the key phase during which the plant achieved the transformation from seeds to seedlings, and the latter served as a spanning period during which light-related traits overcame suppression by low light in the understory and responded rapidly to change within a narrow height range (14.9–24.3 m) with a large change in ambient light (18.33%–100% transmittance) in the canopy. P. chinensis had lower carbon assimilation in the emergent phase than in the canopy phase, which may be attributed to reproductive allocation strategy, and this deserves more experiments in the future. Our results suggest that this tropical forest canopy species adjusts its adaptive strategy in leaf functional traits to adapt to variation in the ambient light environment and tree size in different life-history stages. The ecological implications of this pattern of change throughout the lifetime of a tree species for the forest growth cycle deserve further investigation in terms of maintaining forest biodiversity.

Supplementary Materials

The following are available online at https://0-www-mdpi-com.brum.beds.ac.uk/1999-4907/11/11/1145/s1, Figure S1: Simple linear regression result for Rd_area’ vs. Rd_area. The solid line indicates the simple linear regression result: Rd_area’ = −0.1210 + 1.0337 × Rd_area, r2 = 0.889, F = 161.6, P < 0.01, Table S1: Species list of the 1.44 ha (120 m × 120 m) canopy crane plot in Xishuangbanna, Southwestern China. This list was based on survey data collected in December 2014 and includes all tree species with DBH ≥ 1 cm, Table S2: Linear piecewise regression results for traits (y) vs. height (x). The following regression models were used: Equation (1): y = a1 + b1 × x, x < transition point; Equation (2): y = a2 + b2 × x, x ≥ transition point, Table S3: Linear piecewise regression results for traits (y) vs. light (represented as ln(%TRANS), x). The following regression models were used: Equation (1): y = a1 + b1 × x, x < transition point; Equation (2): y = a2 + b2 × x, x ≥ transition point, Table S4: Quadratic regression results for traits (y) vs. height or ln(%TRANS) (x). The following regression model was used: y = β0 + β1 × x +β2 × x2.

Author Contributions

M.C., Y.D., and X.D. conceived, designed, and directed the experiments and coordinated this study. Y.D. wrote the manuscript. M.C. improved and edited the manuscript. J.D., W.Z., and T.H. performed the field work. A.N., X.S., and P.F. revised the manuscript. All authors have read and agreed to the published version of the manuscript.

Funding

This work was supported by the Chinese Academy of Sciences 135 Program (No. 2017XTBG-T01) and Field Station Foundation of Chinese Academy of Sciences.

Acknowledgments

We thank Daowei Wu, Jinhai Mu, Xin Dong, Mingzhong Liu, Tao Jiang, and Pinping Zeng for their assistance with the field work and the Public Technical Service Platform of Xishuangbanna Tropical Botanical Garden, Chinese Academy of Sciences, for the chemical analysis.

Conflicts of Interest

The authors declare no conflict of interest.

References

  1. Dayrell, R.L.C.; Arruda, A.J.; Pierce, S.; Negreiros, D.; Meyer, P.B.; Lambers, H.; Silveira, F.A.O. Ontogenetic shifts in plant ecological strategies. Funct. Ecol. 2018, 32, 2730–2741. [Google Scholar] [CrossRef] [Green Version]
  2. Sack, L.; Grubb, P.J. Why do species of woody seedlings change rank in relative growth rate between low and high irradiance? Funct. Ecol. 2001, 15, 145–154. [Google Scholar] [CrossRef] [Green Version]
  3. Valladares, F. Light heterogeneity and plants: From ecophysiology to species coexistence and biodiversity. In Progress in Botany; Esser, K., Lüttge, U., Beyschlag, W., Hellwig, F., Eds.; Springer: Berlin, Germany, 2003; pp. 439–471. [Google Scholar]
  4. Coopman, R.E.; Briceno, V.F.; Corcuera, L.J.; Reyes-Diaz, M.; Alvarez, D.; Saez, K.; Garcia-Plazaola, J.I.; Alberdi, M.; Bravo, L.A. Tree size and light availability increase photochemical instead of non-photochemical capacities of Nothofagus nitida trees growing in an evergreen temperate rain forest. Tree Physiol. 2011, 31, 1128–1141. [Google Scholar] [CrossRef] [PubMed] [Green Version]
  5. Cavaleri, M.A.; Oberbauer, S.F.; Clark, D.B.; Clark, D.A.; Ryan, M.G. Height is more important than light in determining leaf morphology in a tropical forest. Ecology 2010, 91, 1730–1739. [Google Scholar] [CrossRef] [PubMed]
  6. Grime, J.P. Evidence for the existence of three primary strategies in plants and its relevance to ecological and evolutionary theory. Am. Nat. 1977, 111, 1169–1194. [Google Scholar] [CrossRef]
  7. Grubb, P.J. The maintenance of species-richness in plant communities: The importance of the regeneration niche. Biol. Rev. 1977, 52, 107–145. [Google Scholar] [CrossRef]
  8. Pierce, S.; Negreiros, D.; Cerabolini, B.E.L.; Kattge, J.; Díaz, S.; Kleyer, M.; Shipley, B.; Wright, S.J.; Soudzilovskaia, N.A.; Onipchenko, V.G.; et al. A global method for calculating plant CSR ecological strategies applied across biomes world-wide. Funct. Ecol. 2017, 31, 444–457. [Google Scholar] [CrossRef]
  9. Lloyd, J.; Patiño, S.; Paiva, R.Q.; Nardoto, G.B.; Quesada, C.A.; Santos, A.J.B.; Baker, T.R.; Brand, W.A.; Hilke, I.; Gielmann, H.; et al. Optimisation of photosynthetic carbon gain and within-canopy gradients of associated foliar traits for Amazon forest trees. Biogeosciences 2010, 7, 1833–1859. [Google Scholar] [CrossRef] [Green Version]
  10. Pierce, S.; Brusa, G.; Vagge, I.; Cerabolini, B.E.L. Allocating CSR plant functional types: The use of leaf economics and size traits to classify woody and herbaceous vascular plants. Funct. Ecol. 2013, 27, 1002–1010. [Google Scholar] [CrossRef] [Green Version]
  11. Pierce, S.; Brusa, G.; Sartori, M.; Cerabolini, B.E.L. Combined use of leaf size and economics traits allows direct comparison of hydrophyte and terrestrial herbaceous adaptive strategies. Ann. Bot. 2012, 109, 1047–1053. [Google Scholar] [CrossRef] [Green Version]
  12. Pacala, S.W.; Canham, C.D.; Saponara, J.; Silander, J.A.; Kobe, R.K.; Ribbens, E. Forest models defined by field measurements: Estimation, error analysis and dynamics. Ecol. Monogr. 1996, 66, 1–43. [Google Scholar] [CrossRef]
  13. Kenzo, T.; Inoue, Y.; Yoshimura, M.; Yamashita, M.; Tanaka-Oda, A.; Ichie, T. Height-related changes in leaf photosynthetic traits in diverse Bornean tropical rain forest trees. Oecologia 2015, 177, 191–202. [Google Scholar] [CrossRef] [PubMed]
  14. Koch, G.W.; Sillett, S.C.; Jennings, G.M.; Davis, S.D. The limits to tree height. Nature 2004, 428, 851–854. [Google Scholar] [CrossRef]
  15. Thomas, S.C. Photosynthetic capacity peaks at intermediate size in temperate deciduous trees. Tree Physiol. 2010, 30, 555–573. [Google Scholar] [CrossRef] [PubMed] [Green Version]
  16. Bond, B.J. Age-related changes in photosynthesis of woody plants. Trends Plant Sci. 2000, 5, 349–353. [Google Scholar] [CrossRef]
  17. Niinemets, U. Stomatal conductance alone does not explain the decline in foliar photosynthetic rates with increasing tree age and size in Picea abies and Pinus sylvestris. Tree Physiol. 2002, 22, 515–535. [Google Scholar] [CrossRef] [PubMed] [Green Version]
  18. Thomas, S.C.; Ickes, K. Ontogenetic changes in leaf size in Malaysian rain forest trees. Biotropica 1995, 27, 427–434. [Google Scholar] [CrossRef]
  19. Cao, M.; Zhang, J. Tree species diversity of tropical forest vegetation in Xishuangbanna, SW China. Biodivers. Conserv. 1997, 6, 995–1006. [Google Scholar] [CrossRef]
  20. Cao, M.; Zhu, H.; Wang, H.; Lan, G.; Hu, Y.; Deng, S.Z.X.; Cui, J. Xishuangbanna Tropical Seasonal Rainforest Dynamics Plot: Tree Distribution Maps, Diameter Tables and Species Documentation; Yunnan Science and Technology Press: Kunming, China, 2008. [Google Scholar]
  21. Van der Velden, N.; Ferry Slik, J.W.; Hu, Y.H.; Lan, G.; Lin, L.; Deng, X.; Poorter, L. Monodominance of Parashorea chinensis on fertile soils in a Chinese tropical rain forest. J. Trop. Ecol. 2014, 30, 311–322. [Google Scholar] [CrossRef]
  22. Ying, S.; Shuai, J. Study on fruiting behavior, seedling establishment and population age classes of Parashorea chinensis. Acta Bot. Yunnanica 1990, 12, 415–420. [Google Scholar]
  23. Tang, J.W.; Shi, J.P.; Zhang, G.M.; Bai, K.J. Density, structure and biomass of Papashorea chinensis population in different patches in Xishuangbanna, SW. J. Plant Ecol. 2018, 32, 40–54. [Google Scholar]
  24. Yan, X.F.; Cao, M. Effects of light intensity on seed germination and seedling early growth of Shorea wantianshuea. Chin. J. Appl. Ecol. 2007, 18, 23–29. [Google Scholar]
  25. He, C.X.; Li, J.Y.; Zhou, P.; Guo, M.; Zheng, Q.S. Changes of leaf morphological, anatomical structure and carbon isotope ratio with the height of the Wangtian tree (Parashorea chinensis) in Xishuangbanna, China. J. Integr. Plant Biol. 2008, 50, 168–173. [Google Scholar] [CrossRef] [PubMed]
  26. Engelbrecht, B.M.J.; Herz, H.M. Evaluation of different methods to estimate understorey light conditions in tropical forests. J. Trop. Ecol. 2001, 17, 207–224. [Google Scholar] [CrossRef] [Green Version]
  27. Atkin, O.K.; Evans, J.R.; Siebke, K. Relationship between the inhibition of leaf respiration by light and enhancement of leaf dark respiration following light treatment. Funct. Plant Biol. 1998, 25, 437–443. [Google Scholar] [CrossRef]
  28. Florez-Sarasa, I.; Araújo, W.L.; Wallström, S.V.; Rasmusson, A.G.; Fernie, A.R.; Ribas-Carbo, M. Light-responsive metabolite and transcript levels are maintained following a dark-adaptation period in leaves of Arabidopsis Thaliana. New Phytol. 2012, 195, 136–148. [Google Scholar] [CrossRef]
  29. Meng, L.Z.; Zhang, J.L.; Cao, K.F.; Xu, Z.F. Diurnal changes of photosynthetic characteristics and chlorophyll fluorescence in canopy leaves of four diptocarp species under ex-situ conservation. Acta Phytoecol. Sin. 2005, 29, 976–984. [Google Scholar] [CrossRef] [Green Version]
  30. Woodruff, D.R.; Meinzer, F.C.; Lachenbruch, B.; Johnson, D.M. Coordination of leaf structure and gas exchange along a height gradient in a tall conifer. Tree Physiol. 2009, 29, 261–272. [Google Scholar] [CrossRef] [Green Version]
  31. Zhang, J.L.; Meng, L.Z.; Cao, K.F. Sustained diurnal photosynthetic depression in uppermost-canopy leaves of four dipterocarp species in the rainy and dry seasons: Does photorespiration play a role in photoprotection? Tree Physiol. 2009, 29, 217–228. [Google Scholar] [CrossRef] [Green Version]
  32. Santiago, L.S.; Mulkey, S.S. A test of gas exchange measurements on excised canopy branches of ten tropical tree species. Photosynthetica 2003, 41, 343–347. [Google Scholar] [CrossRef]
  33. Bassman, J.H.; Zwier, J.C. Gas exchange characteristics of Populus trichocarpa, Populus deltoides and Populus trichocarpa x P. deltoides clones. Tree Physiol. 1991, 8, 145–159. [Google Scholar] [CrossRef]
  34. Wright, I.J.; Reich, P.B.; Cornelissen, J.H.C.; Falster, D.S.; Garnier, E.; Hikosaka, K.; Lamont, B.B.; Lee, W.; Oleksyn, J.; Osada, N.; et al. Assessing the generality of global leaf trait relationships. New Phytol. 2005, 166, 485–496. [Google Scholar] [CrossRef] [PubMed]
  35. Coble, A.P.; Cavaleri, M.A. Light acclimation optimizes leaf functional traits despite height-related constraints in a canopy shading experiment. Oecologia 2015, 177, 1131–1143. [Google Scholar] [CrossRef] [PubMed]
  36. De’ath, G. Multivariate regression trees: A new technique for modeling species–environment relationships. Ecology 2002, 83, 1105–1117. [Google Scholar] [CrossRef]
  37. Breiman, L.; Friedman, J.H.; Olshen, R.A.; Stone, C.I. Classification and Regression Trees; Wadsworth International Group: Belmont, CA, USA, 1984. [Google Scholar]
  38. Ishii, H.T.; Jennings, G.M.; Sillett, S.C.; Koch, G.W. Hydrostatic constraints on morphological exploitation of light in tall Sequoia sempervirens trees. Oecologia 2008, 156, 751–763. [Google Scholar] [CrossRef]
  39. R Core Team. A Language and Environment for Statistical Computing; R for Statistical Computing: Vienna, Austria, 2018. [Google Scholar]
  40. Givnish, T.J. Adaptation to sun and shade: A whole-plant perspective. Funct. Plant Biol. 1988, 15, 63–92. [Google Scholar] [CrossRef] [Green Version]
  41. Craine, J.M.; Reich, P.B. Leaf-level light compensation points in shade-tolerant woody seedlings. New Phytol. 2005, 166, 710–713. [Google Scholar] [CrossRef]
  42. Niinemets, Ü. A review of light interception in plant stands from leaf to canopy in different plant functional types and in species with varying shade tolerance. Ecol. Res. 2010, 25, 693–714. [Google Scholar] [CrossRef]
  43. Amthor, J.S. Respiration and Crop Productivity; Springer: New York, NY, USA, 1989. [Google Scholar]
  44. Kenzo, T.; Yoneda, R.; Sano, M.; Araki, M.; Shimizu, A.; Tanaka-Oda, A.; Chann, S. Variations in leaf photosynthetic and morphological traits with tree height in various tree species in a Cambodian tropical dry evergreen forest. JARQ 2012, 46, 167–180. [Google Scholar] [CrossRef] [Green Version]
  45. Oguchi, R.; Hikosaka, K.; Hirose, T. Leaf anatomy as a constraint for photosynthetic acclimation: Differential responses in leaf anatomy to increasing growth irradiance among three deciduous trees. Plant Cell Environ. 2005, 28, 916–927. [Google Scholar] [CrossRef]
  46. Baltzer, J.L.; Thomas, S.C. Determinants of whole-plant light requirements in Bornean rain forest tree saplings. J. Ecol. 2007, 95, 1208–1221. [Google Scholar] [CrossRef]
  47. Yan, X.F.; Cao, M. The endangered causes and protective strategies for Shorea wantianshuea, a tropical rain forest tree species in Xishuangbanna. J. Fujian Sci. Technol. 2008, 35, 187–191. [Google Scholar]
  48. Field, C. Allocating leaf nitrogen for the maximization of carbon gain: Leaf age as a control on the allocation program. Oecologia 1983, 56, 341–347. [Google Scholar] [CrossRef] [PubMed]
  49. Kogami, H.; Hanba, Y.T.; Kibe, T.; Terashima, I.; Masuzawa, T. CO2 transfer conductance, leaf structure and carbon isotope composition of Polygonum cuspidatum leaves from low and high altitudes. Plant Cell Environ. 2001, 24, 529–538. [Google Scholar] [CrossRef]
  50. Ishida, A.; Yazaki, K.; Hoe, A.L. Ontogenetic transition of leaf physiology and anatomy from seedlings to mature trees of a rain forest pioneer tree, Macaranga gigantea. Tree Physiol. 2005, 25, 513–522. [Google Scholar] [CrossRef]
  51. Yan, X.F.; Cao, M. Seeding growth and survival of the endangered tree species Shorea wantianshuea after a mast-fruiting event. J. Plant Ecol. 2008, 32, 55–64. [Google Scholar]
  52. Clark, D.A.; Clark, D.B. Life history diversity of canopy and emergent trees in a neotropical rain forest. Ecol. Monogr. 1992, 62, 315–344. [Google Scholar] [CrossRef]
  53. Connell, J.H.; Green, P.T. Seedling dynamics over thirty-two years in a tropical rain forest tree. Ecology 2000, 81, 568–584. [Google Scholar] [CrossRef]
  54. Still, M.J. Rates of mortality and growth in three groups of dipterocarp seedlings in Sabah, Malaysia. In The Ecology of Tropical Forest Tree Seedlings (Man & The Biosphere Series); Swaine, M.D., Ed.; UNESCO: Paris, France, 1996; Volume 18, pp. 315–332. [Google Scholar]
  55. Su, W.H. Preliminary study on the dynamics of Pometia tomentosa population in the tropical seasonal rain forest of Xishuangbanna. Acta Bot. Yunnanica 1997, 9, 92–96. [Google Scholar]
  56. Silvertown, J. Introduction to Plant Population Ecology; Longman Scientific & Technical: New York, NY, USA, 1987. [Google Scholar]
  57. Kitajima, K. Relative importance of photosynthetic traits and allocation patterns as correlates of seedling shade tolerance of 13 tropical trees. Oecologia 1994, 98, 419–428. [Google Scholar] [CrossRef]
  58. Kitahashi, Y.; Ichie, T.; Maruyama, Y.; Kenzo, T.; Kitaoka, S.; Matsuki, S.; Chong, L.; Nakashizuka, T.; Koike, T. Photosynthetic water use efficiency in tree crowns of Shorea beccariana and Dryobalanops aromatica in a tropical rain forest in Sarawak, East Malaysia. Photosynthetica 2008, 46, 151–155. [Google Scholar] [CrossRef]
  59. Kenzo, T.; Ichie, T.; Yoneda, R.; Kitahashi, Y.; Watanabe, Y.; Ninomiya, I.; Koike, T. Interspecific variation of photosynthesis and leaf characteristics in canopy trees of five species of Dipterocarpaceae in a tropical rain forest. Tree Physiol. 2004, 24, 1187–1192. [Google Scholar] [CrossRef] [Green Version]
  60. Kenzo, T.; Ichie, T.; Watanabe, Y.; Yoneda, R.; Ninomiya, I.; Koike, T. Changes in photosynthesis and leaf characteristics with tree height in five dipterocarp species in a tropical rain forest. Tree Physiol. 2006, 26, 865–873. [Google Scholar] [CrossRef] [Green Version]
  61. Martin, A.R.; Thomas, S.C. Size-dependent changes in leaf and wood chemical traits in two Caribbean rainforest trees. Tree Physiol. 2013, 33, 1338–1353. [Google Scholar] [CrossRef] [Green Version]
  62. Thomas, S.; Appanah, S. On the statistical analysis of reproductive size thresholds in dipterocarp forests. J. Trop. For. Sci. 1995, 27, 412–418. [Google Scholar]
  63. Patankar, R.; Thomas, S.C.; Smith, S.M. A gall-inducing arthropod drives declines in canopy tree photosynthesis. Oecologia 2011, 167, 701–709. [Google Scholar] [CrossRef]
  64. Hossain, S.M.Y.; Caspersen, J.P. In-situ measurement of twig dieback and regrowth in mature Acer saccharum trees. For. Ecol. Manag. 2012, 270, 183–188. [Google Scholar] [CrossRef]
  65. Sillett, S.C.; Van Pelt, R.; Koch, G.W.; Ambrose, A.R.; Carroll, A.L.; Antoine, M.E.; Mifsud, B.M. Increasing wood production through old age in tall trees. For. Ecol. Manag. 2010, 259, 976–994. [Google Scholar] [CrossRef]
  66. Parkhurst, D.F.; Loucks, O.L. Optimal leaf size in relation to environment. J. Ecol. 1972, 60, 505–537. [Google Scholar] [CrossRef]
Figure 1. Vertical profile of the Xishuangbanna tropical seasonal rainforest with the canopy crane.
Forests 11 01145 g001
Figure 2. Relationship between tree height and diameter at breast height (DBH) of P. chinensis. The curve indicates the quadratic regression result.
Forests 11 01145 g002
Figure 3. Relationship between height (x) and ln(%TRANS) (y). Lines indicate linear piecewise regression results; solid lines denote significant relationships (P < 0.05), and broken lines denote nonsignificant relationships. Phase partitions were determined based on the results of multivariate regression tree (MRT). Note that a natural log scale is used on the Y-axis.
Forests 11 01145 g003
Figure 4. Variation in relative error with the size of the multivariate regression tree. Open circles indicate the relative error, and filled circles indicate the cross-validated relative error (CVRE). The vertical bars indicate one standard error for the CVRE, and the dashed line indicates one standard error above the minimum cross-validated relative error.
Forests 11 01145 g004
Figure 5. Multivariate regression tree for the leaf traits data. All data include explanatory variables (height and ln(%TRANS)), and response variables (leaf traits) were standardized in MRT analysis, but the explanatory variables were restored to raw values in this figure for clarity. Bar plots show the multivariate traits’ mean at each node. The cyclical shadings (white, gray, and black) indicate the various traits and run from left to right across the bar plots.
Forests 11 01145 g005
Figure 6. Leaf morphological traits such as LMA, leaf area, and thickness plotted against tree height (a,c,e) and light (represented as ln(%TRANS)) (b,d,f). Lines indicate the linear piecewise regression results; solid lines denote significant relationships (P < 0.05), and broken lines denote nonsignificant relationships. The curves indicate the quadratic regression results. Note that a natural log scale is used on the X-axis in panels (b,d,f).
Forests 11 01145 g006
Figure 7. Area-based physiological traits such as Rd_area, Amax_area, and Narea plotted against tree height (a,c,e) and light (represented as ln(%TRANS)) (b,d,f). Lines indicate the linear piecewise regression results; solid lines denote significant relationships (P < 0.05), and broken lines denote nonsignificant relationships. The curve indicates the quadratic regression result. Note that a natural log scale is used on the x-axis in panels (b,d,f).
Forests 11 01145 g007
Figure 8. Mass-based physiological traits such as Rd_mass, Amax_mass, Nmass, and photosynthetic nitrogen use efficiency (PNUE) plotted against tree height (a,c,e,g) and light (represented as ln(%TRANS)) (b,d,f,h). Lines indicate the linear piecewise regression results; solid lines denote significant relationships (P < 0.05), and broken lines denote nonsignificant relationships. The curve indicates the quadratic regression result. Note that a natural log scale is used on the X-axis in panels (b,d,f,h).
Forests 11 01145 g008
Figure 9. Light compensation point (LCP), light saturation point (LSP), and carbon-nitrogen ratio (C:N ratio) plotted against tree height (a,c,e) and light (represented as ln(%TRANS)) (b,d,f). Lines indicate the linear piecewise regression results; solid lines denote significant relationships (P < 0.05), and broken lines denote nonsignificant relationships. The curve indicates the quadratic regression result. Note that a natural log scale is used on the X-axis in panels (b,d,f).
Forests 11 01145 g009
Table 1. Growth phases and changes in the adaptive strategy of leaf traits of P. chinensis. The letters in the strategy column indicate the following: C-relatively “competitive” strategy; S-relatively “stress-tolerant” strategy.
Growth PhaseTransmittance of Diffuse LightTree HeightDBHStrategyRepresentative Traits
(Variation Tendency)
Emergent100%60.9 m≥96.8 cmLeaf area and Amax_area (decline)
Canopy100%24.3–60.9 m26.7–96.8 cmCLeaf area and Amax_area (highest)
Growth release18.33–100%14.9–24.3 m14.8–26.7 cm_All traits (rapid change)
Suppressed3.94–18.33%8.3–14.9 m6–14.8 cmSLCP (low)
PNUE and Amax_mass (highest)
Vulnerable0–3.94%0–8.3 m<6 cm_LCP (low)
PNUE and Amax_mass (low)
Publisher’s Note: MDPI stays neutral with regard to jurisdictional claims in published maps and institutional affiliations.

