Article

Environmental Effects on Carbon Isotope Discrimination from Assimilation to Respiration in a Coniferous and Broad-Leaved Mixed Forest of Northeast China

1
CAS Key Laboratory of Forest Ecology and Management, Institute of Applied Ecology, Chinese Academy of Sciences, Shenyang 110016, China
2
College of Resources and Environment, University of Chinese Academy of Sciences, Beijing 100049, China
3
Research Station of Changbai Mountain Forest Ecosystems, Chinese Academy of Sciences, Erdaobaihe 133600, China
*
Author to whom correspondence should be addressed.
Submission received: 1 September 2020 / Revised: 16 October 2020 / Accepted: 26 October 2020 / Published: 30 October 2020
(This article belongs to the Special Issue Relationship between Forest Ecophysiology and Environment)

Abstract

:
Carbon (C) isotope discrimination during photosynthetic CO2 assimilation has been extensively studied, but the whole process of fractionation from leaf to soil has been less well investigated. In the present study, we investigated the δ13C signature along the C transfer pathway from air to soil in a coniferous and broad-leaved mixed forest in northeast China and examined the relationship between δ13C of respiratory fluxes (leaf, trunk, soil, and the entire ecosystem) and environmental factors over a full growing season. This study found that the δ13C signal of CO2 from canopy air was strongly imprinted in the organic and respiratory pools throughout C transfer due to the effects of discrimination and isotopic mixing on C assimilation, allocation, and respiration processes. A significant difference in isotopic patterns was found between conifer and broadleaf species in terms of seasonal variations in leaf organic matter. This study also found that δ13C in trunk respiration, compared with that in leaf and soil respiration, was more sensitive to seasonal variations of environmental factors, especially soil temperature and soil moisture. Variation in the δ13C of ecosystem respiration was correlated with air temperature with no time lag and correlated with soil temperature and vapor pressure deficit with a lag time of 10 days, but this correlation was relatively weak, indicating a delayed linkage between above- and belowground processes. The isotopic linkage might be confounded by variations in atmospheric aerodynamic and soil diffusion conditions. These results will help with understanding species differences in isotopic patterns and promoting the incorporation of more influencing factors related to isotopic variation into process-based ecosystem models.

1. Introduction

Stable carbon (C) isotope measurement is a useful tool for disentangling C cycling processes in forest ecosystems, as a unique C isotopic signature is imprinted along the C transfer pathway from CO2 in the atmosphere to C in different ecosystem pools, which is affected by isotopic discrimination (Δ). During photosynthesis, C3 plants discriminate heavily against 13C through photosynthetic discrimination; the resulting C isotopic signature (δ13C) in the photosynthate is more negative compared to the δ13C of atmospheric CO213Cair) and is linearly dependent on the ratio of the intercellular and atmospheric CO2 concentration (ci/ca) [1,2]. After photosynthesis, plants rapidly release photo-assimilated C into the soil, and the post-photosynthetic discrimination effects become involved in a number of biochemical processes alongside mixing and exchange with other C storages, which leads to different δ13C levels among woody plant parts and soil [3,4]. Subsequently, respiration-associated discrimination and the consumption of substrates with different δ13C values further modify the δ13C of respiratory fluxes, resulting in apparent differences between the δ13C of respired CO213CR) and the respiration substrates [5,6,7,8]. The accurate measurement of δ13C in different transfer pathways is important to explore the complexity of the C cycle under the changing climate.
Moreover, the discrimination processes encode biochemical and physiological information into δ13C, and this information is transferred through different stages of the C cycle. Thus, thoroughly investigating δ13C in each C pool and respiratory flux can help evaluate the coupling between each of the processes in the pathways of C cycling. For example, strong evidence of the linkage between plant photosynthesis and soil respiration was found by Kuzyakov and Gavrichkova [9], indicating that the δ13C of soil-respired CO2 may also be related to photosynthetic discrimination via root respiration or exudation. Ecosystem respiration combines the CO2 emitted from leaves, trunks, and soil within the ecosystem, and it also integrates their C isotopic signals. Thus, the δ13C in ecosystem respiration (δ13Ceco) can vary substantially with changes in the relative contribution of the respiration of each component.
Discrimination also encodes information about the dynamics of environmental drivers into δ13C. Seasonal variation in environmental factors, such as vapor pressure deficit (VPD) and soil moisture, influence stomatal conductance, which then alters photosynthetic discrimination and further leads to seasonal dynamics in the δ13C of CO2 respired from leaves [7]. Due to the linkages between the photosynthetic metabolites and the substrates of different respiratory fluxes, several studies also found that changes in environmental drivers may be responsible for seasonal dynamics in the δ13CR of trunks, roots, and soil [10,11,12]. Accordingly, the δ13C of ecosystem respiration, which integrates all respiratory components of the ecosystem, was also found to have significant short-term and seasonal variations [13,14,15], which have been directly or implicitly linked to environmental factors with a time lag. This indicates either a fast linkage between assimilates and ecosystem respiration or a linkage delayed by the time in which the assimilates are transported to the sites of respiration [10,16].
However, a significant response of δ13Ceco to environmental factors does not always exist. For example, McDowell et al. [13] found only a weak relationship between canopy conductance and δ13Ceco over a 2-week period, which they attributed to noncanopy controls, such as belowground respiration on δ13Ceco. Similarly, the results of long-term measurements with high time resolution showed that δ13Ceco was not tightly coupled with environmental factors in some of the study periods [17]. These studies collectively indicate that the response of δ13Ceco to environmental changes is highly variable and that the influence of complicated environmental conditions, combined with other factors, may weaken the linkage between assimilates and ecosystem respiration. Thus, there is a practical need to explore what factors control δ13Ceco and to what extent δ13Ceco reveals the links between C cycling processes.
Photosynthetic discrimination can be calculated at the leaf level by determining the difference between the δ13C of leaf organic matter and δ13Cair [1], or it can be measured online using branch chambers [17]. Alternatively, photosynthetic discrimination can be estimated using the comprehensive Farquhar’s model at a canopy scale by combining δ13C and CO2 flux measurements [18,19]. On the other hand, respiration-associated discrimination can be evaluated by chamber measurements [20,21] using the Keeling plot approach [22,23]. This approach is based on the theory of the two-component gas-mixing model, where δ13CR emerges as the y-intercept of the mixing relationship between δ13C and the inverse of the CO2 concentration (CO2) [24,25]. The Keeling plot approach can also determine the δ13Ceco using nighttime CO2 and δ13C across the vertical profile of the forest [14,17]. Recently, optical laser spectroscopy techniques have allowed in situ continuous monitoring of CO2 isotopes within open forest canopies or closed gas exchange chambers, thus tracing the high-resolved dynamics in δ13Cair, δ13CR, and δ13Ceco over more weather conditions [12,17]. However, few studies have simultaneously measured δ13Cair, δ13CR, and δ13Ceco, which represents a limitation of our knowledge on discrimination in the process of C exchange.
Coniferous and broad-leaved mixed forests are widely distributed in northeast China. These forests are well-protected old-growth virgin forests characterized by rich species diversity as well as high biomass. Previous studies have shown that coniferous and broad-leaved mixed forests are strong C sinks and have experienced climate warming over the past 50 years [26]. To our best knowledge, variations of δ13C in forest storage C pools and respiratory fluxes have mainly been studied in pure forests [17,27,28,29], while mixed forests with multiple tree species have rarely been covered by previous studies [12]. In the present study, we continuously investigated in situ seasonal variations in the δ13Cair and δ13CR of leaves, trunks, and soil as well as δ13Ceco in a 200-year-old coniferous and broad-leaved mixed forest over a full growing season. We also explored the Δ variation of the dominant species in this mixed forest. Firstly, we aimed to identify species-specific differences in photosynthetic Δ and variations in the Δ subsequent photosynthesis in this mixed forest. Secondly, we assessed the environmental effects on seasonal variations in δ13C for CO2 respired by leaves, trunks, and soil as well as the ecosystem. Finally, we tested whether δ13Ceco reveals links between aboveground and belowground processes.

2. Materials and Methods

2.1. Site Description

The study was carried out in a coniferous and broad-leaved mixed forest site (42° 24.149′ N, 128° 05.768′ E, 732 m elevation) in the Changbai mountain natural reserve, Jilin, northeast China. The site is pristine and undisturbed by anthropic activities and characterized by richness of species in both its overstorey and understorey. The density of the trees is about 560 trees ha−1 (stem diameter > 8 cm). Dominant species include one evergreen needle species, Korean pine (Pinus koraiensis), and four deciduous broadleaf species, including Manchurian ash (Fraxinus mandshurica), Mono maple (Acer mono), Mongolian oak (Quercus mongolica), and Tuan linden (Tilia amurensis). P. koraiensis, F. mandshurica, and T. amurensis account for about 40%, 30%, and 20% of the total tree number, respectively, while Q. mongolica and A. mono account for the remaining 10%. The average age of the dominant species has been estimated to be over 200 years, and the mean canopy height is about 26 m. The growing season of the vegetation extends from May to September. The site’s topography is nearly flat. The soil is classified as dark brown forest soil with a depth of 60–100 cm. The climate is temperate, with a mean annual temperature of 3.6 °C and annual precipitation of 695.3 mm measured between 1982 and 2003; over 80% of the rainfall occurs within the growing season.

2.2. Eddy Covariance and Meteorological Measurements

A 62 m high meteorological tower is located at the study site. Temperature and relative humidity probes (HMP155A, Vaisala, Helsinki, Finland) and anemometers (WindSonic1, Campbell Scientific, Logan, UT, USA) were installed at seven heights (2.5, 8, 22, 26, 32, 50, and 60 m) on the tower. A pyranometer (CMP22, Kipp&Zonen, Delft, Netherlands) was installed at 40 m on the tower. Rainfall was measured at 62 m using a rain gauge (TE525MM, Texas Electronics, Dallas, TX, USA). Soil temperature and moisture were measured at a 5 cm depth using a thermocouple burial probe (105E-L, Campbell Scientific, Logan, UT, USA) and a water content reflectometer (CS616, Campbell Scientific, Logan, UT, USA), respectively. All of the meteorological data were recorded via a CR1000X data logger (Campbell Scientific, Logan, UT, USA) at 30 min intervals.
An eddy covariance system was installed on the tower at 40 m above the ground. The system consisted of a three-axis anemometer (WindMaster Pro, Gill Instruments, Lymington, UK) and an open-path CO2/H2O infrared gas analyzer (Li-7500DS, LI-COR, Lincoln, NE, USA). Raw data were collected by a SmartFlux 3 System (LI-COR, Lincoln, NE, USA).

2.3. Canopy CO2 Concentration and Carbon Isotope Composition Profile

In this study, the canopy CO2 and δ13Cair were measured using a wavelength-scanned cavity ring down spectroscopy (WS-CRDS) analyzer (G2201-i, Picarro Inc., Santa Clara, CA, USA). This instrument performed well in measuring the δ13C of CO2 with a 5 min precision of 0.11‰ and a maximum drift of 0.25‰ day−1. Data were collected at about 1 Hz and expressed on the VPDB (Vienna Pee Dee Belemnite) scale.
A profile control system (PRI-8500, PRI-ECO Inc., Beijing, China) was used as a peripheral of the WS-CRDS analyzer to automatically change ports in the δ13C profile measurements (Figure 1a). Air inlets were installed at the seven heights on the tower. Different levels of air were simultaneously pumped from the inlets by a vacuum pump (R410, Rocker Scientific Co., Ltd., Taiwan, China) through 1/4-inch Teflon tubes followed by flow control valves (ASC200-08, AirTAC, Taiwan, China). Each of the inlets was selected and then scanned for 5 min one after another from lower to higher levels through a 16-port rotation valve (Valco Instruments Co. Inc., Houston, TX, USA). The air was pumped into the WS-CRDS analyzer at a flow rate of 30 mL/min using a Picarro external pump. The first minute of each measurement was discarded to remove the data of the response time after the port was switched.
Two standard gases (Std1: 370.7 ppm for CO2 and −20.8709‰ for δ13C; Std2: 799.0 ppm for CO2 and −21.5685‰ for δ13C) were scanned for 15 min once a day to conduct two-point gain and offset calibrations for CO2 measurements and single-point delta value offset calibrations for δ13C measurements [30]. The dependence of δ13C on CO2 for G2201-i was 0.09‰ per 100 ppm in the range of 368.1–550.1 ppm, as tested by Pang et al. [31]. Thus, it can be presumed that the CO2 dependence of δ13C is linear within the small CO2 range (about 400–495 ppm for the air profile measurement and 400–600 ppm for the respiration measurements; see Section 2.4) in the present study. The first 5 min and last 1 min of each standard gas measurement were discarded to remove biased data introduced by port switching.

2.4. Carbon Isotope Composition of CO2 Respired from the Leaves, Trunks, Soil, and Ecosystem

Five ports of the profile control system along with the respiration chambers were used to build a closed-circuit system under non-steady-state conditions [21,32] to conduct measurements of the δ13C in the leaf-, trunk-, and soil-respired CO213CR) (Figure 1a). The outlet of each chamber was directly connected to the rotation valve in the profile control system and then connected to the inlet of the WS-CRDS analyzer. The outlet of the WS-CRDS analyzer, which is the outlet of the Picarro external pump, was divided into five sub-outlets by a 5-way air distribution manifold connected to the inlet of each chamber. All tubes were 1/8-inch Teflon tubes, thereby reducing the system volume and response time.
The leaf chambers were made from cylindrical PET (polyethylene terephthalate) jars (10 cm in diameter and 20 cm in height) (Figure 1b,c). The lid of each jar was fixed on the branch by letting the branch pass through the center of the lid. Mastic tape and silicone sealant were used to fill the space between the branch and the lid to make the leaf chamber airtight. The inlet and the outlet were on the sides and the bottoms of the jar bodies. No fans were installed inside the jars because of limited space.
The trunk chambers were made from cylindrical PP (polypropylene) airtight containers (18 cm in diameter and 9.5 cm in height) (Figure 1b,c). The bottoms of each container were removed, and the rest of the body was fixed onto the trunk using silicone sealant after gently sanding the bark. An inlet and an outlet were located on the lid of the container. A mini fan was installed inside the lid for air mixing.
The soil chamber was made from the same material and of the same size as the trunk chambers (Figure 1b,c). The body of the soil chamber was fixed on a soil collar (16 cm in diameter and 10 cm in height) using hot-melt adhesive. The soil collar was inserted into the soil to a depth of 5 cm. Here, only one soil chamber was used due to the limited number of sampling ports. The leaf chambers and the soil chamber were permanently covered by aluminum foil tape to isolate sunlight and maintain a steady temperature.
Two leaf chambers were installed on a branch of a P. koraiensis and an A. mono. The branches were mature and healthy with a diameter of about 1.5 cm and located at about 5 m in height on the sunny side of the trees. Two trunk chambers were installed on the sunny side of the trunks on a P. koraiensis and a F. mandshurica at breast height (1.3 m). The selected trees and the soil collar were about 5 m apart from each other, thereby sharing similar meteorological and environmental conditions. The chambers were installed one month before the first sampling. Each of the chambers included a silicon sealing ring on the inside of the lid to ensure airtightness. The airtightness of the respiration chamber was tested by connecting a CO2/H2O analyzer (LI-850, LI-COR, Lincoln, NE, USA) to a closed chamber (screwing the body back on the lid for leaf chambers or locking the lid with clamps on the body for trunk and soil chambers). If there was no obvious change in the measured values of CO2 concentration in the chamber when blowing along the joints of the chamber, then the sealing performance was considered good.
The δ13CR measurements were conducted from early May to late September of 2019. To begin measuring, the chamber was first closed after selecting an inlet and an outlet corresponding to the chamber by manually operating the rotation valve and the air distribution manifold. The measurement continued until the internal CO2 concentration increased by about 200 ppm (about 20–40 min for the leaf and trunk chambers and about 5–10 min for the soil chamber), as suggested in [21], and then we switched to the next chamber. The chambers were closed only during measuring. We periodically closed the chambers in the following sequence: the P. koraiensis leaf chamber (L1), the A. mono leaf chamber (L2), the P. koraiensis trunk chamber (T1), the F. mandshurica trunk chamber (T2), and the soil chamber (S1). Four rounds of measurements were conducted from around 7:00 to 18:00 each day. The δ13CR of each measurement was estimated based on the widely used Keeling plot approach [22,23]. The daily δ13CR of the leaf, trunk, and soil was averaged from the four measurements each day.
The δ13Ceco was determined by the Keeling plot approach [22,23] using the nighttime (21:00–03:00) CO2 and δ13Cair profile measurements. Considering that small a CO2 range would cause uncertainties in fitting the Keeling plot [24], we set a restriction that only nights with a CO2 range greater than 60 ppm were used to conduct the regression, and the ordinary least squares regression (OLS, model Ι) was used to obtain the intercept of regression, as suggested by Chen et al. [25].

2.5. Sampling and Carbon Isotope Analysis of the Ecosystem Compartments

Leaves of the five dominant species were collected in the mornings of sunny days once a month from May to September 2019 around the flux tower. Specifically, nine mature trees of each species were randomly selected on each sampling day; then, mature and healthy leaves were collected at three canopy heights (lower, middle, and upper). Since the trees are different in height and the canopy structure is different among species, the three canopy heights of each tree were determined relative to their canopy height range rather than using absolute heights. We collected bark and xylem at breast height and coarse and fine roots of the five species, as well as litters in the undecomposed layer (Oi) and decomposed layer (Oe + Oa) and the soil at four depths (0–5, 5–10, 10–20, and 20–40 cm) with nine replicates around the flux tower at the end of September 2019.
All samples were immediately transported to the lab and dried at 65 °C for 4 days to a constant weight and then ground with a ball mill (MM 400, Retsch, Haan, Germany). The C isotope compositions of nine sample replicates were determined separately using an elemental analyzer (Flash EA1112, Thermo Finnigan, Milan, Italy) coupled with a mass spectrometer (Finnigan MAT 253, Bremen, Germany). The overall precision of the δ13C measurement was < ±0.2‰. All δ13C values are reported on the VPDB (Vienna Pee Dee Belemnite) scale.

2.6. Calculation of Photosynthetic Carbon Isotope Discrimination

C isotope discrimination of the leaf (Δleaf) was calculated as
l e a f = δ a i r δ l e a f δ l e a f / 1000 + 1
where δair is the averaged C isotope composition of the canopy CO2 (‰) measured at 26 m within the canopy during the sampling day, and δleaf is the averaged C isotope composition of the leaves (‰) for all dominant species and canopy heights.
Canopy-scale photosynthetic discrimination (Δcanopy) was calculated using Farquhar’s classical model (Δclassical) [1] and compared with Δleaf to provide robust evidence for variations in C isotope discrimination over time. Δclassical describes the fractionation in CO2 diffusion, carboxylation fractionation, and respiratory fractionation as
c l a s s i c a l = a ¯ + b a ¯ c c c a f Γ * c a e R d k c a
where a ¯ is the overall diffusional fractionation for CO2 as calculated from the diffusional fractionation factors (fractionation across the boundary layer (2.9‰), fractionation across the stoma (4.4‰), and fractionation across the mesophyll, including dissolution (1.1‰ at 25 °C) and diffusion (0.7‰) in water) and the conductance factors of CO2 across the foliar boundary layer, stoma, and mesophyll during photosynthesis based on the big-leaf model according to Wehr and Saleska [33]; b is the Rubisco fractionation in C3 plants and assumed to be 27.5‰ [34]; f is the respiratory fractionation for photorespiration (11‰) [33]; e is the respiratory fractionation for daytime dark respiration (−5‰) [33]; Γ* is the CO2 compensation point (μmol mol−1), which was calculated from the leaf temperature according to Brooks and Farquhar [35]; Rd is the daytime respiration rate (μmol m−2 s−1), which is assumed to be 3 μmol m−2 s−1 [36]; k is the carboxylation efficiency (μmol m−2 s−1), which is assumed to be 0.1 μmol m−2 s−1 [36]; cc is the CO2 concentration in the chloroplast (ppm); and ca is the CO2 concentration in the canopy air (ppm) measured at 26 m above the ground (see Section 2.3). The cc/ca was obtained by the numerical solution of the equation derived from the theory of isoflux-based isotopic flux partitioning (IFP) [19], which is expressed as
c c c a = ( δ a + b δ N R 2 a ¯ + f Γ * c a + e R d k c a ) ± ( δ a + b δ N R 2 a ¯ + f Γ * c a + e R d k c a ) 2 4 ( a ¯ b ) ( δ N R + a ¯ δ a f Γ * c a e R d k c a i s o f l u x δ N R N E E g ¯ c a ) 2 ( a ¯ b )
where δa is the δ13C of canopy CO2 measured at 26 m above the ground (‰) (see Section 2.3); δNR is δ13Ceco (see Section 2.4) but was substituted by the weekly smoothed value to capture the seasonal variation; isoflux is the C isotopic flux calculated from the eddy covariance measurement (see Section 2.2), the canopy CO2 δ13C profile measurement (see Section 2.3), and the intercept of the daytime (7:00–17:00) Keeling plot according to [18,37]; and NEE is the net ecosystem exchange flux (μmol CO2 m−2 s−1). Note that Δcanopy was calculated using data from the daytime and expressed as the daily average.

2.7. Statistical Analyses

Student’s t-test was used to assess the differences in mean δ13C (air, organic matter, and respiration) among sampling positions, C pools, or species. A one-way analysis of variance (ANOVA) was performed to assess the significance of the seasonal variations of δ13Cair, leaf δ13C, Δleaf, δ13CR, and δ13Ceco. To evaluate how the δ13CR of the leaf, trunk, and soil respond to environmental factors, we conducted correlation analyses and linear regression analyses using the δ13CR of each measurement and the environmental data of the corresponding timespans. Correlation analyses were also conducted to assess the environmental effects on δ13Ceco and the potential lagged responses of δ13Ceco to environmental factors using daily δ13Ceco and daily average meteorological data. The environmental factors include air temperature, vapor pressure deficit (VPD), global radiation, soil temperature, and soil moisture. These factors were taken into consideration because they are expected to influence C isotope discriminations in above- and belowground processes. The lagged correlation was tested with shifted time periods from zero to 10 days.

3. Results

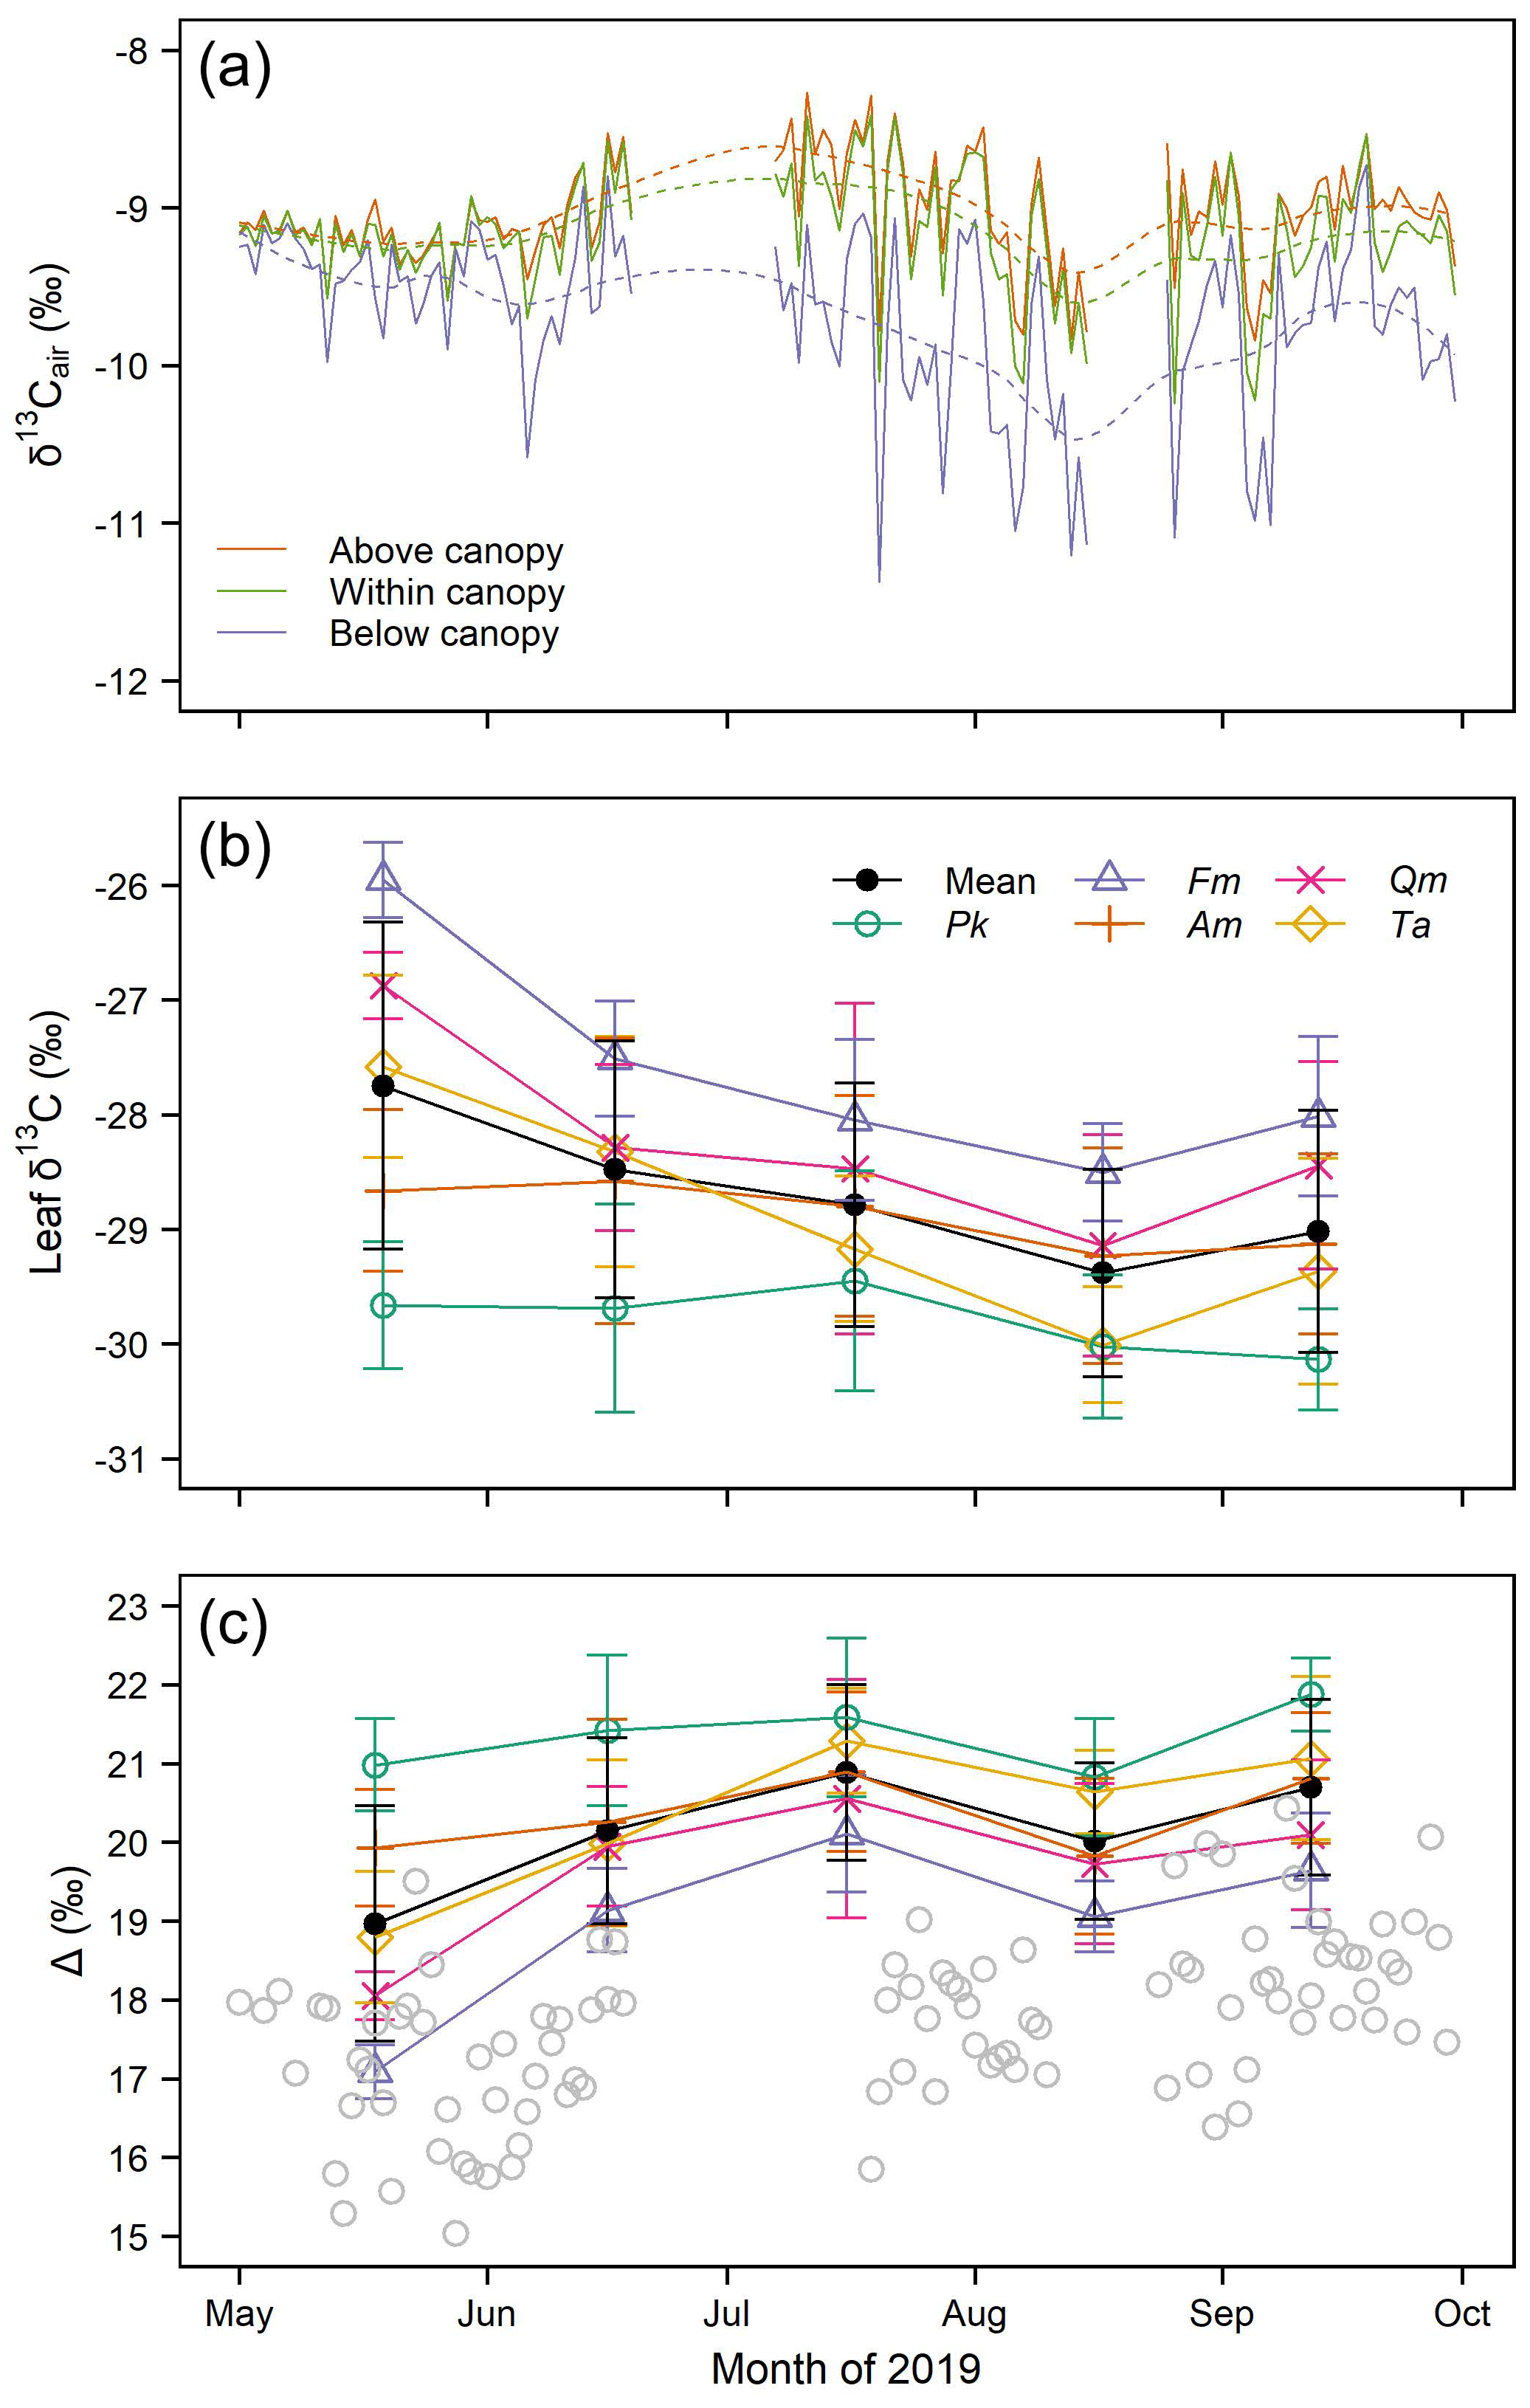
3.1. Seasonal Variation of δ13Cair

In the year 2019, the mean annual temperature was 5.4 °C and annual rainfall was 627 mm, making 2019 warmer and drier than the long-term average (see Section 2.1). During the growing season of 2019, the meteorological conditions showed significant seasonal fluctuations (Figure 2). The vapor pressure deficit (VPD) was higher in May and September, and air temperature was also higher during these periods, which resulted in remarkable soil water deficits. Soil temperature and air temperature reached their highest points at the end of July. In July and August, precipitation and soil moisture were the highest, especially at the end of July and in the middle of August, when the accumulated rainfall accounted for 15.7% and 19.6% of the annual total, respectively.
We found a significant seasonal variation in δ13Cair during the growing season (p < 0.01, ANOVA; Figure 3a). The average δ13Cair of the growing season was −9.25‰. At the beginning of the growing season, δ13Cair showed a slight decrease and then reached a maximum of about −8.5‰ in early July and then started to decrease until it reached a minimum of below −10‰ in the middle of August. In September, δ13Cair first showed an increase and then started to decrease in the middle of September. Moreover, δ13Cair showed remarkable day-to-day variation. The largest difference in δ13Cair between two consecutive days was up to about 2‰. Short-term rapid depletions of 13C in the forest occasionally occurred during the growing season, such as the relative depletion of 13C at the beginning of September. The difference of δ13Cair between the above-canopy (−9.13‰) and within-canopy (−9.18‰) was small but statistically significant (p < 0.01, t-test). δ13Cair within the canopy was significantly more positive (p < 0.001, t-test) than the δ13Cair below the canopy (−9.44‰), and δ13Cair below the canopy was always the lowest throughout the growing season.

3.2. Carbon Isotopic Compositions of Leaves and Photosynthetic Carbon Isotope Discrimination

Considering the complexity of the mixed forest, we determined the leaf δ13C for all five dominant species and along the vertical position of their canopies. In terms of temporal variation, leaf δ13C in broadleaved species showed significant seasonal variations (p < 0.001, ANOVA) except for A. mono (p = 0.516, ANOVA), with a gradual decrease from May to August by a magnitude of 2‰, followed by an increase after August (Figure 3b). In contrast to broadleaves, the δ13C in the needles of P. koraiensis did not vary significantly over time (p = 0.275, ANOVA) and showed a slight decrease throughout the growing season, except for a relatively small increase in July (Figure 3b). δ13C in the needles of P. koraiensis (−29.79‰) was also the lowest among the species (Figure 3b). Since broadleaved trees are the main components of the mixed forest in this study, variation in the mean leaf δ13C values of the five dominant species followed the same seasonal patterns as the four broadleaved species. The temporal variation of leaf δ13C corresponded to that of δ13Cair, except in May, when δ13Cair was relatively low, while leaf δ13C was the highest compared to the rest of the growing season (Figure 3a,b), indicating that leaf δ13C depends not only on the C isotopic signal carried by CO2 in the air.
C isotope discrimination at both the leaf and canopy level is shown in Figure 3c. Δleaf was calculated directly from the leaf δ13C and δ13Cair of the corresponding sampling days (Equation (1)). Species-specific differences in Δleaf were found over the growing season. Except for A. mono (p = 0.084, ANOVA), Δleaf varied significantly (p < 0.05 for P. koraiensis and p < 0.001 for the other species, ANOVA) over time. On average, Δleaf showed an increasing trend from May (18.97‰) to July (20.70‰), while the Δleaf of both species showed a decrease in August compared to July and September (Figure 3c). This variation pattern of leaf level discrimination was strongly supported by the Δcanopy estimated by the classical Farquhar’s model (Equation (2)), although Δcanopy was generally lower than Δleaf (Figure 3c). Δcanopy also showed a general increasing trend over time, with the lowest value observed in May. Since there are two periods of missing measurements, we can only deduce that the Δcanopy reached its maximum in early to middle July, followed by relatively lower values in the middle of August, according to the increasing trend in June and the decreasing trend at the beginning of August (Figure 3c).

3.3. Carbon Isotopic Compositions of Ecosystem Organic Pools and Respired CO2

Seasonal variation in the δ13CR of different ecosystem pools (leaf, trunk, and soil), as well as δ13Ceco, is shown in Figure 4. Over the entire growing season, the δ13CR of leaves and trunks varied within a range of 3.2‰ and 4.5‰, respectively. A statistically significant general increase of δ13CR was found in the needles of P. koraiensis (p < 0.001, ANOVA), while no such phenomenon was found in the leaves of A. mono (p = 0.422, ANOVA; Figure 4a). The trunk δ13CR of both P. koraiensis and F. mandshurica varied significantly (p < 0.001, ANOVA) throughout the growing season. Trunk δ13CR showed a decreasing trend from May to August and a slight increase in September (Figure 4b). This variation trend was similar to the general seasonal pattern of leaf δ13C (Figure 3a and Figure 4b). Soil δ13CR did not vary significantly over time (p = 0.084, ANOVA) and was also relatively stable (with a range of 2.3‰) compared to leaf and trunk δ13CR (Figure 4c). Furthermore, a decrease of δ13CR was found from May to June in leaf, trunk, and soil (Figure 4a–c).
δ13CR exhibited a slight depletion from leaves (−26.33‰) to trunks (−25.67‰) and soil (−25.48‰), as did δ13C in the corresponding organic matter (leaf: −28.68‰, trunk: −26.55‰, soil: −25.72‰; Figure 5). A distinct spatial pattern of leaf δ13C was found throughout the growing season (Figure 5). Similar to δ13Cair, leaf δ13C values increased significantly with an increase of height (−29.16‰, −28.73‰, and −28.16‰ from the lower to middle and upper canopy; p < 0.001, ANOVA). Leaf δ13CR was generally more enriched compared to the δ13C in leaf organic matter but closer to the δ13C in the upper leaf (−28.16‰), which indicates that a substantial quantity of photosynthate from the upper canopy was used as respiratory substrate. Trunk δ13CR was also more enriched than the δ13C in trunk organic matter but showed a larger range of variation (Figure 5). Soil δ13CR was more enriched than the δ13C of organic matter on the surface (0–5 cm) soil (−26.59‰), in the roots (−28.02‰), and especially in litters (−28.40‰). However, the soil δ13CR was similar (p = 0.527, t-test) to the δ13C of soil in deeper layers (5–40 cm) (−25.43‰; Figure 5).
Nights with a CO2 range lower than 60 ppm were excluded from δ13Ceco calculations because a small CO2 range could cause uncertainties in fitting the Keeling plot. After applying this exclusion, all of the values for R2 in the regression were greater than 0.85 and yielded a sufficient quantity of reliable δ13Ceco data (Figure 4d). The variation in δ13Ceco was significant over the growing season (p < 0.001, ANOVA), with an average of −25.79‰. δ13Ceco steadily increased as the growing season progressed (Figure 4d), and the δ13Ceco values were within the range of the δ13CR in the leaves, trunks, and soil (Figure 5). Some short-term δ13Ceco variations were observed, such as two gradual decreases in May and July, which may be attributed to the gradual 13C depletion of CO2 in the air and respired from C pools during these periods (Figure 3; Figure 4).

3.4. Relationship between δ13CR and Environmental Factors

The correlation analyses showed that the δ13CR in the trunks of both P. koraiensis and F. mandshurica had a significant negative correlation with air temperature, soil temperature, and soil moisture (p < 0.01; Figure 6 and Table 1). Soil δ13CR only showed a significant positive correlation with global radiation (r = 0.312, p < 0.05; Figure 6 and Table 1). No significant correlation was found between leaf δ13CR and any environmental factors (Figure 6 and Table 1).
We conducted a correlation analysis between δ13Ceco and environmental factors with a time window from zero to 10 days. It was found that δ13Ceco was negatively correlated with air temperature (p < 0.05; Table 2) measured on the same day as δ13Ceco. And δ13Ceco was negatively correlated with VPD (p < 0.05; Table 2) and positively correlated with soil moisture (p < 0.01; Table 2) with a lag time of 10 days. Further, δ13Ceco was negatively correlated with global radiation and positively correlated with soil temperature, but this correlation was not statistically significant (Table 2).

4. Discussion

4.1. Variations in Carbon Isotope Discrimination from Assimilation to Respiration

Photosynthetic C isotope discrimination and δ13Cair both influenced leaf δ13C. In this study, the influence of photosynthetic discrimination on leaf δ13C was greater in the growing season most of the time. For example, from May to July, although δ13Cair showed a moderate increase, both Δleaf and Δcanopy showed a strong increase, which directly led to a continuous decrease in leaf δ13C during this period (Figure 3). This increase in Δleaf and Δcanopy may have resulted from an increase in stomatal conductance under the gradually warmer and wetter weather conditions from May to July (Figure 2). However, the influence of photosynthetic discrimination may have become weak for determining the leaf δ13C in August, at which point we also found that leaf δ13C reached its minimum, and Δleaf and Δcanopy were not the highest (Figure 3). On the other hand, δ13Cair influenced leaf δ13C more profoundly in terms of height. Since 13C depleted CO2 relative to the atmospheric CO2 respired by the soil and understorey and due to the reduction in mixing between the air inside the forest and the atmosphere with a decrease in height, canopy δ13Cair was usually lower, as it was closer to the ground [38,39], which resulted in a similar spatial pattern between leaf δ13C and δ13Cair (Figure 5).
The seasonal pattern of photosynthetic C isotope discrimination was found to be species-specific. Compared with deciduous broadleaf species, the coniferous species (P. koraiensis) was found to have the highest Δleaf in the growing season (Figure 3), which is consistent with a previous study conducted at the same site as our study [40]. Low photosynthetic activity and higher stomatal conductance could result in a higher ci/ca and, consequently, higher Δleaf [41]. Therefore, P. koraiensis in this temperate mixed forest may have a lower photosynthetic rate and higher stomatal conductance compared to deciduous species. Moreover, δ13C in the needles of P. koraiensis showed smooth depletion during the growing season, resulting in less varied Δleaf over time compared to the deciduous broadleaf species (Figure 3). This difference is most likely due to the large proportion of slow-turnover compounds (e.g., starch and pinitol) in needles compared to broadleaves. These compounds generally have more stable seasonal δ13C variation than other carbohydrates [11,42,43] and can strongly dampen the overall δ13C signals of needle bulk organic matter [43,44].
Our study also found apparent post-photosynthetic C isotope discrimination among the C pools from leaf to trunk and root (Figure 5). More importantly, our results show that the leaf (leaves of P. koraiensis and A. mono) and trunk (trunks of P. koraiensis and F. mandshurica) respired CO2 that was 13C-enriched in comparison to the leaf and trunk organic matter of the domain species (Figure 5). Due to the long duration of a single measurement (see Section 2.4), it was unfeasible to establish more chambers to cover more species and at different heights or to study more replicates. Despite this weakness in the δ13CR measurements, the results obtained by our study are more abundant than those in many previous studies [20,45,46] and indicate the effects of post-photosynthetic C isotope discrimination in the process of dark respiration. In the process of dark respiration, 13C-enriched C-3 and C-4 positions in glucose are preferably used to produce pyruvate during glycolysis; then, pyruvate is decarboxylated by pyruvate dehydrogenase (PDH) to release 13C-enriched CO2. A greater contribution of CO2 decarboxylated in the PDH will result in more positive δ13CR [47].
Soil δ13CR was more positive than δ13C in the potential respiratory substrates, including roots, litter, and soil on the surface; however, it was similar to δ13C in the deeper soil (Figure 5). Soil respiration is mainly performed by autotrophic components (roots and rhizosphere microbes) and heterotrophic components (the decomposition of litter and soil organic matter). Among the autotrophic components, root respiration contributes significantly to soil respiration with a generally more negative δ13CR signal compared to δ13C in root organic matter, as reviewed in [4,46,48]. Along with the relatively negative root δ13CR, if we further assume that litter δ13CR was mildly more positive than δ13C in litter organic matter during the process of decomposition, as shown in previous studies [49,50], more positive δ13CR signals would still be needed from other belowground processes to produce the exact soil δ13CR values in our forest, considering that litter respiration generally contributes less to soil respiration. Many studies have shown that δ13C in microbial biomass is more positive (1–2‰) relative to that in total soil C [4,51,52], and that microbial CO2 is also more 13C-enriched compared to soil organic matter [53]. Furthermore, the δ13C in soil CO2 seems to behave similarly to the typical patterns of soil δ13C isotopic enrichment with soil depth. For example, Goffin et al. [54] found that soil air δ13C in the deeper layer (10–20 cm) was more positive than that on the surface (0–10 cm) in a Scots pine stand. Using incubated soil, Formánek and Ambus [55] also found more positive δ13C in the CO2 respired from the deeper layer (15–38 cm) than that from the surface (3–10 cm). Thus, the soil δ13CR values observed in this study may have resulted from mixing between the δ13C signal from autotrophic respiration and a relatively large portion of the δ13C signal from microbe decomposition of soil organic matter, especially soil organic matter in the deeper layers, which indicates that the soil CO2 flux in our forest was mainly from heterotrophic components.

4.2. Seasonal Variations in the δ13CR and its Linkage to Environmental Factors

The lack of replication of in situ online δ13CR measurements using non-automated systems is a common problem in previous studies [27,56], especially for studies measuring the δ13CR of different C pools simultaneously [12,17], including the present study. Nonetheless, the continuous δ13CR measurements in the present study accurately captured the seasonal variation of δ13CR in the target components. No consistent pattern was found in the δ13CR between the needles of P. koraiensis and the leaves of A. mono throughout the growing season (Figure 4). One possible reason is that the δ13C in the leaf respiratory substrates of P. koraiensis and A. mono experienced relatively weak seasonal variations (Figure 3), because leaf δ13CR found to be linked with the δ13C of leaf metabolites [5,57]. By contrast, both of the δ13CR values in the trunks of P. koraiensis and F. mandshurica showed a decreasing trend over the growing season (Figure 4). This result is consistent with a previous study of Quercus petraea in a temperate forest [8]; they ascribed that to the use of 13C-enriched respiratory substrates (i.e., starch) in trunks at the beginning of the growth period. The seasonal changes in leaf δ13CR differed from the δ13C of leaf organic matter (Figure 3 and Figure 4), which may indicate changes in the proportion of different respiratory substrates used in leaf respiration during the growing season [42]. However, trunk δ13CR shared a similar seasonal variation pattern to the δ13C in leaf organic matter (Figure 3 and Figure 4). This may be because a large amount of assimilated photosynthate was transported through the phloem to the trunk, and these were subsequently used as substrates for trunk respiration over the entire growing season.
Furthermore, due to the weak seasonal variation of leaf δ13CR in P. koraiensis and A. mono, we found no significant correlation between leaf δ13CR and the environmental variables (Table 1). It is still unclear how the leaf δ13CR of other dominant species in our forest are linked to environmental variables due to our limited chamber measurements. However, as the δ13C in the leaf organic matter of other dominant species showed larger seasonal variations (Figure 3), it is expected that the leaf δ13CR of other dominant species could have more significant seasonal variations and could be more sensitive to environmental conditions. The trunk δ13CR in our forest was found to be negatively correlated with air temperature (Table 1), which is consistent with the results of Maunoury et al. [8] on sessile oak in France. Interestingly, our study found that the δ13C in trunk respiration was more sensitive to environmental changes at a seasonal scale than that in other flux components, regardless of species. Comparably, the successful utilization of δ13C in tree rings to reconstruct climate demonstrates that δ13C in the structural carbohydrates in wood is closely related to environmental changes [58]. This suggests that the specific compounds responsible for tree ring δ13C may also be responsible for the δ13C in trunk respiration, resulting in the sensitivity of trunk δ13CR to environmental factors.
Soil δ13CR showed a relatively stable variation over the growing season (Figure 4). Variability in soil δ13CR has been linked to environmental factors such as air temperature, soil moisture, VPD, and photosynthetically active radiation [6,13,59,60]. Our results found that soil δ13CR had no significant correlation with environmental factors except for global radiation (Figure 6 and Table 1). This result is partly supported by Bowling et al. [56], who measured soil δ13CR in a US subalpine forest using chambers. The authors’ results showed that environmental forcing does not induce temporal variation in soil δ13CR. The lack of a linkage between soil δ13CR and environmental factors at our site could be due to the lack of in soil δ13CR variation during the growing season. The large range in potential soil respiratory substrates [3] and the correspondingly large range of δ13C values could also have dampened the isotopic linkage between soil δ13CR and current environmental conditions. Moreover, a recent study suggested that variations in soil δ13CR are mainly derived from diffusive fractionation rather than biological causes [32], which provides another possible explanation for the weak relationship between soil δ13CR and the environmental factors we found.

4.3. δ13Ceco Reveals Short-Term Links between Aboveground and Belowground Processes

The δ13Ceco calculated by the Keeling plot method using nighttime δ13C and CO2 profile data represents the integrated δ13C of the CO2 produced by all above- and belowground respiring components in the forest. The results showed that the average δ13Ceco in the growing season is between the average δ13CR of the trunk and the soil (Figure 5), which is consistent with the results reported by Wingate et al. [17].
From a short-term perspective, aboveground vegetation could determine the biogeochemical processes belowground through, for example, newly fixed photoassimilates transport to roots, which then contribute to soil respiration. This linkage between assimilates and respiration could be revealed by relating the δ13C of ecosystem respiration to environmental factors but with a time lag from hours to days [9,10,16,61]. For example, Fessenden and Ehleringer [59] found that soil moisture measured at a 40 cm depth was negatively correlated with δ13Ceco on the day of the measurements in an old-growth coniferous forest. Scartazza et al. [62] also found a negative relationship between soil moisture measured at 70–88 cm depth and δ13Ceco measured on the same day in a beech forest, whereas Mortazavi et al. [6] found that δ13Ceco was negatively correlated to soil moisture for 7 days before δ13Ceco measurements. The negative correlation between soil moisture and δ13Ceco was also found to be significant in a Douglas-fir forest but not in a ponderosa pine forest [63]. However, our results suggest that the correlation between soil moisture and δ13Ceco is positive but weak and that a lag of 10 days provides the best correlation (Table 2).
The VPD was found to be positively related to δ13Ceco after a lag of 3 days [63], 3–4 days [6], 4–5 days [14,61], or 5–10 days [16]. Again, our results show an opposite correlation pattern between VPD and δ13Ceco compared to previous studies, and a lag of 10 days gave the best (but still weak) correlation (Table 2). In previous studies, Bowling et al. [64] and Schaeffer et al. [65] found no correlation between δ13Ceco and soil moisture or VPD. We also found that δ13Ceco has no significant correlation with the other environmental factors we measured, regardless of the time lag (Table 2). The weak impact of air temperature, VPD, and soil moisture on δ13Ceco in our study reflects the weak link between assimilation and respiration at a seasonal scale. Additionally, stronger correlations were reported by Schaeffer et al. [65] after they separately calculated the δ13Ceco using data within or below the canopy by selectively removing periods when the air within and below the canopy was well mixed. These findings suggest that the environmental controls for δ13Ceco may also be influenced by other factors, such as the canopy’s aerodynamic properties.
Although we found different seasonal isotopic patterns in different respiratory C pools and different environmental factors can contribute differently to the δ13CR of those pools over the entire growing season, some strong correlations were still observed between the δ13CR of the leaf, trunk, and soil and the δ13Ceco. The most obvious occurred in May, when the δ13C from respiratory C pools as well as the ecosystem showed decreasing trends (Figure 4). These distinct decreases may have resulted from unique extreme weather events in May, when the ecosystem received a large amount of global radiation but less rainfall, which led to an overall increase in VPD, a decrease in soil moisture, and a large temperature difference between the air and the soil (Figure 2). The concurrent decrease in δ13CR and δ13Ceco suggests that although the linkage between assimilates and respiration was weak at a seasonal scale in our study, recently fixed assimilates could be allocated to the location of respiration in a short period of time, indicating a quick link between different respiration pools and assimilation at the beginning of the growing season in the coniferous and broad-leaved mixed forest.

5. Conclusions

Overall, the observed difference in seasonal variation in photosynthetic discrimination between the deciduous broadleaved and evergreen needle species in our forest indicated a remarkable difference in C assimilation between them. As expected, post-photosynthetic discrimination explained the substantial isotopic differences among C pools and their respiratory fluxes during the process of photosynthate allocation and respiration. Compared to leaf and soil δ13CR, trunk δ13CR was more sensitive to environmental changes and related to the seasonal patterns of leaf δ13C, which suggests that trunk δ13CR has great potential as a way to record discrimination-encoded biochemical and physiological information related to C cycling. In addition, the linkages between environmental factors and δ13Ceco were not constant, which complicates the use of δ13Ceco to determine the linkage between assimilation and respiration. We conclude that the effects of environmental changes on C isotope discrimination can be distracted through a number of processes during C transfer.
We suggest that the combined effect of multiple environmental factors and the potential time lags should be addressed carefully when evaluating the long-term temporal changes of δ13CR and δ13Ceco. Apart from the biological impacts initiated by controlling the photosynthetic rate and stomatal openness, the physical parameters, such as aerodynamic conditions (e.g., atmospheric stability) and the conditions of the soil–atmosphere diffusion systems may also regulate δ13Ceco, although they seem to act as distracters, impairing the relationship between environmental factors and δ13Ceco. Furthermore, soil δ13CR and δ13Ceco integrate the δ13C signals of multiple tree species with different C assimilation and transfer patterns in mixed forests. In these respects, the present study expands our knowledge of C isotope discrimination in mixed forests with multiple tree species and effectively promotes a comprehensive consideration of the influencing factors related to isotopic variation within process-based ecosystem models.

Author Contributions

J.W. designed the study; H.D. performed the research; A.W., F.Y. and G.D. provided the resources; H.D., D.G. and J.W. contributed to the data analysis; D.G. and J.W. contributed to the funding acquisition; H.D. wrote the first draft and all authors contributed to the final manuscript. All authors have read and agreed to the published version of the manuscript.

Funding

This research was funded by the National Natural Science Foundation of China (grant numbers 31870625, 41975150).

Conflicts of Interest

The authors declare no conflict of interest.

References

  1. Farquhar, G.D.; O’Leary, M.H.; Berry, J.A. On the Relationship between Carbon Isotope Discrimination and the Intercellular Carbon Dioxide Concentration in Leaves. Funct. Plant Biol. 1982, 9, 121–137. [Google Scholar] [CrossRef]
  2. Cernusak, L.A.; Ubierna, N.; Winter, K.; Holtum, J.A.M.; Marshall, J.D.; Farquhar, G.D. Environmental and physiological determinants of carbon isotope discrimination in terrestrial plants. New Phytol. 2013, 200, 950–965. [Google Scholar] [CrossRef] [PubMed]
  3. Ehleringer, J.R.; Buchmann, N.; Flanagan, L.B. Carbon isotope ratios in belowground carbon cycle processes. Ecol. Appl. 2000, 10, 412–422. [Google Scholar] [CrossRef]
  4. Bowling, D.R.; Pataki, D.E.; Randerson, J.T. Carbon isotopes in terrestrial ecosystem pools and CO2 fluxes. New Phytol. 2008, 178, 24–40. [Google Scholar] [CrossRef] [PubMed] [Green Version]
  5. Ghashghaie, J.; Duranceau, M.; Badeck, F.-W.; Cornic, G.; Adeline, M.-T.; Deleens, E. δ13C of CO2 respired in the dark in relation to δ13C of leaf metabolites: Comparison between Nicotiana sylvestris and Helianthus annuus under drought. Plant Cell Environ. 2001, 24, 505–515. [Google Scholar] [CrossRef]
  6. Mortazavi, B.; Chanton, J.P.; Prater, J.L.; Oishi, A.C.; Oren, R.; Katul, G. Temporal variability in 13C of respired CO2 in a pine and a hardwood forest subject to similar climatic conditions. Oecologia 2005, 142, 57–69. [Google Scholar] [CrossRef]
  7. Prater, J.L.; Mortazavi, B.; Chanton, J.P. Diurnal variation of the δ13C of pine needle respired CO2 evolved in darkness. Plant Cell Environ. 2006, 29, 202–211. [Google Scholar] [CrossRef]
  8. Maunoury, F.; Berveiller, D.; Lelarge, C.; Pontailler, J.-Y.; Vanbostal, L.; Damesin, C. Seasonal, daily and diurnal variations in the stable carbon isotope composition of carbon dioxide respired by tree trunks in a deciduous oak forest. Oecologia 2007, 151, 268–279. [Google Scholar] [CrossRef]
  9. Kuzyakov, Y.; Gavrichkova, O. Time lag between photosynthesis and carbon dioxide efflux from soil: A review of mechanisms and controls. Glob. Chang. Biol. 2010, 16, 3386–3406. [Google Scholar] [CrossRef]
  10. Ekblad, A.; Högberg, P. Natural abundance of 13C in CO2 respired from forest soils reveals speed of link between tree photosynthesis and root respiration. Oecologia 2001, 127, 305–308. [Google Scholar] [CrossRef]
  11. Damesin, C.; Lelarge, C. Carbon isotope composition of current-year shoots from Fagus sylvatica in relation to growth, respiration and use of reserves. Plant Cell Environ. 2003, 26, 207–219. [Google Scholar] [CrossRef] [Green Version]
  12. Kuptz, D.; Matyssek, R.; Grams, T.E.E. Seasonal dynamics in the stable carbon isotope composition (δ13C) from non-leafy branch, trunk and coarse root CO2 efflux of adult deciduous (Fagus sylvatica) and evergreen (Picea abies) trees. Plant Cell Environ. 2011, 34, 363–373. [Google Scholar] [CrossRef] [PubMed]
  13. McDowell, N.G.; Bowling, D.R.; Bond, B.J.; Irvine, J.; Law, B.E.; Anthoni, P.; Ehleringer, J.R. Response of the carbon isotopic content of ecosystem, leaf, and soil respiration to meteorological and physiological driving factors in a Pinus ponderosa ecosystem. Glob. Biogeochem. Cycles 2004, 18. [Google Scholar] [CrossRef]
  14. Werner, C.; Unger, S.; Pereira, J.S.; Maia, R.; David, T.S.; Kurz-Besson, C.; David, J.S.; Máguas, C. Importance of short-term dynamics in carbon isotope ratios of ecosystem respiration (δ13CR) in a Mediterranean oak woodland and linkage to environmental factors. New Phytol. 2006, 172, 330–346. [Google Scholar] [CrossRef]
  15. Barbour, M.M.; Hunt, J.E.; Kodama, N.; Laubach, J.; McSeveny, T.M.; Rogers, G.N.D.; Tcherkez, G.; Wingate, L. Rapid changes in δ13C of ecosystem-respired CO2 after sunset are consistent with transient 13C enrichment of leaf respired CO2. New Phytol. 2011, 190, 990–1002. [Google Scholar] [CrossRef] [PubMed]
  16. Bowling, D.R.; McDowell, N.G.; Bond, B.J.; Law, B.E.; Ehleringer, J.R. 13C content of ecosystem respiration is linked to precipitation and vapor pressure deficit. Oecologia 2002, 131, 113–124. [Google Scholar] [CrossRef] [PubMed]
  17. Wingate, L.; Ogée, J.; Burlett, R.; Bosc, A.; Devaux, M.; Grace, J.; Loustau, D.; Gessler, A. Photosynthetic carbon isotope discrimination and its relationship to the carbon isotope signals of stem, soil and ecosystem respiration. New Phytol. 2010, 188, 576–589. [Google Scholar] [CrossRef]
  18. Zobitz, J.M.; Burns, S.P.; Reichstein, M.; Bowling, D.R. Partitioning net ecosystem carbon exchange and the carbon isotopic disequilibrium in a subalpine forest. Glob. Chang. Biol. 2008, 14, 1785–1800. [Google Scholar] [CrossRef]
  19. Chen, C.; Wei, J.; Wen, X.; Sun, X.; Guo, Q. Photosynthetic carbon isotope discrimination and effects on daytime NEE partitioning in a subtropical mixed conifer plantation. Agric. For. Meteorol. 2019, 272–273, 143–155. [Google Scholar] [CrossRef]
  20. Damesin, C.; Barbaroux, C.; Berveiller, D.; Lelarge, C.; Chaves, M.; Maguas, C.; Maia, R.; Pontailler, J.-Y. The carbon isotope composition of CO2 respired by trunks: Comparison of four sampling methods. Rapid Commun. Mass Spectrom. 2005, 19, 369–374. [Google Scholar] [CrossRef]
  21. Kammer, A.; Tuzson, B.; Emmenegger, L.; Knohl, A.; Mohn, J.; Hagedorn, F. Application of a quantum cascade laser-based spectrometer in a closed chamber system for real-time δ13C and δ18O measurements of soil-respired CO2. Agric. For. Meteorol. 2011, 151, 39–48. [Google Scholar] [CrossRef]
  22. Keeling, C.D. The concentration and isotopic abundances of atmospheric carbon dioxide in rural areas. Geochim. Cosmochim. Acta 1958, 13, 322–334. [Google Scholar] [CrossRef]
  23. Keeling, C.D. The concentration and isotopic abundances of carbon dioxide in rural and marine air. Geochim. Cosmochim. Acta 1961, 24, 277–298. [Google Scholar] [CrossRef]
  24. Zobitz, J.M.; Keener, J.P.; Schnyder, H.; Bowling, D.R. Sensitivity analysis and quantification of uncertainty for isotopic mixing relationships in carbon cycle research. Agric. For. Meteorol. 2006, 136, 56–75. [Google Scholar] [CrossRef]
  25. Chen, C.; Pang, J.; Wei, J.; Wen, X.; Sun, X. Inter-comparison of three models for δ13C of respiration with four regression approaches. Agric. For. Meteorol. 2017, 247, 229–239. [Google Scholar] [CrossRef]
  26. Guan, D.; Wu, J.; Zhao, X.; Han, S.; Yu, G.; Sun, X.; Jin, C. CO2 fluxes over an old, temperate mixed forest in northeastern China. Agric. For. Meteorol. 2006, 137, 138–149. [Google Scholar] [CrossRef]
  27. Kodama, N.; Barnard, R.L.; Salmon, Y.; Weston, C.; Ferrio, J.P.; Holst, J.; Werner, R.A.; Saurer, M.; Rennenberg, H.; Buchmann, N.; et al. Temporal dynamics of the carbon isotope composition in a Pinus sylvestris stand: From newly assimilated organic carbon to respired carbon dioxide. Oecologia 2008, 156, 737. [Google Scholar] [CrossRef]
  28. Brandes, E.; Kodama, N.; Whittaker, K.; Weston, C.; Rennenberg, H.; Keitel, C.; Adams, M.A.; Gessler, A. Short-term variation in the isotopic composition of organic matter allocated from the leaves to the stem of Pinus sylvestris: Effects of photosynthetic and postphotosynthetic carbon isotope fractionation. Glob. Chang. Biol. 2006, 12, 1922–1939. [Google Scholar] [CrossRef]
  29. Gessler, A.; Keitel, C.; Kodama, N.; Weston, C.; Winters, A.J.; Keith, H.; Grice, K.; Leuning, R.; Farquhar, G.D. δ13C of organic matter transported from the leaves to the roots in Eucalyptus delegatensis: Short-term variations and relation to respired CO2. Funct. Plant Biol. 2007, 34, 692–706. [Google Scholar] [CrossRef]
  30. Wen, X.F.; Meng, Y.; Zhang, X.Y.; Sun, X.M.; Lee, X. Evaluating calibration strategies for isotope ratio infrared spectroscopy for atmospheric 13CO2/12CO2 measurement. Atmos. Meas. Tech. 2013, 6, 1491–1501. [Google Scholar] [CrossRef]
  31. Pang, J.; Wen, X.; Sun, X.; Huang, K. Intercomparison of two cavity ring-down spectroscopy analyzers for atmospheric 13CO2/12CO2 measurement. Atmos. Meas. Tech. 2016, 9, 3879–3891. [Google Scholar] [CrossRef] [Green Version]
  32. Zhou, J.; Yang, Z.; Wu, G.; Yang, Y.; Lin, G. The relationship between soil CO2 efflux and its carbon isotopic composition under non-steady-state conditions. Agric. For. Meteorol. 2018, 256-257, 492–500. [Google Scholar] [CrossRef]
  33. Wehr, R.; Saleska, S.R. An improved isotopic method for partitioning net ecosystem–atmosphere CO2 exchange. Agric. For. Meteorol. 2015, 214–215, 515–531. [Google Scholar] [CrossRef] [Green Version]
  34. Brugnoli, E.; Farquhar, G.D. Photosynthetic fractionation of carbon isotopes. In Photosynthesis: Physiology and Metabolism; Leegood, R.C., Sharkey, T.D., von Caemmerer, S., Eds.; Springer: Dordrecht, The Netherlands, 2000; pp. 399–434. [Google Scholar] [CrossRef]
  35. Brooks, A.; Farquhar, G.D. Effect of temperature on the CO2/O2 specificity of ribulose-1,5-bisphosphate carboxylase/oxygenase and the rate of respiration in the light. Planta 1985, 165, 397–406. [Google Scholar] [CrossRef] [PubMed]
  36. Tcherkez, G.; Schäufele, R.; Nogués, S.; Piel, C.; Boom, A.; Lanigan, G.; Barbaroux, C.; Mata, C.; Elhani, S.; Hemming, D.; et al. On the 13C/12C isotopic signal of day and night respiration at the mesocosm level. Plant Cell Environ. 2010, 33, 900–913. [Google Scholar] [CrossRef] [PubMed] [Green Version]
  37. Bowling, D.R.; Tans, P.P.; Monson, R.K. Partitioning net ecosystem carbon exchange with isotopic fluxes of CO2. Glob. Chang. Biol. 2001, 7, 127–145. [Google Scholar] [CrossRef]
  38. Ehleringer, J.R.; Field, C.B.; Lin, Z.-f.; Kuo, C.-y. Leaf carbon isotope and mineral composition in subtropical plants along an irradiance cline. Oecologia 1986, 70, 520–526. [Google Scholar] [CrossRef]
  39. Brooks, J.R.; Flanagan, L.B.; Varney, G.T.; Ehleringer, J.R. Vertical gradients in photosynthetic gas exchange characteristics and refixation of respired CO2 within boreal forest canopies. Tree Physiol. 1997, 17, 1–12. [Google Scholar] [CrossRef]
  40. Tan, W.; Wang, G.; Han, J.; Liu, M.; Zhou, L.; Luo, T.; Cao, Z.; Cheng, S. δ13C and water-use efficiency indicated by δ13C of different plant functional groups on Changbai Mountains, Northeast China. Chin. Sci. Bull. 2009, 54, 1759–1764. [Google Scholar] [CrossRef] [Green Version]
  41. Farquhar, G.D.; Ehleringer, J.R.; Hubick, K.T. Carbon isotope discrimination and photosynthesis. Annu. Rev. Plant Physiol. Plant Mol. Biol. 1989, 40, 503–537. [Google Scholar] [CrossRef]
  42. Scartazza, A.; Moscatello, S.; Matteucci, G.; Battistelli, A.; Brugnoli, E. Seasonal and inter-annual dynamics of growth, non-structural carbohydrates and C stable isotopes in a Mediterranean beech forest. Tree Physiol. 2013, 33, 730–742. [Google Scholar] [CrossRef] [PubMed] [Green Version]
  43. Rinne, K.T.; Saurer, M.; Kirdyanov, A.V.; Bryukhanova, M.V.; Prokushkin, A.S.; Churakova, O.V.; Siegwolf, R.T.W. Examining the response of needle carbohydrates from Siberian larch trees to climate using compound-specific δ13C and concentration analyses. Plant Cell Environ. 2015, 38, 2340–2352. [Google Scholar] [CrossRef]
  44. Jäggi, M.; Saurer, M.; Fuhrer, J.; Siegwolf, R. The relationship between the stable carbon isotope composition of needle bulk material, starch, and tree rings in Picea abies. Oecologia 2002, 131, 325–332. [Google Scholar] [CrossRef] [PubMed]
  45. Cernusak, L.A.; Marshall, J.D.; Comstock, J.P.; Balster, N.J. Carbon isotope discrimination in photosynthetic bark. Oecologia 2001, 128, 24–35. [Google Scholar] [CrossRef]
  46. Badeck, F.-W.; Tcherkez, G.; Nogués, S.; Piel, C.; Ghashghaie, J. Post-photosynthetic fractionation of stable carbon isotopes between plant organs—A widespread phenomenon. Rapid Commun. Mass Spectrom. 2005, 19, 1381–1391. [Google Scholar] [CrossRef] [PubMed]
  47. Werner, C.; Gessler, A. Diel variations in the carbon isotope composition of respired CO2 and associated carbon sources: A review of dynamics and mechanisms. Biogeosciences 2011, 8, 2437–2459. [Google Scholar] [CrossRef] [Green Version]
  48. Ghashghaie, J.; Badeck, F.W. Opposite carbon isotope discrimination during dark respiration in leaves versus roots—A review. New Phytol. 2014, 201, 751–769. [Google Scholar] [CrossRef]
  49. Millard, P.; Midwood, A.J.; Hunt, J.E.; Barbour, M.M.; Whitehead, D. Quantifying the contribution of soil organic matter turnover to forest soil respiration, using natural abundance δ13C. Soil Biol. Biochem. 2010, 42, 935–943. [Google Scholar] [CrossRef]
  50. Ngao, J.; Cotrufo, M.F. Carbon isotope discrimination during litter decomposition can be explained by selective use of substrate with differing δ13C. Biogeosci. Discuss. 2011, 8, 51–82. [Google Scholar] [CrossRef]
  51. ŠantRůČková, H.; Bird, M.I.; Lloyd, J. Microbial processes and carbon-isotope fractionation in tropical and temperate grassland soils. Funct. Ecol. 2000, 14, 108–114. [Google Scholar] [CrossRef]
  52. Dijkstra, P.; Ishizu, A.; Doucett, R.; Hart, S.C.; Schwartz, E.; Menyailo, O.V.; Hungate, B.A. 13C and 15N natural abundance of the soil microbial biomass. Soil Biol. Biochem. 2006, 38, 3257–3266. [Google Scholar] [CrossRef]
  53. Werth, M.; Kuzyakov, Y. 13C fractionation at the root–microorganisms–soil interface: A review and outlook for partitioning studies. Soil Biol. Biochem. 2010, 42, 1372–1384. [Google Scholar] [CrossRef]
  54. Goffin, S.; Aubinet, M.; Maier, M.; Plain, C.; Schack-Kirchner, H.; Longdoz, B. Characterization of the soil CO2 production and its carbon isotope composition in forest soil layers using the flux-gradient approach. Agric. For. Meteorol. 2014, 188, 45–57. [Google Scholar] [CrossRef]
  55. Formánek, P.; Ambus, P. Assessing the use of δ13C natural abundance in separation of root and microbial respiration in a Danish beech (Fagus sylvatica L.) forest. Rapid Commun. Mass Spectrom. 2004, 18, 897–902. [Google Scholar] [CrossRef] [PubMed]
  56. Bowling, D.R.; Egan, J.E.; Hall, S.J.; Risk, D.A. Environmental forcing does not induce diel or synoptic variation in the carbon isotope content of forest soil respiration. Biogeosciences 2015, 12, 5143–5160. [Google Scholar] [CrossRef] [Green Version]
  57. Duranceau, M.; Ghashghaie, J.; Badeck, F.; Deleens, E.; Cornic, G. δ13C of CO2 respired in the dark in relation to δ13C of leaf carbohydrates in Phaseolus vulgaris L. under progressive drought. Plant Cell Environ. 1999, 22, 515–523. [Google Scholar] [CrossRef]
  58. Loader, N.J.; McCarroll, D.; Gagen, M.; Robertson, I.; Jalkanen, R. Extracting climatic information from stable isotopes in tree rings. In Terrestrial Ecology; Elsevier: Amsterdam, The Netherlands, 2007; Volume 1, pp. 25–48. [Google Scholar]
  59. Fessenden, J.E.; Ehleringer, J.R. Temporal variation in δ13C of ecosystem respiration in the Pacific Northwest: Links to moisture stress. Oecologia 2003, 136, 129–136. [Google Scholar] [CrossRef]
  60. Ekblad, A.; Boström, B.; Holm, A.; Comstedt, D. Forest soil respiration rate and δ13C is regulated by recent above ground weather conditions. Oecologia 2005, 143, 136–142. [Google Scholar] [CrossRef]
  61. Knohl, A.; Werner, R.A.; Brand, W.A.; Buchmann, N. Short-term variations in δ13C of ecosystem respiration reveals link between assimilation and respiration in a deciduous forest. Oecologia 2005, 142, 70–82. [Google Scholar] [CrossRef]
  62. Scartazza, A.; Mata, C.; Matteucci, G.; Yakir, D.; Moscatello, S.; Brugnoli, E. Comparisons of δ13C of photosynthetic products and ecosystem respiratory CO2 and their responses to seasonal climate variability. Oecologia 2004, 140, 340–351. [Google Scholar] [CrossRef]
  63. McDowell, N.G.; Bowling, D.R.; Schauer, A.; Irvine, J.; Bond, B.J.; Law, B.E.; Ehleringer, J.R. Associations between carbon isotope ratios of ecosystem respiration, water availability and canopy conductance. Glob. Chang. Biol. 2004, 10, 1767–1784. [Google Scholar] [CrossRef]
  64. Bowling, D.R.; Burns, S.P.; Conway, T.J.; Monson, R.K.; White, J.W.C. Extensive observations of CO2 carbon isotope content in and above a high-elevation subalpine forest. Glob. Biogeochem. Cycles 2005, 19. [Google Scholar] [CrossRef]
  65. Schaeffer, S.M.; Anderson, D.E.; Burns, S.P.; Monson, R.K.; Sun, J.; Bowling, D.R. Canopy structure and atmospheric flows in relation to the δ13C of respired CO2 in a subalpine coniferous forest. Agric. For. Meteorol. 2008, 148, 592–605. [Google Scholar] [CrossRef]
Figure 1. Schematic of the atmospheric profile and respiration chamber system (a) and photographs (b) and diagrammatic representations (c) of the custom-made chambers. L1 and L2, leaf chambers; T1 and T2, trunk chambers; S1, soil chamber; Std1 and Std2, standard gas tanks; FC, flow controller; AF, air filter; P, pump.
Forests 11 01156 g001
Figure 2. Seasonal variations in global radiation (a), vapor pressure deficit (VPD) (b), air and soil temperature (c), and soil moisture and precipitation (d) during the 2019 growing season. Global radiation, VPD, and air temperature are the averages of the seven heights in the forest. Soil temperature and soil moisture were measured at a 5 cm depth.
Forests 11 01156 g002
Figure 3. Seasonal variation in the δ13C of atmospheric CO213Cair) (a), seasonal variation in the δ13C of leaf bulk organic matter (b), and C isotope discrimination at the leaf and canopy levels (c) during the growing season of 2019. δ13Cair values are given as daily averages. The δ13Cair values below the canopy were averaged from data collected at heights of 2.5 and 8 m; the δ13Cair values within the canopy were averaged by data collected at heights of 22, 26, and 32 m; the δ13Cair values above the canopy were averaged by data collected at heights of 50 and 60 m. The dashed line is the locally weighted scatterplot smoothing (LOESS) with span = 0.3. The two periods of missing data in June and August were caused by power failure. Leaf δ13C values (mean ± SE, n = 9) were aggregated from three canopy heights (lower, middle, and upper). Δleaf was calculated from leaf δ13C and δ13Cair and separated by species; gray circles represent Δcanopy derived from Farqhar’s Δclassical model. Pk, Korean pine (P. koraiensis); Fm, Manchurian ash (F. mandshurica); Am, Mono maple (A. mono); Qm, Mongolian oak (Q. mongolica); Ta, Tuan linden (T. amurensis). Error bars indicate standard deviation.
Forests 11 01156 g003
Figure 4. Seasonal variations in the δ13CR of leaves (a), trunks (b), and soil (c), and in δ13Ceco (d). δ13CR and δ13Ceco were both derived using the Keeling plot method. The δ13CR of leaves, trunks, and soil were averaged from four measurements between 7:00 and 18:00, and the error bars indicate standard deviation. δ13Ceco was determined from the nighttime (21:00–03:00) CO2 and δ13Cair profiles, and the error bars indicate standard errors of the intercept of the Keeling plot. Pk, Korean pine (P. koraiensis); Fm, Manchurian ash (F. mandshurica); Am, Mono maple (A. mono); Qm, Mongolian oak (Q. mongolica).
Forests 11 01156 g004
Figure 5. A comparison of the C isotopic composition of ecosystem organic pools and respiratory fluxes. Diamonds represent the means. The box represents the median and the 25% upper/lower quartiles. The tails represent the 10% and 90% limits of the data. Leaf samples were taken once a month from May to September 2019. The trunk values are the average of the bark and xylem, the root values are the average of the coarse and fine roots, and the litter values are the average of the undecomposed layer (Oi) and the decomposed layer (Oe + Oa). These samples, along with the soil samples, were sampled at the end of September 2019. The leaf, trunk, and soil δ13CR were measured 15 times from May to September 2019. δ13Ceco was determined at a daily scale from May to September 2019.
Forests 11 01156 g005
Figure 6. Relationship between the δ13CR of different ecosystem organic pools and environmental factors. The data shown are the δ13CR of each measurement and the environmental factors of the corresponding half hour when the δ13CR was measured. VPD, vapor pressure deficit; Pk, Korean pine (P. koraiensis); Fm, Manchurian ash (F. mandshurica); Am, Mono maple (A. mono); Qm, Mongolian oak (Q. mongolica).
Forests 11 01156 g006
Table 1. Pearson correlation coefficients for the δ13CR from the C pools with environmental factors in the growing season. The δ13CR of each measurement and the corresponding half-hour meteorological data were used to conduct this analysis.
Pearson’s Correlation Coefficient (r)δ13CR (‰)
Pk LeafAm LeafPk TrunkFm TrunkSoil
Air temperature (°C)−0.0350.009−0.363 **−0.443 **0.234
VPD (kPa)0.1100.086−0.146−0.1200.101
Global radiation (W m−2)0.1660.2420.2440.1560.312 *
Soil temperature (°C)−0.199−0.101−0.462 **−0.513 **0.092
Soil moisture (m3 m−3)−0.000−0.056−0.484 **−0.469 **0.153
Note: * p < 0.05, ** p < 0.01.
Table 2. Pearson correlation coefficients for the δ13Ceco with environmental factors in the growing season. δ13Ceco and daily average meteorological data were used to conduct this analysis. The lag time in days and the Pearson’s correlation coefficient (r) are presented, and only the correlation that provided the best r value is presented.
Lagr
Air temperature (°C)0−0.256 *
VPD (kPa)10−0.280 *
Global radiation (W m−2)0−0.217
Soil temperature (°C)100.085
Soil moisture (m3 m−3)100.295 **
Note: * p < 0.05, ** p < 0.01.
Publisher’s Note: MDPI stays neutral with regard to jurisdictional claims in published maps and institutional affiliations.

