Changes in Water Retention and Carbon Sequestration in the Huangshan UNESCO Global Geopark (China) from 2000 to 2015

 , ,
, ,
Abstract
:1. Introduction
2. Materials and Methods
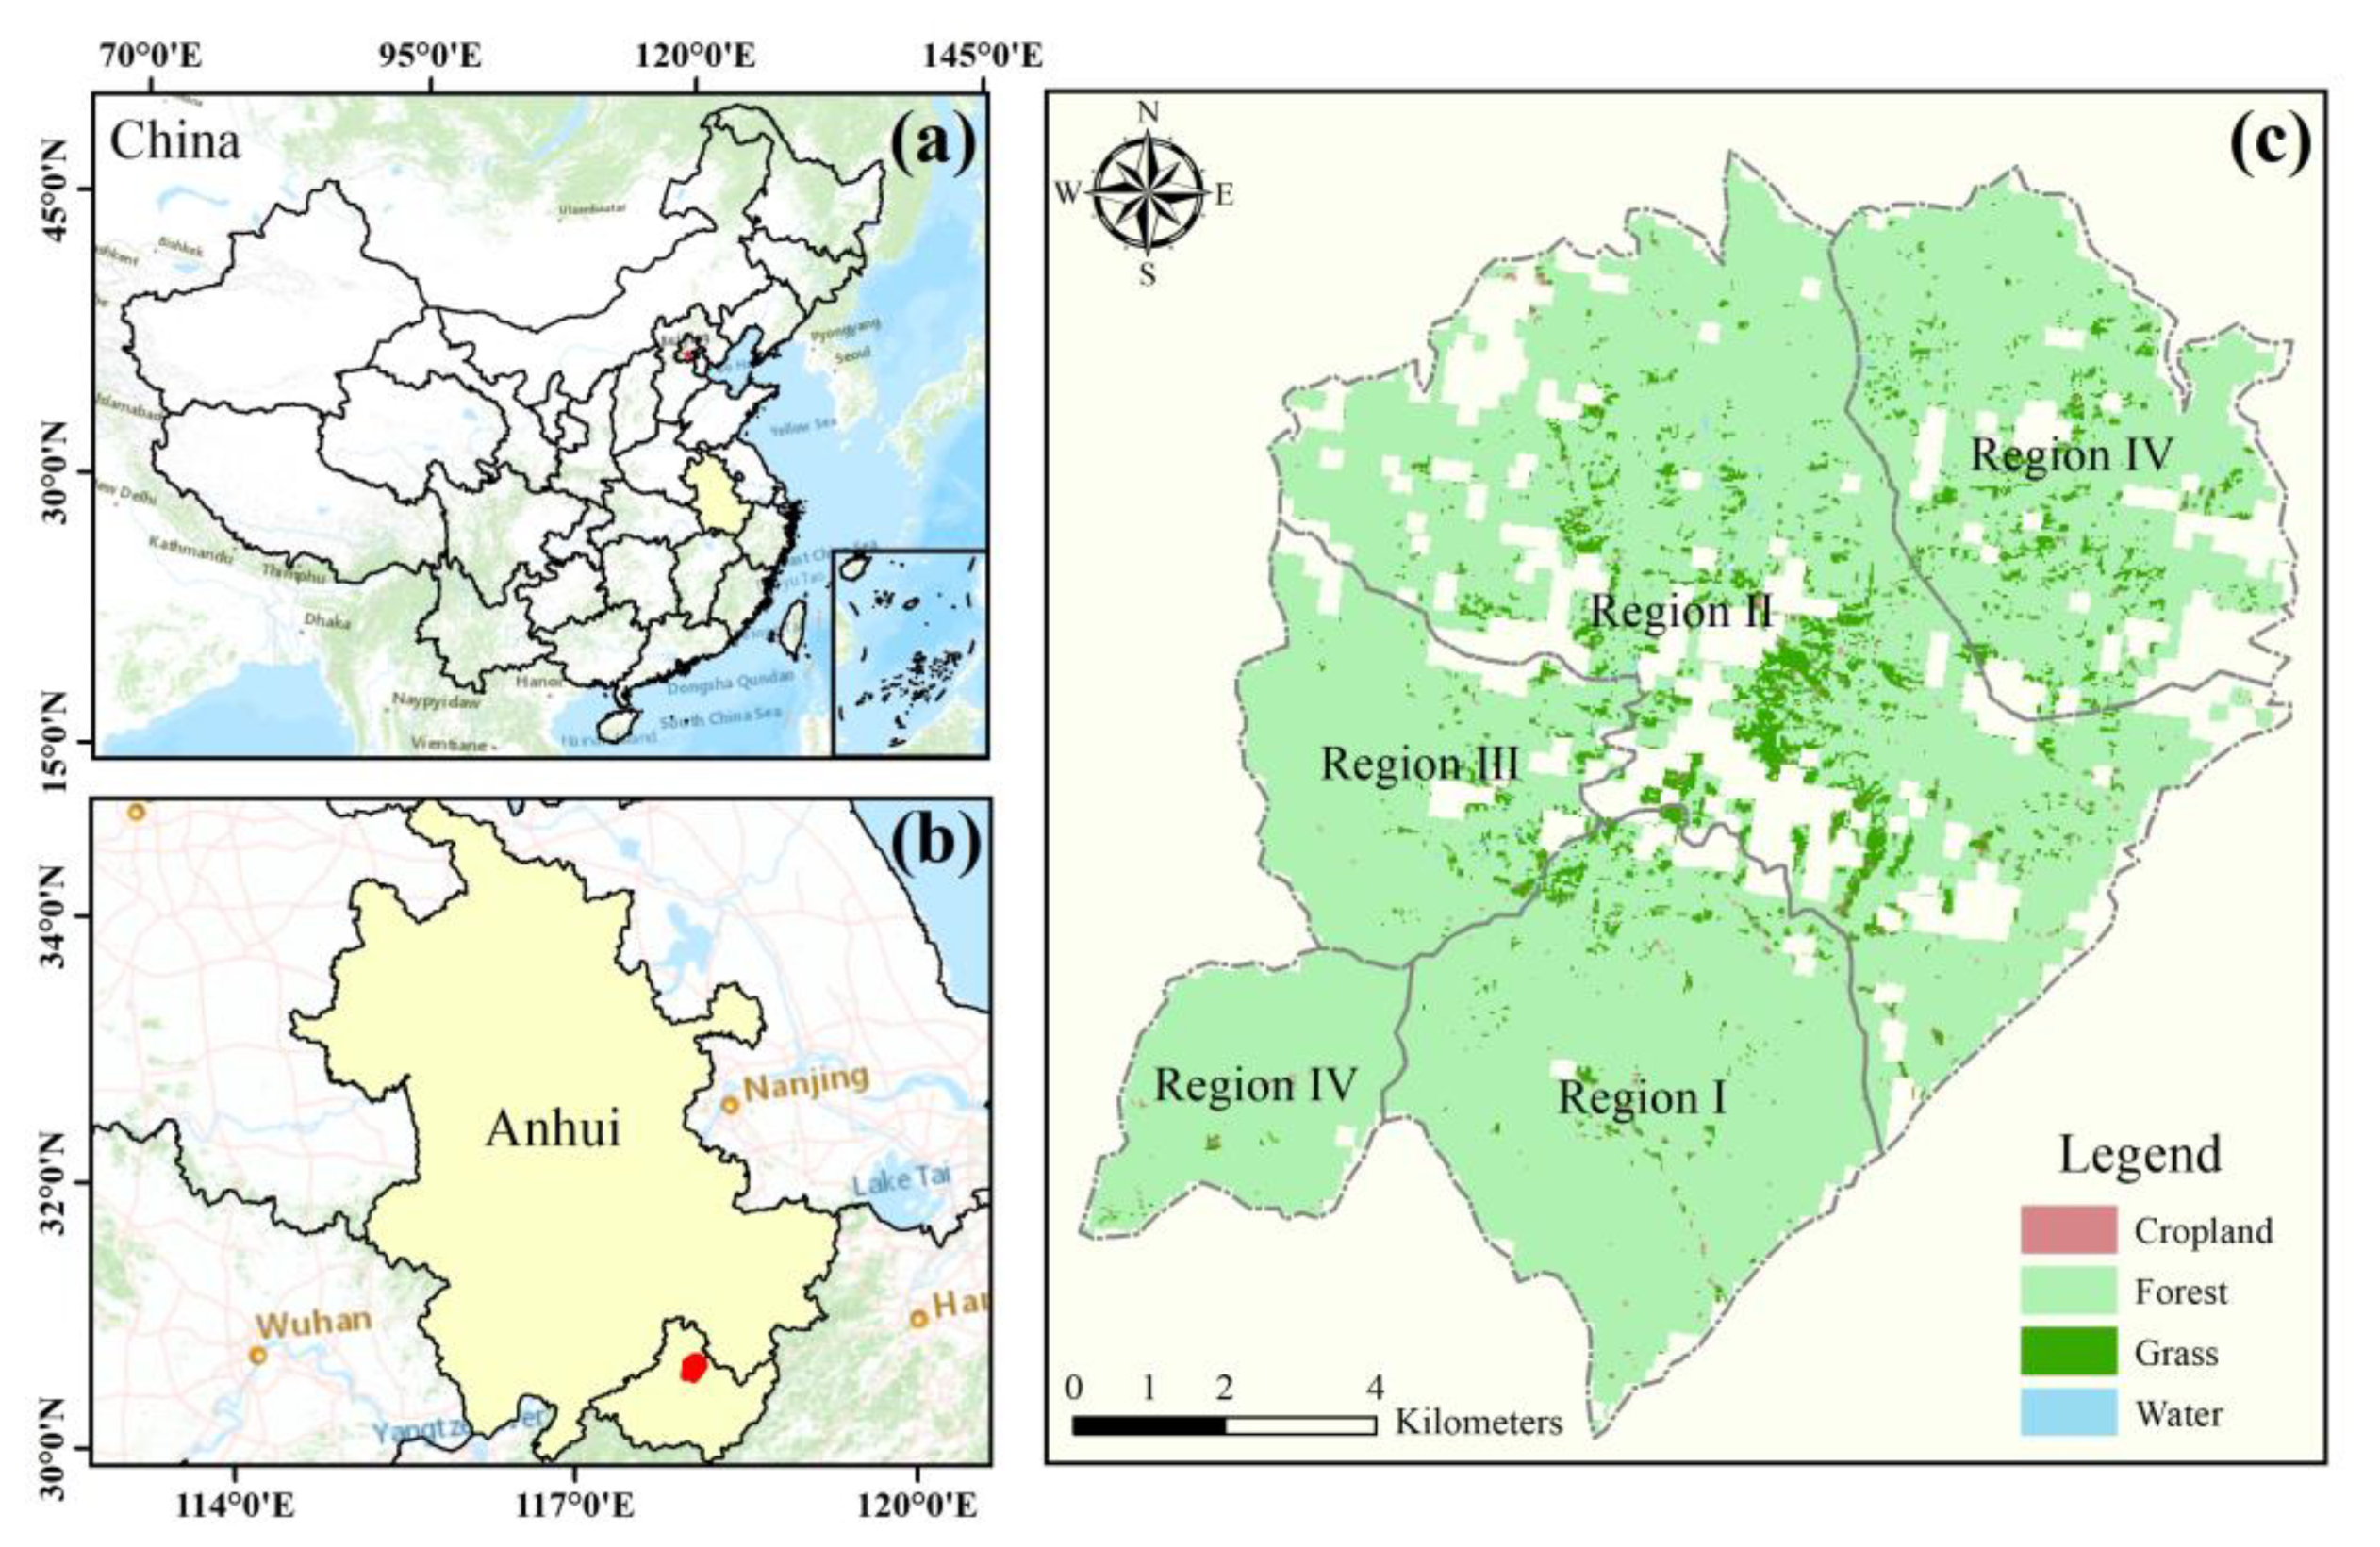
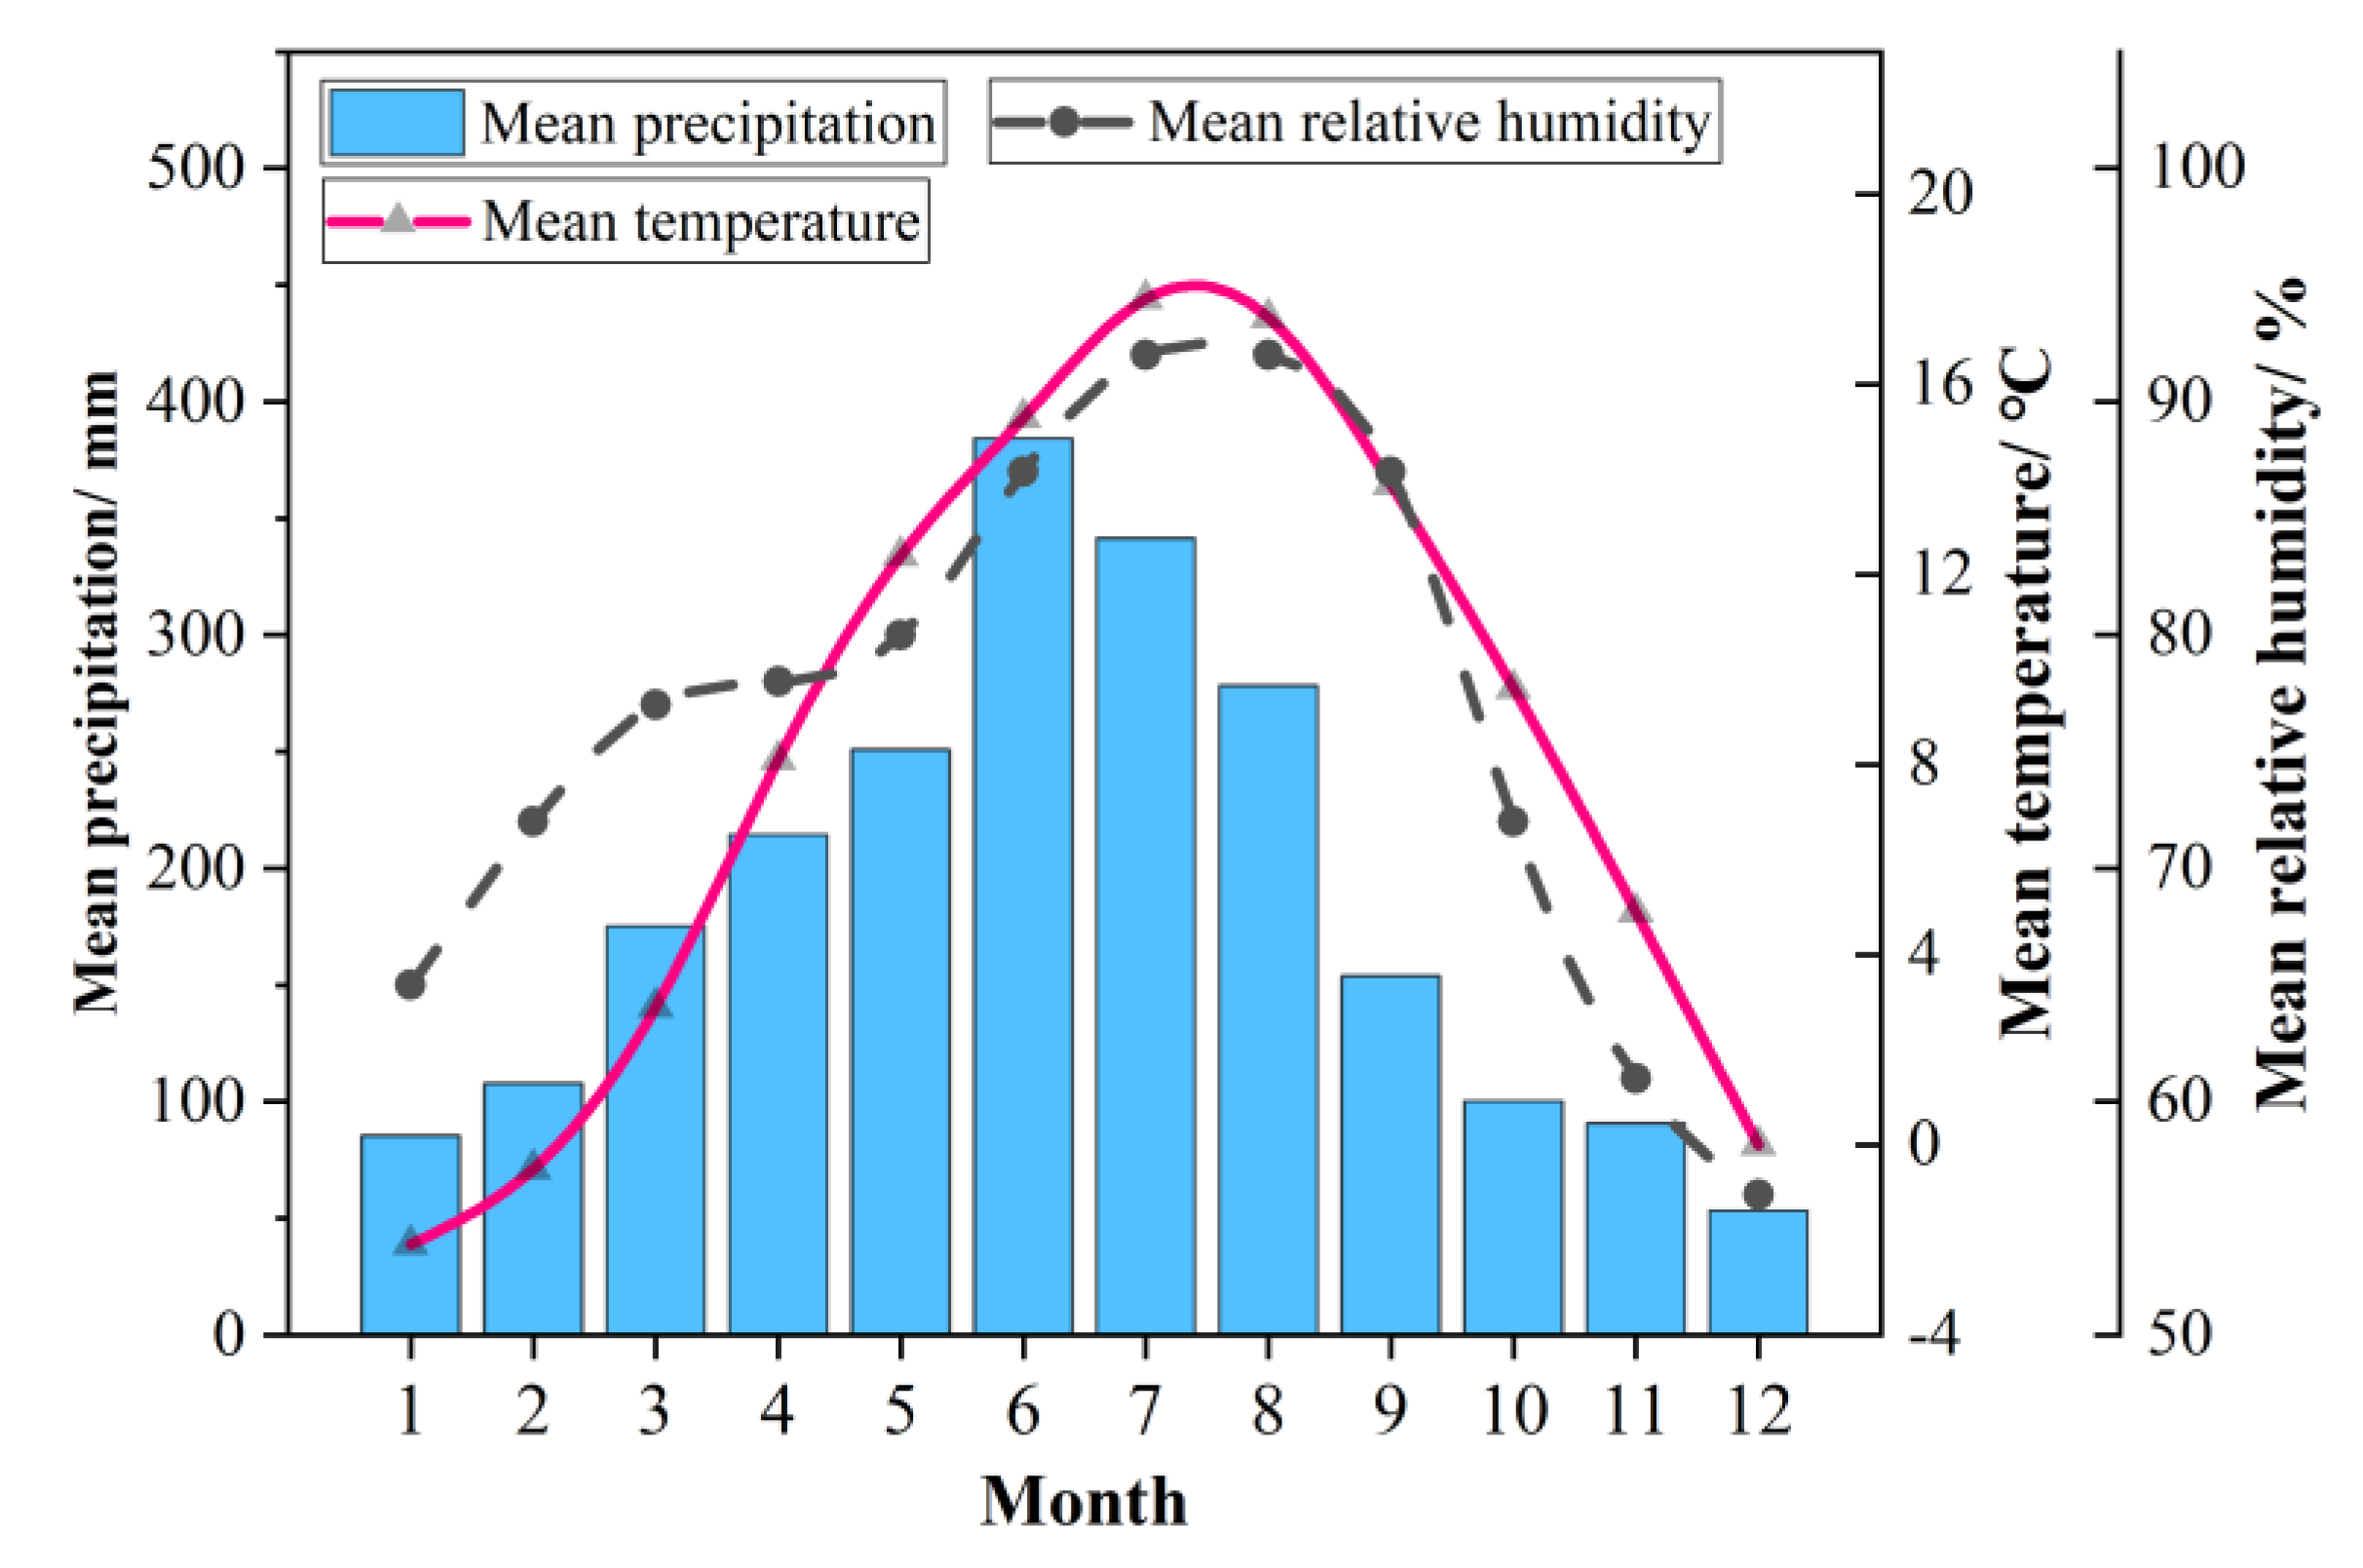
2.1. Study Area
2.2. Data Sources and Pretreatments
2.3. Calculations of Water Retention and Carbon Sequestration
2.4. Multivariate Correlation Analysis and Variance Partitioning
2.5. Evaluation of the Structural Equation Model
3. Results
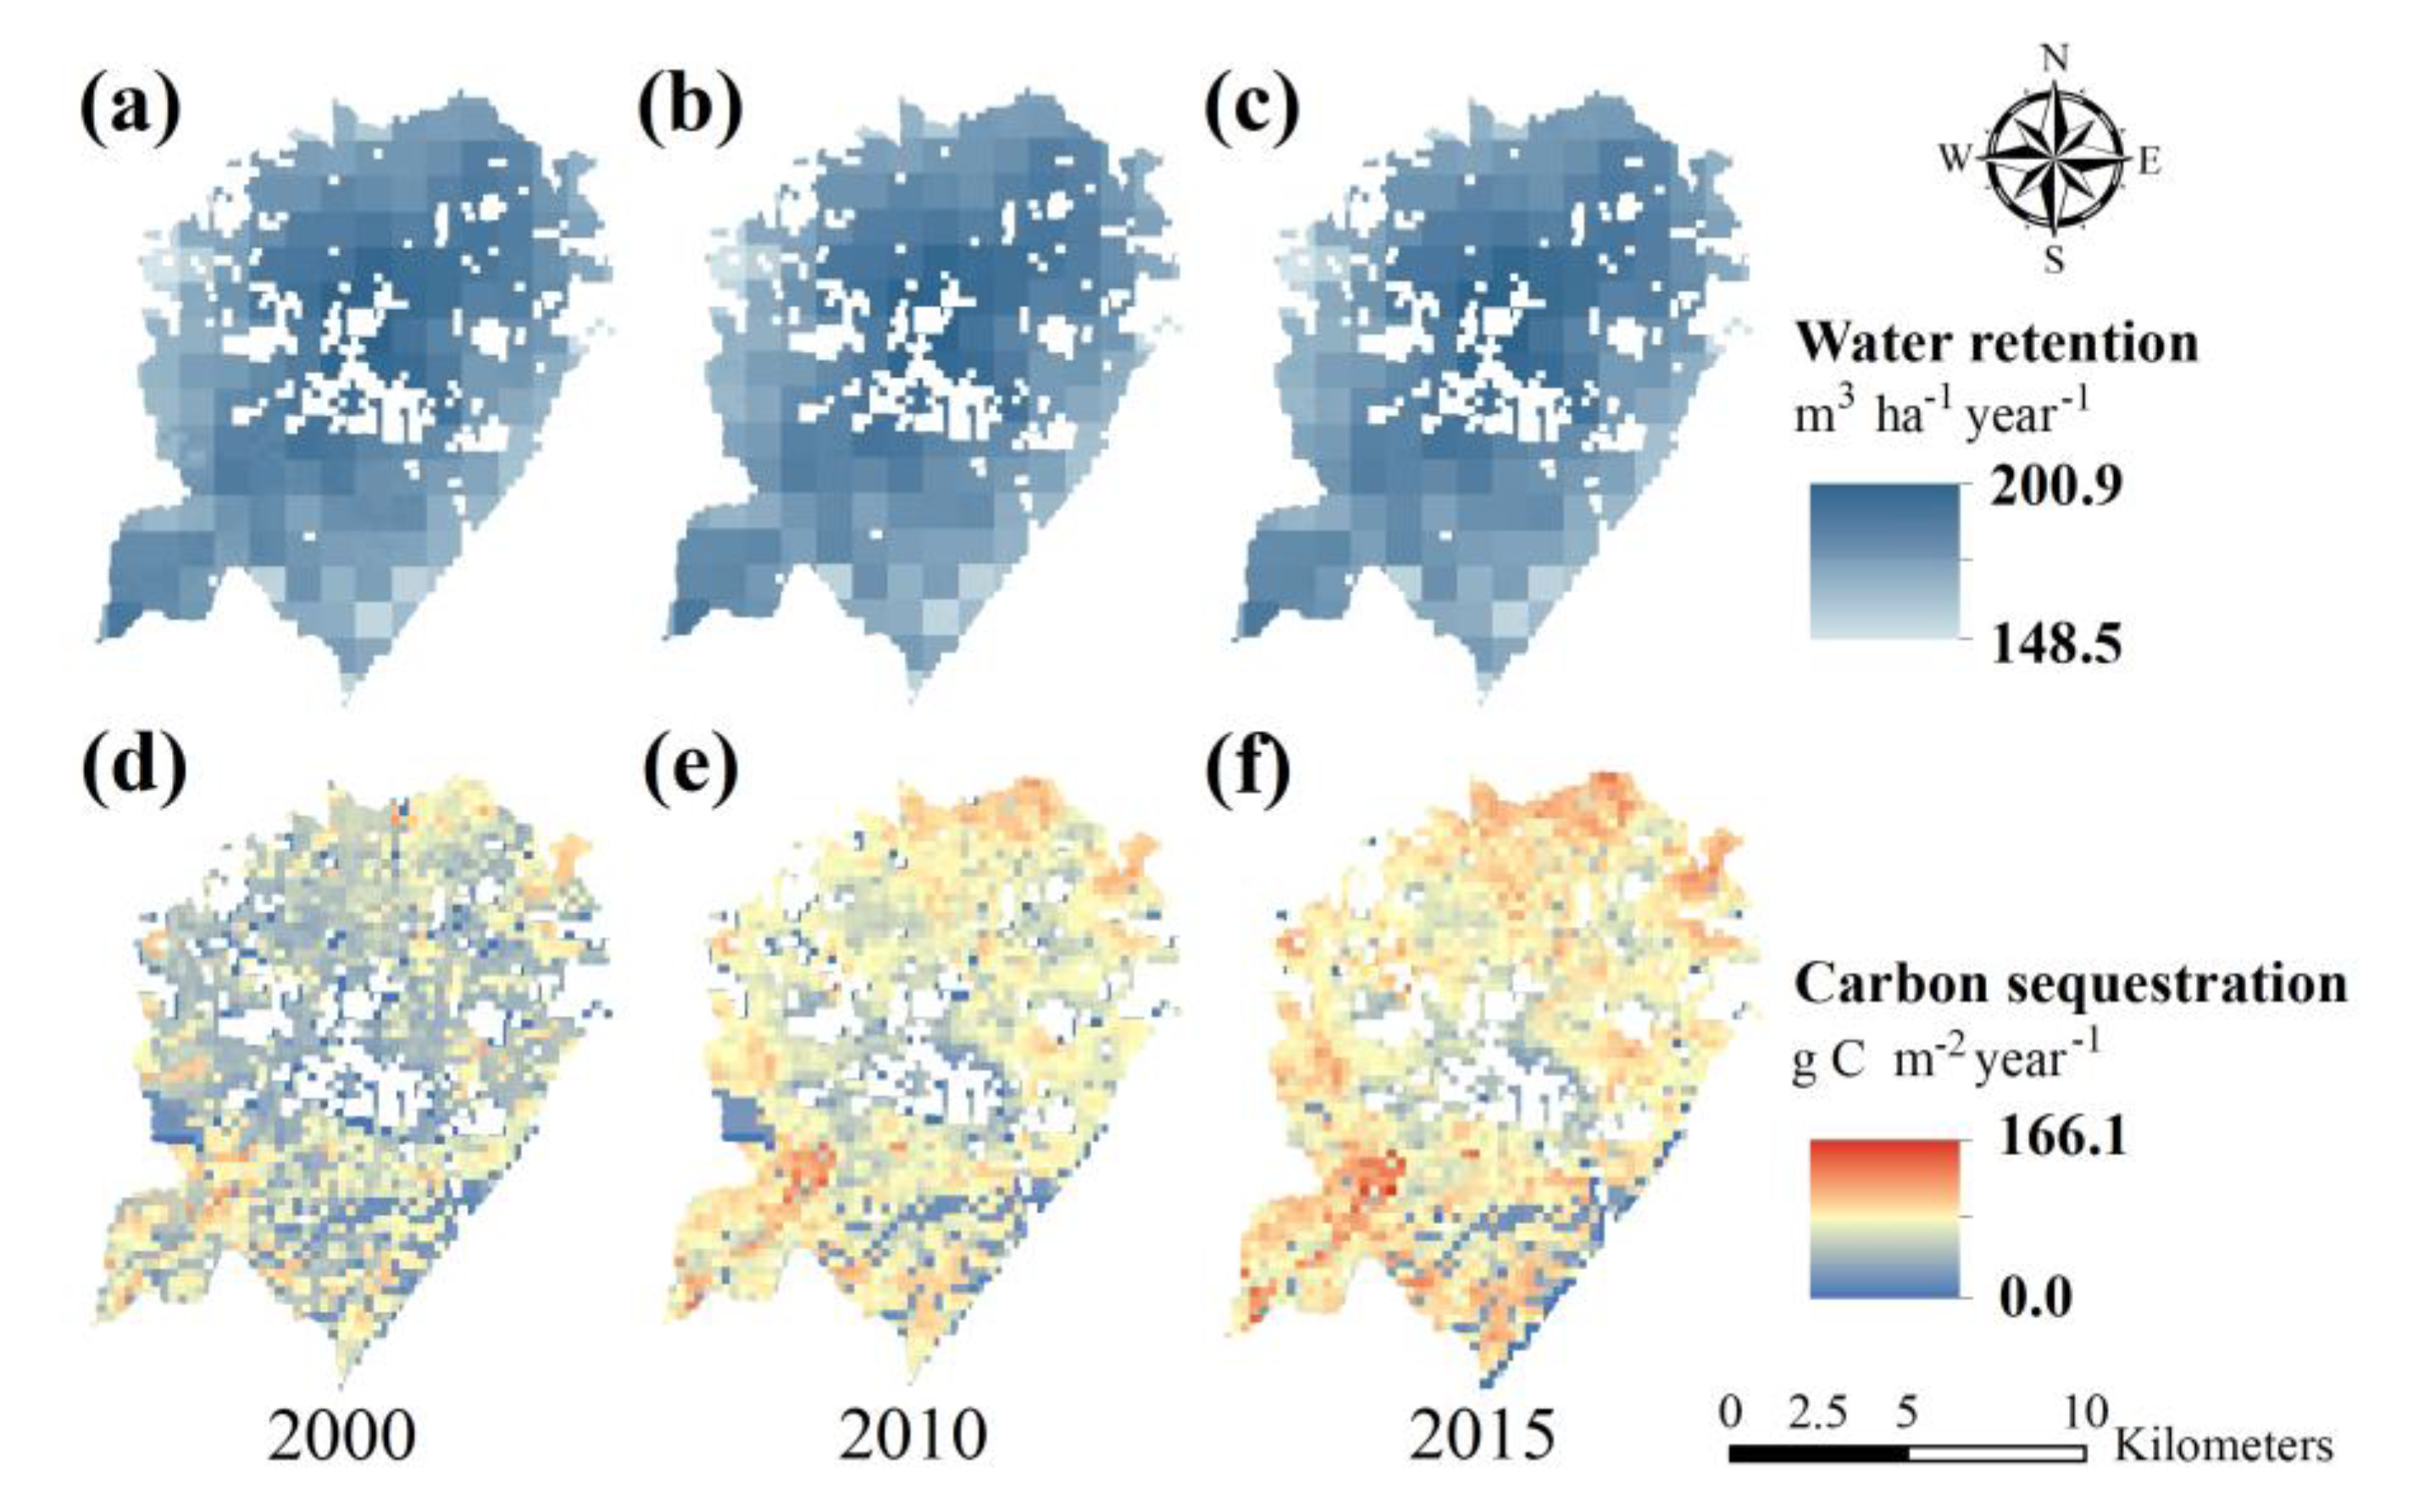
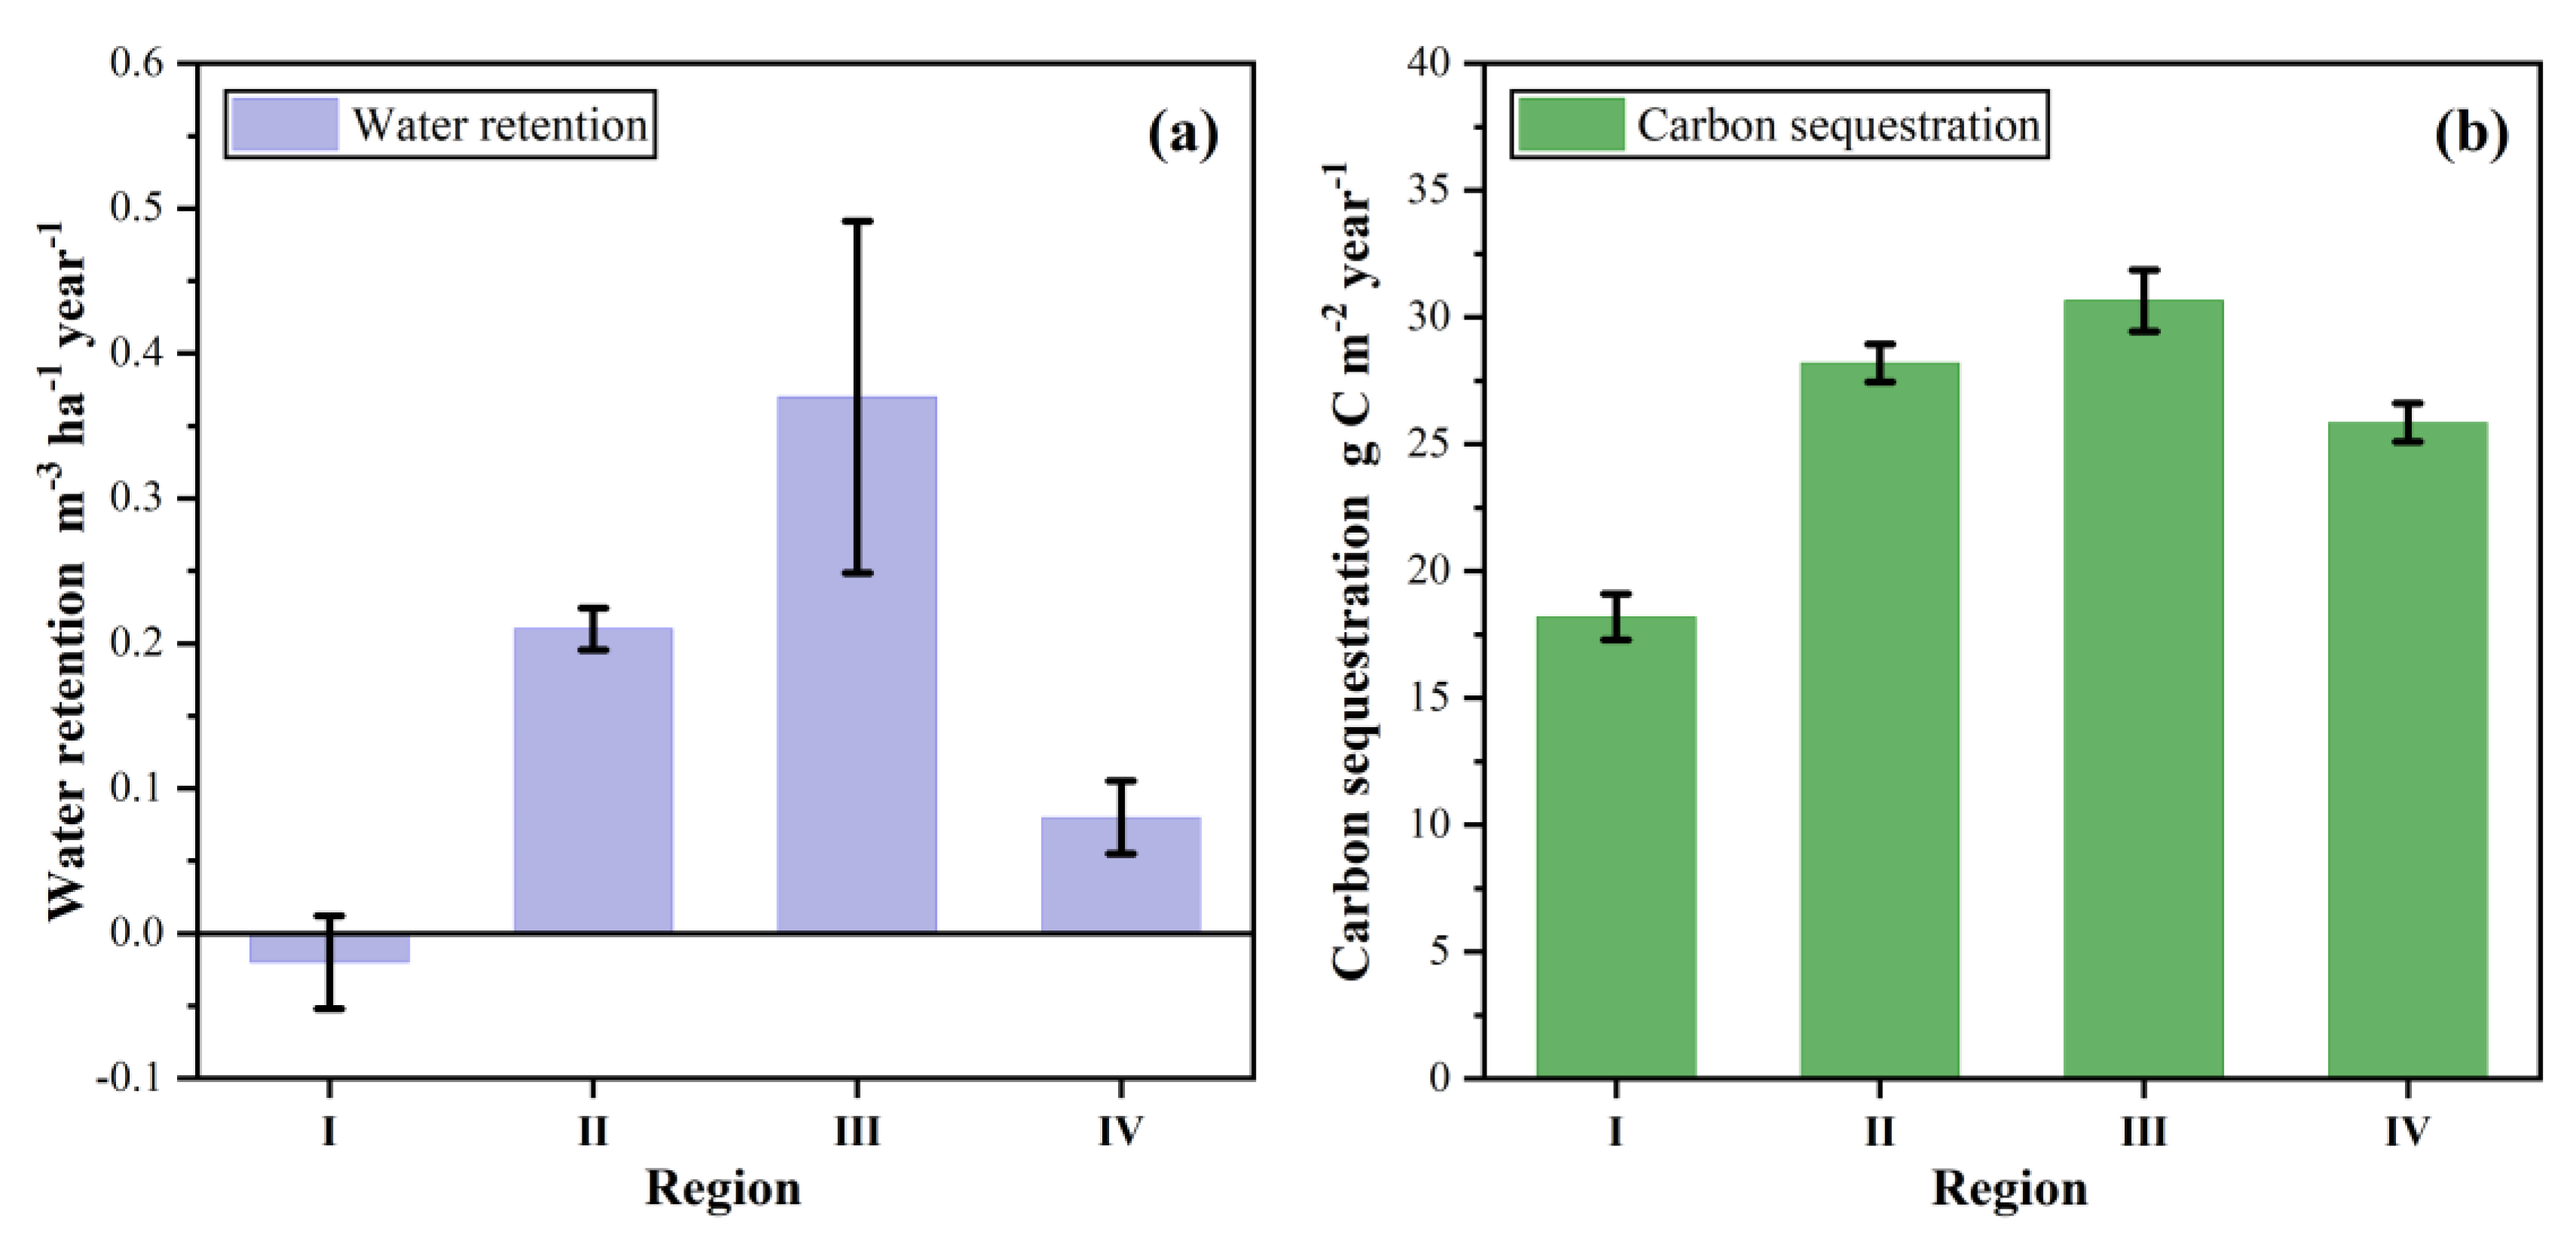
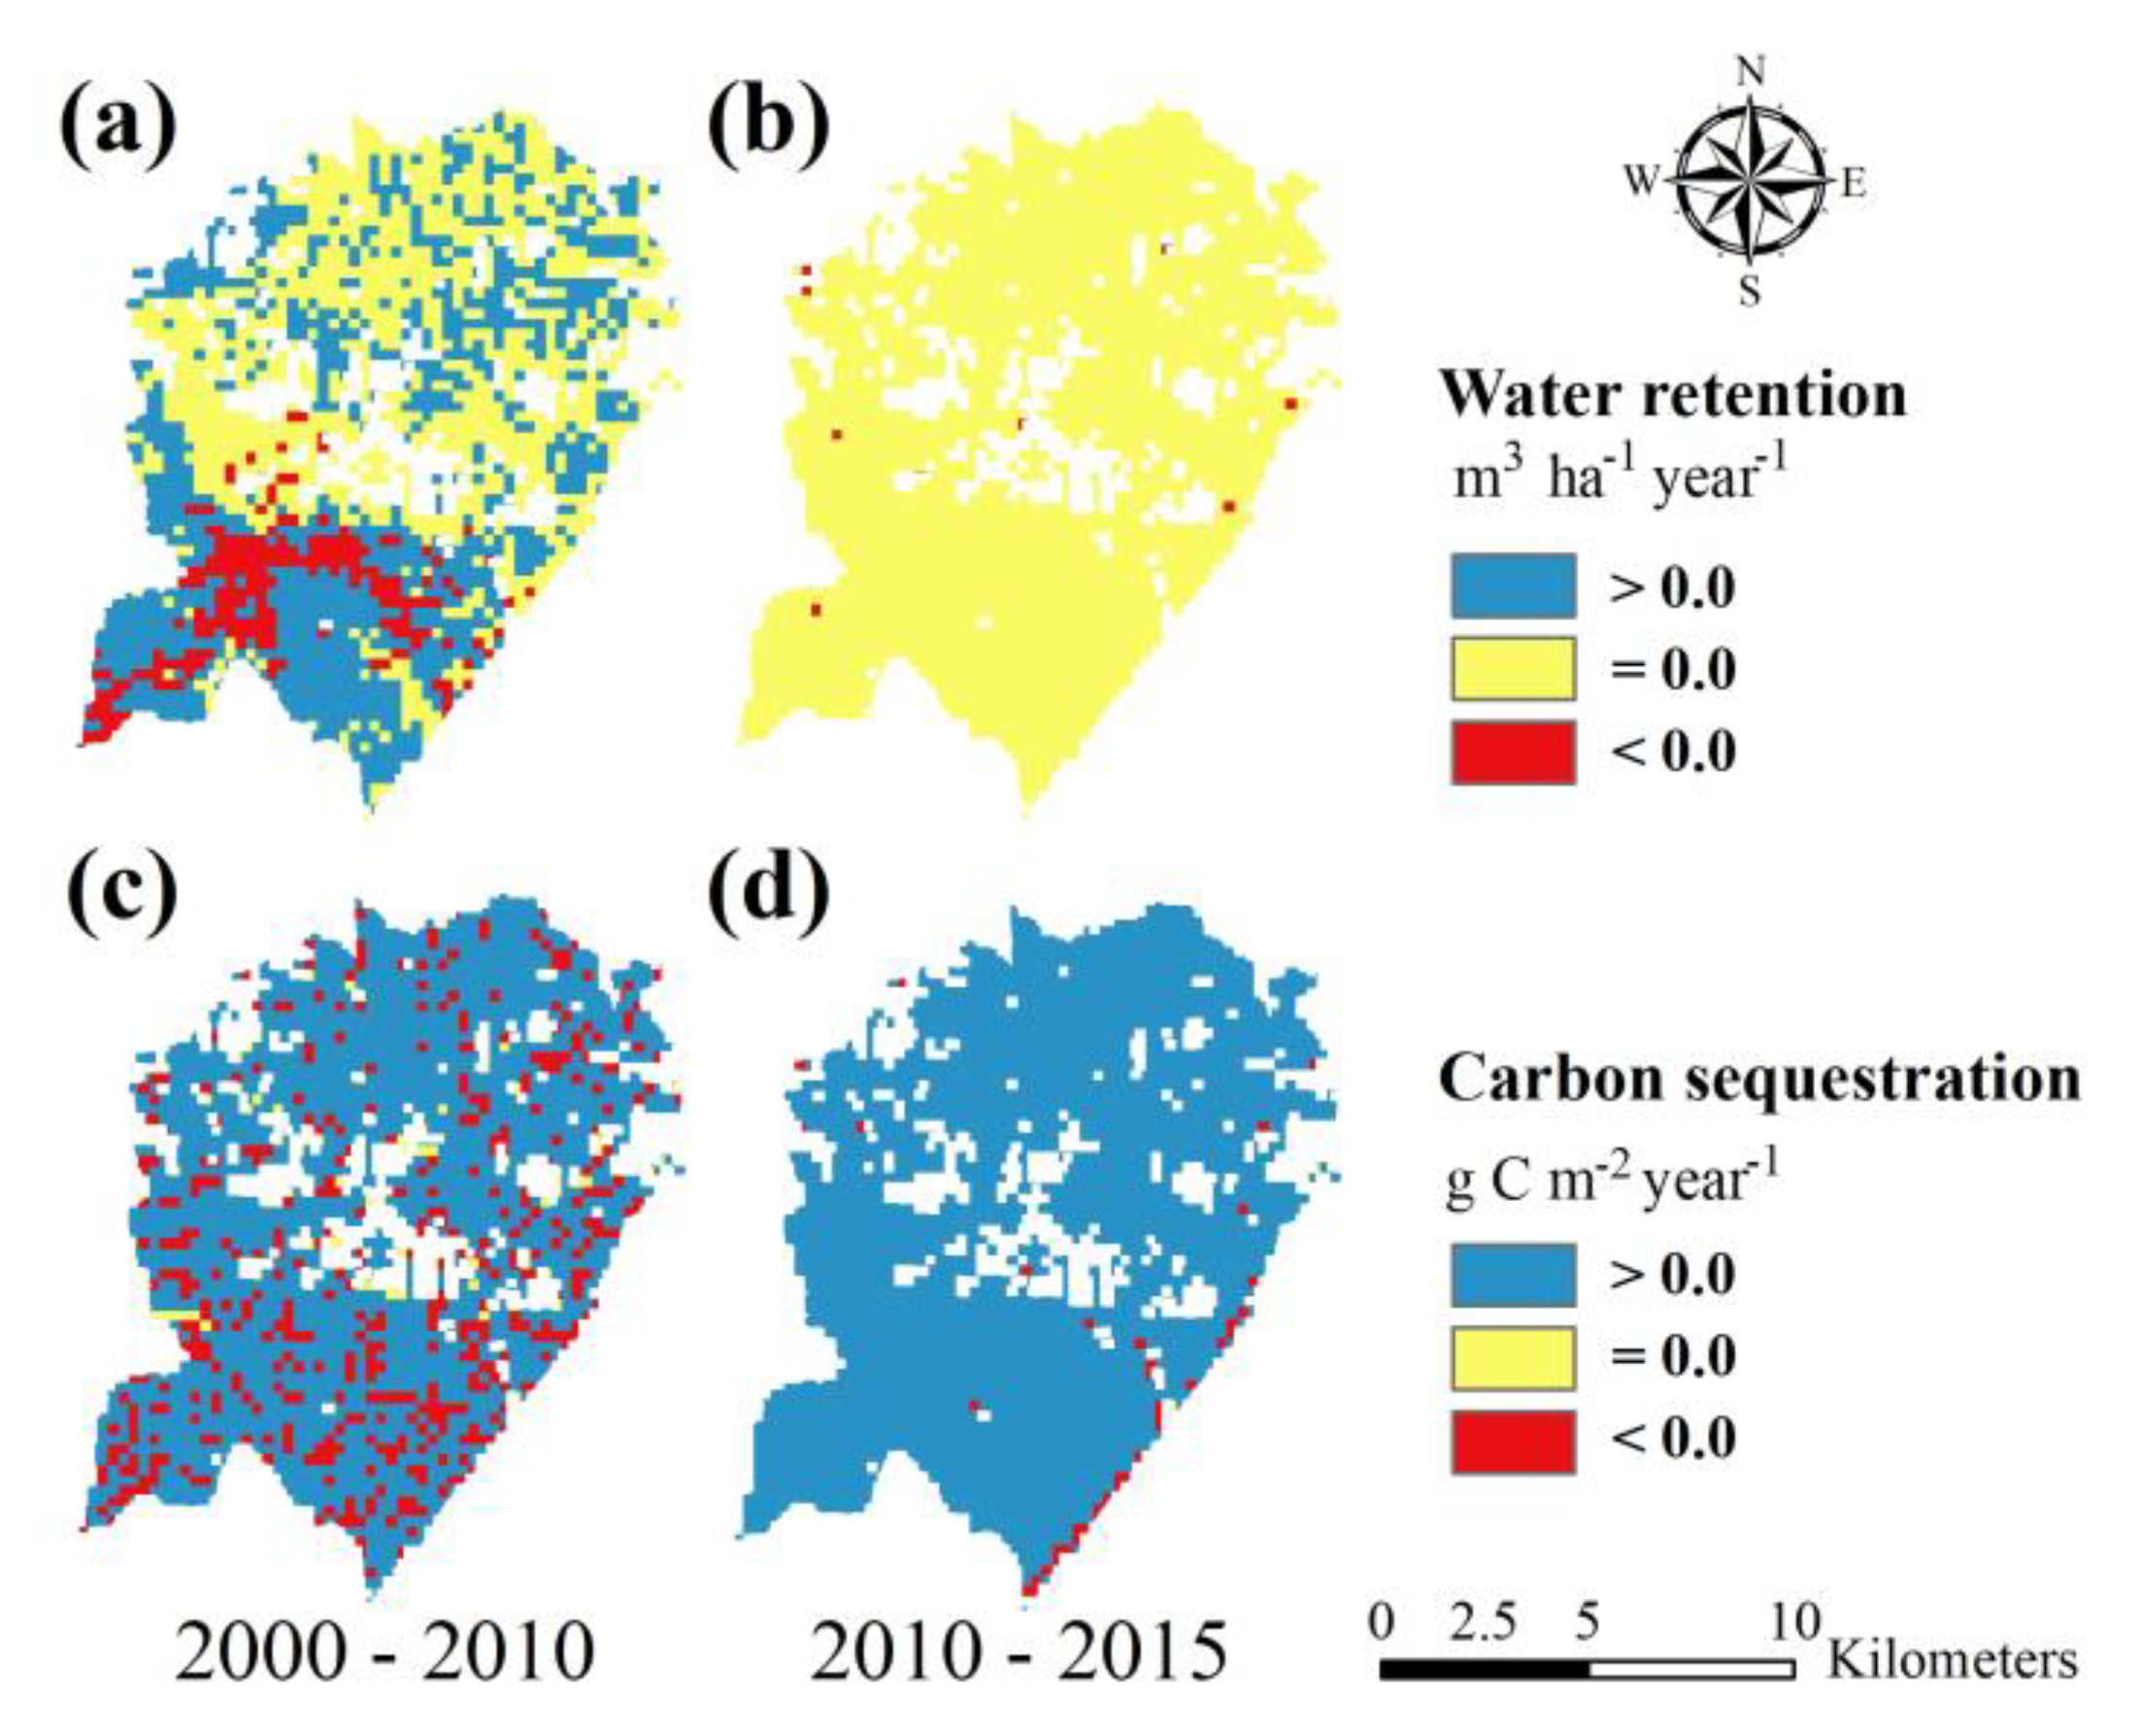
3.1. Dynamic Evaluation of Water Retention and Carbon Sequestration
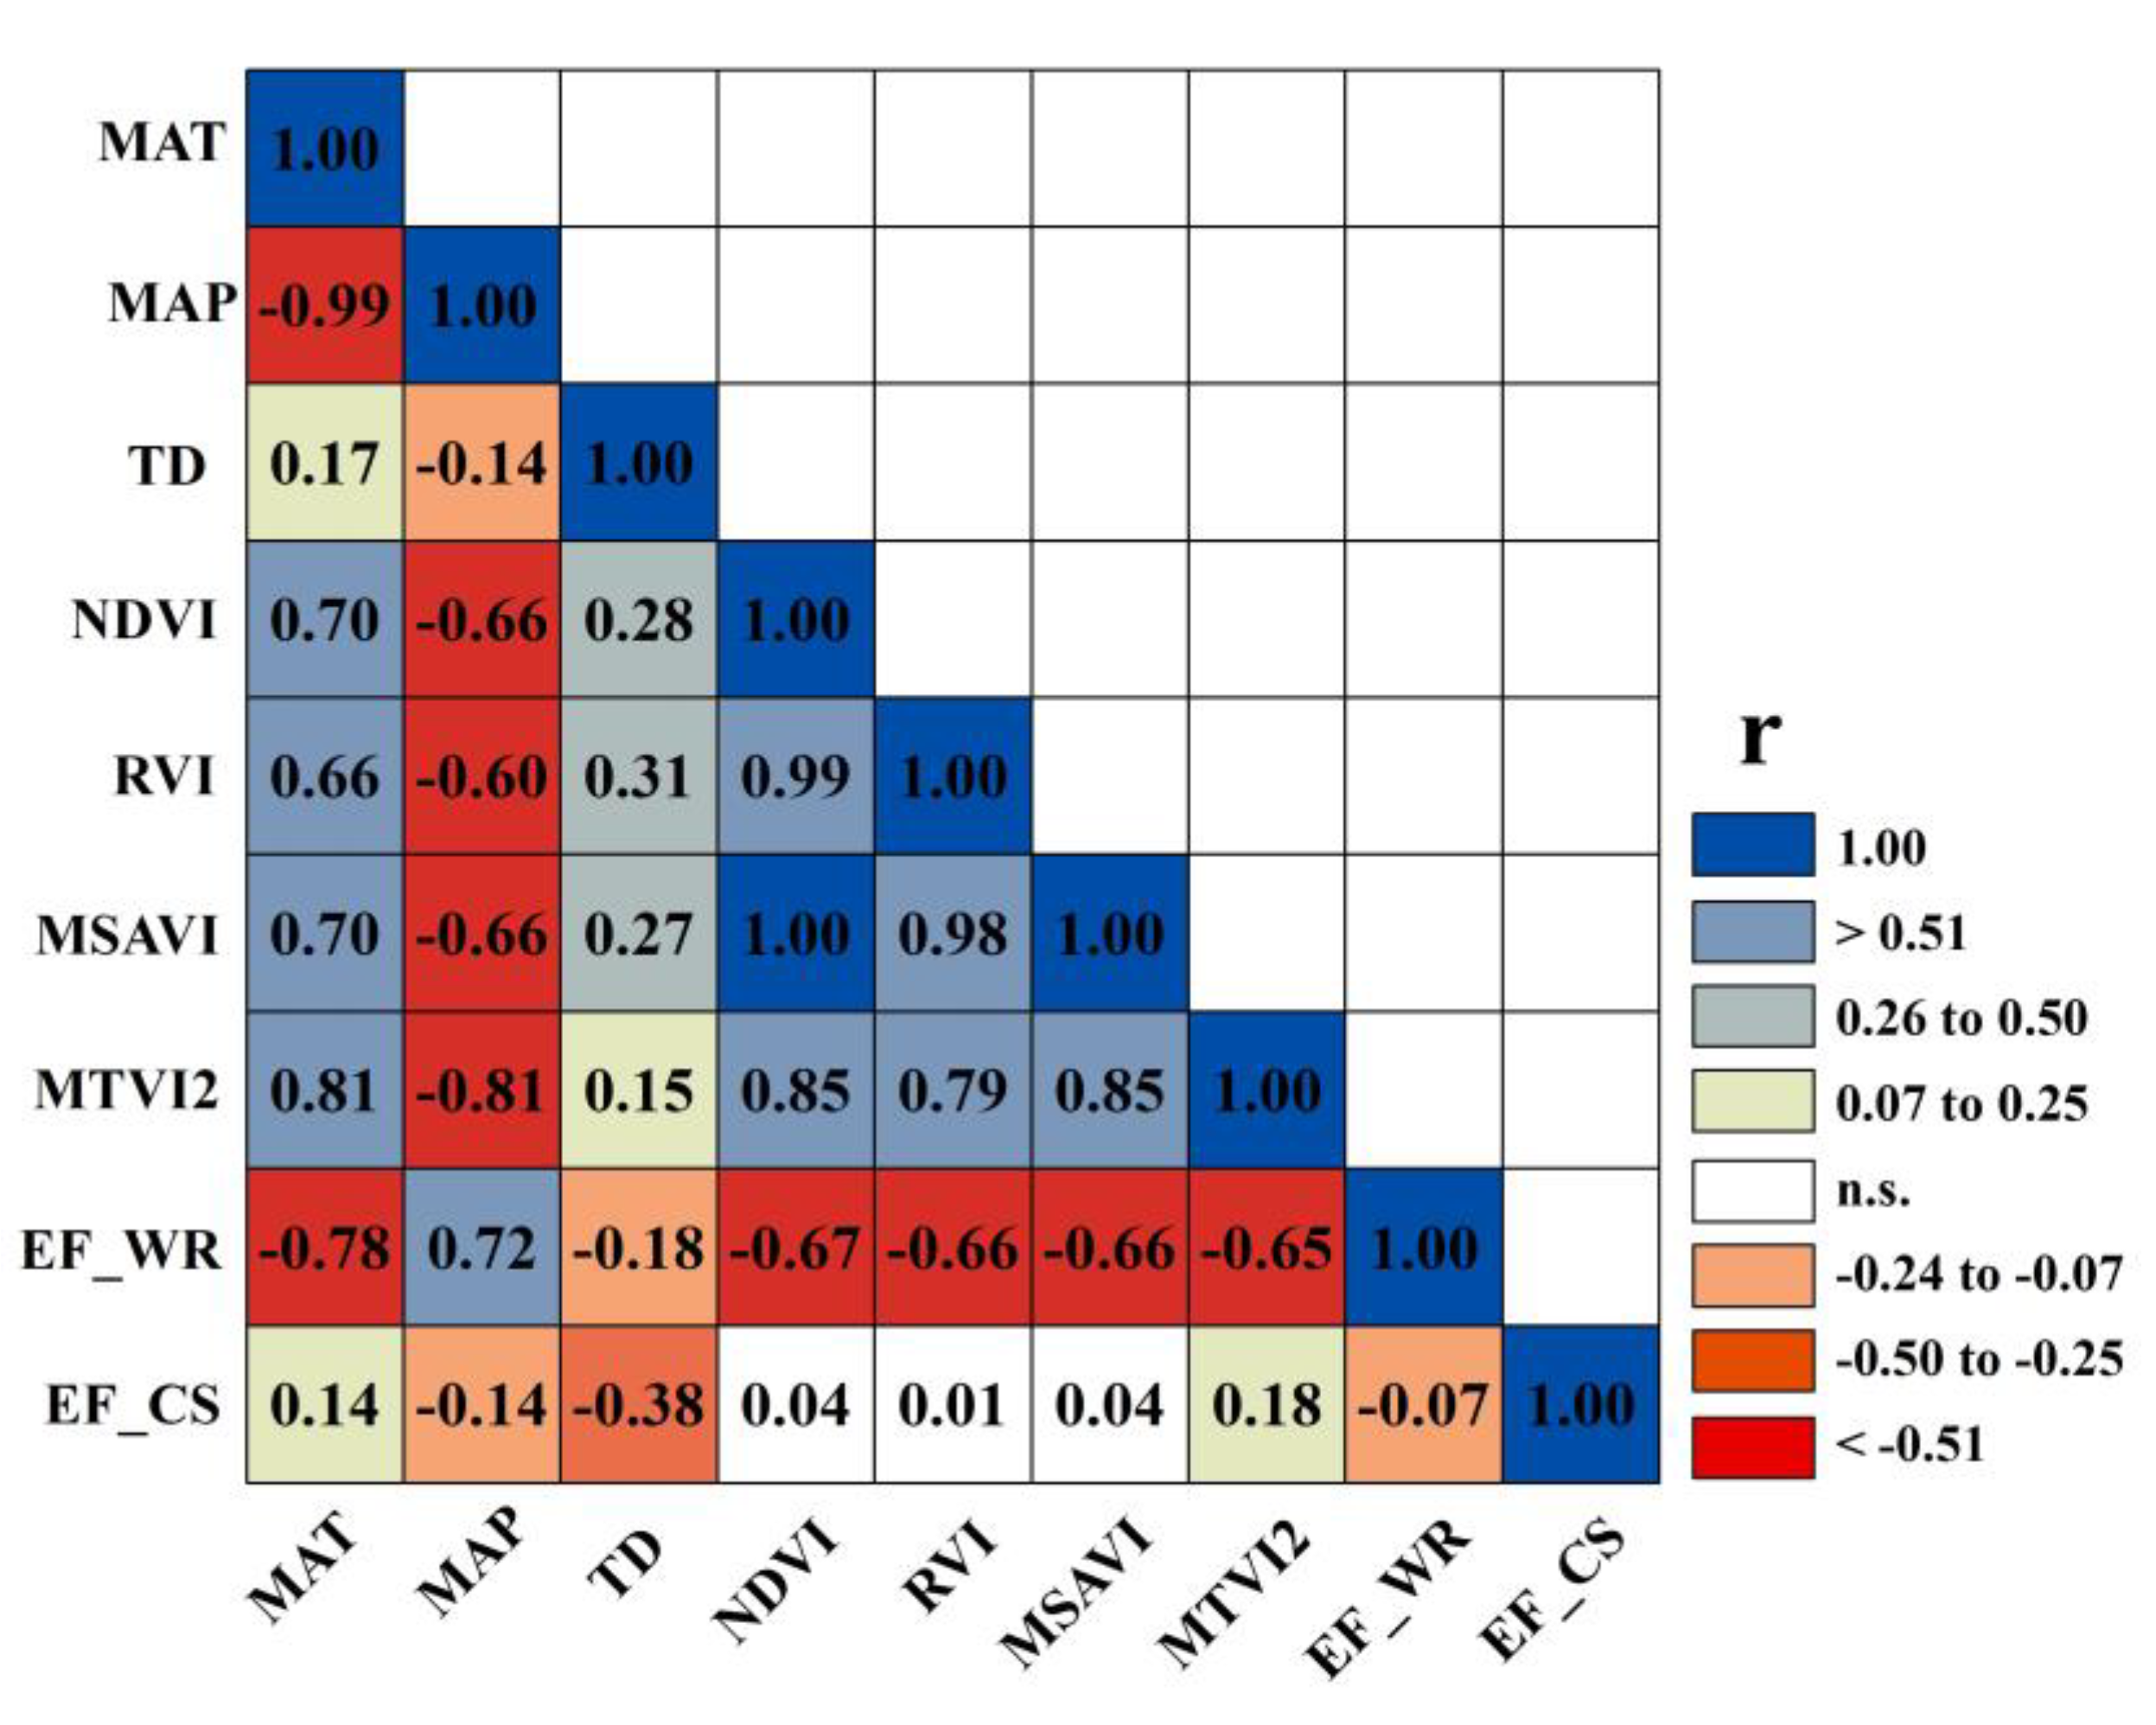
3.2. Correlation Among Observed Variables
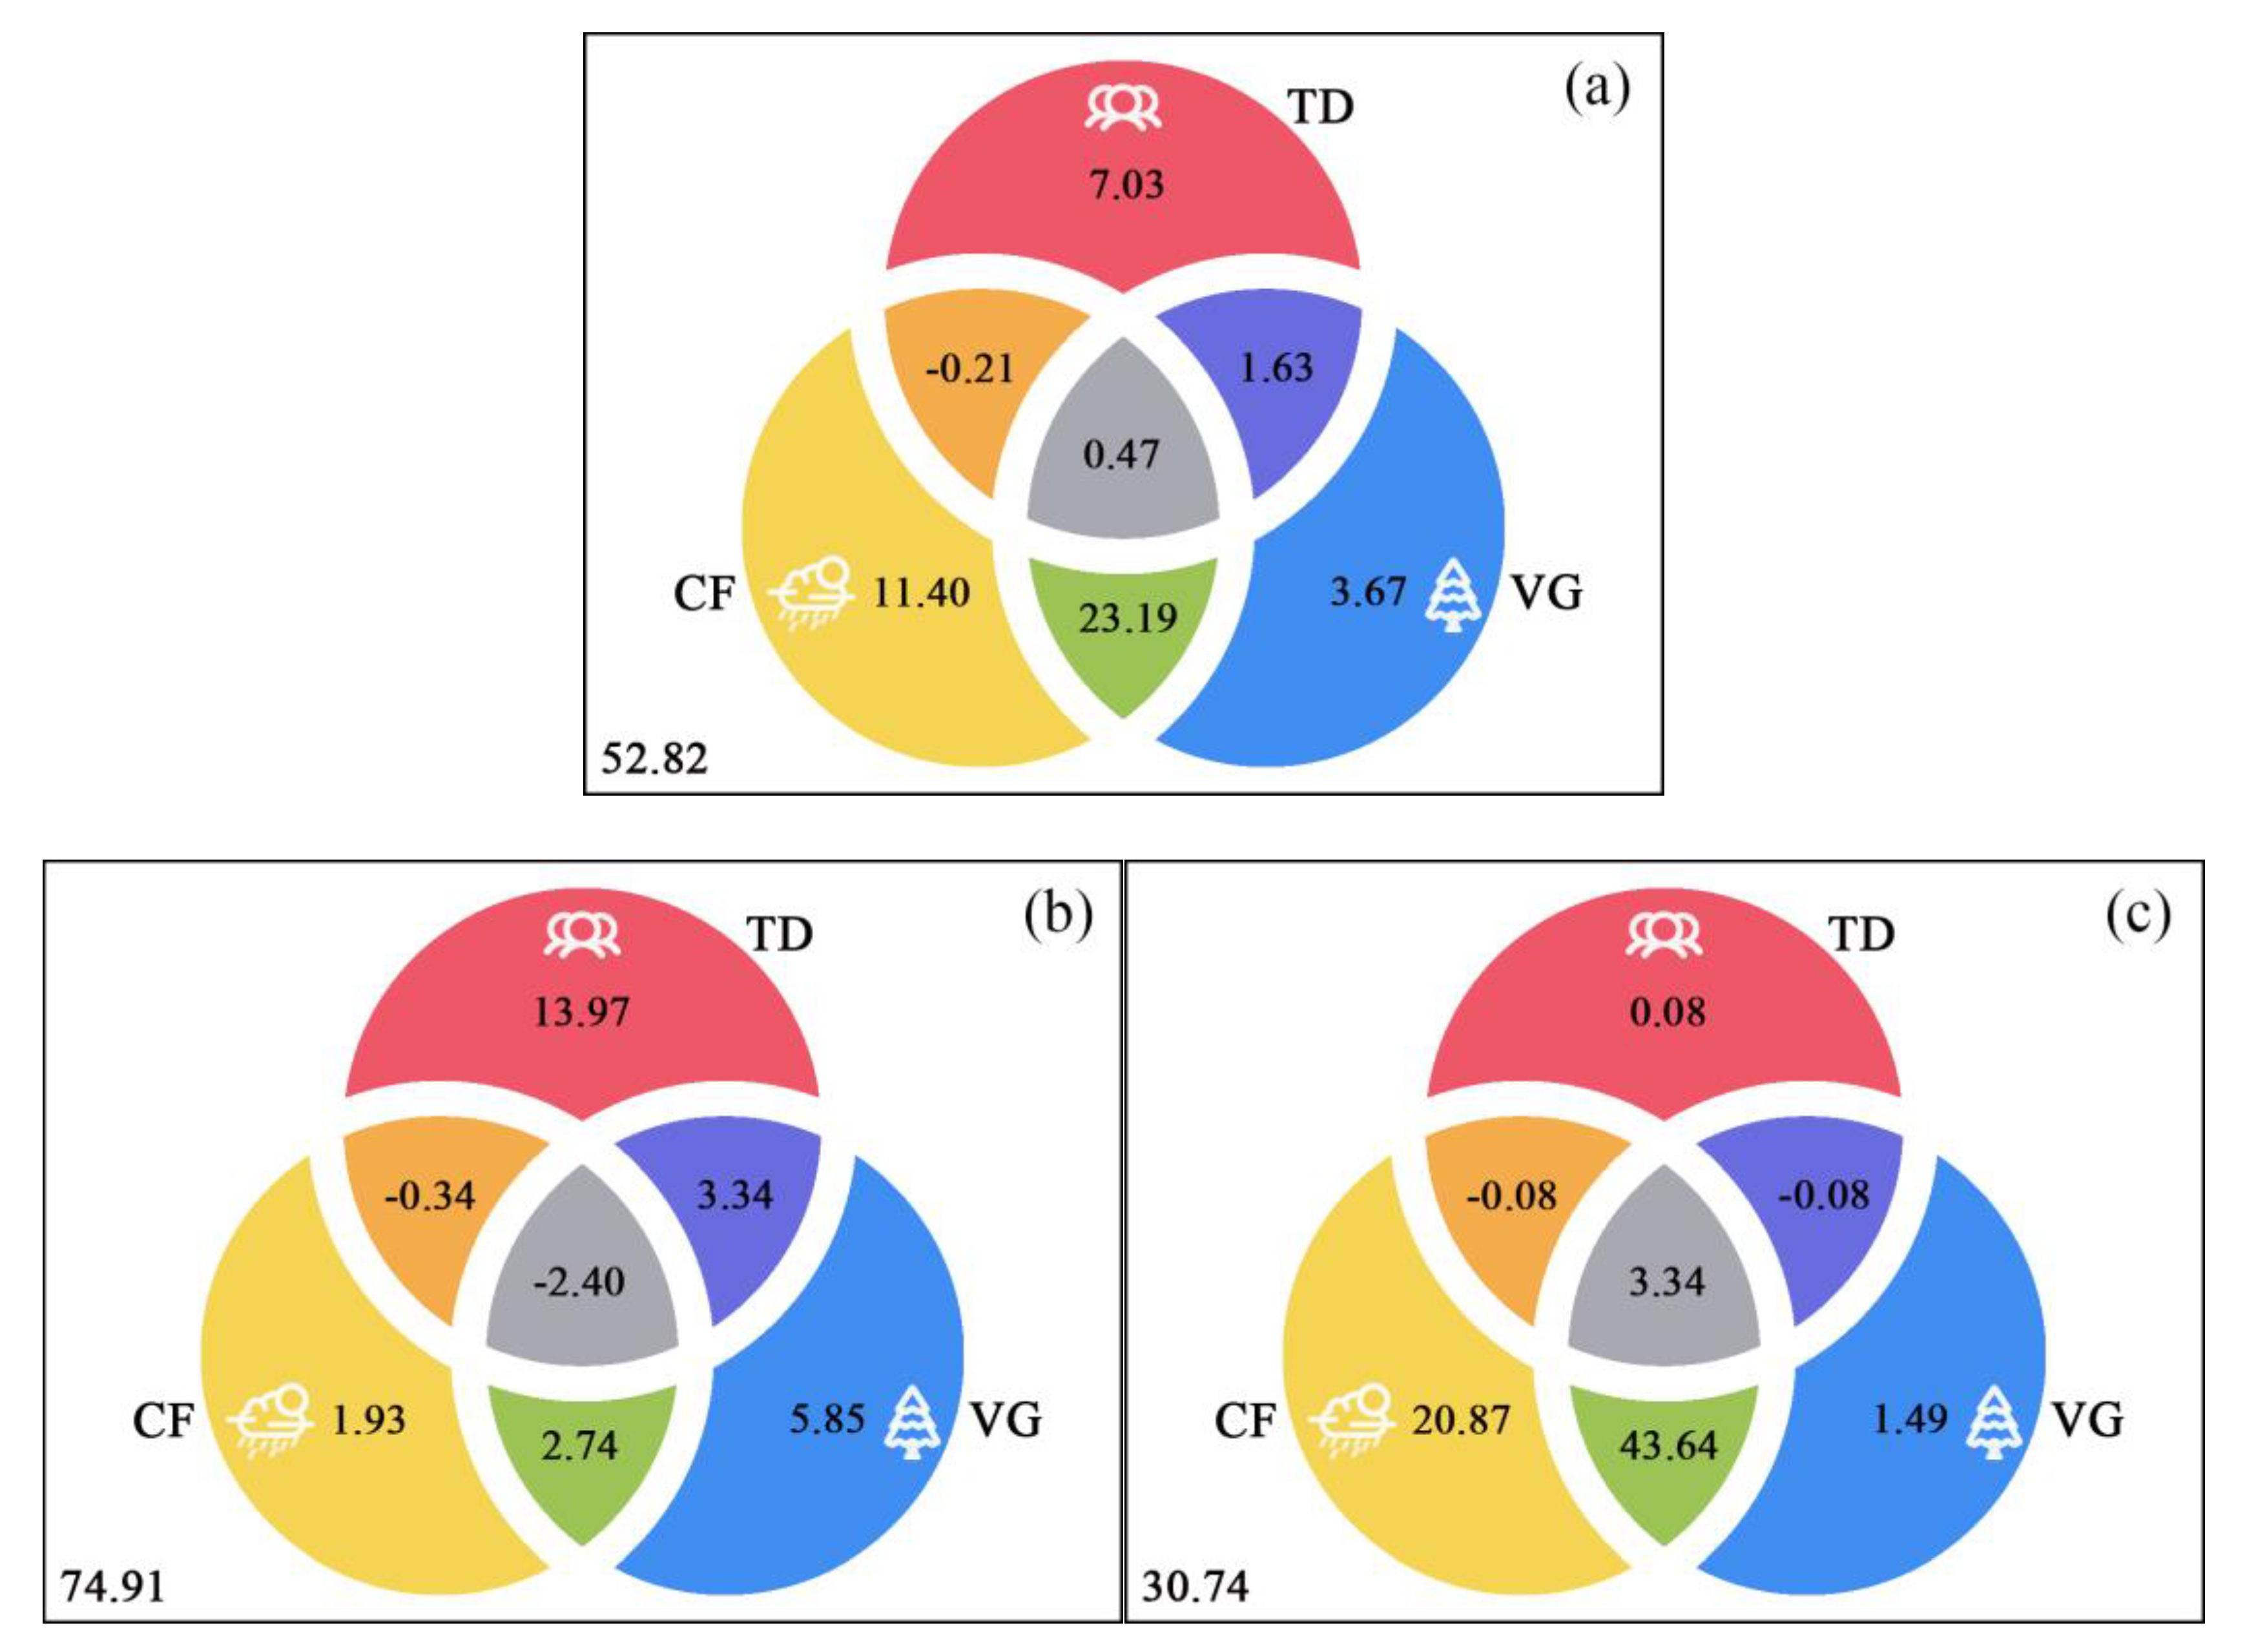
3.3. Multiple Controls of Water Retention and Carbon Sequestration
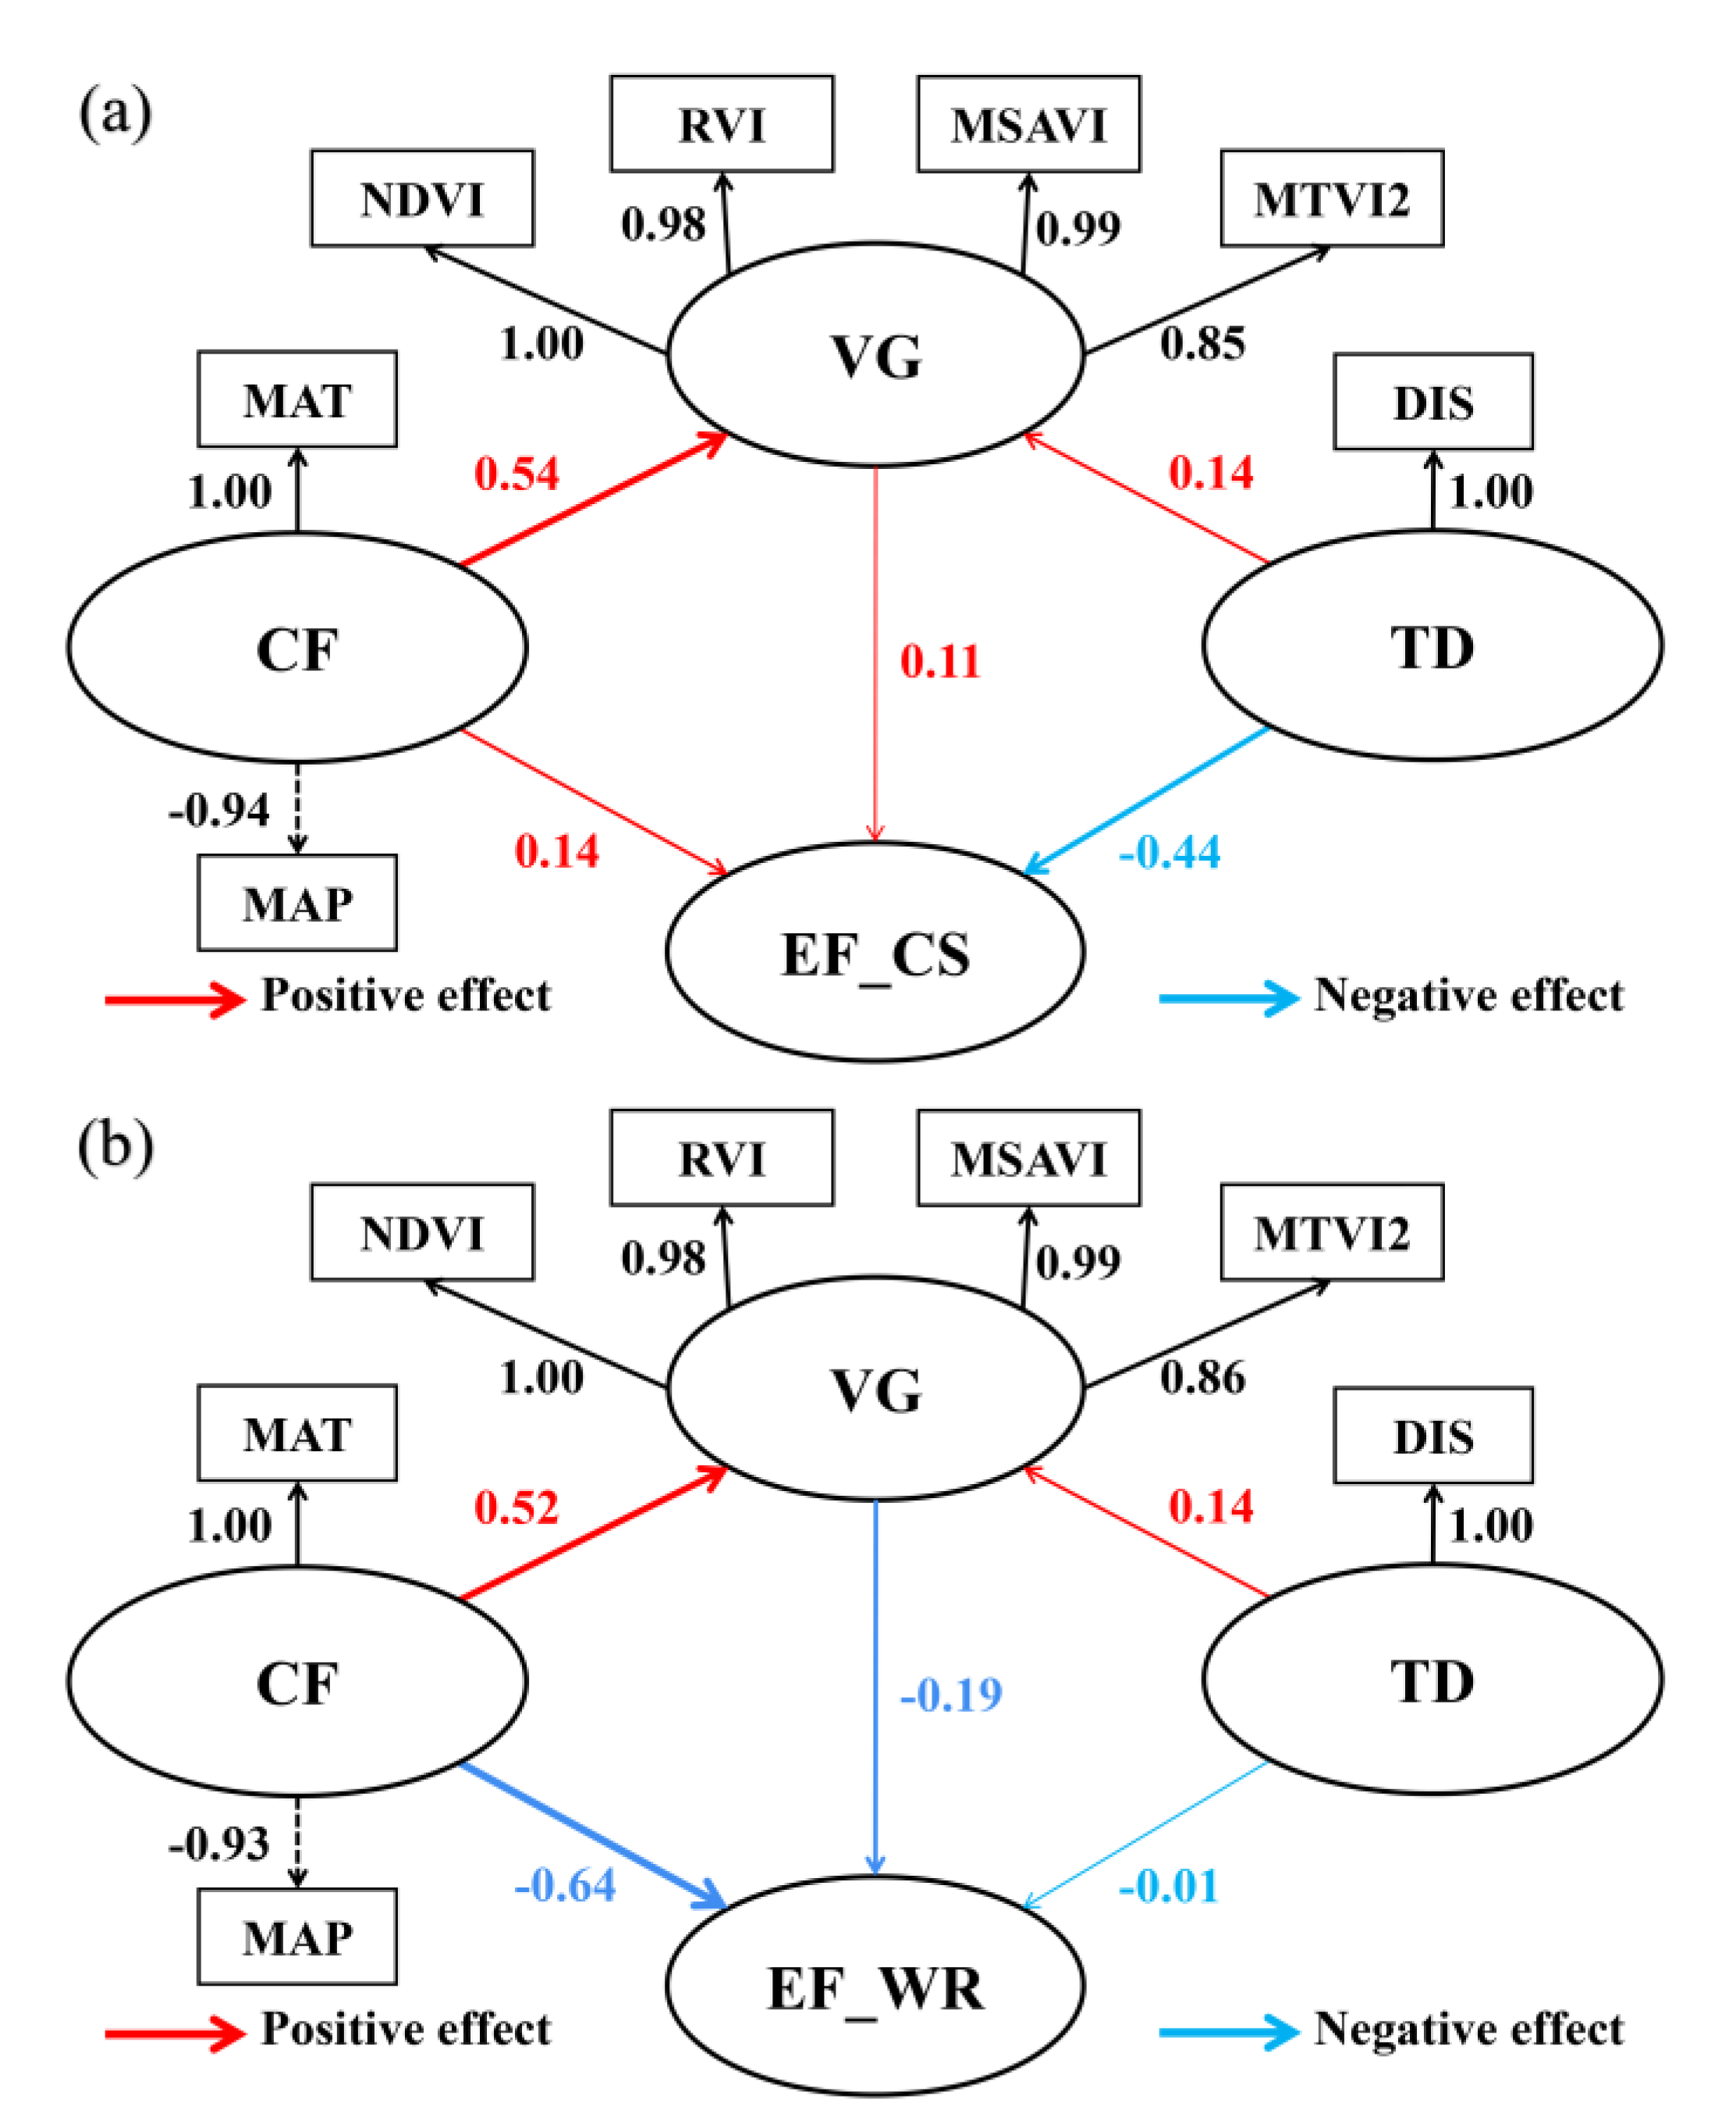
3.4. Analysis of the Fitted SEM
4. Discussion
4.1. Changes in Water Retention and Carbon Sequestration in the HUGG
4.2. Factors Affecting the HUGG Ecosystem Functions
4.3. Implications and Uncertainties
5. Conclusions
Author Contributions
Funding
Acknowledgments
Conflicts of Interest
Appendix A


References
- McKeever, P.J.; Zouros, N. Geoparks: Celebrating Earth heritage, sustaining local communities. Episodes 2005, 28, 274. [Google Scholar] [CrossRef] [Green Version]
- Eder, E.W.; Patzak, M. Geoparks-geological attractions: A tool for public education, recreation and sustainable economic development. Episodes 2004, 27, 162–164. [Google Scholar] [CrossRef] [PubMed] [Green Version]
- Foley, J.A.; DeFries, R.; Asner, G.P.; Barford, C.; Bonan, G.; Carpenter, S.R.; Chapin, F.S.; Coe, M.T.; Daily, G.C.; Gibbs, H.K.; et al. Global consequences of land use. Science 2005, 309, 570–574. [Google Scholar] [CrossRef] [PubMed] [Green Version]
- Bennett, E.M.; Peterson, G.D.; Gordon, L.J. Understanding relationships among multiple ecosystem services. Ecol. Lett. 2009, 12, 1394–1404. [Google Scholar] [CrossRef] [PubMed]
- Tenerelli, P.; Pueffel, C.; Luque, S. Spatial assessment of aesthetic services in a complex mountain region: Combining visual landscape properties with crowdsourced geographic information. Landsc. Ecol. 2017, 32, 1097–1115. [Google Scholar] [CrossRef]
- Zhang, P.; Wang, N.; Yang, L.; Zhang, X.; Liu, Q. Evaluation and sensitivity analysis of the ecosystem service functions of haze absorption by green space based on its quality in China. Nat. Conserv. 2020, 40, 93–141. [Google Scholar] [CrossRef]
- Gao, X.; Huang, B.; Hou, Y.; Xu, W.; Zheng, H.; Ma, D.; Ouyang, Z. Using Ecosystem Service Flows to Inform Ecological Compensation: Theory & Application. Int. J. Environ. Res. Public Health 2020, 17, 3340. [Google Scholar] [CrossRef]
- Yang, G.; Chen, Z.; Tian, M.; Wu, F.; Wray, R.A.L.; Ping, Y. On the growth of national geoparks in China: Distribution, interpretation, and regional comparison. Episodes 2011, 34, 157–176. [Google Scholar] [CrossRef] [Green Version]
- Jiang, C.; Li, D.; Wang, D.; Zhang, L. Quantification and assessment of changes in ecosystem service in the Three-River Headwaters Region, China as a result of climate variability and land cover change. Ecol. Indic. 2016, 66, 199–211. [Google Scholar] [CrossRef]
- Shi, Y.; Wang, R.; Huang, J.; Yang, W. An analysis of the spatial and temporal changes in Chinese terrestrial ecosystem service functions. Chin. Sci. Bull. 2012, 57, 2120–2131. [Google Scholar] [CrossRef] [Green Version]
- Li, R.Q.; Dong, M.; Cui, J.Y.; Zhang, L.L.; Cui, Q.G.; He, W.M. Quantification of the impact of land-use changes on ecosystem services: A case study in Pingbian County, China. Environ. Monit Assess. 2007, 128, 503–510. [Google Scholar] [CrossRef] [PubMed]
- Li, J.; Wang, W.; Hu, G.; Wei, Z. Changes in ecosystem service values in Zoige Plateau, China. Agric. Ecosyst. Environ. 2010, 139, 766–770. [Google Scholar] [CrossRef]
- Fei, L.; Shuwen, Z.; Jiuchun, Y.; Kun, B.; Qing, W.; Junmei, T.; Liping, C. The effects of population density changes on ecosystem services value: A case study in Western Jilin, China. Ecol. Indic. 2016, 61, 328–337. [Google Scholar] [CrossRef]
- Dolinar, N.; Rudolf, M.; Šraj, N.; Gaberščik, A. Environmental changes affect ecosystem services of the intermittent Lake Cerknica. Ecol. Complex. 2010, 7, 403–409. [Google Scholar] [CrossRef]
- Zhao, B.; Kreuter, U.; Li, B.; Ma, Z.; Chen, J.; Nakagoshi, N. An ecosystem service value assessment of land-use change on Chongming Island, China. Land Use Policy 2004, 21, 139–148. [Google Scholar] [CrossRef]
- Lu, Y.; Fu, B.; Feng, X.; Zeng, Y.; Liu, Y.; Chang, R.; Sun, G.; Wu, B. A policy-driven large scale ecological restoration: Quantifying ecosystem services changes in the Loess Plateau of China. PLoS ONE 2012, 7, e31782. [Google Scholar] [CrossRef]
- Matthews, S.N.; Iverson, L.R.; Peters, M.P.; Prasad, A.M.; Subburayalu, S.J.L.E. Assessing and comparing risk to climate changes among forested locations: Implications for ecosystem services. Landsc. Ecol. 2014, 29, 213–228. [Google Scholar] [CrossRef]
- Zhang, B.; Li, W.; Xie, G. Ecosystem services research in China: Progress and perspective. Ecol. Econ. 2010, 69, 1389–1395. [Google Scholar] [CrossRef]
- Ouyang, Z.; Zheng, H.; Xiao, Y.; Polasky, S.; Liu, J.; Xu, W.; Wang, Q.; Zhang, L.; Xiao, Y.; Rao, E.M.; et al. Improvements in ecosystem services from investments in natural capital. Science 2016, 352, 1455–1459. [Google Scholar] [CrossRef]
- Campo, J.; Merino, A. Variations in soil carbon sequestration and their determinants along a precipitation gradient in seasonally dry tropical forest ecosystems. Glob. Chang. Biol. 2016, 22, 1942–1956. [Google Scholar] [CrossRef]
- He, N.; Chen, Q.; Han, X.; Yu, G.; Li, L. Warming and increased precipitation individually influence soil carbon sequestration of Inner Mongolian grasslands, China. Agric. Ecosyst. Environ. 2012, 158, 184–191. [Google Scholar] [CrossRef]
- Dong, H.; Song, Y.; Chen, T.; Zhao, J.; Yu, L. Geoconservation and geotourism in Luochuan Loess National Geopark, China. Quat. Int. 2014, 334–335, 40–51. [Google Scholar] [CrossRef]
- Ruban, D.A.; Yashalova, N.N. Geodiversity meanings in global geoparks: An empirical study. Environ. Earth Sci. 2018, 77. [Google Scholar] [CrossRef]
- Gabriel, R.; Moreira, H.; Alencoão, A.; Faria, A.; Silva, E.; Sá, A. An Emerging Paradigm for the UNESCO Global Geoparks: The Ecosystem’s Health Provision. Geosciences 2018, 8, 100. [Google Scholar] [CrossRef] [Green Version]
- Zhang, L.; Xiao, Y.; Zheng, H.; Xu, W.; Lu, F.; Jiang, L.; Rao, E.; Xiao, Y.; Wu, B.; Zeng, Y.; et al. A spatial dataset of ecosystem services in China (2010). China Sci. Data 2018, 3, 1. [Google Scholar] [CrossRef]
- Petrosillo, I.; Zurlini, G.; Corlianò, M.E.; Zaccarelli, N.; Dadamo, M. Tourist perception of recreational environment and management in a marine protected area. Landsc. Urban. Plan. 2007, 79, 29–37. [Google Scholar] [CrossRef]
- Beltrame, C.; Cohen-Shacham, E.; Trouillet, M.; Guillet, F. Exploring the links between local management and conservation applying the ecosystem services concept: Conservation and tourism service in Camargue, France. Int. J. Biodivers. Sci. Ecosyst. Serv. Manag. 2013, 9, 166–177. [Google Scholar] [CrossRef] [Green Version]
- Zheng, X.; Guo, J.; Song, W.; Feng, J.; Lin, G. Methane Emission from Mangrove Wetland Soils Is Marginal but Can Be Stimulated Significantly by Anthropogenic Activities. Forests 2018, 9, 13. [Google Scholar] [CrossRef] [Green Version]
- Peng, C.; Zhou, X.; Zhao, S.; Wang, X.; Zhu, B.; Piao, S.; Fang, J. Quantifying the response of forest carbon balance to future climate change in Northeastern China: Model validation and prediction. Glob. Planet. Chang. 2009, 66, 179–194. [Google Scholar] [CrossRef]
- Qian, C.; Sasaki, N.; Shivakoti, G.; Zhang, Y. Effective governance in tourism development–An analysis of local perception in the Huangshan mountain area. Tour. Manag. Perspect. 2016, 20, 112–123. [Google Scholar] [CrossRef]
- Han, J.; Wu, F.; Tian, M.; Li, W. From geopark to sustainable development: Heritage conservation and geotourism promotion in the Huangshan UNESCO Global Geopark (China). Geoheritage 2018, 10, 79–91. [Google Scholar] [CrossRef]
- Som, A.P.M.; Marzuki, A.; Yousefi, M. Factors influencing visitors’ revisit behavioral intentions: A case study of Sabah, Malaysia. Int. J. Mark. Stud. 2012, 4, 39–50. [Google Scholar] [CrossRef] [Green Version]
- Lian, T.; Yu, C. Representation of online image of tourist destination: A content analysis of Huangshan. Asia Pac. J. Tour. Res. 2017, 22, 1063–1082. [Google Scholar] [CrossRef]
- Chen, R.; Liang, C.Y.; Hong, W.C.; Gu, D.X. Forecasting holiday daily tourist flow based on seasonal support vector regression with adaptive genetic algorithm. Appl. Soft Comput. 2015, 26, 435–443. [Google Scholar] [CrossRef]
- Peng, H.; Zhang, J.; Lu, L.; Tang, G.; Yan, B.; Xiao, X.; Han, Y. Eco-efficiency and its determinants at a tourism destination: A case study of Huangshan National Park, China. Tour. Manag. 2017, 60, 201–211. [Google Scholar] [CrossRef]
- Lu, L.; Gong, J.; Jin, X. Impacts of tourist disturbance on soil in Huangshan Mountain scenic area. Geogr. Res. 2011, 30, 209–223. [Google Scholar] [CrossRef]
- Gong, J.; Lu, L.; Jin, X.; Nan, W.; Liu, F. Impacts of tourist disturbance on plant communities and soil properties in Huangshan Mountain scenic area. Acta Ecol. Sin. 2009, 29, 2239–2251. [Google Scholar] [CrossRef]
- Li, T.; Cui, Y.; Liu, A. Spatiotemporal dynamic analysis of forest ecosystem services using “big data”: A case study of Anhui province, central-eastern China. J. Clean. Prod. 2017, 142, 589–599. [Google Scholar] [CrossRef]
- Huang, C.; Goward, S.N.; Masek, J.G.; Gao, F.; Vermote, E.F.; Thomas, N.; Schleeweis, K.; Kennedy, R.E.; Zhu, Z.; Eidenshink, J.C.; et al. Development of time series stacks of Landsat images for reconstructing forest disturbance history. Int. J. Digit. Earth 2009, 2, 195–218. [Google Scholar] [CrossRef]
- Huete, A.; Didan, K.; Miura, T.; Rodriguez, E.P.; Gao, X.; Ferreira, L.G. Overview of the radiometric and biophysical performance of the MODIS vegetation indices. Remote Sens. Environ. 2002, 83, 195–213. [Google Scholar] [CrossRef]
- Adeyeri, O.; Akinsanola, A.; Ishola, K. Investigating surface urban heat island characteristics over Abuja, Nigeria: Relationship between land surface temperature and multiple vegetation indices. Remote Sens. Appl. Soc. Environ. 2017, 7, 57–68. [Google Scholar] [CrossRef]
- Qi, J.; Chehbouni, A.; Huete, A.R.; Kerr, Y.H.; Sorooshian, S. A modified soil adjusted vegetation index. Remote Sens. Environ. 1994, 48, 119–126. [Google Scholar] [CrossRef]
- Haboudane, D.; Miller, J.R.; Pattey, E.; Zarco-Tejada, P.J.; Strachan, I.B. Hyperspectral vegetation indices and novel algorithms for predicting green LAI of crop canopies: Modeling and validation in the context of precision agriculture. Remote Sens. Environ. 2004, 90, 337–352. [Google Scholar] [CrossRef]
- Hijmans, R.J.; Cameron, S.E.; Parra, J.L.; Jones, P.G.; Jarvis, A. Very high resolution interpolated climate surfaces for global land areas. Int. J. Clim. 2005, 25, 1965–1978. [Google Scholar] [CrossRef]
- Su, C.; Wang, Y. Evolution of ecosystem services and its driving factors in the upper reaches of the Fenhe River watershed, China. Acta Ecol. Sin. 2018, 38, 7886–7898. [Google Scholar] [CrossRef]
- Farley, K.A.; Kelly, E.F.; Hofstede, R.G. Soil organic carbon and water retention after conversion of grasslands to pine plantations in the Ecuadorian Andes. Ecosystems 2004, 7, 729–739. [Google Scholar] [CrossRef]
- Bai, Y.; Ochuodho, T.O.; Yang, J. Impact of land use and climate change on water-related ecosystem services in Kentucky, USA. Ecol. Indic. 2019, 102, 51–64. [Google Scholar] [CrossRef]
- Zhang, X.; Lu, X. Multiple criteria evaluation of ecosystem services for the Ruoergai Plateau Marshes in southwest China. Ecol. Econ. 2010, 69, 1463–1470. [Google Scholar] [CrossRef]
- Feng, X.; Fu, B.; Lu, N.; Zeng, Y.; Wu, B. How ecological restoration alters ecosystem services: An analysis of carbon sequestration in China’s Loess Plateau. Sci. Rep. 2013, 3, 2846. [Google Scholar] [CrossRef]
- Sutton-Grier, A.E.; Moore, A.K.; Wiley, P.C.; Edwards, P.E. Incorporating ecosystem services into the implementation of existing US natural resource management regulations: Operationalizing carbon sequestration and storage. Mar. Policy 2014, 43, 246–253. [Google Scholar] [CrossRef]
- Canu, D.M.; Ghermandi, A.; Nunes, P.A.; Lazzari, P.; Cossarini, G.; Solidoro, C. Estimating the value of carbon sequestration ecosystem services in the Mediterranean Sea: An ecological economics approach. Glob. Environ. Chang. 2015, 32, 87–95. [Google Scholar] [CrossRef] [Green Version]
- Sohngen, B.; Brown, S. The influence of conversion of forest types on carbon sequestration and other ecosystem services in the South Central United States. Ecol. Econ. 2006, 57, 698–708. [Google Scholar] [CrossRef]
- Gret-Regamey, A.; Bebi, P.; Bishop, I.D.; Schmid, W.A. Linking GIS-based models to value ecosystem services in an Alpine region. J. Environ. Manag. 2008, 89, 197–208. [Google Scholar] [CrossRef]
- Villagra, M.; Bacchi, O.O.S.; Tuon, R.L.; Reichardt, K. Difficulties of estimating evapotranspiration from the water balance equation. Agric. For. Meteorol. 1995, 72, 317–325. [Google Scholar] [CrossRef]
- Zeng, Z.; Piao, S.; Lin, X.; Yin, G.; Peng, S.; Ciais, P.; Myneni, R.B. Global evapotranspiration over the past three decades: Estimation based on the water balance equation combined with empirical models. Environ. Res. Lett. 2012, 7, 014026. [Google Scholar] [CrossRef]
- Ruimy, A.; Kergoat, L.; Bondeau, A.; The Participants of the Potsdam NPP Model Intercomparison. Comparing global models of terrestrial net primary productivity (NPP): Analysis of differences in light absorption and light-use efficiency. Glob. Chang. Biol. 1999, 5, 56–64. [Google Scholar] [CrossRef] [Green Version]
- Alexandrov, G.; Oikawa, T.; Yamagata, Y. The scheme for globalization of a process-based model explaining gradations in terrestrial NPP and its application. Ecol. Model. 2002, 148, 293–306. [Google Scholar] [CrossRef]
- Nakagawa, S.; Schielzeth, H. A general and simple method for obtaining R2 from generalized linear mixed-effects models. Methods Ecol. Evol. 2013, 4, 133–142. [Google Scholar] [CrossRef]
- Westoby, M.; Wright, I.J. Land-plant ecology on the basis of functional traits. Trends Ecol. Evol. 2006, 21, 261–268. [Google Scholar] [CrossRef]
- McArdle, B.H.; Anderson, M.J. Fitting multivariate models to community data: A comment on distance-based redundancy analysis. Ecology 2001, 82, 290–297. [Google Scholar] [CrossRef]
- Legendre, P.; Oksanen, J.; ter Braak, C.J.F. Testing the significance of canonical axes in redundancy analysis. Methods Ecol. Evol. 2011, 2, 269–277. [Google Scholar] [CrossRef]
- Blanchet, F.G.; Legendre, P.; Bergeron, C.J.A.; He, F. Supplement 1. The R package ordiconsensus compiled for all platforms. Fig. Share 2016. [Google Scholar] [CrossRef]
- Umeki, K.; Kawasaki, M.; Shigyo, N.; Hirao, T. Inter- and Intraspecific Patterns in Resprouting of Trees in Undisturbed Natural Forests along an Elevational Gradient in Central Japan. Forests 2018, 9, 672. [Google Scholar] [CrossRef] [Green Version]
- Torquato, P.R.; Will, R.E.; Zhang, B.; Zou, C.B. Stand-Level Transpiration Increases after Eastern Redcedar (Juniperus virginiana L.) Encroachment into the Midstory of Oak Forests. Forests 2020, 11, 901. [Google Scholar] [CrossRef]
- Park, J.; Kim, H.S.; Jo, H.K.; Jung, I.B. The Influence of Tree Structural and Species Diversity on Temperate Forest Productivity and Stability in Korea. Forests 2019, 10, 1113. [Google Scholar] [CrossRef] [Green Version]
- Ficko, A. Private Forest Owners’ Social Economic Profiles Weakly Influence Forest Management Conceptualizations. Forests 2019, 10, 956. [Google Scholar] [CrossRef] [Green Version]
- Chen, H.; Ma, J.; Wang, X.; Xu, P.; Zheng, S.; Zhao, Y. Effects of Biochar and Sludge on Carbon Storage of Urban Green Roofs. Forests 2018, 9, 413. [Google Scholar] [CrossRef] [Green Version]
- Bu, W.; Zhang, C.; Huang, J.; Zang, R.; Ding, Y.; Xu, H.; Lin, M.; Wang, J. The Influences of Disturbance Histories and Soil Properties on Aboveground Biomass through Plant Functional Traits in a Tropical Rainforest. Forests 2019, 10, 774. [Google Scholar] [CrossRef] [Green Version]
- Grace, J.B.; Irvine, K.M. Scientist’s guide to developing explanatory statistical models using causal analysis principles. Ecology 2020, 101. [Google Scholar] [CrossRef]
- Yang, K.N.; Luo, S.W.; Hu, L.G.; Chen, B.B.; Xie, Z.; Ma, B.B.; Ma, W.B.; Du, G.Z.; Ma, X.J.; Le Roux, X. Responses of soil ammonia-oxidizing bacteria and archaea diversity to N, P and NP fertilization: Relationships with soil environmental variables and plant community diversity. Soil Biol. Biochem. 2020, 145. [Google Scholar] [CrossRef]
- Pascual-Garcia, A.; Bell, T. Community-level signatures of ecological succession in natural bacterial communities. Nat. Commun. 2020, 11. [Google Scholar] [CrossRef]
- Feng, K.; Wang, S.; Wei, Z.Y.; Wang, Z.J.; Zhang, Z.J.; Wu, Y.N.; Zhang, Y.G.; Deng, Y. Niche width of above- and below-ground organisms varied in predicting biodiversity profiling along a latitudinal gradient. Mol. Ecol. 2020, 29, 1890–1902. [Google Scholar] [CrossRef]
- Ali, A.; Sanae, A.; Nalivan, O.A.; Ahmadaali, K.; Pour, M.J.; Valipour, A.; Karami, J.; Aminpour, M.; Kaboli, H.; Askari, Y. Environmental filtering, predominance of strong competitor trees and exclusion of moderate-weak competitor trees shape species richness and biomass. Sci. Total Environ. 2020, 723. [Google Scholar] [CrossRef] [PubMed]
- Rosseel, Y. lavaan: An R Package for Structural Equation Modeling. J. Stat. Softw. 2012, 48, 1–36. [Google Scholar] [CrossRef] [Green Version]
- Schreiber, J.B.; Nora, A.; Stage, F.K.; Barlow, E.A.; King, J. Reporting structural equation modeling and confirmatory factor analysis results: A review. J. Educ. Res. 2006, 99, 323–337. [Google Scholar] [CrossRef]
- Eisenhauer, N.; Bowker, M.A.; Grace, J.B.; Powell, J.R. From patterns to causal understanding: Structural equation modeling (SEM) in soil ecology. Pedobiologia 2015, 58, 65–72. [Google Scholar] [CrossRef] [Green Version]
- Heiskanen, J.; Mäkitalo, K.; Hyvönen, J. Long-term influence of site preparation on water-retention characteristics of forest soil in Finnish Lapland. For. Ecol. Manag. 2007, 241, 127–133. [Google Scholar] [CrossRef]
- Salager, S.; El Youssoufi, M.S.; Saix, C. Effect of temperature on water retention phenomena in deformable soils: Theoretical and experimental aspects. Eur. J. Soil Sci. 2010, 61, 97–107. [Google Scholar] [CrossRef]
- Keim, R.F.; Skaugset, A.E.; Weiler, M. Storage of water on vegetation under simulated rainfall of varying intensity. Adv. Water Resour. 2006, 29, 974–986. [Google Scholar] [CrossRef]
- Cao, F.; Dan, L.; Ma, Z.; Gao, T. Assessing the regional climate impact on terrestrial ecosystem over east Asia using coupled models with land use and land cover forcing during 1980–2010. Sci. Rep. 2020, 10, 1–15. [Google Scholar] [CrossRef]
- Turton, S.M. Managing environmental impacts of recreation and tourism in rainforests of the wet tropics of Queensland World Heritage Area. Geogr. Res. 2005, 43, 140–151. [Google Scholar] [CrossRef]
- Getzner, M. Visitors’ preferences for landscape conservation in Alpine environments:Differences across regions, conservation programmes, and socio-economic groups. Landsc. Res. 2019, 45, 503–519. [Google Scholar] [CrossRef]


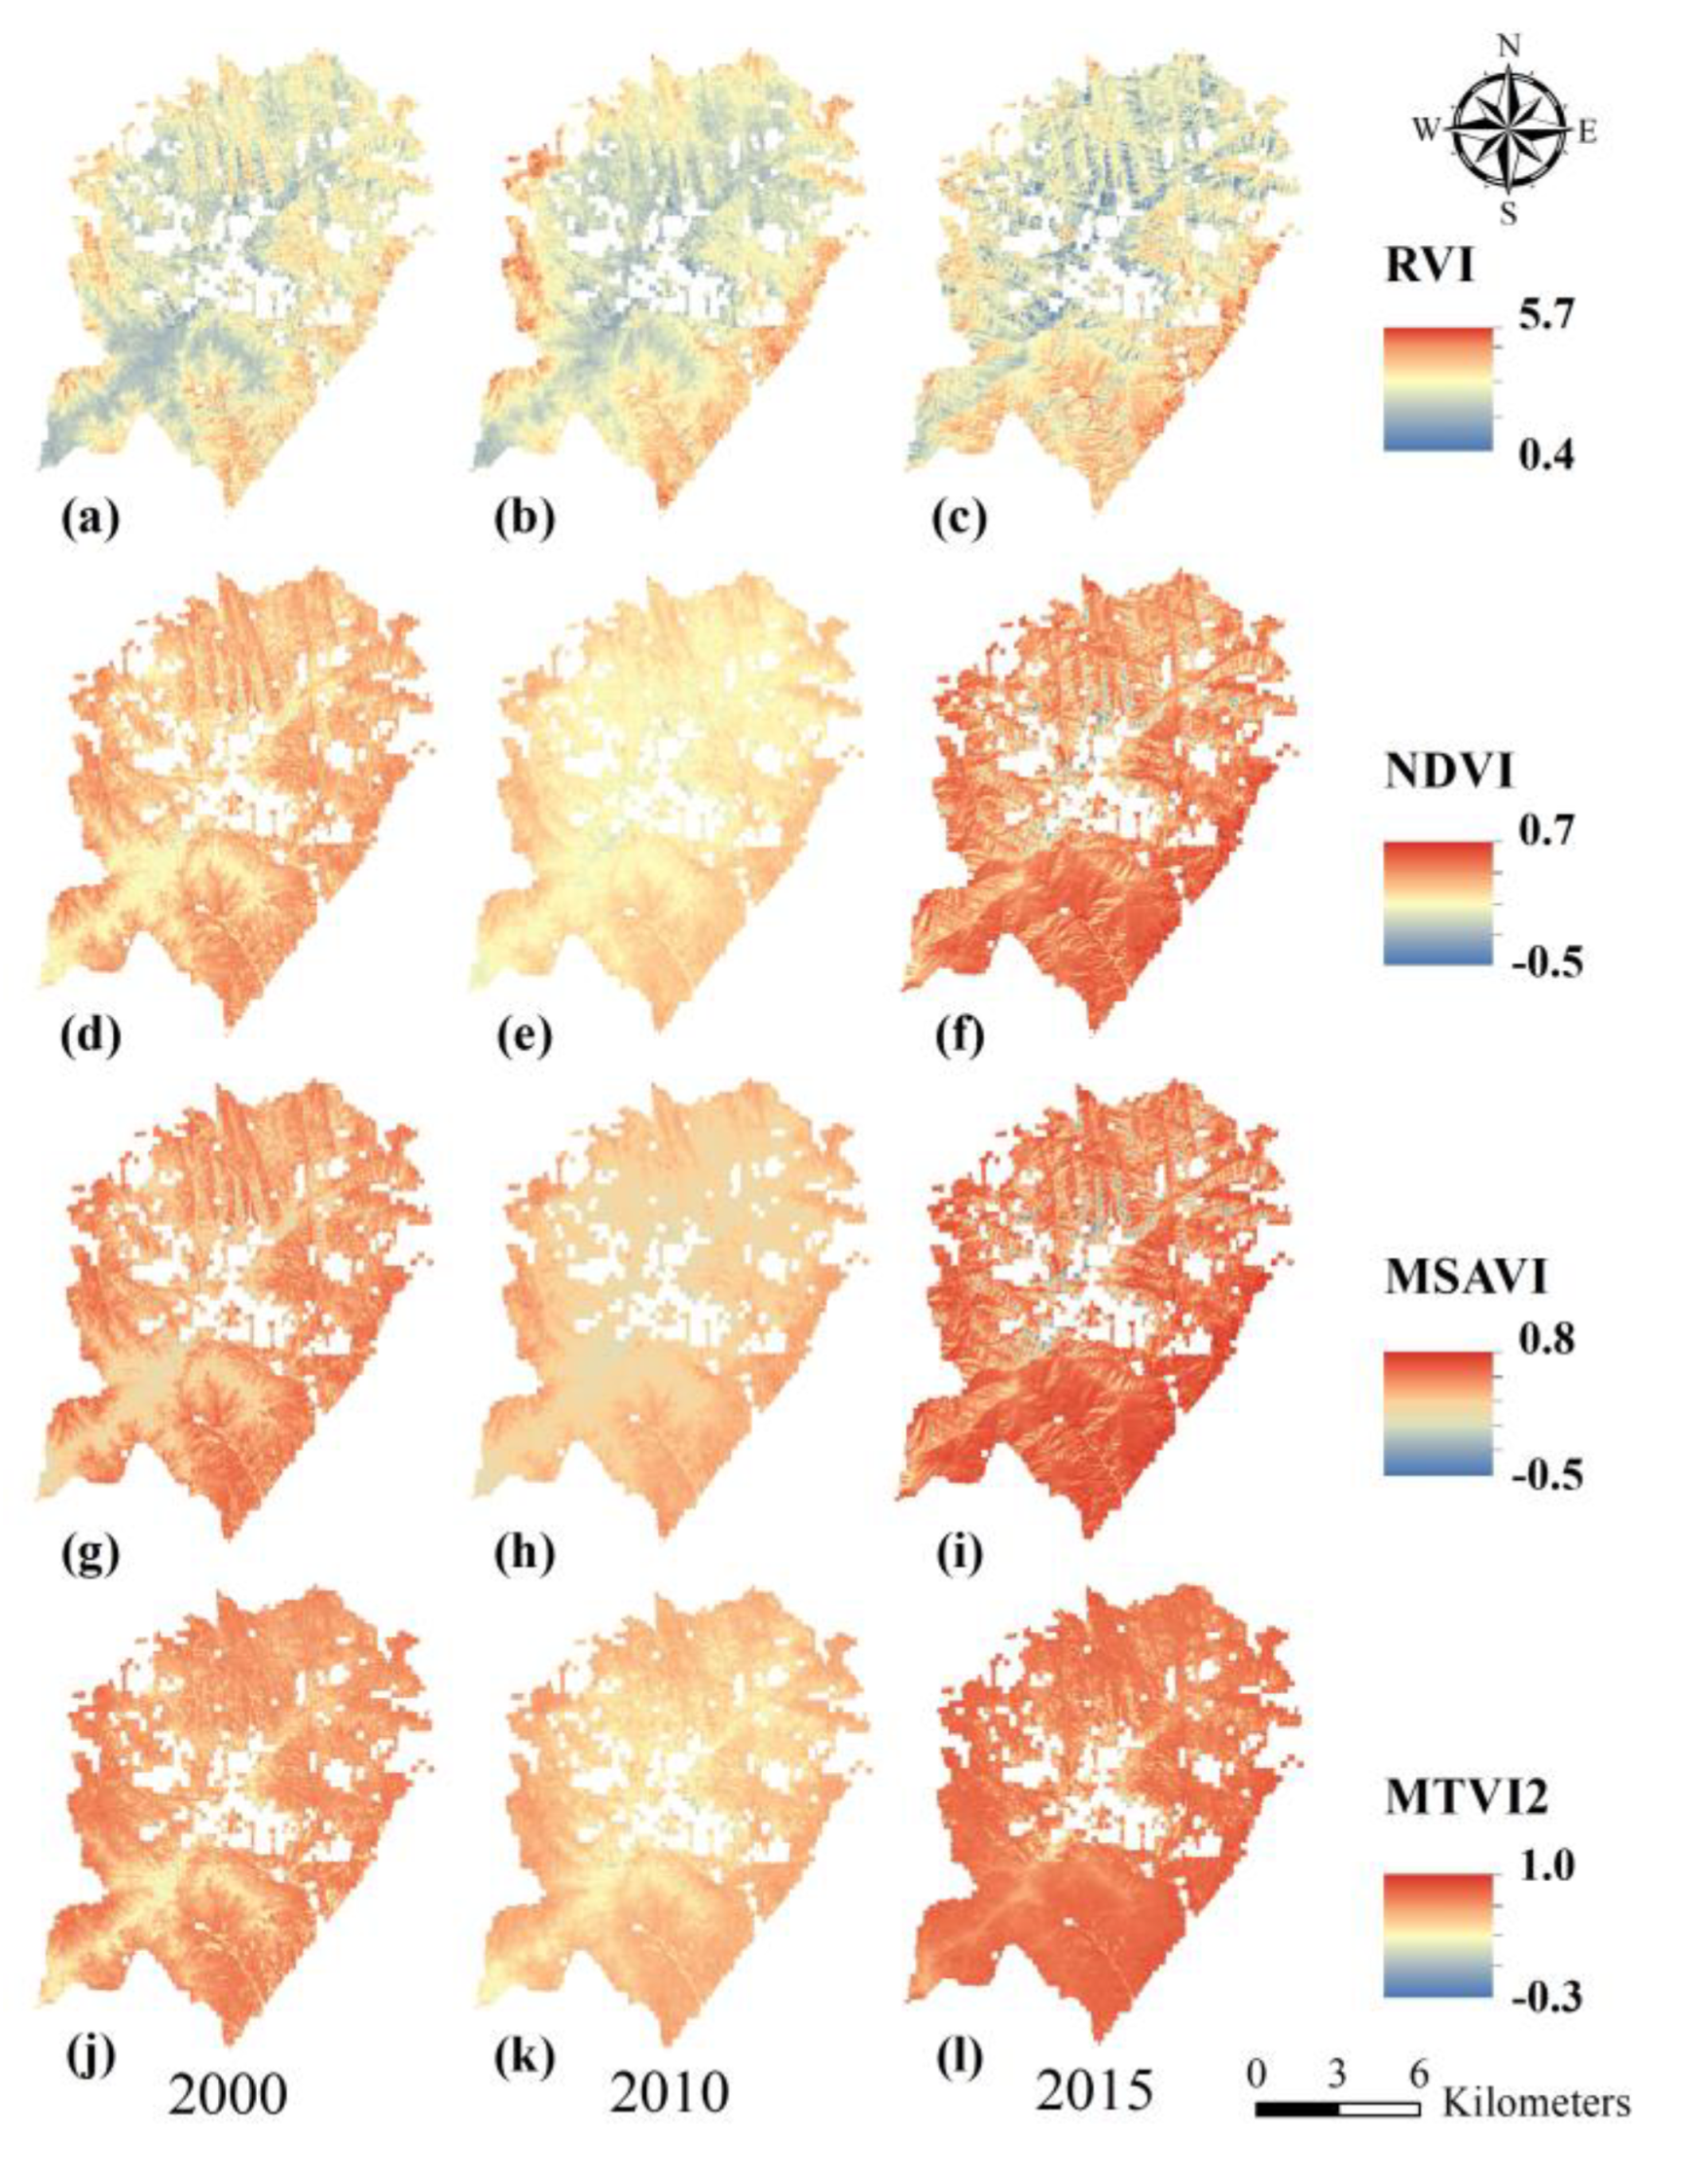
| Vegetation Index | Equation |
|---|---|
| Normalized difference vegetation index (NDVI) | |
| Ratio vegetation index (RVI) | |
| Modified soil-adjusted vegetation index (MSAVI) | |
| Modified triangular vegetation index 2 (MTVI2) |
| Ecosystem Function | Abbreviation | Equation | Reference |
|---|---|---|---|
| Water retention | EF_WR | [54,55] | |
| Carbon sequestration | EF_CS | ) | [56,57] |
| Ecosystem Function | Change | 2000–2010 | 2010–2015 | ||||
|---|---|---|---|---|---|---|---|
| Area (km2) | Area Percent (%) | Average Change (m3 ha−1 year−1 or g C m−2 year−1) | Area (km2) | Area Percentage (%) | Average Change (m3 ha−1 year−1 or g C m−2 year−1) | ||
| Water retention | Increased | 58.54 | 44.75 | 0.15 | 0.00 | 0.00 | 0.01 |
| Decreased | 12.44 | 9.51 | 0.42 | 0.32 | |||
| Unchanged | 59.84 | 45.74 | 130.39 | 99.68 | |||
| Carbon sequestration | Increased | 102.93 | 78.68 | 16.29 | 128.83 | 98.48 | 9.28 |
| Decreased | 25.25 | 19.30 | 1.92 | 1.47 | |||
| Unchanged | 2.63 | 2.01 | 0.06 | 0.05 | |||
| Both Ecosystem Functions (%) | Carbon Sequestration (%) | Water Retention (%) | |
|---|---|---|---|
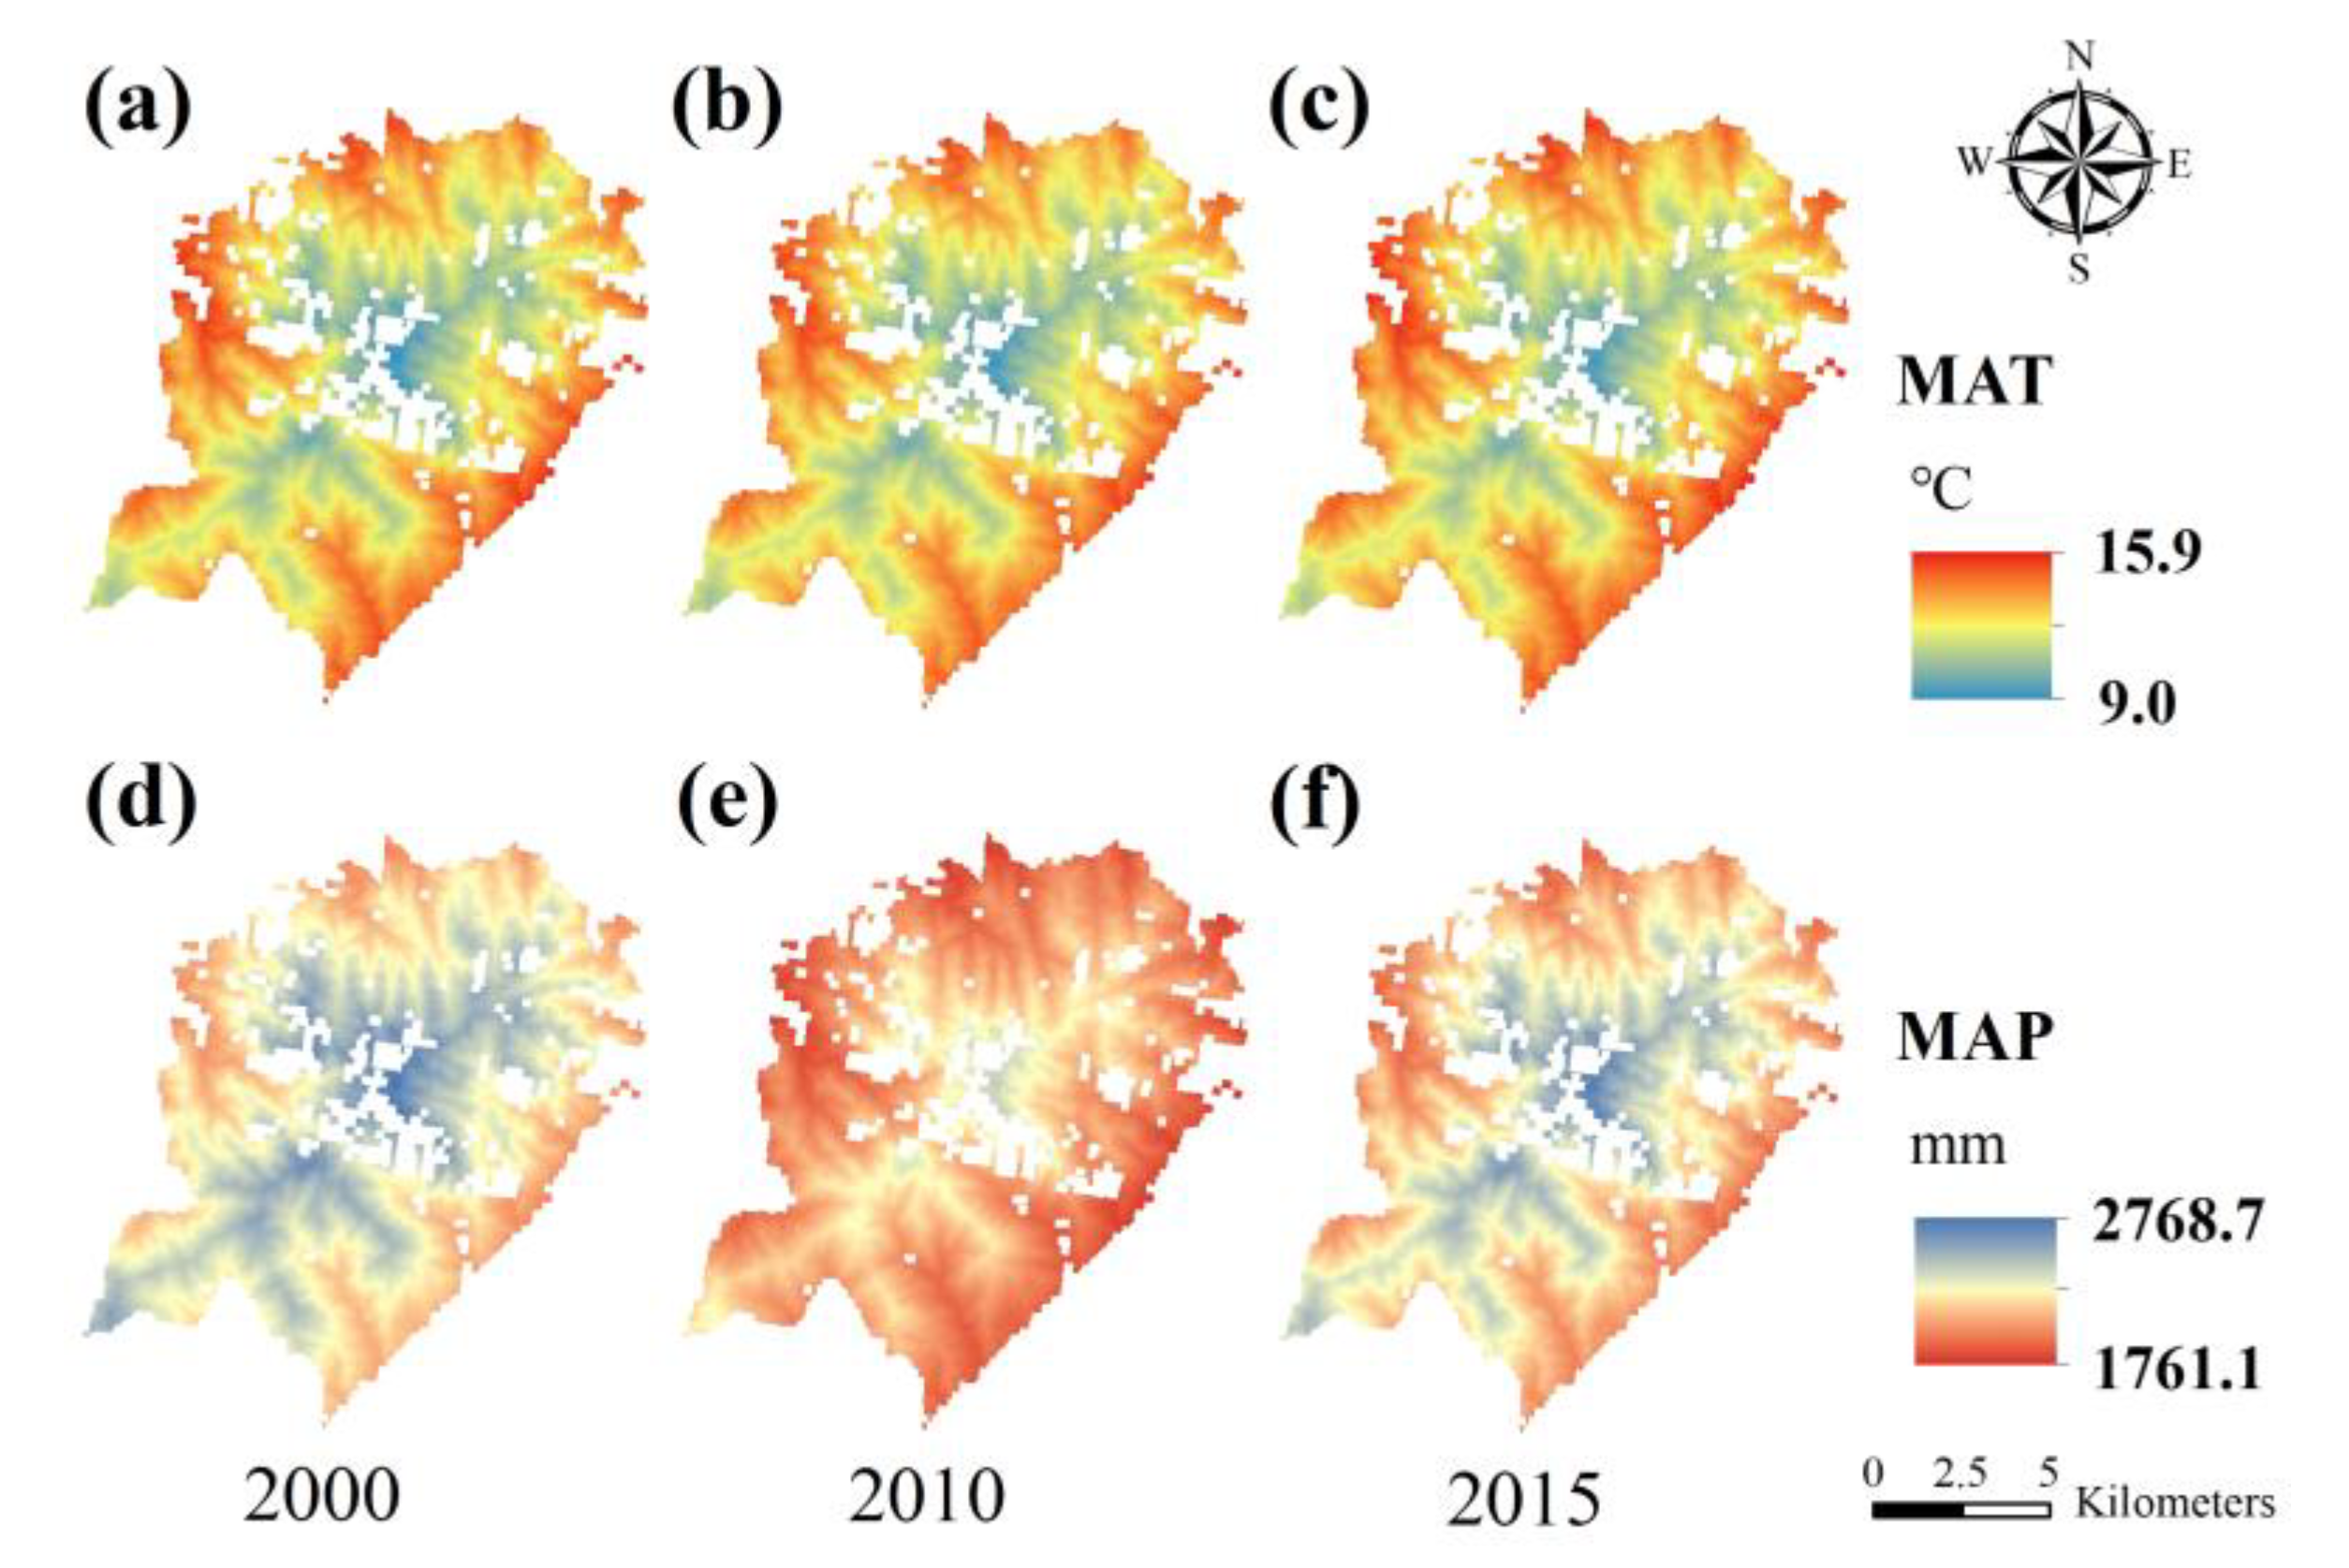
| Climate factors | 34.85 | 1.93 | 67.77 |
| Tourist disturbance | 8.92 | 14.57 | 3.26 |
| Vegetation growth | 28.96 | 9.53 | 48.39 |
Publisher’s Note: MDPI stays neutral with regard to jurisdictional claims in published maps and institutional affiliations. |
© 2020 by the authors. Licensee MDPI, Basel, Switzerland. This article is an open access article distributed under the terms and conditions of the Creative Commons Attribution (CC BY) license (http://creativecommons.org/licenses/by/4.0/).
Share and Cite
Gou, R.; Li, W.; Yang, Y.; Bai, J.; Meng, Y.; Wu, J.; Ding, Y.; Dai, Z.; Shi, Q.; Song, S.; et al. Changes in Water Retention and Carbon Sequestration in the Huangshan UNESCO Global Geopark (China) from 2000 to 2015. Forests 2020, 11, 1152. https://0-doi-org.brum.beds.ac.uk/10.3390/f11111152
Gou R, Li W, Yang Y, Bai J, Meng Y, Wu J, Ding Y, Dai Z, Shi Q, Song S, et al. Changes in Water Retention and Carbon Sequestration in the Huangshan UNESCO Global Geopark (China) from 2000 to 2015. Forests. 2020; 11(11):1152. https://0-doi-org.brum.beds.ac.uk/10.3390/f11111152
Chicago/Turabian StyleGou, Ruikun, Wei Li, Yanzheng Yang, Jiankun Bai, Yuchen Meng, Jun Wu, Yali Ding, Zheng Dai, Qi Shi, Shanshan Song, and et al. 2020. "Changes in Water Retention and Carbon Sequestration in the Huangshan UNESCO Global Geopark (China) from 2000 to 2015" Forests 11, no. 11: 1152. https://0-doi-org.brum.beds.ac.uk/10.3390/f11111152