Assessing the Carbon Storage of Soil and Litter from National Forest Inventory Data in South Korea


Division of Forest Industry, National Institute of Forest Science, Seoul 02455, Korea
*
Author to whom correspondence should be addressed.
Forests 2020, 11(12), 1318; https://0-doi-org.brum.beds.ac.uk/10.3390/f11121318
Submission received: 6 November 2020
/
Revised: 8 December 2020
/
Accepted: 8 December 2020
/
Published: 10 December 2020
(This article belongs to the Special Issue Forest Soil Carbon and Climate Changes)
Abstract
:Research Highlights: The estimation of soil and litter carbon stocks by the Land Use, Land-Use Changes, and Forestry (LULUCF) sectors has the potential to improve reports on national greenhouse gas (GHG) inventories. Background and Objectives: Forests are carbon sinks in the LULUCF sectors and therefore can be a comparatively cost-effective means and method of GHG mitigation. Materials and Methods: This study was conducted to assess soil at 0–30 cm and litter carbon stocks using the National Forest Inventory (NFI) data and random forest (RF) models, mapping their carbon stocks. The three main types of forest in South Kora were studied, namely, coniferous, deciduous, and mixed. Results: The litter carbon stocks (t C ha−1) were 4.63 ± 0.18 for coniferous, 3.98 ± 0.15 for mixed, and 3.28 ± 0.13 for deciduous. The soil carbon stocks (t C ha−1) were 44.11 ± 1.54 for deciduous, 35.75 ± 1.60 for mixed, and 33.96 ± 1.62 for coniferous. Coniferous forests had higher litter carbon stocks while deciduous forests contained higher soil carbon stocks. The carbon storage in the soil and litter layer increased as the forest grew older; however, a significant difference was found in several age classes. For mapping the soil and litter carbon stocks, we used four random forest models, namely RF1 to RF4, and the best performing model was RF2 (root mean square error (RMSE) (t C ha−1) = 1.67 in soil carbon stocks, 1.49 in soil and litter carbon stocks). Our study indicated that elevation, accessibility class, slope, diameter at breast height, height, and growing stock are important predictors of carbon stock. Soil and litter carbon stock maps were produced using the RF2 models. Almost all prediction values were appropriated to soil and litter carbon stocks. Conclusions: Estimating and mapping the carbon stocks in the soil and litter layer using the NFI data and random forest models could be used in future national GHG inventory reports. Additionally, the data and models can estimate all carbon pools to achieve an accurate and complete national GHG inventory report.
1. Introduction
Forests have an important role as carbon sinks; through tree growth and CO2 removal from the atmosphere, they store more than 80% of all terrestrial aboveground carbon and 70% of soil organic carbon [1,2,3]. Accurately and efficiently quantifying forest carbon stocks is crucial in understanding their response in mitigating rising climate change issues [4]. Mitigation through activities in the forest sector, either by increasing the removal of greenhouse gases (GHG) or by reducing emissions from carbon sources, can be comparatively cost-effective [5,6]. Thus, a precise estimation of the carbon storage in carbon pools is required in soil and litter organic carbon stocks [7].
The Paris Agreement decided in 2015 that all parties participating in the United Nations Framework Convention on Climate Change (UNFCCC) should adopt a nationally determined contributions (NDC) plan. This bottom-up system takes each nation’s differing capabilities, circumstances and common yet distinct responsibilities into account to reduce global GHG [8]. From 2020 onwards parties will be responsible for achieving their GHG reduction targets, by submitting annual national GHG inventory reports according to the principle of measurement, reporting, and verification [9]. The Land Use, Land-Use Change, and Forestry (LULUCF) sectors will be a key component of the Paris Agreement on NDCs as a net carbon sink [10]. The LULUCF is expected to contribute at a global level as much as 20% of the full mitigation potential of all the conditional and unconditional NDC targets [11]. Therefore, the five carbon pools (aboveground biomass, belowground biomass, dead wood, soil, and litter) of the LULUCF sectors could play an instrumental role in reporting and setting a reduction target for national GHG inventories.
To report on national GHG inventories of carbon stocks of the LULUCF, several Annex I nations repurposed and utilized data collected by the system of the National Forest Inventory (NFI). This is because the NFI is a key source of information to calculate GHG emissions and their removal [12]. Finland elected the Yasso model to estimate the carbon stocks of soil and dead organic matter (deadwood and litter), and the model utilized the data collected from the NFI survey as input values [13]. Germany also utilized the NFI data to estimate the carbon stocks of all carbon pools (living biomass, soil, and dead organic matter) for the national GHG inventory report [14]. South Korea’s NFI survey system was reorganized in 2006 due to the increasing demand for sustainable forest management research according to the sustainable development principle agreed in the Rio Summit, 1992 [15]. This is based on systematic sampling, with a square grid to survey forest stand, growing stocks, and deadwood volume every five years cycles. Each grid contains one ground sampling plot, which is a cluster of four sub-sampling plots. Forest Health Monitoring (FHM) is based on the same sampling design as the NFI, but it uses only one of the sub-sampling plots to collect data on soil, litter carbon stocks within 10 years, and soil and litter properties within 5 years, respectively. When reporting national GHG inventories, South Korea has used the data of the NFI survey for living biomass carbon stocks. However, the change in carbon stocks in soil, dead wood, and litter layer cannot be calculated due to the lack of time-series activity and emission data [16,17].
Despite soil and litter carbon stocks’ importance being well-recognized, spatial information of regional soil and litter carbon stocks is yet to be widely available [18]. Most of the information regarding this matter exists only as non-digital fragmented legacy observations [19]. Moreover, most of the previous studies in South Korea were conducted to estimate soil and litter carbon stocks in specific forest stands or using specific modeling methods [17,20,21,22]. It may be challenging to accurately map soil organic carbon owing to spatial variabilities such as scale-dependent nature, climate, topography, land use, and other factors. As a solution, recent studies which utilized machine learning methods have demonstrated improved accuracies in predicting soil and litter carbon stocks [23,24]. These machine learning methods such as random forest, boosted regression trees, and original kriging have also been used to model and map soil organic matter [25,26,27]. As far as root mean squared deviations and coefficient of determination are considered, random forest surpassed other machine learning methods in the areas of common geostatistical, machine learning, and hybrid methods [27].
The purpose of this study is to estimate the soil at 0–30 cm and litter carbon stocks at national levels and to provide a map of these carbon stocks using random forest machine learning tools in South Korean forests.
2. Materials and Methods
2.1. Study Area
This study was carried out in South Korea’s forest, which accounts for approximately 64% of the total land area in South Korea [28]. The composition of the forest is as follows: coniferous 31.8%; deciduous 38.4%; and mixed 27.2%. As for the age class, 68% of the forest area is III~IV, between 21 and 40 years old [28]. South Korea is located in the mid-latitude temperate climate zone with four distinct seasons. The mean annual precipitation ranges from 1000 mm to 1800mm in the southern part of South Korea and 1100 mm to 1400 mm in the central part of South Korea. The mean annual temperature ranges from 10 to 16 °C except in the high mountain areas [29]. Accounting for approximately 60% of the land, dominant parent soil material in South Korea includes granitic gneiss (32.4%), granite (22.3%), and schist (10.3%) [30]. Dominant soil orders in South Korea include Inceptisols, Entisols, Ultisols, Alfisols, and Andisols [31]. South Korea developed an independent classification system for forest soil due to its importance in forest productivity. Forest soil in South Korea has eight soil groups (brown forest soil, red & yellow forest soils, dark red forest soils, gray-brown forest soils, volcanic ash forest soils, eroded soil. immature soils, and lithosols) including 11 soil subgroups, and 28 soil types [32].
2.2. Data Sources and Analysis
2.2.1. Carbon Stock of Soil and Litter
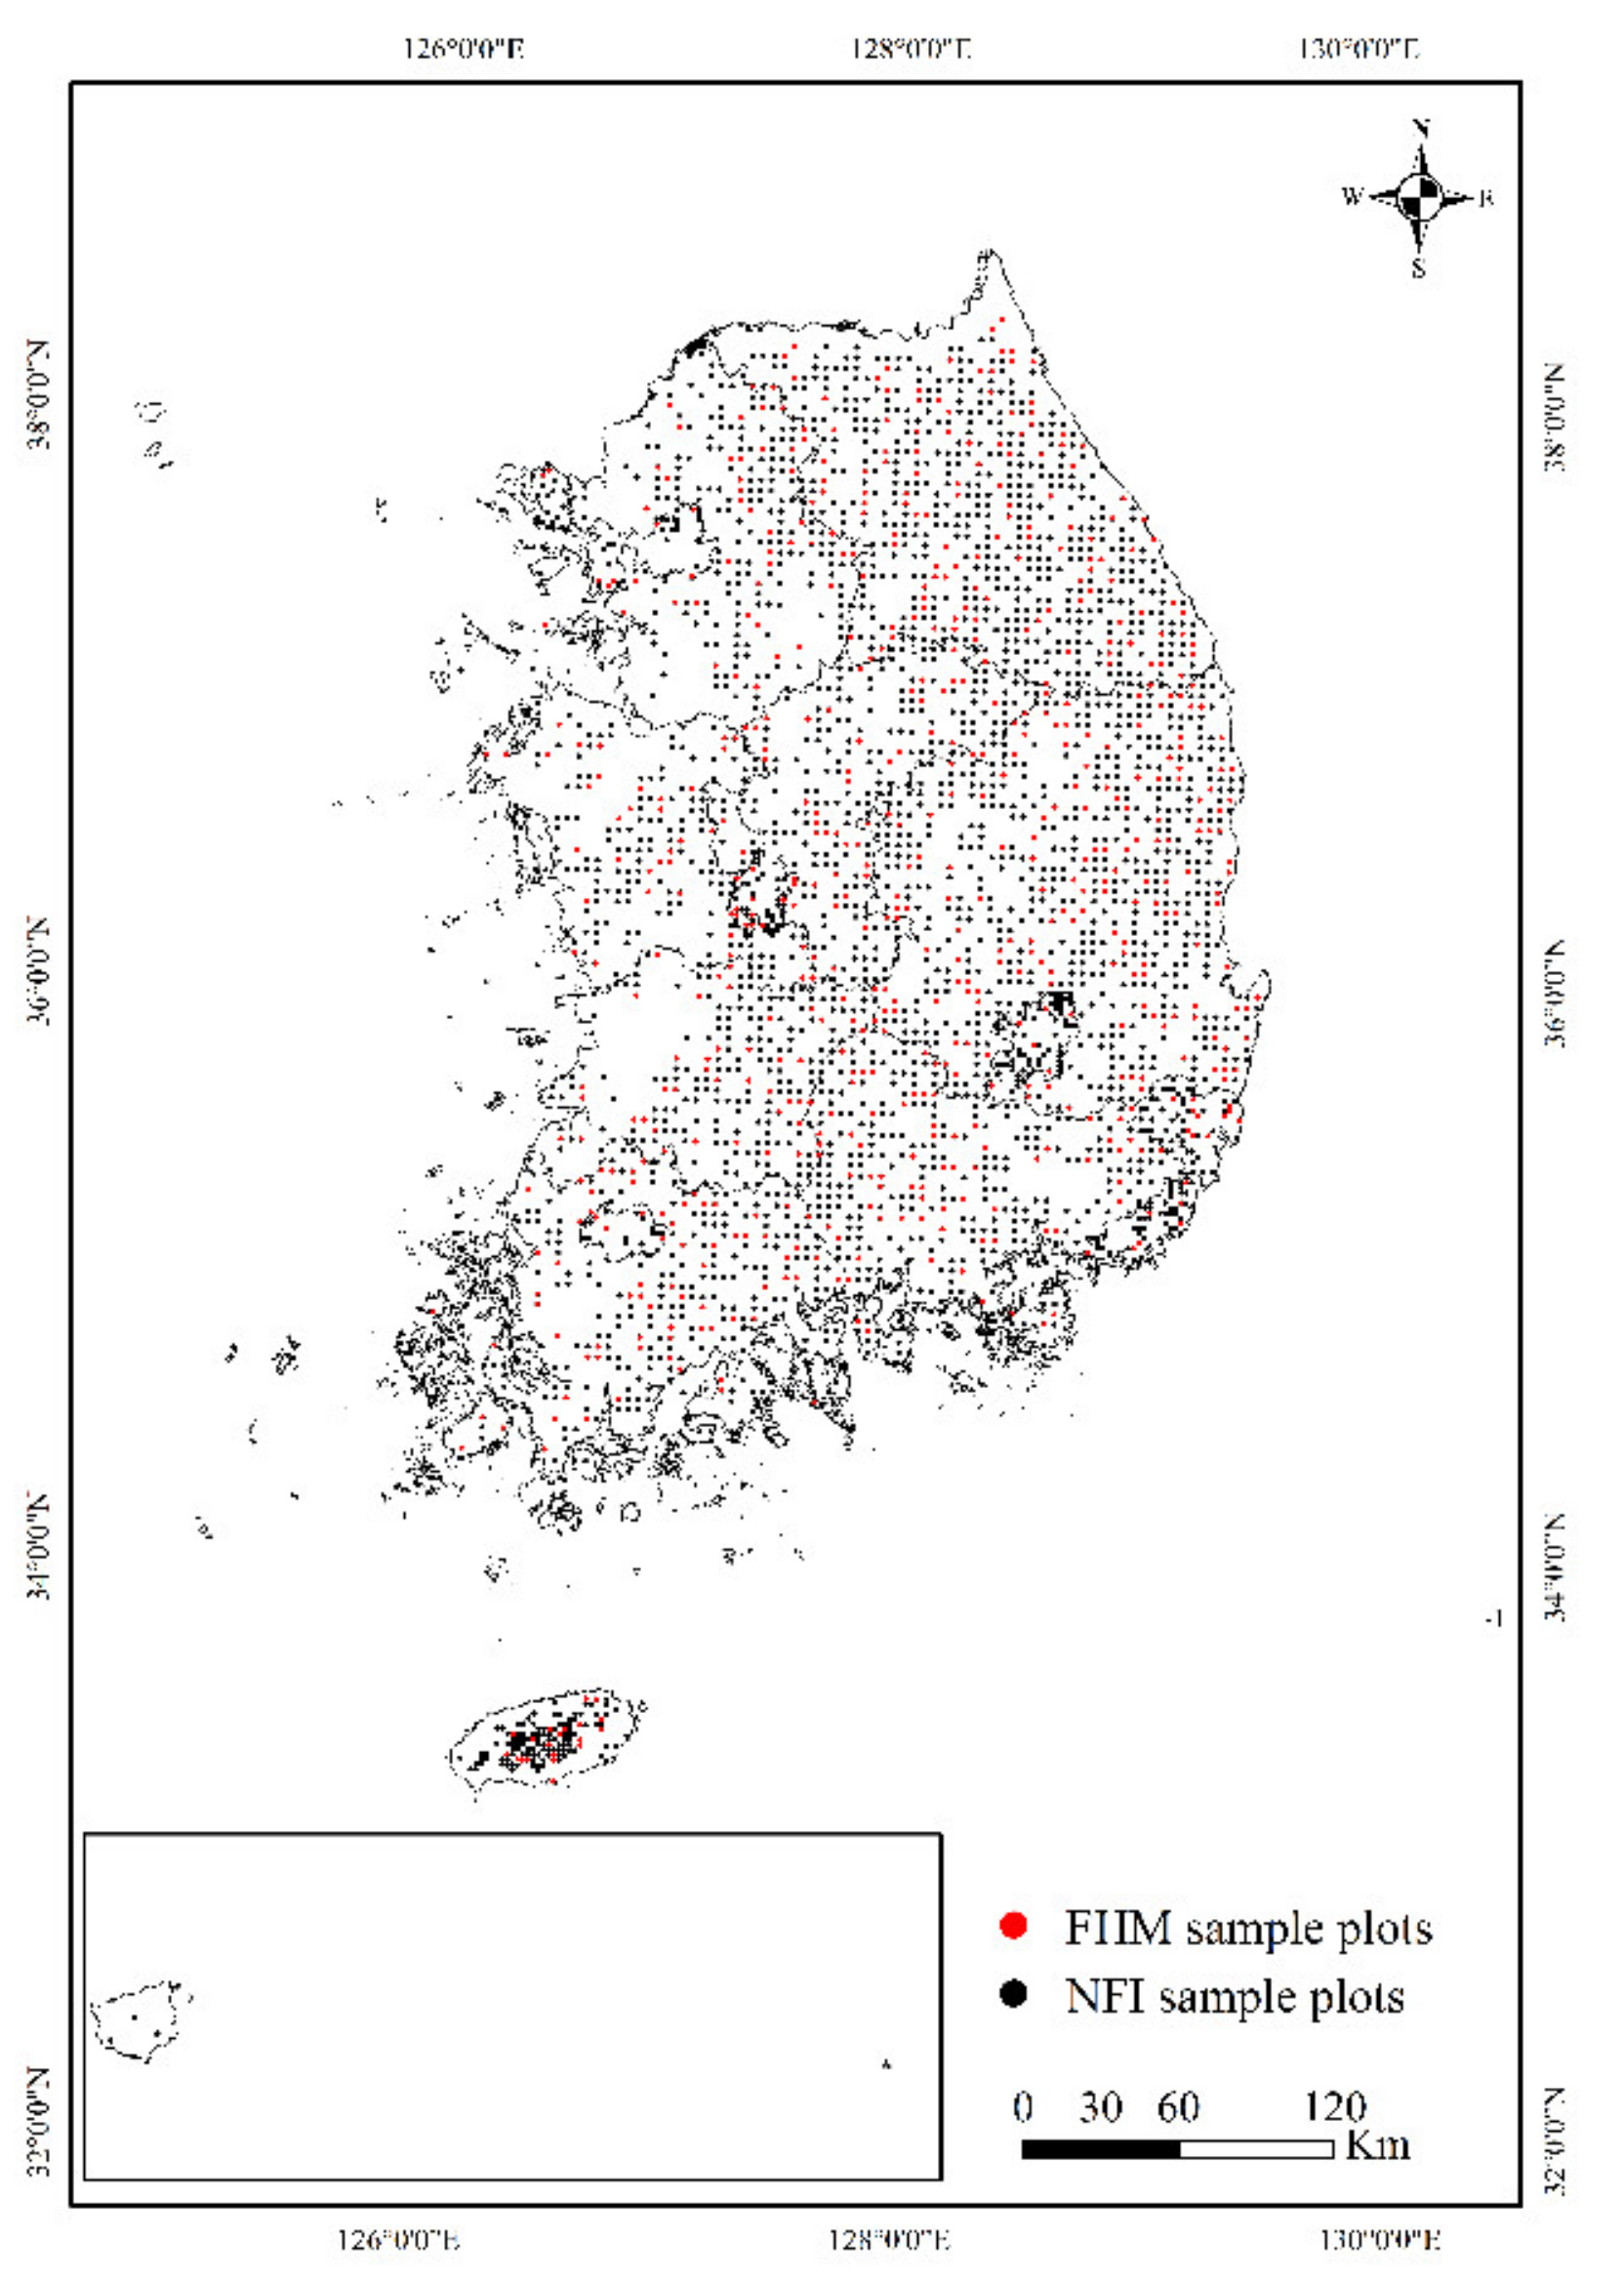
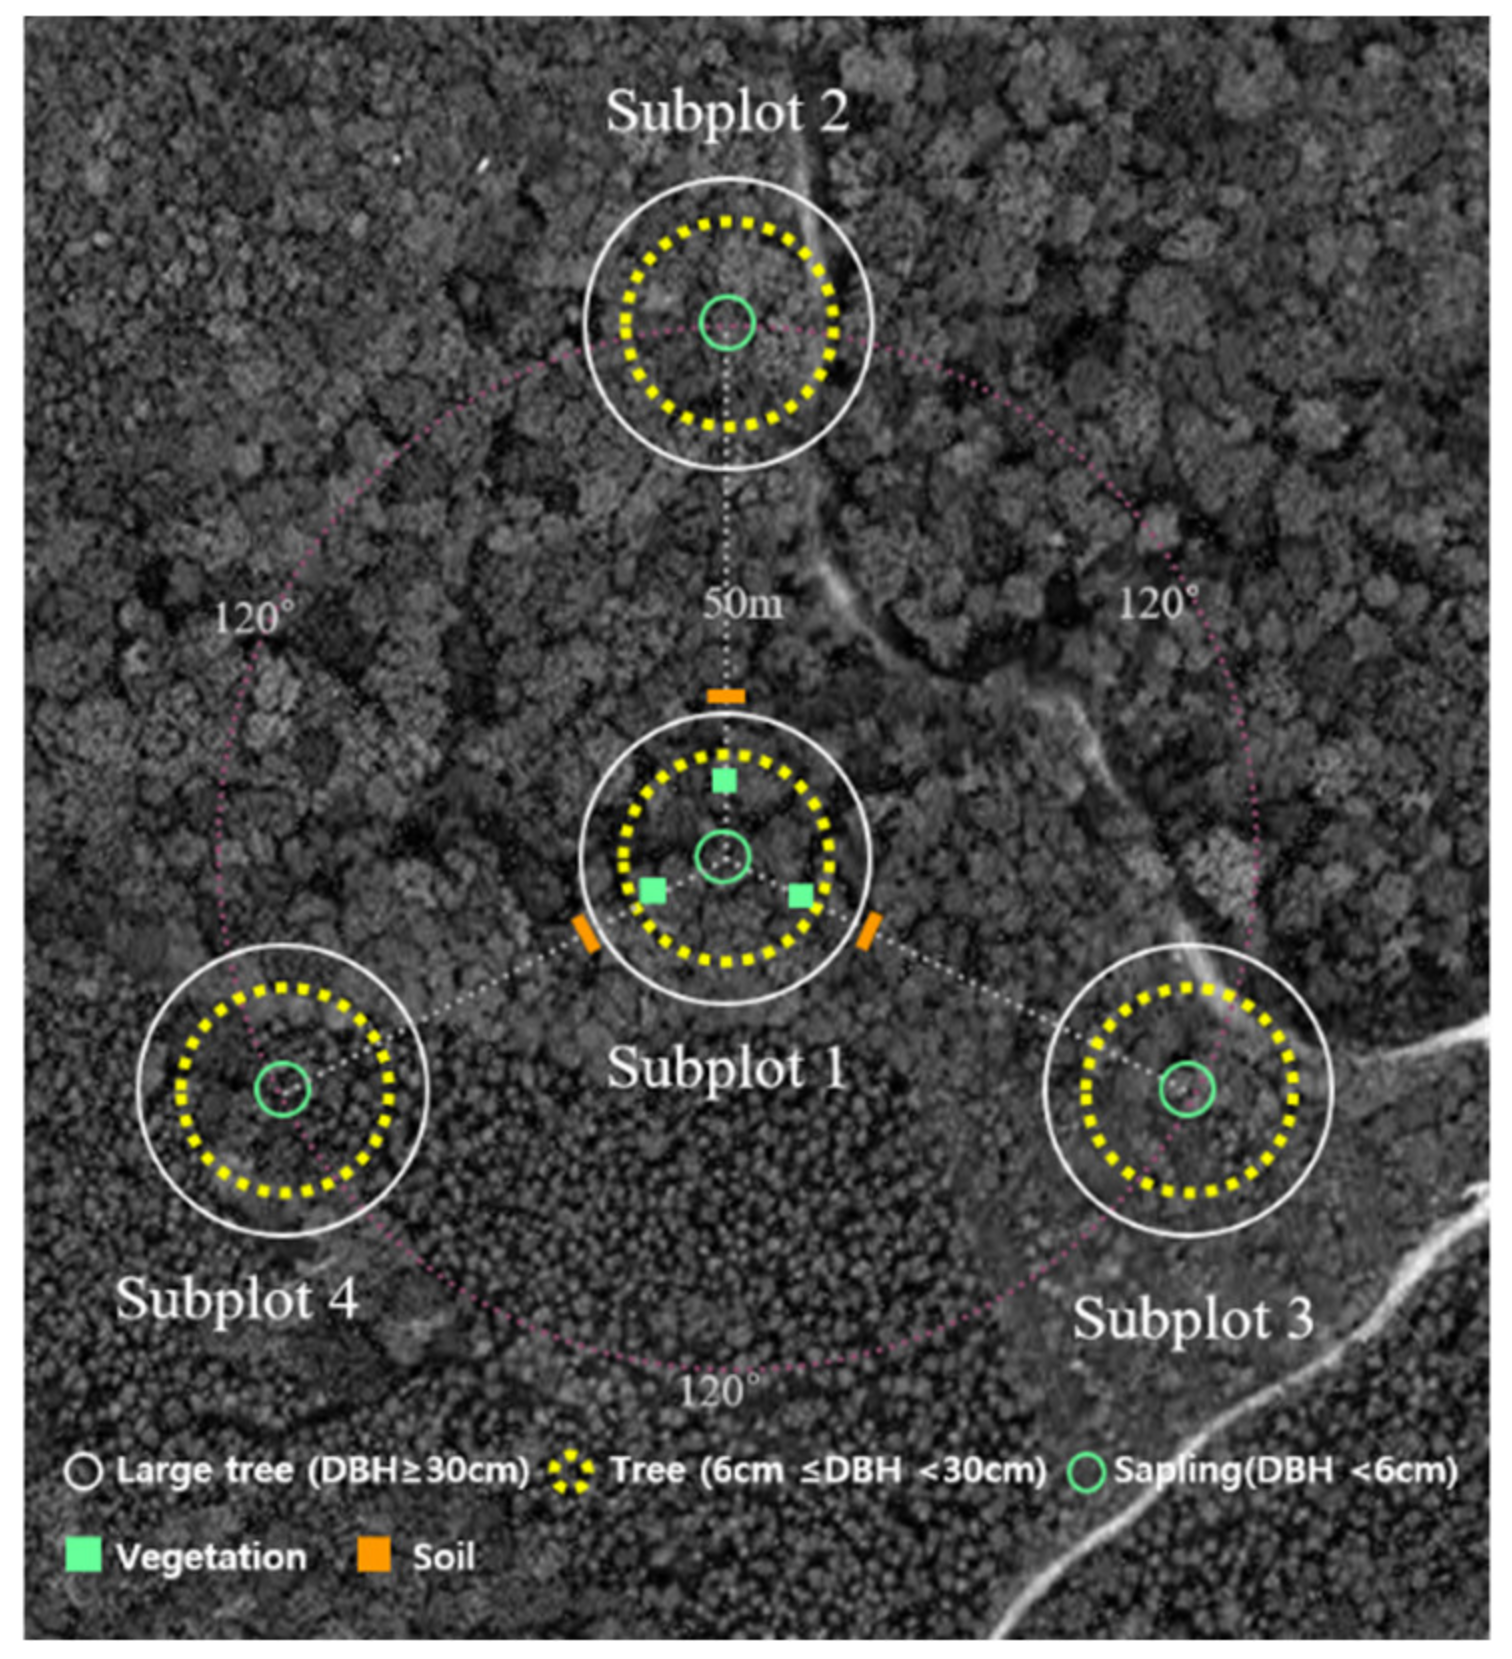
To estimate the carbon stock of soil and litter in South Korean forests, the data from the seventh NFI (NFI7) and FHM survey were used from 2016 to 2019 (Figure 1). The NFI provides data on growing stocks, diameter at breast height (DBH), height, tree density, age, and the number of sampling plots for each forest type and species. The NFI classifies a tree into 10 age classes, from class I to X as the youngest and oldest, respectively. Each class has a 10-year range. In this study, all trees older than 60 years are classified as class VI due to limitations of the sampling points. The FHM provides data on soil and litter properties and carbon concentration for each forest type and species. The NFI7 and FHM, which were conducted from 2016 to 2019, are based on the plot design as illustrated in Figure 2. The permanent sampling plot is a cluster of four sub-sampling plots, which is systematically installed across the entire forest in South Korea. Soil and litter samples are collected only at the central sub-sampling plots (subplot 1). If data collection at the site of sub-sampling plots was found to be difficult due to geographical inaccessibility, then the collection from those plots was omitted [33,34]. A total of 643 permanent sampling plots of FHM were used to calculate soil and litter carbon stocks, 184, 264, and 195 of which were coniferous, deciduous, and mixed forests, respectively (Table 1).
Sampling and analysis of soil and litter were performed in NFI and FHM surveys. Soil samples from depths of 0–10 cm, 10–20 cm, and 20–30 cm were passed through a 2-mm sieve to remove coarse fragments and roots, respectively. Soil bulk density was estimated as the proportion of the dry mass of all mineral soils to the volume of the corer, while the coarse fragment content was estimated as the ratio between the dry mass of coarse fragments to fine earth fractions, both of which were based on the mass remaining after oven-drying at 105 °C [35]. Litter samples were classified into the litter horizon (L horizon) and fermentation and humus horizon (FH horizon) depending on the degree of decomposition. The L horizon is the undissolved layer, and the FH horizon is the decayed layer from which plant tissues have been decomposed. To estimate the litter carbon stock, all fallen leaves and branches (less than 6 cm in diameter) of the L and FH horizons were collected from the upper part of the FHM sampling point. Once the sample was collected, it was dried at 80 °C for 24 h, and its dry weight was measured [35]. Then soil and litter samples were finely ground, and their carbon contents were measured with an elemental analyzer (vario Macro, Elementar Analysensystme, Germany) [35].
Soil carbon stocks (t C ha−1) at 0–30 cm were calculated as the sum of each soil depth multiplied by bulk density, coarse fragments content, and carbon concentration.
where BD is bulk density (Mg m−3), frag is % contents of coarse fragments/100, CC is carbon contents (%), D is depth of soil (cm), and horizon is soil depth layer which are notated by numbers from 1 to 3, each number signifying the depths of 0–10 cm, 10–20 cm, and 20–30 cm, respectively.
Litter carbon stocks (t C ha−1) were calculated using the dry mass multiplied by carbon concentration.
where DW is dry weight of litter (t ha−1) and CF is % carbon contents/100. When horizon equals 1, the equation calculates litter carbon stocks for the L horizon, and when horizon equals 2, it computes the litter carbon stock of the FH horizon.
A generalized linear model was utilized to conduct a variance analysis in carbon stock differences by forest type and age class. The Tukey’s honest significant difference test was conducted to examine the difference between the means of carbon stock by forest type and age class. All analyses were conducted with SAS 9.4 software [36].
2.2.2. Mapping Soil and Litter Carbon Stocks
Despite the considerable sampling of FHM plots for soil and litter data across South Korea, the 643 sample plots did not provide enough empirical estimates for the soil and litter carbon map. To overcome this, soil and litter carbon stocks at the NFI plots without carbon data (n = 10,330) were predicted with the random forest (RF) technique. Then, to fill the non-sampled points between the NFI sampling plots, interpolation by ordinary kriging was used.
RF is a machine learning tool using bootstrap aggregating to develop models with an improved prediction [37]. RF randomly selects predictors at each node of a decision tree. This procedure generates a de-correlated tree, which decreases the variance of the average from the generated trees [38]. These trees recognize the relationship between a dependent variable, in this case soil and litter carbon stocks, and predictor variables. Many predictor variables, either continuous or categorical, from the NFI survey data were selected, which include forest type, tree age, crown density, accessibility class, topography, elevation, slope, tree density, growing stocks, DBH, basal area, and height (Table 2). A forest soil digital map (1:25 k) was also included in the variable selection process [32] (Table 2). The RF models were trained using 70% of the NFI dataset and validated using the remaining data. To determine the variables for carbon stock prediction, we utilized important variable feature in the RF model. We used the importance values for simulating the RF models which were divided into four models, namely RF1 to RF4, then eliminated two variables for each iteration, and the best predictor was selected. This process was repeated multiple times, splitting the data randomly each time. RF prediction was conducted with the randomForest package in R version 4.0.2 with a default option and a fixed random seed [39,40]. The map of soil and litter carbon stocks was based on ordinary kriging using the default number of points (n = 12) to perform the interpolation in ArcGIS 10.4.1 [41]. Because there were several sub-sampling plots missing data on predictors in Table 2, they were dropped from the analysis. A total of 10,972 data points from observed and predicted carbon stocks were used for the interpolation.
3. Results and Discussion
3.1. Soil and Litter Carbon Stocks by Forest Type
Soil and litter carbon stocks for each forest type are presented in Table 3. The litter carbon stocks (t C ha−1) were 4.63 ± 0.18 for coniferous, 3.98 ± 0.15 for mixed, and 3.28 ± 0.13 for deciduous. Concerning the soil carbon stocks (t C ha−1), conversely, it was deciduous that accounted for the largest values at 44.11 ± 1.54, followed by 35.75 ± 1.60 for mixed, and 33.96 ± 1.62 for coniferous in descending order. The coniferous forest generally had higher litter carbon stocks than others (p < 0.05), while mineral soil carbon stocks were higher in the deciduous forest than others (p < 0.05). The total of soil and litter carbon stocks (t C ha−1) ranged from 38.58–47.39 for the forest types. The deciduous forests had higher soil and litter carbon stocks than the others.
Previous studies have reported similar results in litter carbon stocks [31,42,43,44]. This is because the litter layer of the coniferous forest generally contains more substances that are difficult to break down than those in the litter layer of other forest types [45,46]. Especially, the C/N ratio in the litter from the coniferous forests was of a higher value than that of the deciduous forests [44]. Additionally, the pH level of the coniferous forest’s soil tends to be lower than that of deciduous forest, decreasing the microorganism activities in soil, which results in fresher leaves than the decomposed leaves in the layer [46,47]. The decomposition rate of the litter layer for forest carbon modeling was higher in oaks (0.40 year−1) than pine trees (0.32 year−1) in South Korea [20]. This also implies that remaining litter carbon stocks in coniferous forests may be larger than those in deciduous forests.
In contrast to litter carbon stocks, soil carbon stocks of deciduous forests were higher than those of coniferous forests. A previous study in South Korea also reported that soil carbon stocks were 83.2 t C ha−1 in deciduous forests and 59.1 t C ha−1 in coniferous forests [42]. In this study, no significant correlation was found between soil organic carbon stocks and tree species, despite tree species affecting soil organic carbon stocks by the quantity and quality of organic matter input through litterfall and root activity [44,48]. Nevertheless, soil carbon stocks of deciduous forests were higher than those of coniferous forest potentially because of the decomposition of aboveground organic matters. Litter carbon content decreases with an increasing mineral soil nutrient status and is related to soil properties such as texture, pH, and the concentration of P and Ca [46]. The tree species could bring about a major impact in soil fauna activity and the related incorporation of litter into the soil, possibly changing the inputs of organic layer material to the upper mineral soil [44]. Moreover, root biomass and turnover rate of tree species would influence the residual carbon from the litter to soil [44]. Another explanation is that there may be more forest management activities conducted in coniferous forests than in deciduous forests. Most forest management in South Korea is conducted in coniferous forests, occupying 63% of the total plantation area [28]. Forest management activities can decrease the soil organic carbon contents, which is related to aeration and the mineralization of organic matter. Soil bulk density, one of the key factors in soil carbon stocks, can either increase by compaction or decrease through tillage and stand regeneration for forest management [48]. However, soil carbon stocks also made a difference in site conditions and soil texture. Coniferous forests had small soil carbon pools, while deciduous forests such as beech forests had large soil carbon pools. However, this varied depending on the site conditions where the species dominate [48,49]. Another study reported that loamy soil had higher carbon stocks under deciduous forest compared to coniferous forest. In contrast, soils from base-poor consolidated bedrock had higher carbon stocks under coniferous forests compared to deciduous forests [44].
3.2. Soil and Litter Carbon Stocks by Age Class
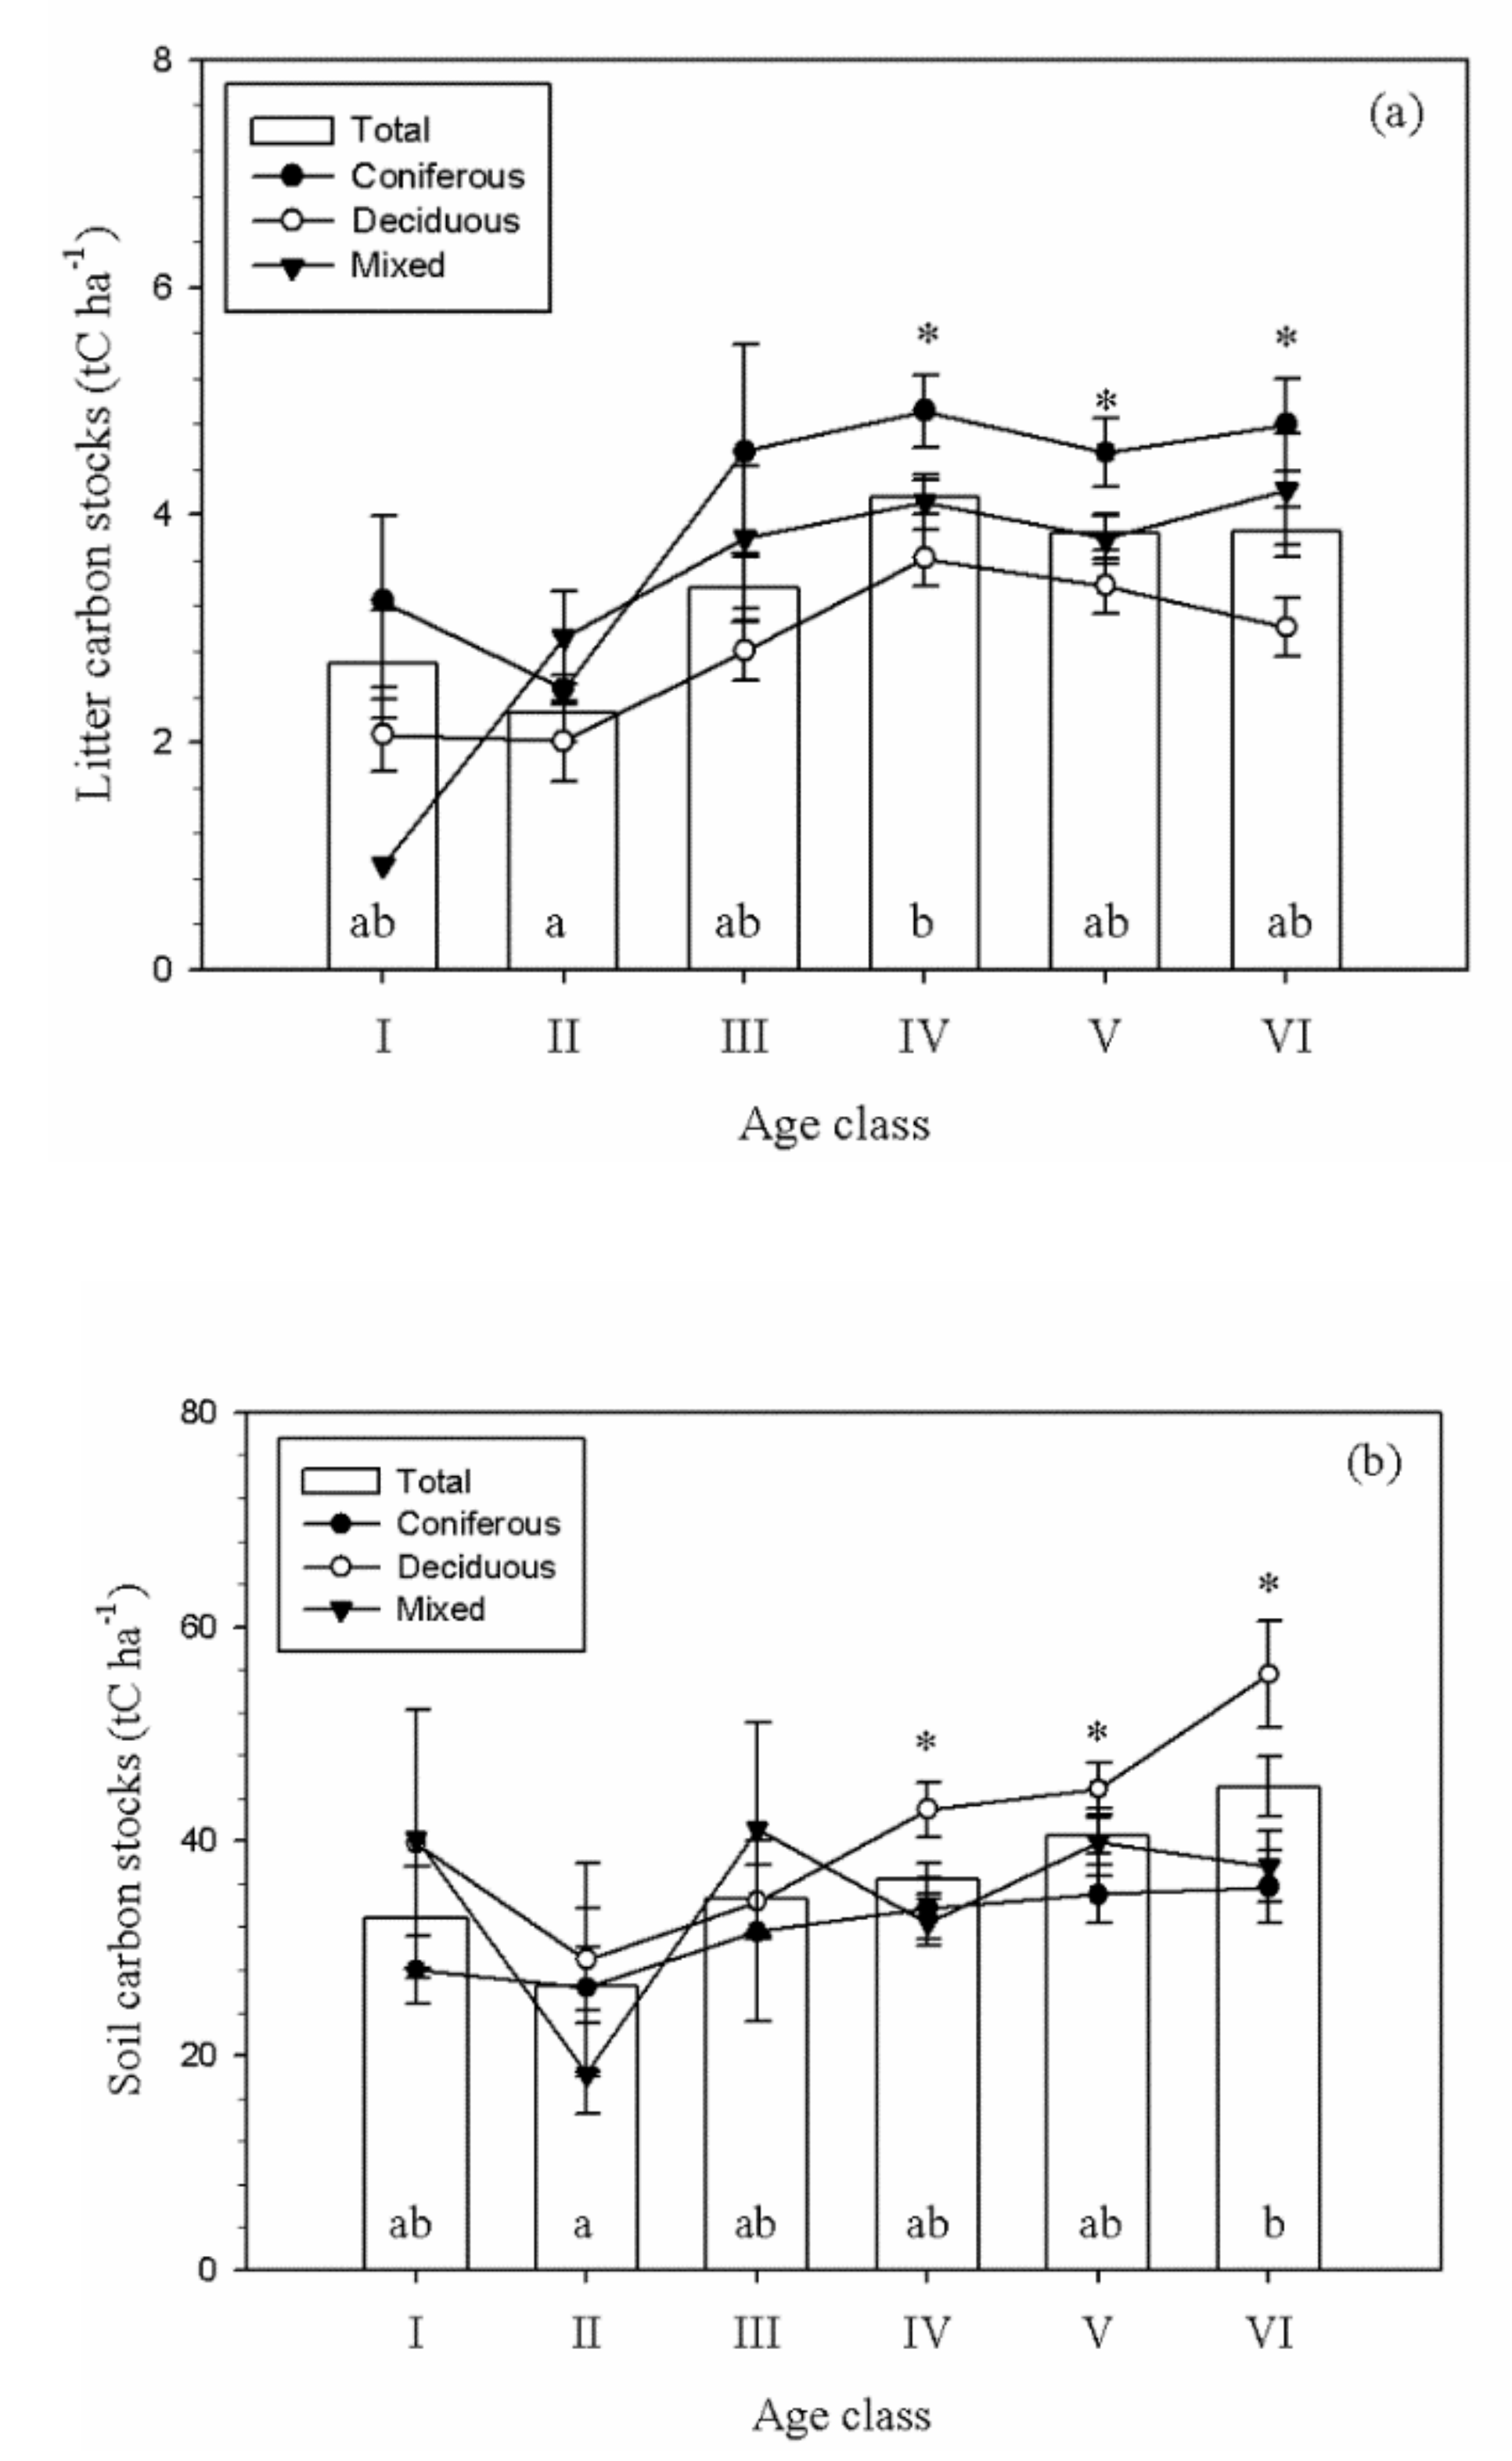
Soil at 0–30 cm and litter carbon stocks for each age class are displayed in Figure 3. The carbon storage in the litter layer increased as the forest grew older; however, a significant difference was found between age class II and IV (p < 0.05) (Figure 3a). The litter carbon stocks were higher in the coniferous forest than others at the age classes ranging from IV to VI. However, the age classes of I to III did not demonstrate such a trend (higher carbon stocks in the coniferous forest). Although the carbon storage in the soil had increased with the forest’s age, no significant difference was observed among the age classes except that of II and VI (Figure 3b). The total of soil and litter carbon stocks revealed a similar trend in soil carbon stocks, due to the large portion in these layers.
The carbon storage quantity slightly increased with the maturation of the stand, and similar results were observed in previous studies [31,43,44,50,51,52]. This is because the quantity of litter increases as a stand matures [43,50]. Schulp et al. [43] has reported that the quantity of carbon in the litter layer increased as fine roots and bark in the mature stand grew more abundant. Forest age is acknowledged to influence the rate of soil carbon sequestration and, accordingly, the soil organic carbon stocks [48,53]. This study observed a higher carbon stock in age class I than in age class II, even if there is no statistically significant difference. This could be related to the trees in age class I being more easily influenced by the pre-existing stands. Moreover, the soil carbon may increase due to an increase in biomass production and accretion into the soil, which also enhances the production of the root biomass [51]. The aging of forests results in increasing carbon densities in management systems with longer rotation lengths, provided that the harvest age is not beyond the age where the forest stand turns from a net sink to a source of carbon at tipping points [48]. Soil organic carbon stocks in granite soils tend to increase as forest stands age in tropical secondary forests [52]. Soil carbon decreased with increasing stand age due to the soil disturbance during forest management in an over-mature stand in Pakistan [54]. In temperate forests, no value difference was observed between tree biomass and soil carbon stocks [44]. Aging forests in a steady state of carbon cycle have lower carbon fixation potential than soils of younger forests; this may be attributed to a loss of organic matter following management disturbance [55].
3.3. Soil Carbon Map
3.3.1. Model Performance
To determine the variables for carbon stock prediction, a variable importance test was conducted. Table 4 gives an overview of the selected predictors for the RF machine learning algorithm. Starting from RF1, the predictors with less significance were eliminated, and then RF2 commenced. Such a process was iterated until the simulation reached RF4. We assumed that age class and soil type were the important predictors; however, they have a small importance variable (Table 4). As the low-significant predictors were eliminated, the model’s prediction capability improved. In particular, the model that predicted soil carbon stock made a huge improvement as it progressed from RF1 to RF2 (root mean square error (RMSE (t C ha−1)) = 1.82, 1.67, respectively, Table 5). The error margin narrowed with each iteration of the model, but the improvement was relatively small. A similar trend was observed in the soil and litter model as it went from RF1 to RF4, but the prediction accuracy was lowered when the model went from RF2 to RF3. We did not use the RF4 model since it excludes the forest type, which was confirmed as influencing the carbon stocks in the previous section. When considering the mean absolute error (MAE) value, this study determined RF2, a model that removed two predictor variables, to be the most accurate. The elevation, accessibility class, slope, DBH, height, and growing stocks appeared to be the most important variables for predicting soil, and soil and litter carbon stocks (Table 4). The best prediction was found at the soil and litter carbon stocks for both training and test data sets, because the relative RMSE values were 4.22% and 3.53% for soil carbon and soil and litter carbon, respectively, in RF2.
Our study indicated that elevation, accessibility class, slope, DBH, height, and growing stocks were important predictors, while other studies found different predictors that yielded the best performance; this could be attributed to difference in materials and methods. De Vos et al. [56] reported that soil type and tree species were the major predictors for forest floor carbon stocks using the boosted regression tree model. For topsoil carbon stocks, soil type, mean air temperature and precipitation were the major predictors for mineral soil carbon stocks. Chen et al. [18] reported the most important predictors using RF modeling, ranked from the highest to lowest; they include land cover, parent material, net primary production, elevation, mean annual temperature, mean annual precipitation, erosion rates, topographic wetness index, soil type, and slope. According to Nanko et al. [57], soil group, air temperature, slope, altitude, and organic carbon stocks of litter were the most important factors for affecting soil organic carbon stocks, while information on forest stands such as stand density, growing stock, age class, and species have a smaller effect on soil organic carbon stocks using boosted regression tree modeling. Several studies reported precipitation as an important variable [58,59]. Conversely, Nanko et al. [57] asserted that precipitation was not important due to the conflicting effects of the increase in soil organic carbon content with increasing net primary production and the decrease in mineral soil mass by the loss in topsoil.
3.3.2. Forest Soil Carbon Map
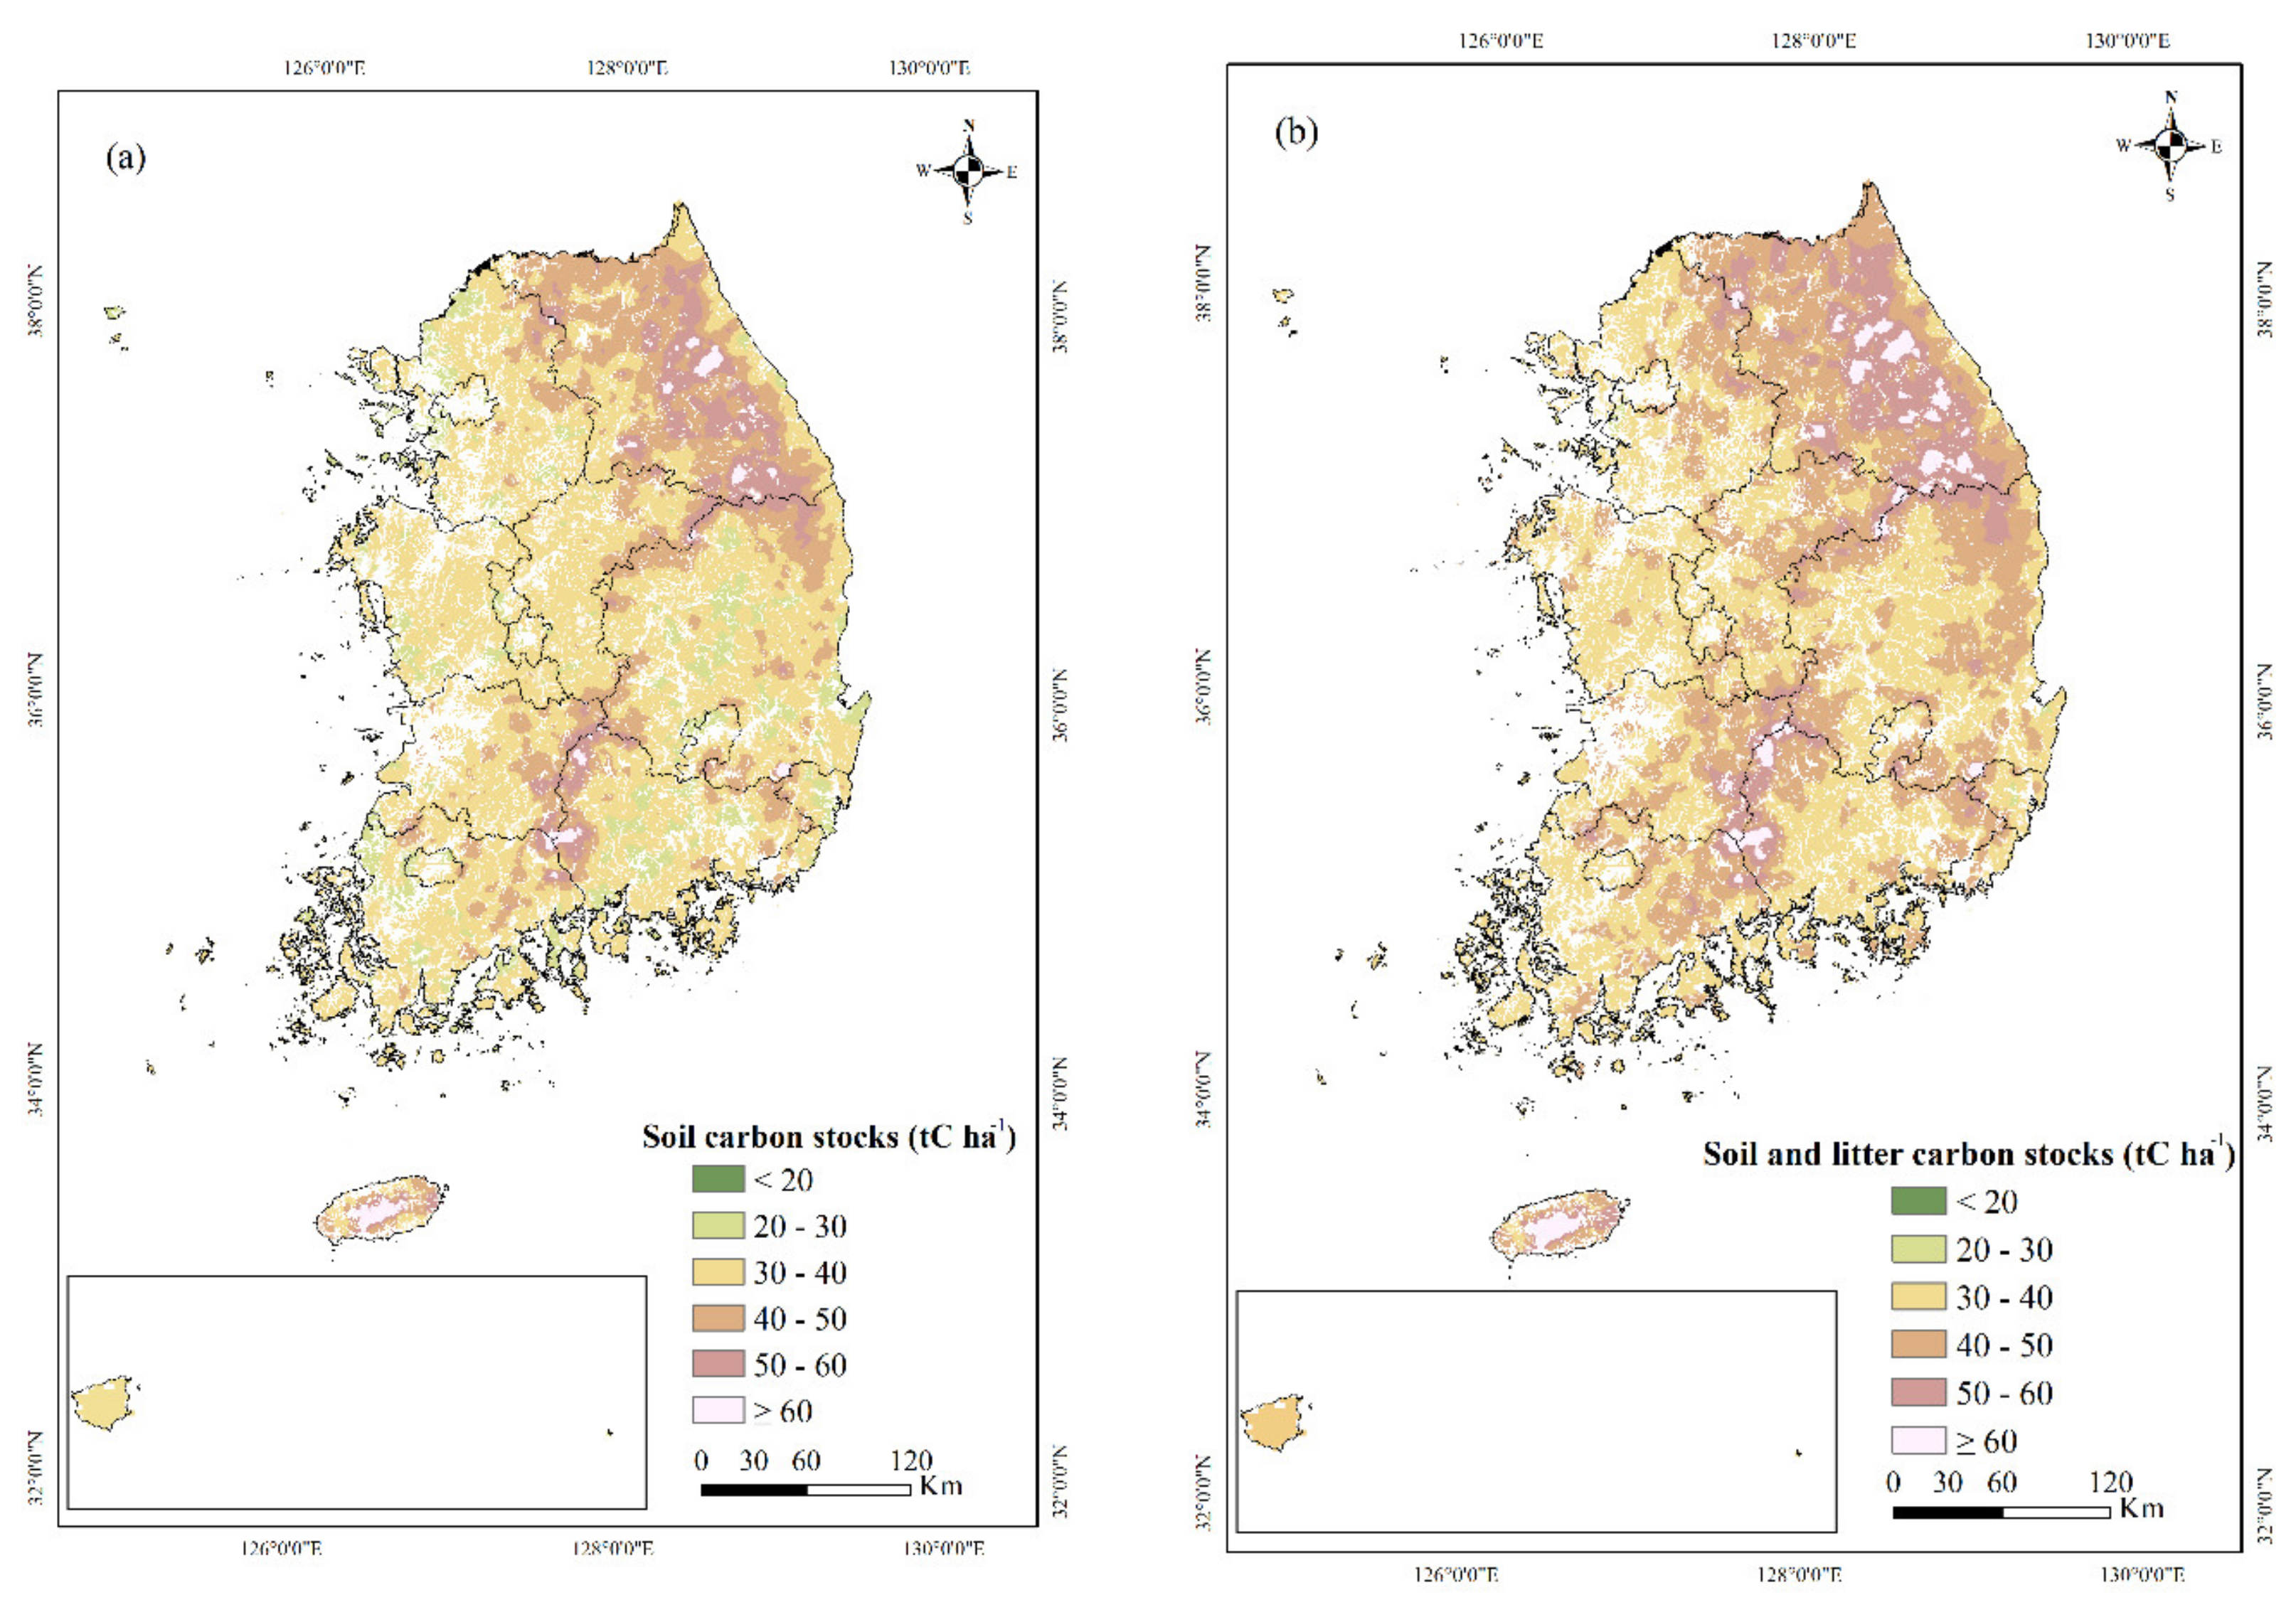
Two carbon stock maps were constructed using the RF2 models. One was made for only soil carbon stocks (Figure 4a), and the other for both soil and litter carbon stocks (Figure 4b). For the map of soil carbon stocks, average values were approximately 38.09 ± 0.03 t C ha−1 and for the carbon stocks map of combined soil and litter, this was approximately 42.09 ± 0.03 t C ha−1. Our results were lower than the previous study of temperate forests. Wellbrock et al. [60] reported that the carbon stock of German forests was 19.0 t C ha−1 in the organic layer, and 55.6 t C ha−1 in the mineral soil from 0 cm to 30 cm. De Vos et al. [56] reported that soil organic carbon stocks from 0 cm to 30 cm of European forests was 71.3 t C ha−1, and there were differences among the reference soil groups. The difference in carbon stocks in forests among different countries might be due to the differences in parent soil material, mean temperature and precipitation, and forest stand statuses such as age class, growing stocks, and tree species. Different measuring scales, quantification, and the sample size of various countries could also cause differences in carbon stocks of soil organic carbon [61]. The map shows that Gangwon-do, the north-eastern part of South Korea, and Jeju-do, the southern island in South Korea, carry a large quantity of soil carbon stocks. In the case of Gangwon-do, there are large growing stocks in the forests. Jeju-do is a volcanic island formed by continental intraplate volcanism [62], which could explain the great soil carbon stocks in Jeju-do, the southern island in South Korea. Nanko et al. [57] reported that volcanic soil had larger soil organic carbon stocks than other soil types. Additionally, soil carbon maps revealed a similar trend to the topographic distribution of primary mountain regions in South Korea [63,64]. These areas have a mean elevation value from 446 to 794 m [63]. The soil and litter carbon map also shares a similar trend with the soil carbon map. This map demonstrated a similar trend to the biomass resource map in the South: there were many biomass resources in the north-eastern part, east-southern part, and southern-central part in South Korea [65].
3.4. Implication
Estimating carbon stock in the soil and litter layer using the NFI data could be used in future national GHG inventory reports for tier 2 levels related to the accuracy indicators. It can also estimate all carbon pools to achieve accuracy and completeness in the national GHG inventory report to be submitted to the UNFCCC. Other countries also use their iterations of NFIs to compute their carbon stocks, and they reported the carbon stocks of all carbon pools [13,14]. Additionally, soil and litter carbon maps can be used for spatial soil carbon stocks at national levels. For reporting soil organic carbon inventories, the Netherlands has used the soil organic carbon stocks map coupled with the soil map and field survey data [43]. The data collected by this study may be utilized in the UN’s Food and Agriculture Organization (FAO) Global Soil Organic Carbon map (GSOCmap). However, we used an ordinary kriging method for the carbon stocks map of forest soil and litter. In order to improve the accuracy of this map, it is necessary to improve the mapping method. Using accurate forest cover and soil type maps while deciding an appropriate scaling up method would aid in accomplishing such goal in the future [61].
4. Conclusions
The purpose of this study was to estimate soil and litter carbon stocks using the NFI data and RF models and to map carbon stocks in South Korean forests. Coniferous forests had higher litter carbon stocks than the others while deciduous forests contained higher soil carbon stocks. The carbon storage in the soil and litter layer had grown as the forest matured, with a few exceptions in several age classes, where significant differences were observed. The rise of carbon in the soil and litter layer is contributed to by the increase in residual substances from mature stands. Out of four different random forest models (RF1–RF4) which the current study employed, we have determined the RF2 model to be the most accurate. We chose elevation, accessibility class, slope, DBH, height, and growing stocks as the important predictors. Based on the RF2 model, two types of maps were generated, one for soil and the other for litter carbon stocks. For soil carbon stocks, average values were approximately 38.09 ± 0.03 t C ha−1, and the carbon stocks of combined soil and litter were approximately 42.09 ± 0.03 t C ha−1 in the RF2 model. Our findings will provide more detailed information on litter and soil carbon stocks, thereby facilitating the understanding of forest carbon storage in South Korea. A few limitations, however, were seen. We were only able to utilize the data sets gathered over four years, a year short of the full grid sampling cycle of the NFI. Including a full set of the data will allow not just a more accurate estimation of carbon stocks in forest soil, but also identification of change in the near future. Another flaw is that only one methodology was applied to map the carbon stocks in forest soil and litter. To obtain precise information requires comparison with appropriate scaling-up tools. These drawbacks notwithstanding, the methods used in this study to estimate and map carbon stocks in forest litter and soil could be adopted in future national GHG inventory reports for tier 2 levels. All carbon pools can also be assessed by these approaches to achieve accuracy and completeness in the reports. Moreover, soil and litter carbon maps will be of great use for spatial soil carbon stocks at a national level, the data of which will eventually be utilized at a global level.
Author Contributions
Conceptualization, S.L. (Sunjeoung Lee), J.Y., and J.K.; methodology, S.L. (Sunjeoung Lee) and S.L. (Seunghyun Lee); software, S.L. (Sunjeoung Lee) and S.L. (Seunghyun Lee); validation, S.L. (Sunjeoung Lee) and J.S.; formal analysis, S.L. (Sunjeoung Lee); investigation, S.L. (Sunjeoung Lee); resources, J.Y.; data curation, S.L. (Sunjeoung Lee); writing—original draft preparation, S.L. (Sunjeoung Lee); writing—review and editing, S.L. (Sunjeoung Lee) and J.S.; visualization, S.L. (Sunjeoung Lee) and S.L. (Seunghyun Lee); supervision, S.L. (Sunjeoung Lee); project administration, J.Y. and J.K.; funding acquisition, J.K. All authors have read and agreed to the published version of the manuscript.
Funding
This research was funded by [National Institute of Forest Science], grant number FM0000-2020-01-2020.
Acknowledgments
This study was carried out with support from the ‘R&D Program’ for Forest Science Technology (Project No. FM0200-2019-01-2020 and FM0000-2020-01-2020) provided by the National Institute of Forest Science.
Conflicts of Interest
The authors declare no conflict of interest.
References
- Jobbagy, E.; Jacson, R.B. The vertical distribution of soil organic carbon and its relation to climate and vegetation. Ecol. App. 2000, 10, 423–436. [Google Scholar] [CrossRef]
- Pan, Y.; Birdsey, R.A.; Fang, J.; Houghton, R.; Kauppi, P.E.; Kurz, W.A.; Phillips, O.L.; Shvidenko, A.; Lewis, S.L.; Canadell, J.G.; et al. A Large and Persistent Carbon Sink in the World’s Forests. Science 2011, 333, 988–993. [Google Scholar] [CrossRef] [Green Version]
- Six, J.; Conant, R.T.; Paul, E.A.; Paustian, K.S. Stabilization mechanisms of soil organic carbon matter: Implications for C-saturation of soils. Plant Soil 2002, 241, 155–176. [Google Scholar] [CrossRef]
- Kurz, W.A.; Shaw, C.H.; Bosivenue, C.; Stinson, G.; Metsaranta, J.; Leckie, D.; Smyth, C. Carbon in Canada’s boreal forest—A synthesis. Environ. Rev. 2013, 21, 260–292. [Google Scholar] [CrossRef]
- Gren, I.-M.; Aklilu, A.Z.; Elofsson, K. Forest Carbon Sequestration, Pathogens and the Costs of the EU’s 2050 Climate Targets. Forests 2018, 9, 542. [Google Scholar] [CrossRef] [Green Version]
- Kurz, W.A.; Smyth, C.; Lemprier, T. Climate change mitigation through forest sector activities: Principles, potential and priorities. Unasylva 2016, 246, 61–67. [Google Scholar]
- Van Wesemael, B.; Paustian, K.; Meersmans, J.; Goidts, E.; Barancikova, G.; Easter, M. Agricultural management explains historic changes in regional soil carbon stocks. Proc. Natl. Acad. Sci. USA 2010, 107, 14926–14930. [Google Scholar] [CrossRef] [Green Version]
- UNFCCC (United Nations Framework Convention on Climate Change). The Paris Agreement. Available online: https://unfccc.int/process-and-meetings/the-paris-agreement/the-paris-agreement (accessed on 28 September 2018).
- IPCC (Intergovernmental Panel on Climate Change). IPCC Guidelines for National Greenhouse Gas Inventory; IPCC/IGES: Hayama, Japan, 2006. [Google Scholar]
- Grassi, G.; House, J.; Dentener, G.G.F.; Federici, S.; Elzen, M.D.; Penman, J. The key role of forests in meeting climate targets requires science for credible mitigation. Nat. Clim. Chang. 2017, 7, 220–226. [Google Scholar] [CrossRef]
- Forsell, N.; Turkovska, O.; Gusti, M.; Obersteiner, M.; Elzen, M.D.; Havlík, P. Assessing the INDCs’ land use, land use change, and forest emission projections. Carbon Balance Manag. 2016, 11, 1–17. [Google Scholar] [CrossRef] [Green Version]
- Bariz, R.; Strich, S. Forests and the national greenhouse gas inventory of Germany. Biotechonl. Agron. Soc. Environ. 2000, 4, 265–271. [Google Scholar]
- SF (Statistics Finland). Greenhouse Gas Emissions in Finland 1990–2013; Statistics Finland: Helsinki, Finland, 2015. [Google Scholar]
- UBA (German Environment Agency). Submission Under the United Nations Framework Convention on Climate Change 2015; Federal Environment Agency: Dessau, Germany, 2015. [Google Scholar]
- KFRI (Korea Forest Research Institute). The Changes of National Forest Inventory Systems (1971–2010); KFRI: Seoul, Korea, 2015. (In Korean) [Google Scholar]
- GIR (Greenhouse Gas Inventory and Research Center of Korea). National Greenhouse Gas Inventory Report 2017; GIR: Seoul, Korea, 2016. [Google Scholar]
- Lee, D.K.; Yoon, T.K.; Han, S.; Kim, S.; Yi, M.J.; Park, G.-S.; Kim, C.; Son, Y.M.; Kim, R.; Son, Y. Estimating the carbon dynamics of South Korean forests from 1954 to 2012. Biogeosciences 2014, 11, 4637–4650. [Google Scholar] [CrossRef] [Green Version]
- Chen, S.; Martin, M.P.; Saby, N.P.A.; Walter, C.; Angers, D.A.; Arrouays, D. Fine resolution map of top- and subsoil carbon sequestration potential in France. Sci. Total. Environ. 2018, 630, 389–400. [Google Scholar] [CrossRef] [PubMed]
- Arrouays, D.; Lagacherie, P.; Hartemink, A.E. Digital soil mapping across the globe. Geoderma Reg. 2017, 9, 1–4. [Google Scholar] [CrossRef]
- Kim, S.; Kim, C.; Han, S.H.; Lee, S.T.; Son, Y. A multi-site approach toward assessing the effect of thinning on soil carbon contents across temperature pine, oak, and larch forests. For. Ecol. Manag. 2018, 424, 62–70. [Google Scholar] [CrossRef]
- Won, H.-Y.; Kim, D.-K.; Han, A.; Lee, Y.-S.; Mun, H.-T. Distribution and absorption of Organic Carbon in Quercus mongolica and Pinus densiflora Forest at Mt. Gumgang in Seosan1a. Korean J. Environ. Ecol. 2016, 30, 243–252. [Google Scholar] [CrossRef]
- Lee, S.J.; Yim, J.S.; Son, Y.M.; Son, Y.; Kim, R. Estimation of Forest Carbon Stocks for National Greenhouse Gas Inventory Reporting in South Korea. Forests 2018, 9, 625. [Google Scholar] [CrossRef] [Green Version]
- Domke, G.M.; Perry, C.H.; Walters, B.F.; Woodall, C.; Russell, M.B.; Smith, J.E. Estimating litter carbon stocks on forest land in the United States. Sci. Total. Environ. 2016, 557–558, 469–478. [Google Scholar] [CrossRef]
- Liu, L.; Ji, M.; Buchroithner, M. Combining Partial Least Squares and the Gradient-Boosting Method for Soil Property Retrieval Using Visible Near-Infrared Shortwave Infrared Spectra. Remote Sens. 2017, 9, 1299. [Google Scholar] [CrossRef] [Green Version]
- Guo, P.-T.; Li, M.-F.; Luo, W.; Tang, Q.-F.; Liu, Z.-W.; Lin, Z.-M. Digital mapping of soil organic matter for rubber plantation at regional scale: An application of random forest plus residuals kriging approach. Geoderma 2015, 237–238, 49–59. [Google Scholar] [CrossRef]
- Li, Q.-Q.; Yue, T.; Wang, C.-Q.; Zhang, W.-J.; Yu, Y.; Li, B.; Yang, J.; Bai, G.-C. Spatially distributed modeling of soil organic matter across China: An application of artificial neural network approach. Catena 2013, 104, 210–218. [Google Scholar] [CrossRef]
- Keskin, H.; Grunwald, S.; Harris, W.G. Digital mapping of soil carbon fractions with machine learning. Geoderma 2019, 339, 40–58. [Google Scholar] [CrossRef]
- KFS (Korea Forest Service). Statistical Yearbook of Forest; KFS: Daejeon, Korea, 2019. [Google Scholar]
- KMA (Korea Meteorological Administration). Available online: http://www.weather.go.kr/weather/climate/average_south.jsp (accessed on 5 November 2020).
- Hong, S.Y.; Minasny, B.; Han, K.H.; Kim, Y.; Lee, K.; Ritsema, C. Predicting and mapping soil available water capacity in Korea. PeerJ 2013, 1, e71. [Google Scholar] [CrossRef] [PubMed]
- Cha, J.; Cha, Y.; Oh, N.-H. The Effects of Tree Species on Soil Organic Carbon Content in South Korea. J. Geophys. Res. Biogeosciences 2019, 124, 708–716. [Google Scholar] [CrossRef]
- KFRI (Korea Forest Research Institute). The Forest Soil Profiles in Korea; KFRI: Seoul, Korea, 2005. (In Korean) [Google Scholar]
- KFRI (Korea Forest Research Institute). The 5th National Forest Inventory—Field Manual; KFRI: Seoul, Korea, 2008. (In Korean) [Google Scholar]
- KFS (Korea Forest Service). The 6th National Forest Inventory and Forest Health Monitoring—Field Manual Ver. 1.2; KFS: Daejeon, Korea, 2012. (In Korean) [Google Scholar]
- KFS (Korea Forest Service); KFRI (Korea Forest Research Institute); Kopf (Korea Forestry Promotion Institute). The Field Manual of the 7th National Forest Inventory and Forest HEALTH Monitoring; KFRI: Seoul, Korea, 2017. (In Korean) [Google Scholar]
- SAS Institute. SAS/STAT 9.4 User’s Guide, 2nd ed.; SAS Institute Inc.: Cray, NC, USA, 2016. [Google Scholar]
- Breiman, L. Random Forests Mach. Learn 2001, 45, 5–32. [Google Scholar]
- Hastie, T.; Tibshirani, R.; Friedman, J. The Elements of Statistical Learning: Data Mining, Inference, and Prediction; Springer: Berlin/Heidelberg, Germany, 2009. [Google Scholar]
- Liaw, A.; Wiener, M. Breiman and Cutler’s Random Forests for Classification and Regression; CRAN: Vienna, Austria, 2018. [Google Scholar]
- R Core Team. R: A Language and Environment for STATISTICAL Computing; R Foundation for Statistical Computing: Vienna, Austria, 2020. [Google Scholar]
- ESRI. ArcGis Desktop: Release 10; Environmental Systems Research Institute: Redlends, CA, USA, 2011. [Google Scholar]
- KFS (Korea Forest Service); Kofpi (Korea Forestry Promotion Institute). Assessment of the Korea’s Forest Resource; Kopfi: Seoul, Korea, 2013. [Google Scholar]
- Schulp, C.J.; Nabuurs, G.-J.; Verburg, P.H.; De Waal, R.W. Effect of tree species on carbon stocks in forest floor and mineral soil and implications for soil carbon inventories. For. Ecol. Manag. 2008, 256, 482–490. [Google Scholar] [CrossRef]
- Grüneberg, E.; Schöning, I.; Riek, W.; Ziche, D.; Evers, J. Carbon Stocks and Carbon Stock Changes in German Forest Soils. In Forest-Water Interactions; Springer Science and Business Media LLC: Berlin, Germany, 2019; pp. 167–198. [Google Scholar]
- Berg, B. Litter decomposition and organic matter turn-over in northern forest soils. For. Ecol. Manag. 2000, 133, 13–22. [Google Scholar] [CrossRef]
- Vesterdal, L.; Raulund-Rasmussen, K. Forest floor chemistry under seven tree species along a soil fertility gradient. Can. J. For. Res. 1998, 2, 1636–1647. [Google Scholar] [CrossRef]
- Thuille, A.; Schulze, E.-D. Carbon dynamics in successional and afforested spruce stands in Thuringia and the Alps. Glob. Chang. Biol. 2006, 12, 325–342. [Google Scholar] [CrossRef]
- Jandl, R.; Lindner, M.; Vesterdal, L.; Bauwens, B.; Baritz, R.; Hagedorn, F.; Johnson, D.W.; Minkkinen, K.; Byrne, K.A. How strongly can forest management influence soil carbon sequestration? Geoderma 2007, 137, 253–268. [Google Scholar] [CrossRef]
- De Vries, W.; Reinds, G.J.; Posch, G.J.J.; Sanz, M.; Krause, G.; Calatyud, V.; Dupouey, J.; Sterba, H.; Gundersen, P.; Voogd, J.; et al. Intensive Monitoring of Forest Ecosystems in Europe; Technical report; European Commission UN/ECE: Brussels, Belgium, 2003. [Google Scholar]
- Cao, J.; Zhang, X.; Deo, R.C.; Gong, Y.; Feng, Q. Influence of stand type and stand age on soil carbon storage in China’s arid and semi-arid regions. Land Use Policy 2018, 78, 258–265. [Google Scholar] [CrossRef]
- Lal, R. Soil carbon stocks under present and future climate with specific reference to European ecoregions. Nutr. Cycl. Agroecosystems 2007, 81, 113–127. [Google Scholar] [CrossRef]
- Paz, C.; Goosem, M.; Bird, M.I.; Preece, N.; Goosem, S.; Fensham, R.J.; Laurance, S. Soil types influence predictions of soil carbon stock recovery in tropical secondary forests. For. Ecol. Manag. 2016, 376, 74–83. [Google Scholar] [CrossRef]
- Johnson, D.W.; Curtis, P.S. Effects of forest management on soil C and N storage: meta analysis. For. Ecol. Manag. 2001, 140, 227–238. [Google Scholar] [CrossRef]
- Amir, M. Soil organic content of stands of different ages in a subtropical chir pine (Pinus roxburghii) forest of pakistan. Appl. Ecol. Environ. Res. 2019, 17, 11475–11487. [Google Scholar] [CrossRef]
- Covington, W.W. Changes in Forest Floor Organic Matter and Nutrient Content Following Clear Cutting in Northern Hardwoods. Ecology 1981, 62, 41–48. [Google Scholar] [CrossRef]
- De Vos, B.; Cools, N.; Ilvesniemi, H.; Vesterdal, L.; Vanguelova, E.; Carnicelli, S. Benchmark values for forest soil carbon stocks in Europe: Results from a large scale forest soil survey. Geoderma 2015, 251–252, 33–46. [Google Scholar] [CrossRef]
- Nanko, K.; Hasimoto, S.; Miura, S.; Ishizuka, S.; Sakai, T.; Levia, D.F.; Ugawa, S.; Nishizono, T.; Kitahara, F.; Osone, Y.; et al. Assessment of soil group, site and climatic effects on soil organic carbon stocsk of topsoil in Japanese forests. Soil Sci. 2017, 68, 547–558. [Google Scholar] [CrossRef]
- Adhikari, K.; Owens, P.R.; Libohova, Z.; Miller, D.M.; Wills, S.A.; Nemecek, J. Assessing soil organic carbon stock of Wisconsin, USA and its fate under future land use and climate change. Sci. Total. Environ. 2019, 667, 833–845. [Google Scholar] [CrossRef]
- Hobley, E.; Wilson, B.; Wilkie, A.; Gray, J.; Koen, T. Drivers of soil organic carbon storage and vertical distribution in Eastern Australia. Plant Soil 2015, 390, 111–127. [Google Scholar] [CrossRef]
- Wellbrock, N.; Grüneberg, E.; Riedel, T.; Polley, H. Carbon stocks in tree biomass and soils of German forests. Central Eur. For. J. 2017, 63, 105–112. [Google Scholar] [CrossRef] [Green Version]
- Vanguelova, E.I.; Bonifacio, E.; De Vos, B.; Hoosbeek, M.R.; Berger, T.W.; Vesterdal, L.; Armolaitis, K.; Celi, L.R.; Dinca, L.; Kjønaas, O.J.; et al. Sources of errors and uncertainties in the assessment of forest soil carbon stocks at different scales—Review and recommendations. Environ. Monit. Assess. 2016, 188, 630. [Google Scholar] [CrossRef] [PubMed]
- Koh, G.W.; Park, J.B.; Kang, B.R.; Kim, G.P.; Moon, D.C. Volcanism in Jeju Island. J. Geol. Soc. Korea 2013, 49, 209–230. [Google Scholar] [CrossRef]
- Tak, H.M.; Kim, S.H.; Son, I. A study on distributions and spatial properties of geomorphological mountain area. J. Geol. Soc. Korea 2013, 48, 1–18, (In Korean with English abstract). [Google Scholar]
- Park, S.J.; Son, I. Discussions on the distribution and genesis of mountain ranges in the Korean peninsular (III): Proposing a new mountain range map. J. Geol. Soc. Korea 2008, 43, 276–295, (in Korean with English abstract). [Google Scholar]
- Son, Y.M.; Lee, S.J.; Kim, S.; Hwang, J.S.; Kim, R.; Park, H. Mapping and Assessment of Forest Biomass Resources in Korea. J. Korean For. Soc. 2014, 103, 431–438. [Google Scholar] [CrossRef] [Green Version]
Figure 1.
Distribution of National Forest Inventory (NFI) and Forest Health Monitoring (FHM) sample plots in South Korea (2016–2019).
Figure 1.
Distribution of National Forest Inventory (NFI) and Forest Health Monitoring (FHM) sample plots in South Korea (2016–2019).

Figure 2.
Plot design of National Forest Inventory (NFI) and Forest Health Monitoring (FHM) survey in South Korea.
Figure 2.
Plot design of National Forest Inventory (NFI) and Forest Health Monitoring (FHM) survey in South Korea.

Figure 3.
Litter (a) and soil at 0–30 cm (b) carbon stock by age class and forest type in South Korea. The error bars represent the standard error of the mean. Different letters in the bars indicate significant differences among age class (p < 0.05). Significant differences between forest type in a same age class are indicated by asterisks (p < 0.05).

Figure 4.
Map of carbon stocks in (a) soil at 0–30 cm, (b) soil at 0–30 cm and litter in South Korean forests.
Figure 4.
Map of carbon stocks in (a) soil at 0–30 cm, (b) soil at 0–30 cm and litter in South Korean forests.


Table 1.
Mean ± standard error in the seventh National Forest Inventory (NFI7) and Forest Health Monitoring (FHM) survey data.
Table 1.
Mean ± standard error in the seventh National Forest Inventory (NFI7) and Forest Health Monitoring (FHM) survey data.
| Forest Type | ||||
|---|---|---|---|---|
| Category | Coniferous | Deciduous | Mixed | |
| NFI7 | Number of plots | 184 | 264 | 195 |
| Age | 40.26 ± 0.98 | 39.89 ± 0.87 | 40.54 ± 0.84 | |
| Height (m) | 12.94 ± 0.30 | 12.77 ± 0.19 | 13.40 ± 0.18 | |
| Diameter at breast height (cm) | 22.97 ± 0.53 | 22.43 ± 0.38 | 24.44 ± 0.34 | |
| Tree density (trees ha−1) | 1175.36 ± 50.73 | 1003.29 ± 32.63 | 1112.55 ± 42.46 | |
| Tree growing stocks (m3 ha−1) | 217.73 ± 8.46 | 145.26 ± 4.80 | 180.92 ± 6.07 | |
| FHM | Litter carbon contents (%) | |||
| Litter horizon | 44.78 ± 0.27 | 42.59 ± 0.27 | 43.89 ± 0.29 | |
| Fermentation and humus horizon | 41.22 ± 0.43 | 38.92 ± 0.41 | 40.94 ± 0.38 | |
| Soil characteristics | ||||
| Bulk density (Mg m−3) | ||||
| 0–10 cm | 1.13 ± 0.03 | 1.23 ± 0.05 | 1.27 ± 0.07 | |
| 10–20 cm | 1.15 ± 0.03 | 1.26 ± 0.04 | 1.23 ± 0.04 | |
| 20–30 cm | 1.14 ± 0.03 | 1.19 ± 0.03 | 1.18 ± 0.03 | |
| Coarse fragment contents (%) | ||||
| 0–10 cm | 33.31 ± 0.93 | 32.45 ± 0.81 | 33.47 ± 1.00 | |
| 10–20 cm | 32.65 ± 0.94 | 32.08 ± 0.80 | 32.62 ± 0.99 | |
| 20–30 cm | 32.98 ± 1.01 | 32.41 ± 0.80 | 32.57 ± 0.97 | |
| Soil organic carbon contents (%) | ||||
| 0–10 cm | 1.98 ± 0.13 | 2.53 ± 0.12 | 2.00 ± 0.11 | |
| 10–20 cm | 1.62 ± 0.10 | 2.02 ± 0.09 | 1.58 ± 0.08 | |
| 20–30 cm | 1.36 ± 0.10 | 1.70 ± 0.08 | 1.37 ± 0.07 | |
Table 2.
List of predictors using data sources of soil and litter carbon stock in South Korea.
| Predictors | Data Type | Source | Scale |
|---|---|---|---|
| Soil type | Categorical | Forest soil map | 1:25,000 |
| Soil parent | Categorical | Forest soil map | 1:25,000 |
| Rock exposure index | Categorical | Forest soil map | 1:25,000 |
| Wind exposure index | Categorical | Forest soil map | 1:25,000 |
| Weathering index | Categorical | Forest soil map | 1:25,000 |
| Forest type | Categorical | The National Forest Inventory (NFI) | 2 km or 4 km |
| Tree age (year) | Continuous | The National Forest Inventory (NFI) | 2 km or 4 km |
| Crown density (%) | Continuous | The National Forest Inventory (NFI) | 2 km or 4 km |
| Accessibility class (m) | Continuous | The National Forest Inventory (NFI) | 2 km or 4 km |
| Topography | Categorical | The National Forest Inventory (NFI) | 2 km or 4 km |
| Elevation (m) | Continuous | The National Forest Inventory (NFI) | 2 km or 4 km |
| Slope (°) | Continuous | The National Forest Inventory (NFI) | 2 km or 4 km |
| Tree density (n ha−1) | Continuous | The National Forest Inventory (NFI) | 2 km or 4 km |
| Growing stocks (m2 ha−1) | Continuous | The National Forest Inventory (NFI) | 2 km or 4 km |
| Diameter at breast height (cm) | Continuous | The National Forest Inventory (NFI) | 2 km or 4 km |
| Basal area (m2 ha−1) | Continuous | The National Forest Inventory (NFI) | 2 km or 4 km |
| Height (m) | Continuous | The National Forest Inventory (NFI) | 2 km or 4 km |
Table 3.
Litter and soil at 0–30 cm carbon stock in South Korea (unit: t C ha−1, mean ± standard error).
Table 3.
Litter and soil at 0–30 cm carbon stock in South Korea (unit: t C ha−1, mean ± standard error).
| Coniferous | Deciduous | Mixed | |
|---|---|---|---|
| Litter | |||
| Litter horizon | 2.04 ± 0.07 a | 1.56 ± 0.05 b | 1.80 ± 0.08 c |
| Fermentation and humus horizon | 2.59 ± 0.13 a | 1.72 ± 0.10 b | 2.18 ± 0.11 c |
| sub-total | 4.63 ± 0.18 a | 3.28 ± 0.13 b | 3.98 ± 0.15 c |
| Soil | |||
| 0–10 cm | 13.08 ± 0.65 a | 17.24 ± 0.64 b | 13.83 ± 0.67 a |
| 10–20 cm | 11.33 ± 0.56 a | 14.71 ± 0.55 b | 11.83 ± 0.57 a |
| 20–30 cm | 9.54 ± 0.60 a | 12.16 ± 0.50 b | 10.09 ± 0.53 a |
| sub-total | 33.96 ± 1.62 a | 44.11 ± 1.54 b | 35.75 ± 1.60 a |
| Total | 38.58 ± 1.62 a | 47.39 ± 1.53 b | 39.73 ± 1.60 a |
Different letters at each estimate indicate significant differences among forest type (p < 0.05).
Table 4.
Variable importance from training data set of the four random forest (RF) models.
| For Soil Carbon Only | For Soil and Litter Carbon | |||||||
|---|---|---|---|---|---|---|---|---|
| RF1 | RF2 | RF3 | RF4 | RF1 | RF2 | RF3 | RF4 | |
| Soil type | 7865 | 8250 | 8520 | 9581 | 7239 | 8052 | 8403 | 9353 |
| Soil parent | 3741 | 3867 | - | - | 3718 | 3670 | - | - |
| Rock exposure index | 3414 | - | - | - | 3119 | - | - | - |
| Wind exposure index | 5173 | 5492 | 5960 | - | 5778 | 548 | 6010 | - |
| Weathering index | 3900 | 3720 | - | 4028 | 3898 | - | - | |
| Forest type | 6637 | 6631 | 6459 | - | 5915 | 6343 | 6590 | - |
| Age class | 7809 | 7472 | 7698 | 7671 | 7246 | 7419 | 7735 | 8206 |
| Crown density (%) | 3432 | - | - | - | 3332 | - | - | - |
| Accessibility class (m) | 24,863 | 26,914 | 26,628 | 28,154 | 25,978 | 25,430 | 27,006 | 29,154 |
| Topography | 10,290 | 10,767 | 10,443 | 11,295 | 9845 | 10,251 | 11,048 | 11,010 |
| Elevation (m) | 43,141 | 44,420 | 45,062 | 46,613 | 41,820 | 43,291 | 42,879 | 43,366 |
| Slope (°) | 20,331 | 21,332 | 22,099 | 22,089 | 19,942 | 21,470 | 21,957 | 22,233 |
| Tree density (n ha−1) | 14,138 | 14,894 | 15,970 | 17,121 | 13,802 | 14,449 | 15,011 | 17,257 |
| Growing stocks (m2 ha−1) | 15,937 | 16,992 | 17,837 | 18,649 | 16,385 | 17,367 | 17,506 | 18,889 |
| DBH (cm) | 17,733 | 17,864 | 19,658 | 19,906 | 18,329 | 19,316 | 19,466 | 20,678 |
| Basal area (m2 ha−1) | 13,087 | 14,693 | 15,024 | 16,478 | 13,121 | 14,313 | 14,323 | 15,815 |
| Height (m) | 16,842 | 17,141 | 18,012 | 19,418 | 16,657 | 16,779 | 18,240 | 19,387 |
Table 5.
Root mean square error (RMSE) and mean absolute error (MAE)of the four random forest (RF) models using the validation data (unit: t C ha−1).
Table 5.
Root mean square error (RMSE) and mean absolute error (MAE)of the four random forest (RF) models using the validation data (unit: t C ha−1).
| Predicted Soil Carbon | Predicted Soil and Litter Carbon | |||||||
|---|---|---|---|---|---|---|---|---|
| RF1 | RF2 | RF3 | RF4 | RF1 | RF2 | RF3 | RF4 | |
| RMSE | 1.82 | 1.67 | 1.65 | 1.63 | 1.56 | 1.49 | 1.54 | 1.39 |
| MAE | 15.90 | 15.85 | 15.80 | 16.00 | 16.11 | 15.99 | 15.93 | 16.25 |
Publisher’s Note: MDPI stays neutral with regard to jurisdictional claims in published maps and institutional affiliations. |
© 2020 by the authors. Licensee MDPI, Basel, Switzerland. This article is an open access article distributed under the terms and conditions of the Creative Commons Attribution (CC BY) license (http://creativecommons.org/licenses/by/4.0/).
Share and Cite
MDPI and ACS Style
Lee, S.; Lee, S.; Shin, J.; Yim, J.; Kang, J. Assessing the Carbon Storage of Soil and Litter from National Forest Inventory Data in South Korea. Forests 2020, 11, 1318. https://0-doi-org.brum.beds.ac.uk/10.3390/f11121318
AMA Style
Lee S, Lee S, Shin J, Yim J, Kang J. Assessing the Carbon Storage of Soil and Litter from National Forest Inventory Data in South Korea. Forests. 2020; 11(12):1318. https://0-doi-org.brum.beds.ac.uk/10.3390/f11121318
Chicago/Turabian StyleLee, Sunjeoung, Seunghyun Lee, Joonghoon Shin, Jongsu Yim, and Jinteak Kang. 2020. "Assessing the Carbon Storage of Soil and Litter from National Forest Inventory Data in South Korea" Forests 11, no. 12: 1318. https://0-doi-org.brum.beds.ac.uk/10.3390/f11121318
Note that from the first issue of 2016, this journal uses article numbers instead of page numbers. See further details here.