Article

Dynamic Changes in Plant Resource Use Efficiencies and Their Primary Influence Mechanisms in a Typical Desert Shrub Community

1
School of Soil and Water Conservation, Beijing Forestry University, Beijing 100083, China
2
Beijing Engineering Research Center of Soil and Water Conservation, Beijing Forestry University, Beijing 100083, China
3
Faculty of Forestry and Environmental Management, 28 Dineen Drive, University of New Brunswick, Fredericton, NB E3B 5A3, Canada
*
Author to whom correspondence should be addressed.
Submission received: 31 August 2021 / Revised: 26 September 2021 / Accepted: 5 October 2021 / Published: 9 October 2021

Abstract

:
Understanding plant resource use efficiencies (RUEs) and their tradeoffs in a desert shrub community, particularly as it concerns the usage of water, light, and nitrogen, remains an ecological imperative. Plant RUEs have been widely used as indicators to understand plant acclimation processes to unfavorable environmental conditions. This study aimed to examine seasonal dynamics in RUEs in two widely distributed plant species in a typical desert shrub community (i.e., Artemisia ordosica and Leymus secalinus) based on in-situ measurements of leaf photosynthesis, specific leaf area (SLA), leaf nitrogen concentration (i.e., Nmass + Narea), and several site-related abiotic factors. Both species exhibited significant seasonal variation in RUEs, with a coefficient of variation (CV) >30% and seasonal divergence among the various RUEs. Seasonal divergence was largely controlled by variation in stomatal conductance (Gs), which was in turn influenced by variation in soil water content (SWC) and water vapor pressure deficit (VPD). RUEs between species converged, being positively correlated, yielding: (i) r2 = 0.40 and p < 0.01 for WUE; (ii) r2 = 0.18 and p < 0.01 for LUE; and (iii) r2 = 0.25 and p < 0.01 for NUE. RUEs for A. ordosica were mostly larger than those for L. secalinus, but less reactive to drought. This suggests A. ordosica was more conservative in its usage of available resources and was, therefore, better able to adapt to arid conditions. Resource use strategies between species differed in response to drought. Desert shrubs are projected to eventually replace grasses, as drought severity and duration increase with sustained regional climate change.

1. Introduction

Drylands (arid and semiarid areas) cover 39% of the earth’s land surface and are home to about 20% of the world’s human population [1]. Ecosystems in drylands are highly vulnerable to global environmental change and desertification [2]. Given the speed and intensity of climate change and socioeconomic development that risk aggravating environmental and socioeconomic problems on various spatial scales (e.g., land degradation, poverty, declining food and water security), research on both social and ecological system processes, as well as their interactions, is urgently needed [3,4]. Recent studies highlighting the importance of semiarid ecosystems in their contribution to terrestrial net primary production are also key to forming meaningful sustainable development goals (SDGs) for drylands [1,4,5,6].
Plants in drylands generally experience more environmental stress, especially as severity and duration of droughts continue to increase under a warming climatic regime [7,8,9]. Consequently, it is expected that there will be changes in the supply of available plant resources, such as water (W), light (L), and nitrogen (N) for photosynthetic assimilation, as well as for the maintenance of functional plant structures. This may lead to changes in plant resource use efficiencies (i.e., RUEs, or individually through WUE, LUE, and NUE). Plant RUE (and its components) is defined as the ratio of photosynthetic assimilation to the consumption and subsequent usage of resources [10,11]. Photosynthesis is generally limited by W, L, and N, although other abiotic factors, such as temperature (T), can also play a crucial part, particularly at seasonal timescales [12]. The survival and growth of plants could be influenced by RUEs, which could ultimately cause fluctuations in ecological functioning. Plant RUEs have been widely used to understand plant acclimation processes to unfavorable environmental conditions expected to accompany climate change and associated extreme weather events.
Plant resources may change in unison. Changes in one resource will likely induce changes in other resource uses at the leaf, species, and community level, conditional on the temporal scale [13]. Changes in the availability of one resource may result in changes, not only in the use efficiency of that resource, but also in the use efficiencies of other resources [10,14]. For instance, water supply increases NUE, but decreases WUE, whereas the addition of N slightly increases WUE at the expense of NUE at the leaf level. This suggests that the shift in the availability of one resource could engender disproportionate constraints on the use efficiencies of other plant resources [15]. Large transpiration rates and high solar irradiation proceed to maximize instantaneous photosynthesis, which correlates positively with NUE and negatively with both WUE and LUE [16]. Consequently, the individual response in WUE, LUE, and NUE to changes in environmental conditions are not self-governing. Therefore, plants may exhibit divergent tradeoffs between the various RUEs during acclimatization to prevailing site conditions. To better model plant responses to climate change in arid and semiarid areas, relative changes (tradeoffs) among WUE, LUE, and NUE and their causes need to be quantified.
RUEs and their response to environmental change have received considerable interest (e.g., [17,18,19,20]). Changing environmental factors constrain the variation in plant RUEs, as the factors influence the supply and demand of resources [20,21]. RUEs integrated over monthly timescales (i.e., RUEm) vary seasonally in response to variation in resource availability and weather conditions [16]. Crops and native vegetation that are adapted to water-limited conditions, achieve adaptation mainly by dehydration avoidance and escape, rather than having an innate ability to function in a dehydrated state or be desiccation tolerant [22]. Fischer and Maurer have shown that agricultural cultivars yield biomass under drought as a function of yield potential (yield without drought), drought susceptibility index, and severity of drought [23]. Improved WUE is usually expressed in an improved yield under water-limited conditions, only when there is a need to balance crop water use against a limited and known soil water supply [22]. Plant breeders and physiologists have long been concerned with drought resistance in plants. Just how dryland plants adjust their RUEs to resist drought remains uncertain.
Species is by far the most influential factor explaining the variance in leaf photosynthetic assimilation [24]. RUEs, key plant function, acclimate to environmental fluctuations through coordination and tradeoffs among plant morphological, physiological, and biochemical traits in achieving optimal resource usage and adaptation to prevailing environmental conditions [18,25]. Plant production in water-limited environments is very often affected by constitutive plant traits that allow maintenance of a high plant water status [22]. Owing to the likely diversity of factors and factor interactions to RUEs, dynamic changes in RUEs and their primary influence pathways or mechanisms are not entirely understood, and thus further studies are needed, especially for dryland ecosystems.
Plant ecosystem health in arid and semiarid areas is rapidly deteriorating as water shortages become more frequent [26]. Responses of plant communities to environmental change are typically regulated by the dominant species in the community [27,28]. It has been reported that the neighborhood of a tree can have a significant impact on functional traits involved in resource use [29]. Shrub-dominated plant communities in drylands of northwest China are commonly associated with the presence of Artemisia ordosica Krasch. (shrub) and Leymus secalinus (Georgi) Tzvel. (desert grass) [19]. These communities are widespread throughout the semiarid regions of the Mu Us Desert [30]. Their sustainability and presence, however, are being greatly affected by severe limitations in available soil water emergent in many parts of the desert complex [26,31].
This study aims to understand the characteristics and influence mechanisms and pathways responsible for the observed variation in RUEs in both A. ordosica and L. secalinus in response to dry conditions. The specific objectives of the study are to: (i) examine seasonal dynamics in the individual components of RUEs (i.e., WUE, LUE, and NUE); (ii) determine whether a level of convergence exists in RUEs between the two plant species; and (iii) clarify the role of environmental factors in the control of seasonal dynamics in RUEs. The study will have important implications for clarifying the acclimatization capacity of dryland shrub-grass associations and understanding how drylands respond to ongoing environmental change. It is a key theme of SDGs of drylands, regarding their social-ecological system dynamics and drivers [4,32]. The study has the potential to deliver both novel scientific insights and development impact consistent with the aspirations of United Nations’ SDGs for 2030.

2. Methods

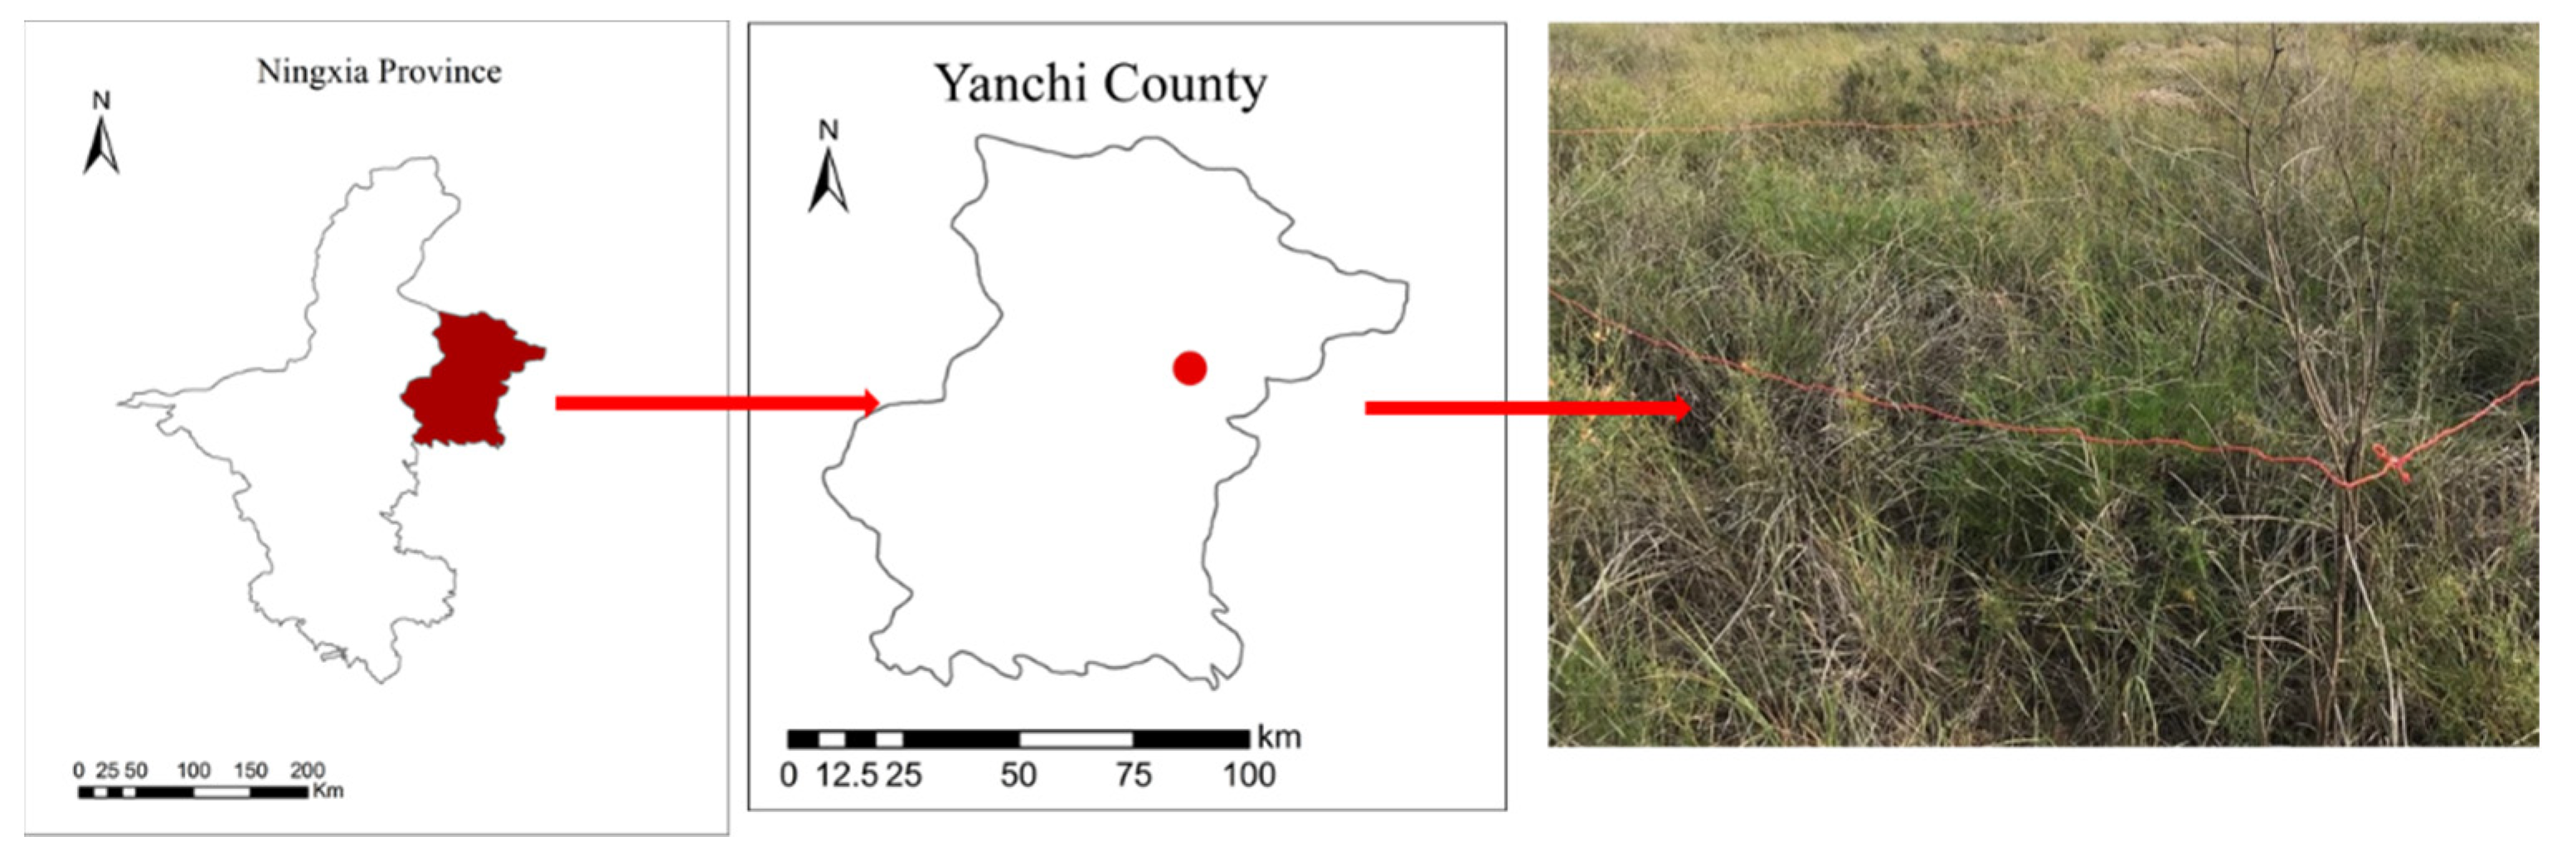
2.1. Site Description

The study site is located at the Yanchi Research Station of Beijing Forest University (37°42′31″ N, 107°13′47″ E, 1530 m above mean sea level), Ningxia, northwest China (Figure 1). The site is representative of a transitional zone between arid and semiarid conditions at the southern edge of the Mu Us Desert. The prevailing regional climate is temperate arid and semiarid, characterized with scarce rainfall, irregularly distributed, and variable from year to year. The mean annual temperature (based on 1954–2020 data) is 8.4 °C, and the mean annual precipitation is 293 mm. Most precipitation (>70%) occurs during June–September (data source: Yanchi Meteorological Station, Yanchi Research Station).
The soil at the site involves sand, with a bulk density of 1.54 ± 0.08 g cm−3, a total porosity of 35.70 ± 3.83%, a field capacity of 20.31 ± 3.33% (g g−1 × 100), and a permanent wilting point of 3.64 ± 0.37% in the upper 10 cm of the soil profile (g g−1 × 100; mean ± standard deviation, n = 16). The landscape of this region is a typical inland dune ecosystem with very distinct habitat types [33]. The shrub cover at the site consists mostly of A. ordosica, and smaller amounts of Hedysarum mongolicum Turez.and Salix psammophila C. The most abundant herbaceous species include L. secalinus, Stipa glareosa P. Smirn., Pennisetum centrasiaticum Tzvel., and Setaria viridis (L.) Beauv. The main canopy of the community is about 1 to 1.5 m tall. Shrub roots are distributed mainly in the upper 10–50 cm of the soil.

2.2. Photosynthesis Gas-Exchange Measurements

The measurements were taken from plants enclosed within three 5 × 5 m2 plots. Three individuals of both A. ordosica and L. secalinus were randomly selected in each plot (n = 9) assigned for in situ measurements [26,34,35]. Photosynthesis was measured on fully developed leaves on the south-facing side of each assigned plant individuals, every 10 days from May to September 2019. The measurements were taken with a portable LI-6400 photosynthesis system, equipped with 2×3 cm2 transparent light source chamber (Li-Cor Inc., Lincoln, NE, USA). Five measurements were taken from each individual plant, during each measurement period. All leaf gas-exchange characteristics were measured six times every ~2-h from 8:00–18:00 Local Beijing Time (Greenwich Mean Time + 8 h). Rates of photosynthesis and transpiration (Pn and E, in μmol m−2 s−1 and mmol m−2 s−1, respectively) and stomatal conductance (Gs, mol m2 s−1) were measured, which were expressed per unit leaf area. The leaf area of fresh leaves was measured at the same time using an LI-3100C leaf area meter (LI-COR Environmental, Lincoln, NE, USA).

2.3. Measurement of Biotic Factors

Two samples of 10 leaves were collected immediately after each gas-exchange measurement on nearby plants with similar characteristics to the target plants, for both leaf area measurement and N content. After each leaf area measurement, fresh weight of sampled foliage was measured with an electronic balance. The fresh leaves were then oven-dried at 75 °C for 48-h for dry weight determination. The specific leaf area (SLA, cm2 g−1) was then calculated as the ratio of fresh leaf area to dry weight. The leaf N concentration was determined both on a dry weight and leaf area basis (i.e., Nmass and Narea, g kg−1 and g m−2, respectively) using the Kjeldahl method [10].

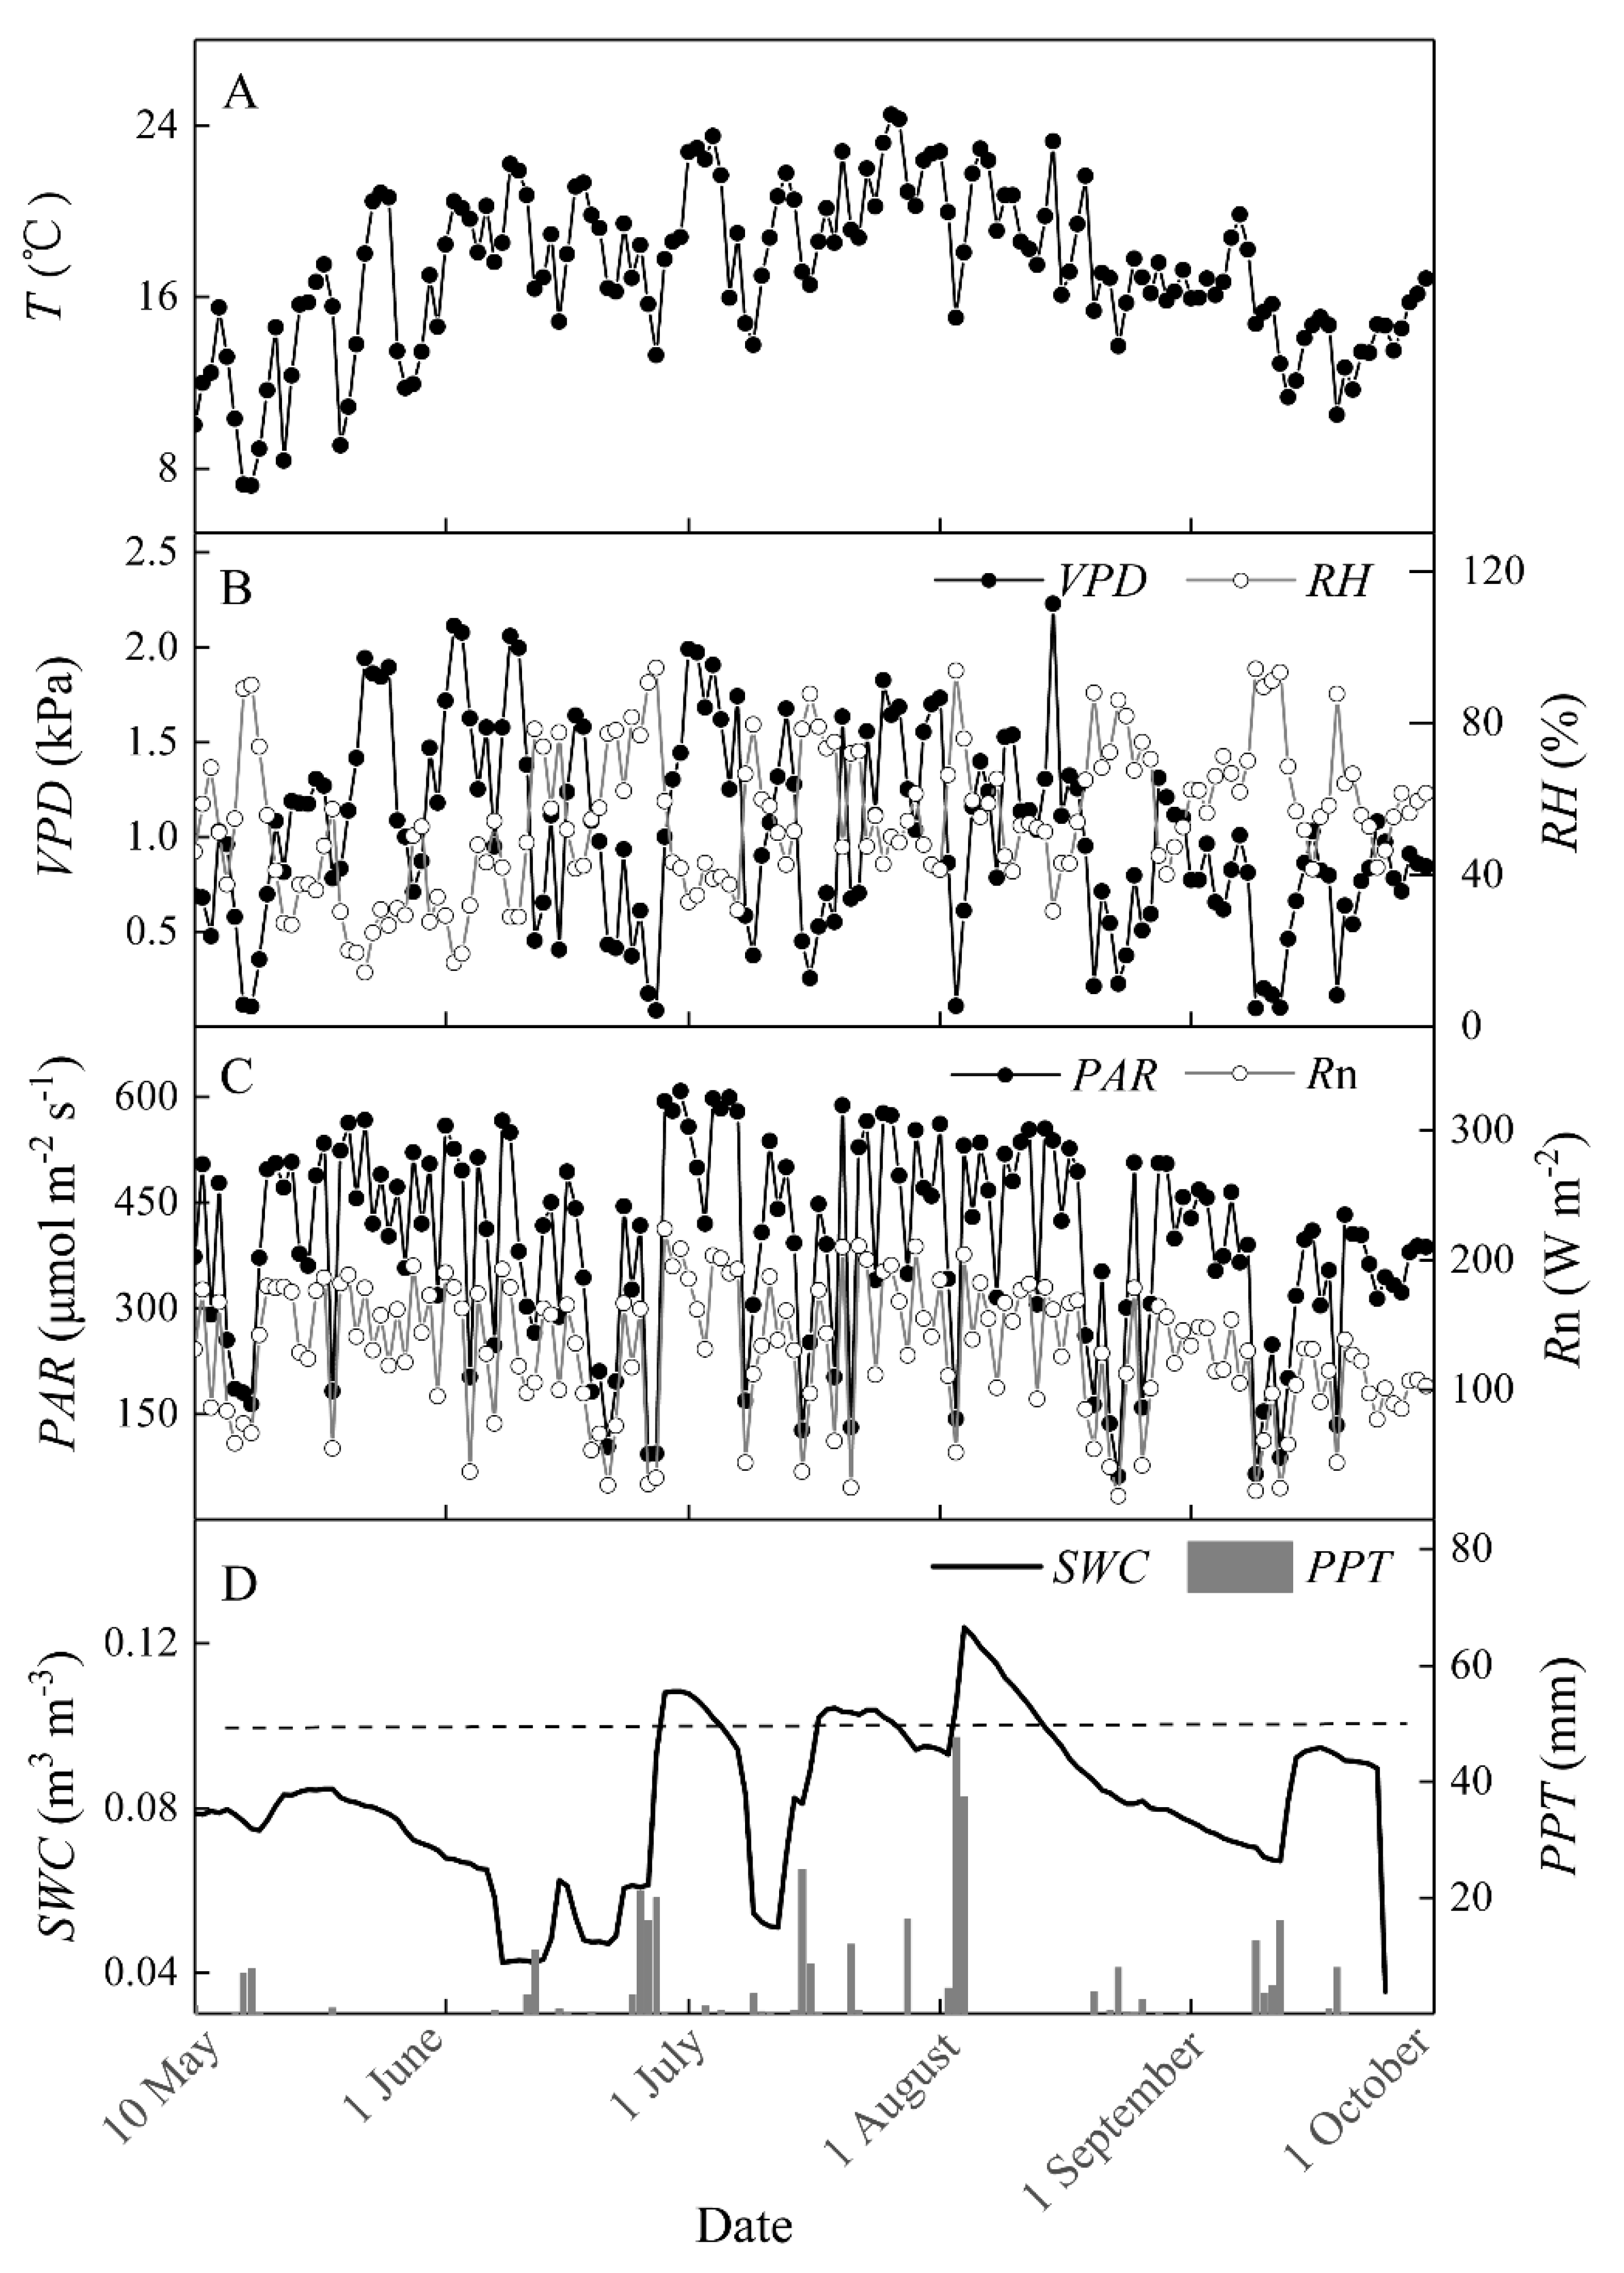
2.4. Measurement of Abiotic Factors

All meteorological variables were measured with sensors installed on 6-m tall eddy-covariance tower, assembled next to the sampling area. Tower-based measurements included: (i) air temperature (T, °C) and relative humidity (RH, %) taken with a thermohygrometer (HMP155A, Vaisala, Finland); (ii) net radiation (Rn, W m−2) with a CNR-4 sensor (Kipp & Zonen, The Netherlands); and (iii) incident photosynthetically active radiation (PAR, μmol m−2 s−1) with a quantum sensor (PAR-LITE, Kipp & Zonen, The Netherlands). Half-hourly soil water content (SWC, m3 m−3) was monitored at a 30-cm depth within a 10-m radius around the tower, with three replicate sensors (ECH2O-5TE, Decagon Devices, Pullman, WA, USA). Rainfall (PPT, mm) was measured using a tipping bucket raingauge (TE525WS, Campbell Scientific Inc., Logan, UT, USA) set in an opening approximately 50 m from the tower. Vapor pressure deficit (VPD, kPa) was calculated from tower-based measurements of RH and T.

2.5. Data Processing and Analysis

Water, light, and nitrogen use efficiencies (i.e., WUE in μmol mmol−1, LUE in mol mol1, and NUE in μmol g−1 s−1, respectively) were calculated individually with the Equations (1)–(3):
W U E = P n E
L U E = P n P A R
N U E = P n N area
where Pn is the net photosynthesis, E the transpiration, PAR the leaf surface photosynthetically active radiation, and Narea the amount of N per unit leaf area. Monthly water, light, and nitrogen use efficiencies were subsequently calculated as averages of daily WUE, LUE, and NUE. Major terms and their acronyms appear in Table A1.

2.6. Statistical Analysis

The coefficient of variation (CV) was used to quantify the seasonal variation in RUEs (i.e., WUE, LUE, and NUE) and biotic factors. To analyze relationships among WUE, LUE, and NUE for a given species and to determine whether a level of convergence exists in RUEs between the two plant species, a standard major axis (SMA) operation was performed using sma, a procedure available in the smatr R-package. Paired student t-tests were performed in pairwise comparisons of WUE, LUE, and NUE for A. ordosica and L. secalinus. To clarify the role of factors in the control of seasonal dynamics in RUEs, stepwise regression was used to find the most critical biophysical factors responsible for controlling RUEs. In addition, structural equation models (SEM) were used to assess the direct and indirect contributions of biotic and abiotic factors to variations in RUEs. The significance level was set at p = 0.05.
Drought days in 2019 were defined as those days with daily mean SWC < 0.1 m3 m−3 [9,26,36]. The average dates for the onset and end of the growing season were set at early May and end of September. Spring, summer, and autumn were defined as occurring in May, June–August, and September, respectively. All statistical analyses were performed in R-Studio ver. 3.6.3 (The R Development Core Team) and Origin2017 (OriginLab, Northampton, MA, USA).

3. Results

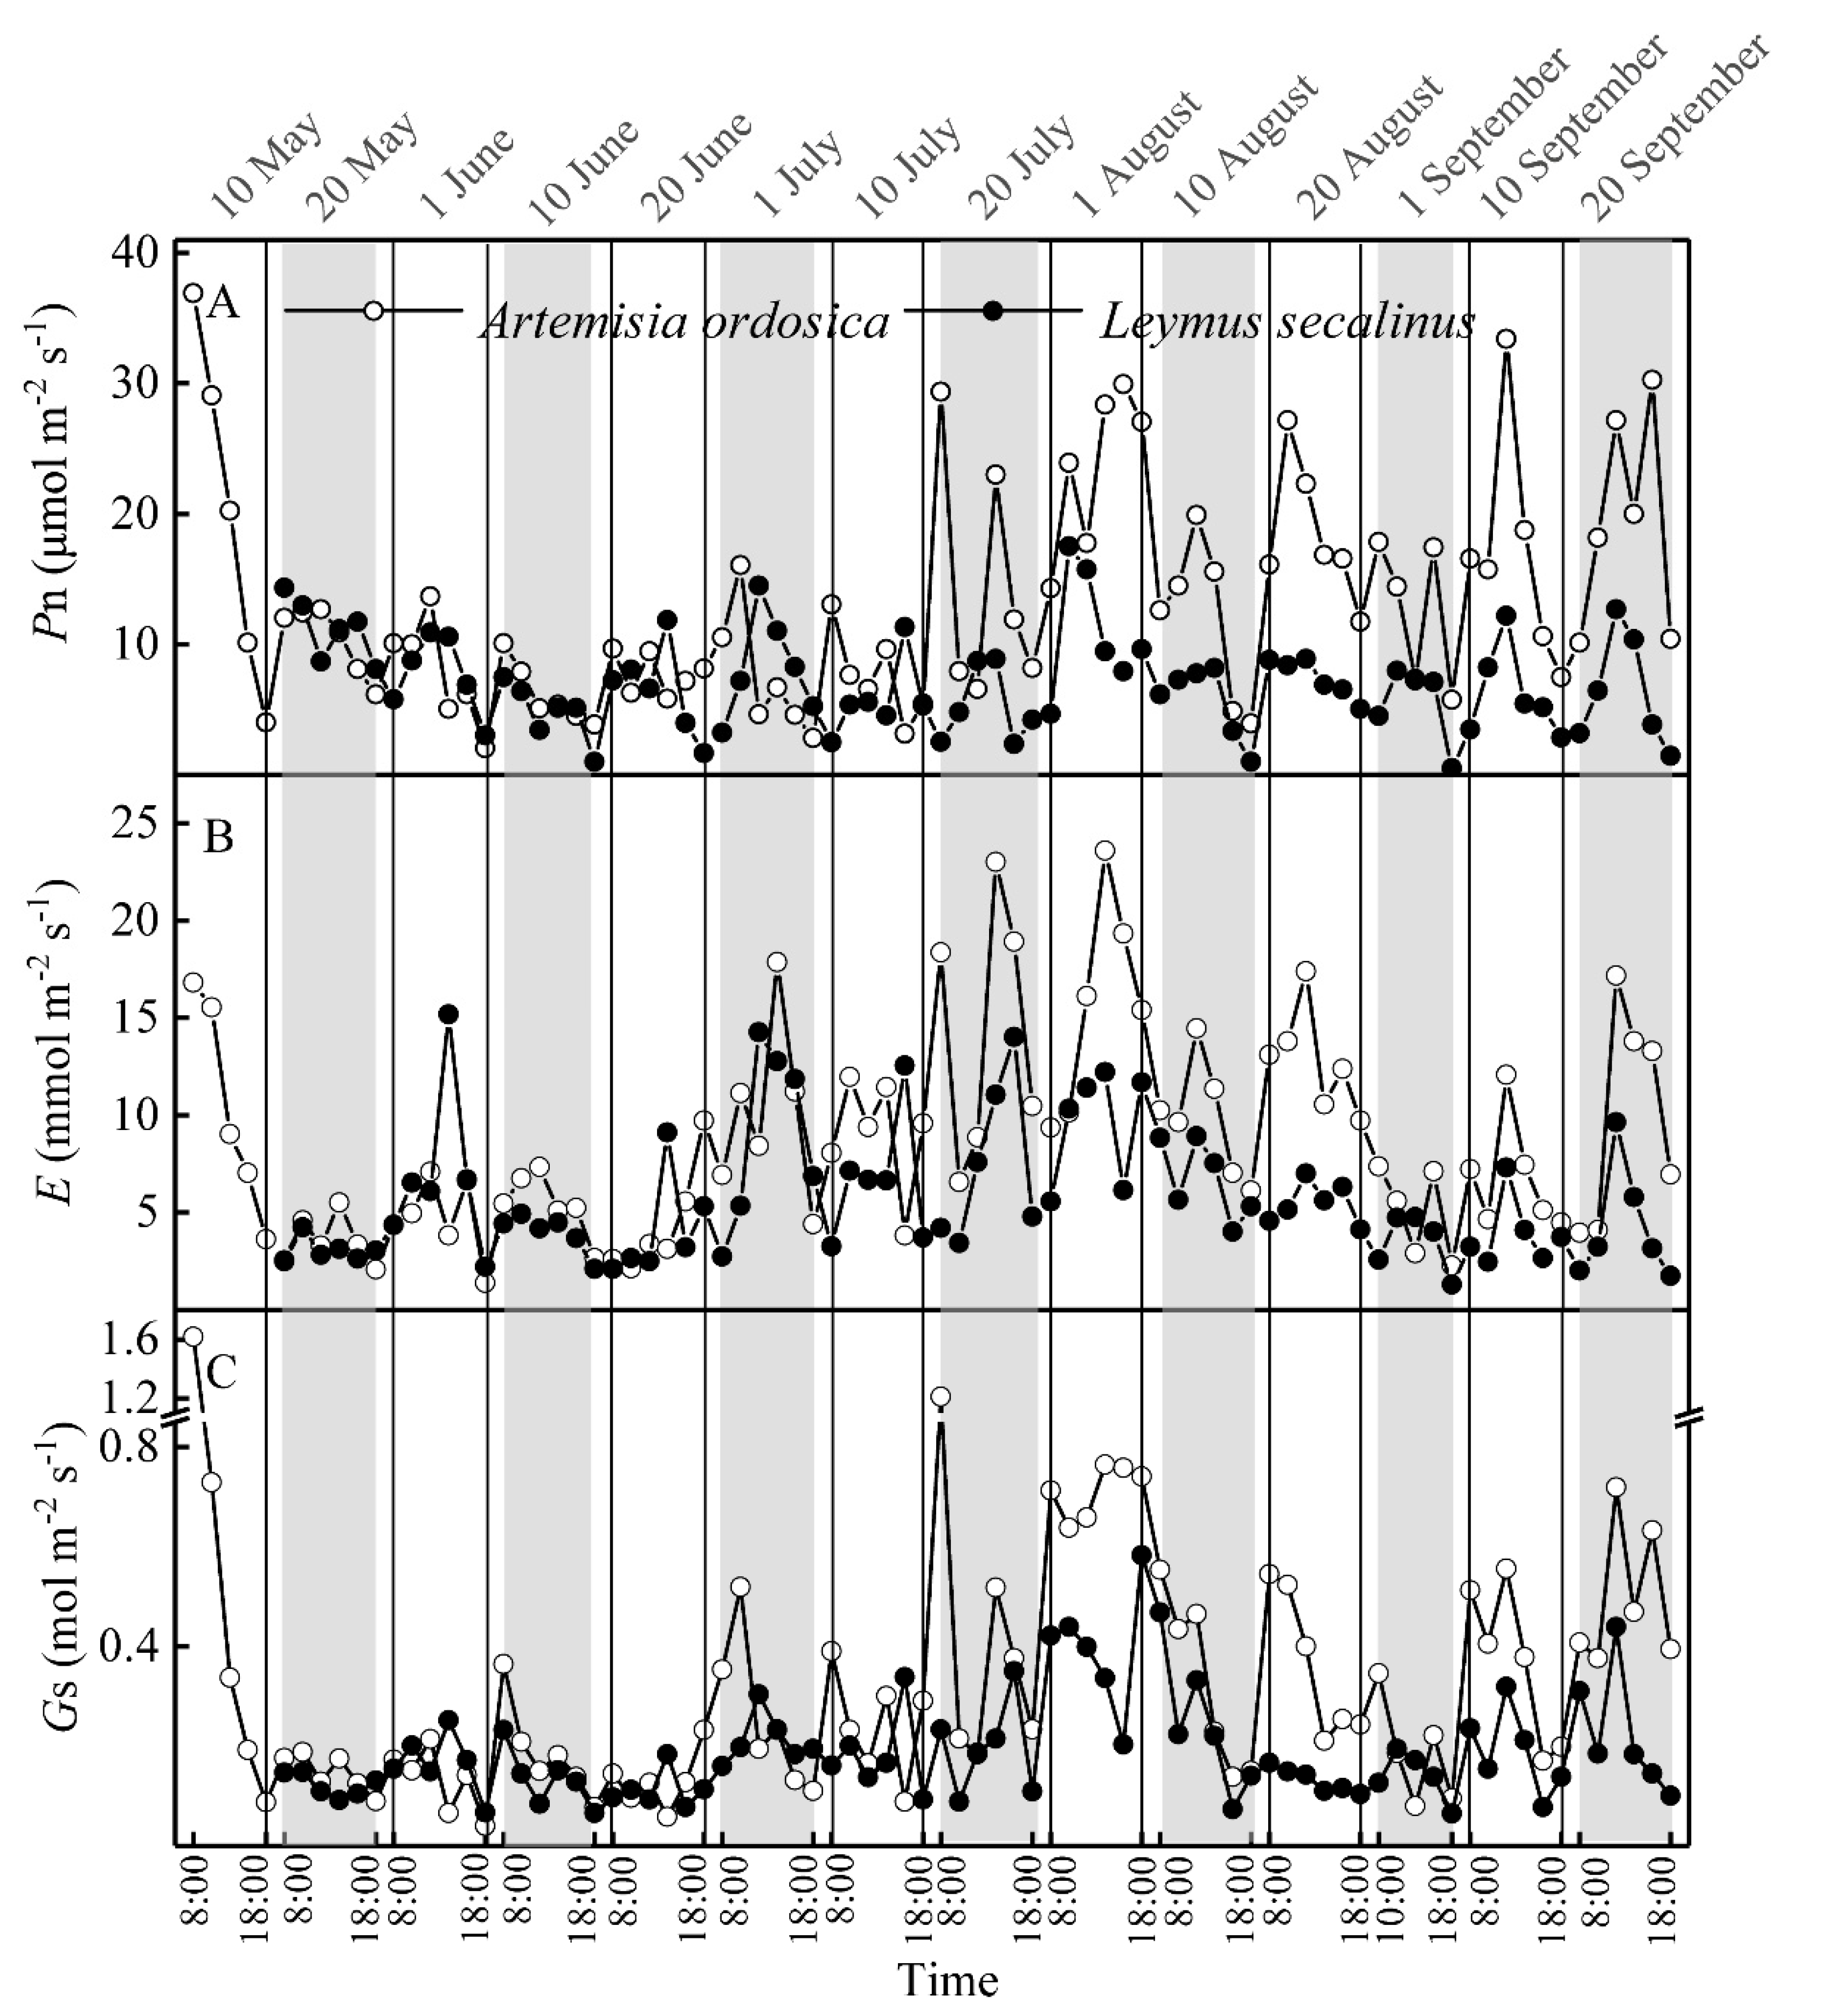
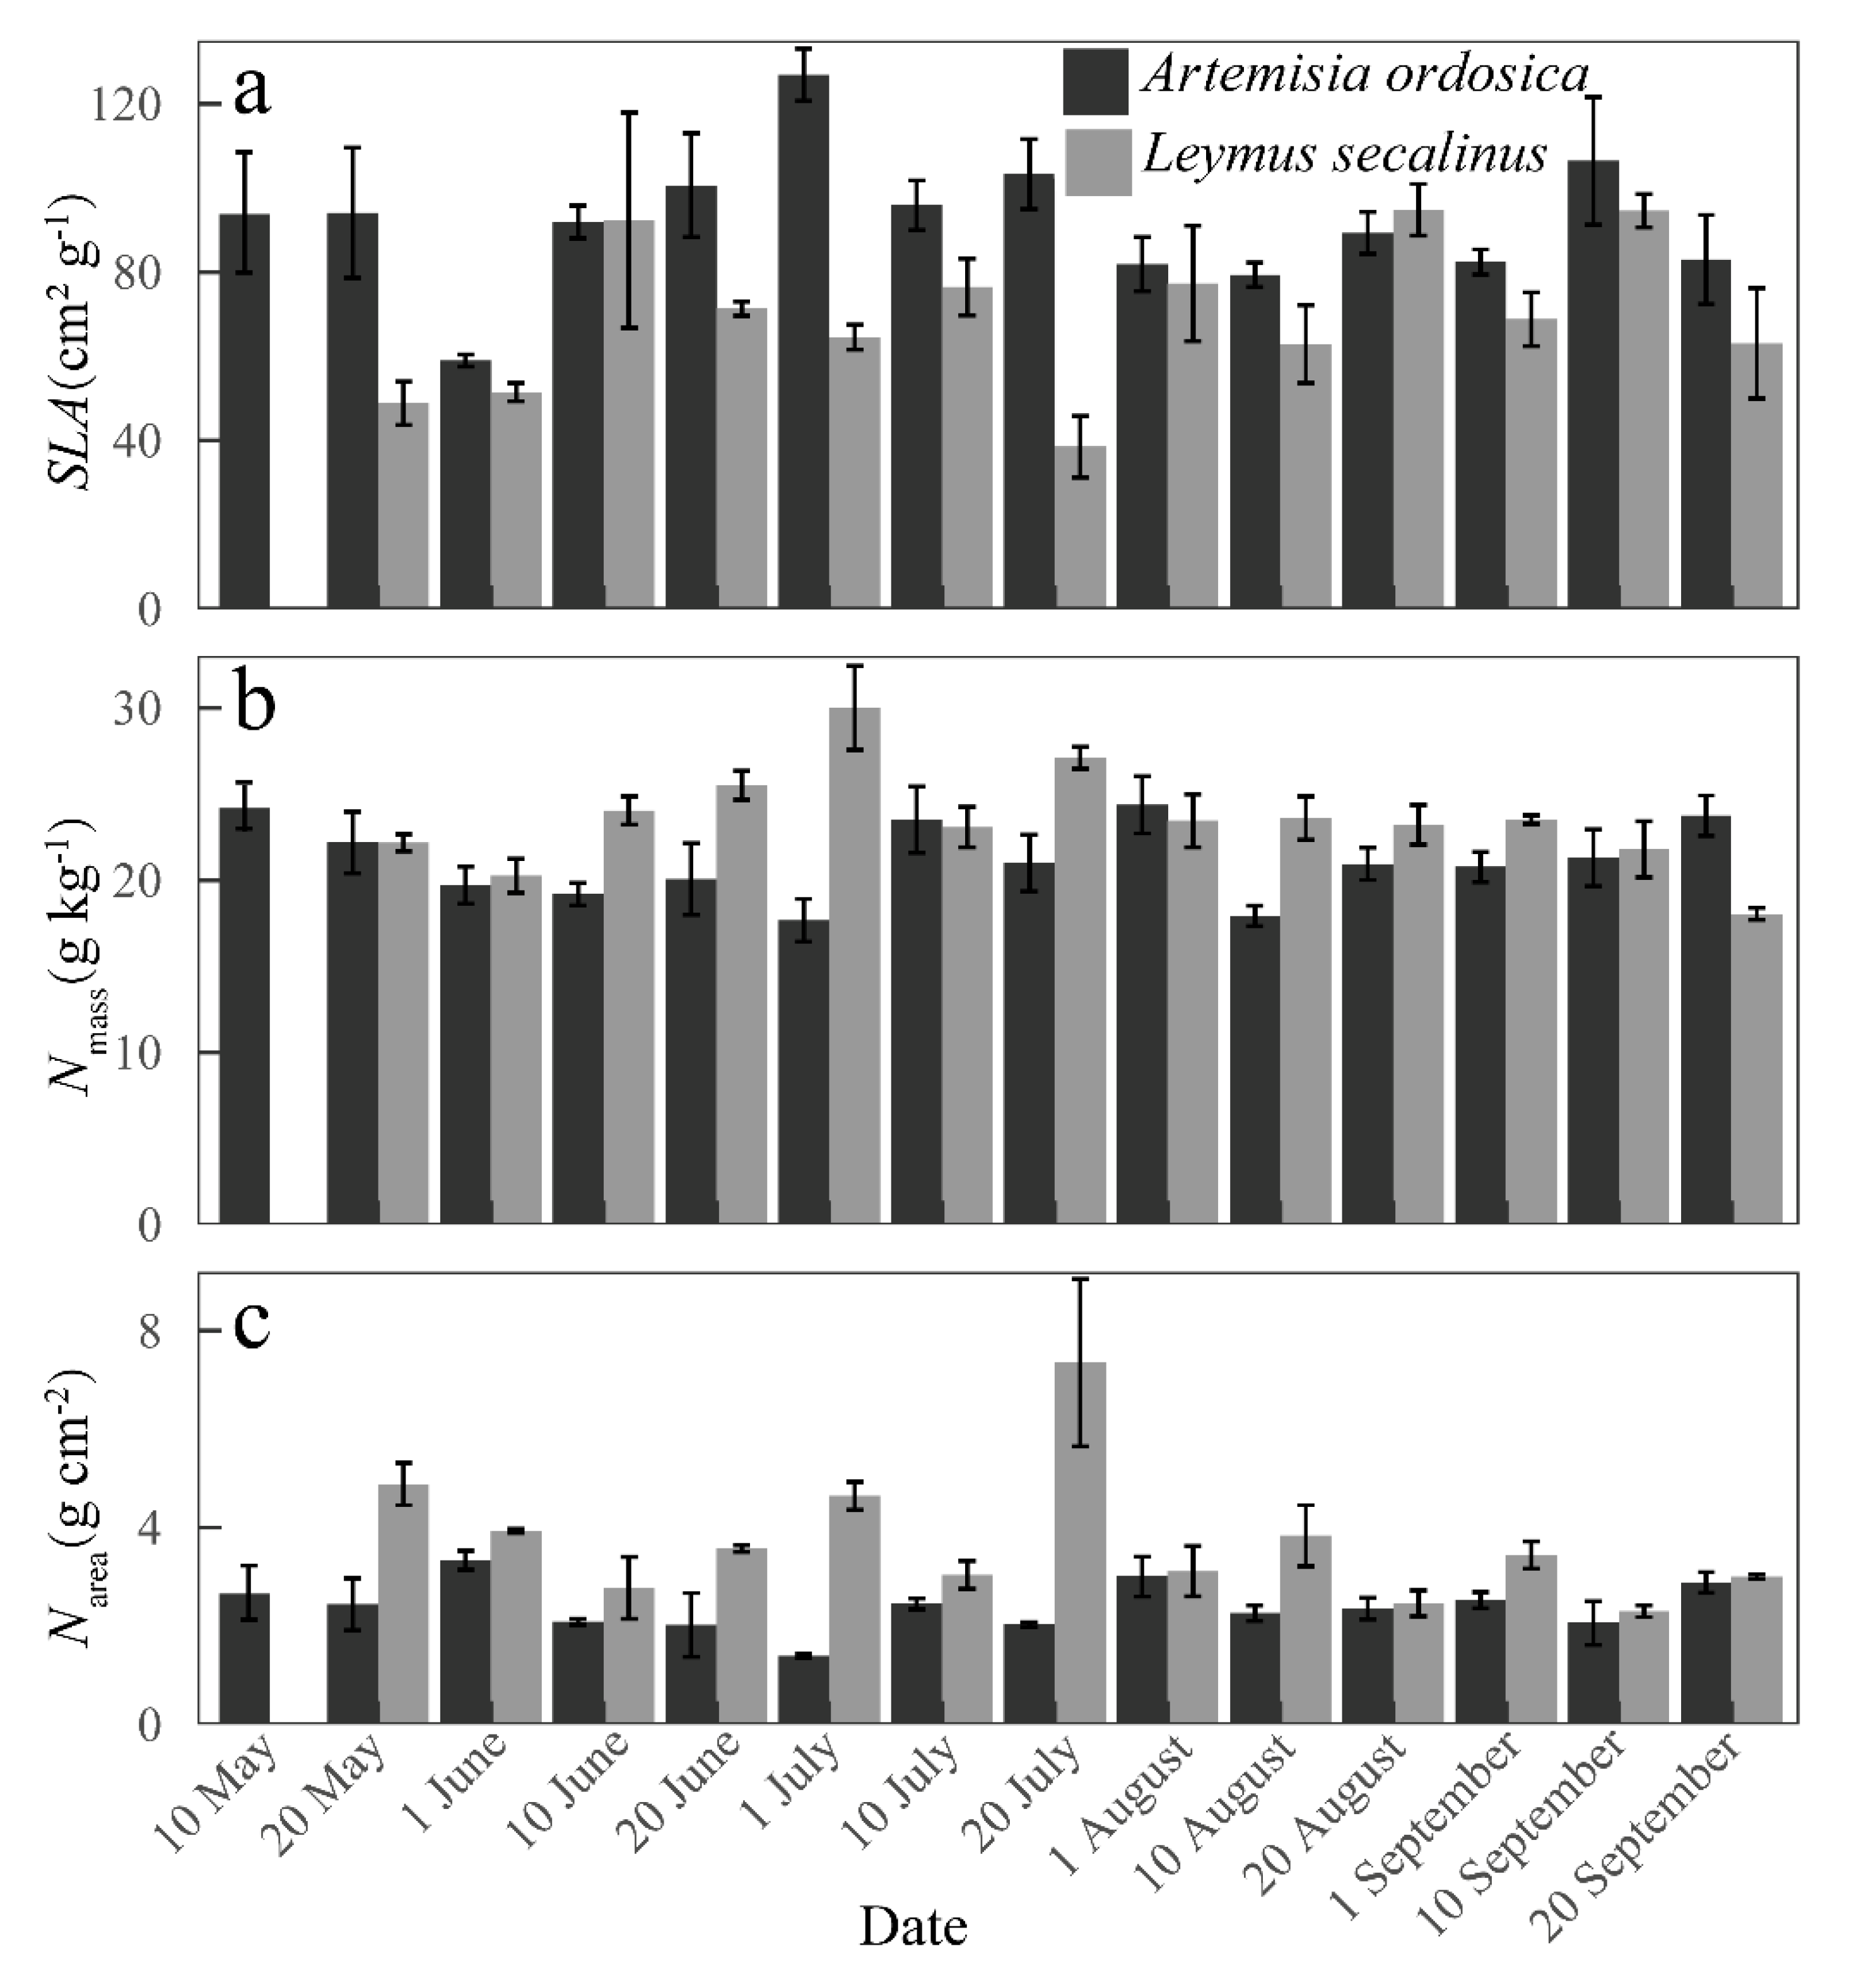
3.1. Variations in Biophysical Factors and Photosynthetic Parameters

Seasonal patterns in PAR and Rn were similar (Figure 2C). The range of daily means for PAR, Rn, VPD, T, and SWC during the growing season were 61.32–608.51 μmol m−2 s−1, 18.07–223.96 W m−2, 0.08–2.23 kPa, 7.20–24.51 °C, and 0.04–0.12 m3 m−3, respectively (Figure 2). Peaks in SWC corresponded with intermittent rain pulses. Low SWC occurred during non-rainy days (Figure 2D). Drought was observed whenever SWC < 0.10 m3 m3 (Figure 2D).
The two plant species had near-similar diurnal and seasonal tracking of Pn, E, and Gs (Figure 3). During the growing season, Pn, E, and Gs ranged from 6.12–23.55 μmol m−2 s−1, 0.13–0.71 mmol m−2 s−1, and 3.56–15.66 mol m2 s1, respectively, for A. ordosica, and 4.75–11.16 μmol m−2 s−1, 0.11–0.40 mmol m−2 s−1, and 3.06–9.55 mol m2 s1 for L. secalinus (Figure 3A–C). Values of photosynthetic parameters for A. ordosica were generally greater than those for L. secalinus. Plant parameters of SLA, Nmass, and Narea for A. ordosica varied less than those of L. secalinus over the same period, with CV of 16, 10, and 20% for A. ordosica, and 24, 12, and 34% for L. secalinus (Figure 4). Leaf N concentrations (with respect to both Nmass and Narea) were lower for A. ordosica than those for L. secalinus (Figure 4b,c). SLA exhibited an opposite trend (Figure 4a), ranging between 59.01–126.88 and 38.54–94.82 cm g−1 for A. ordosica and L. secalinus, respectively.

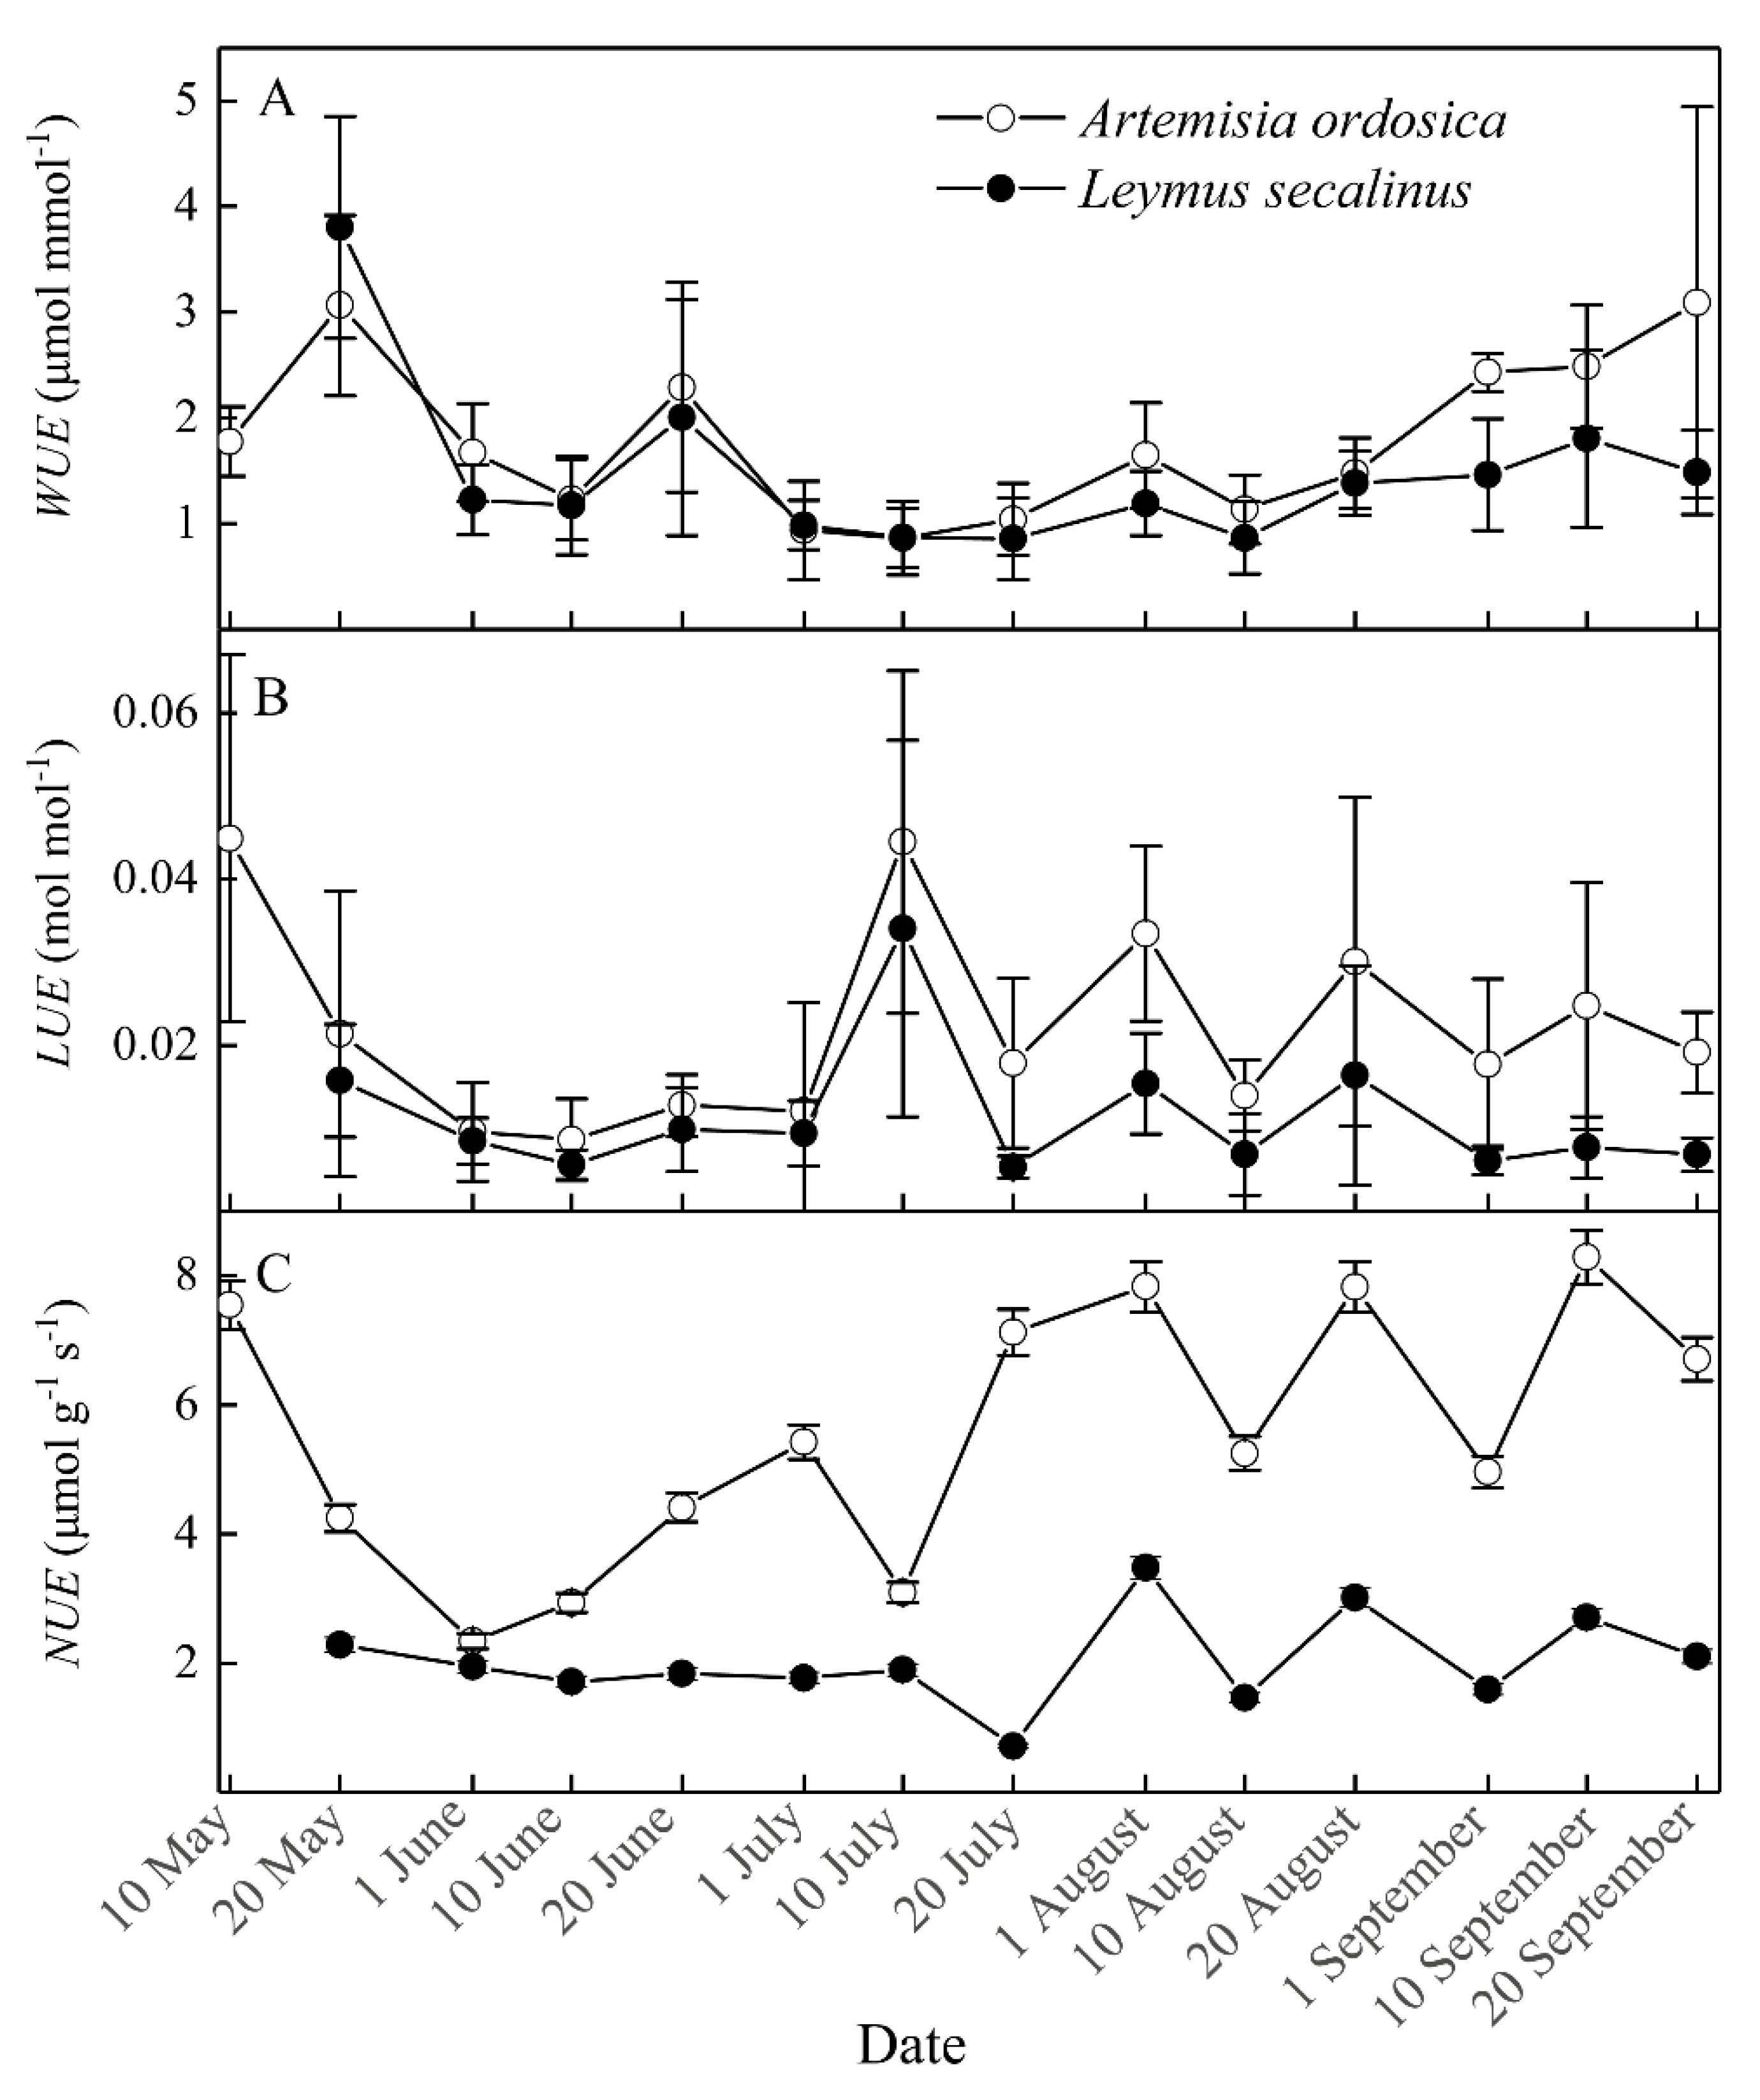
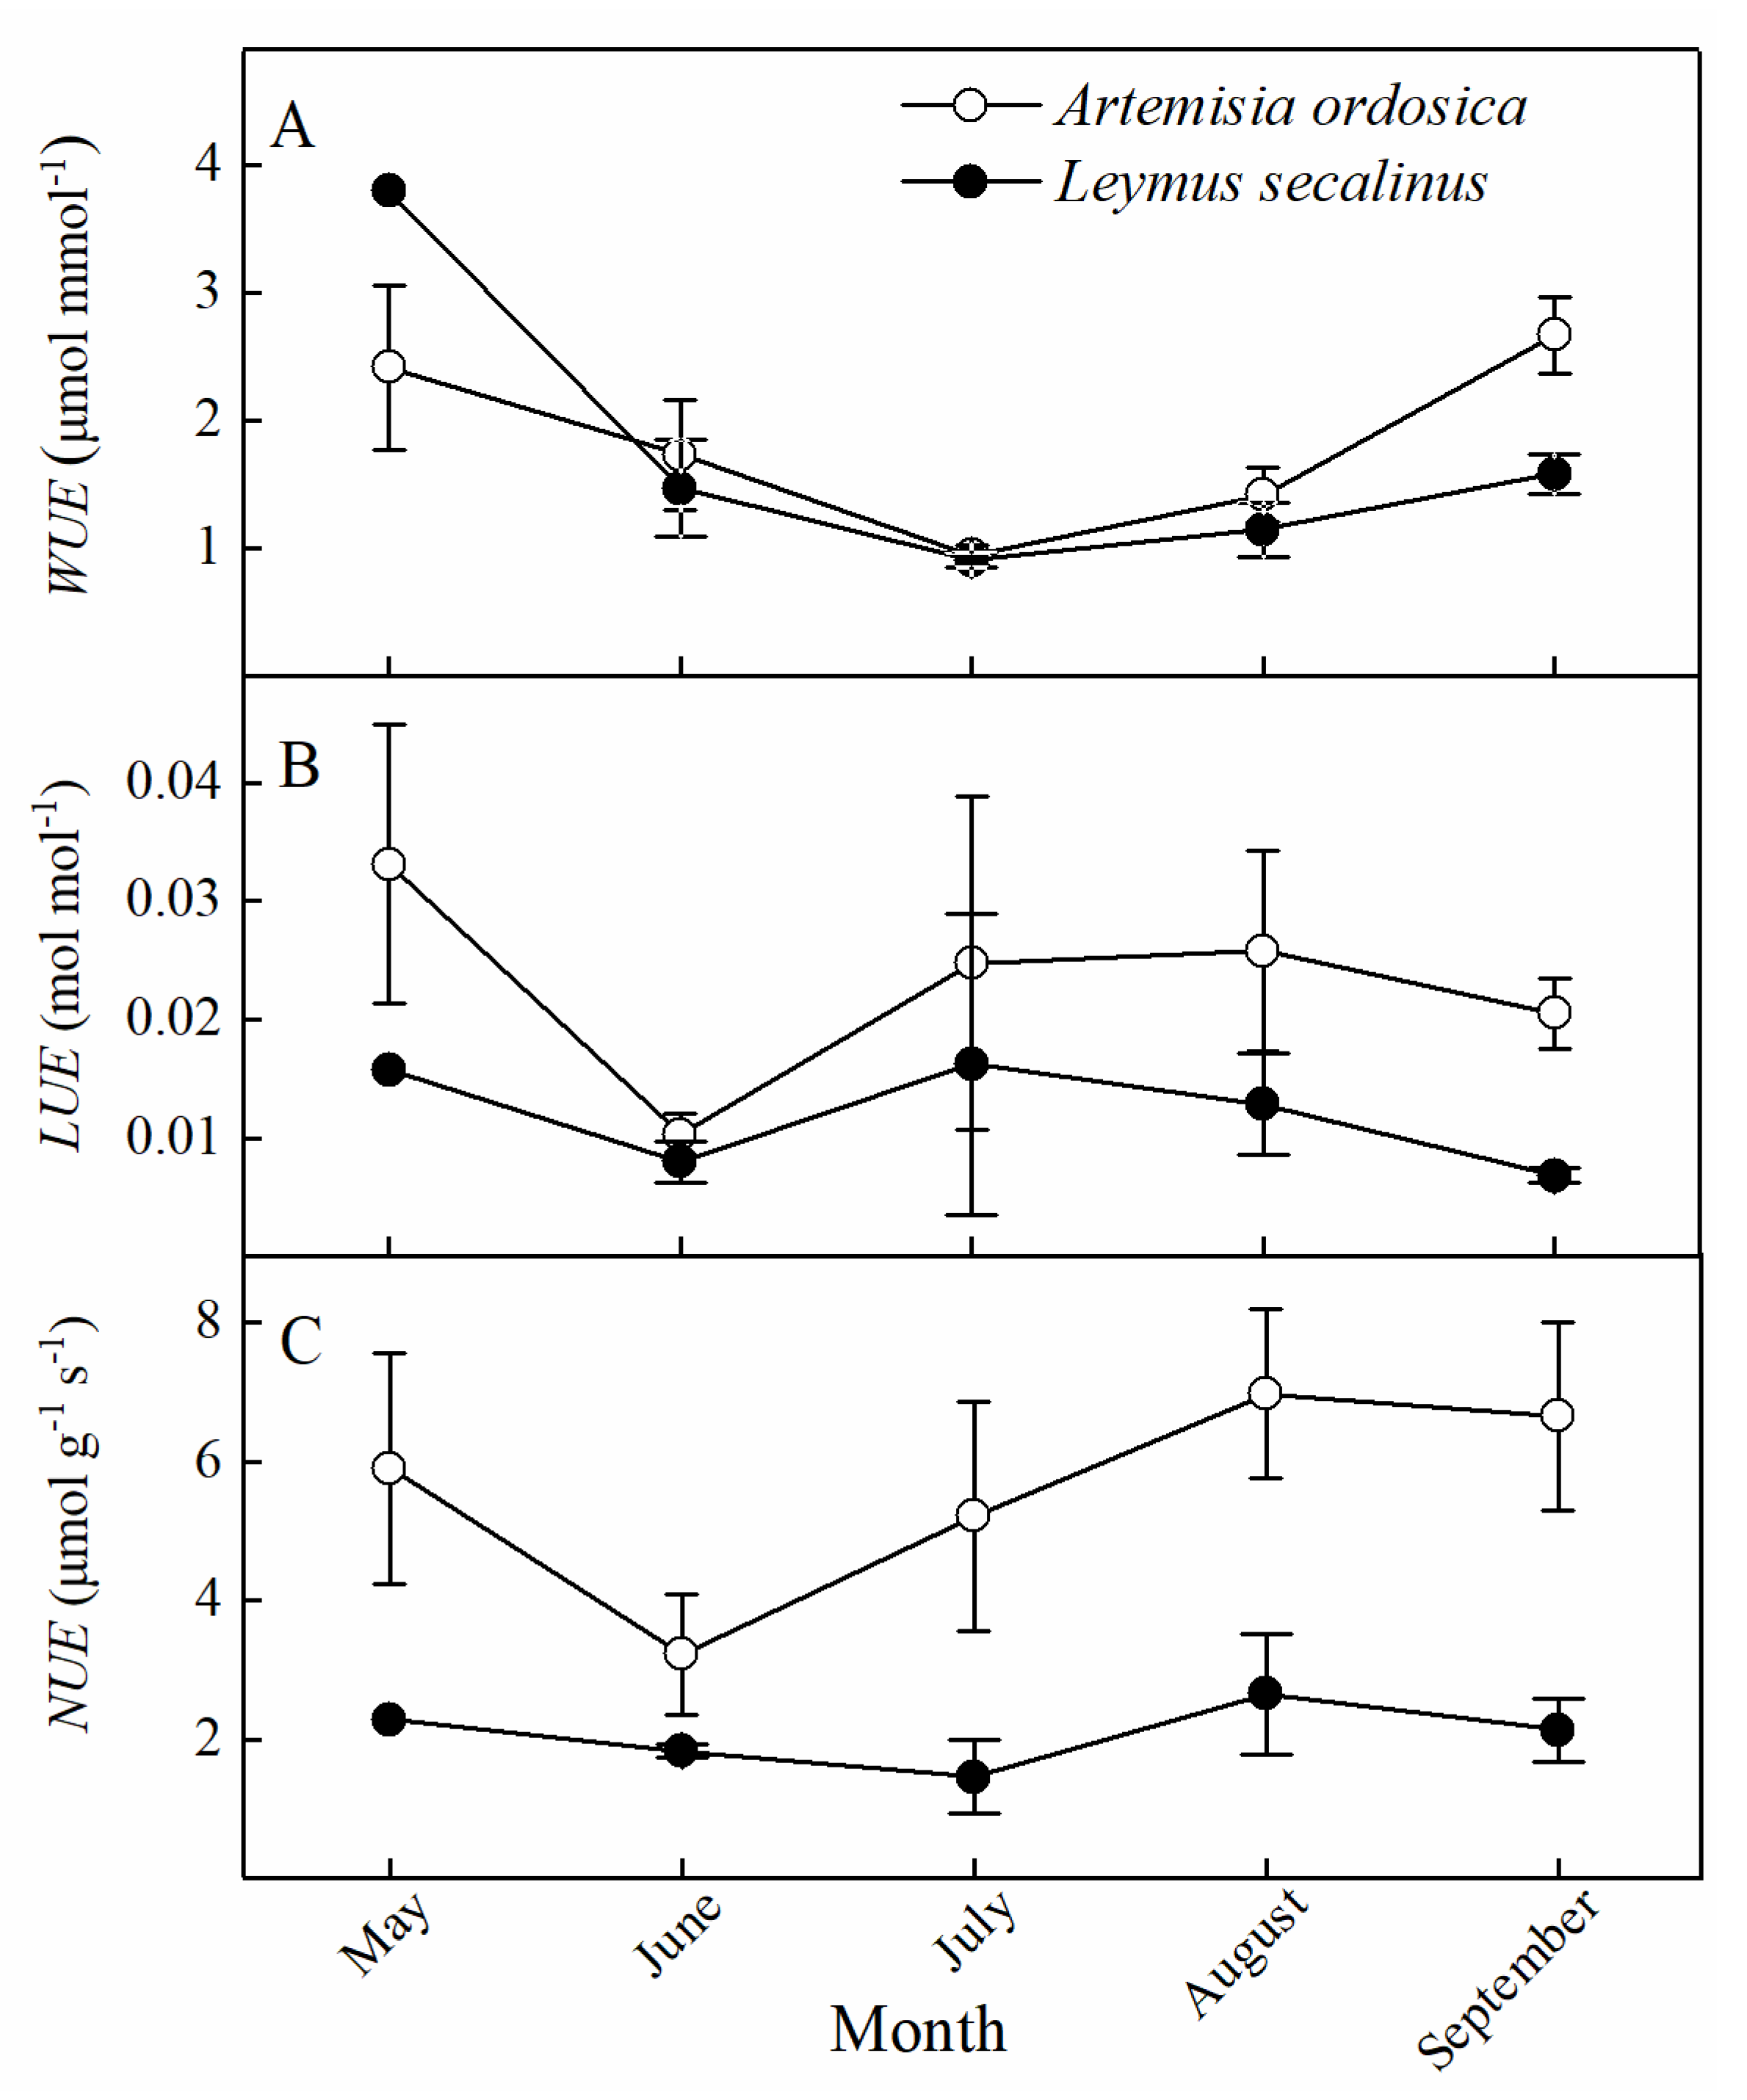
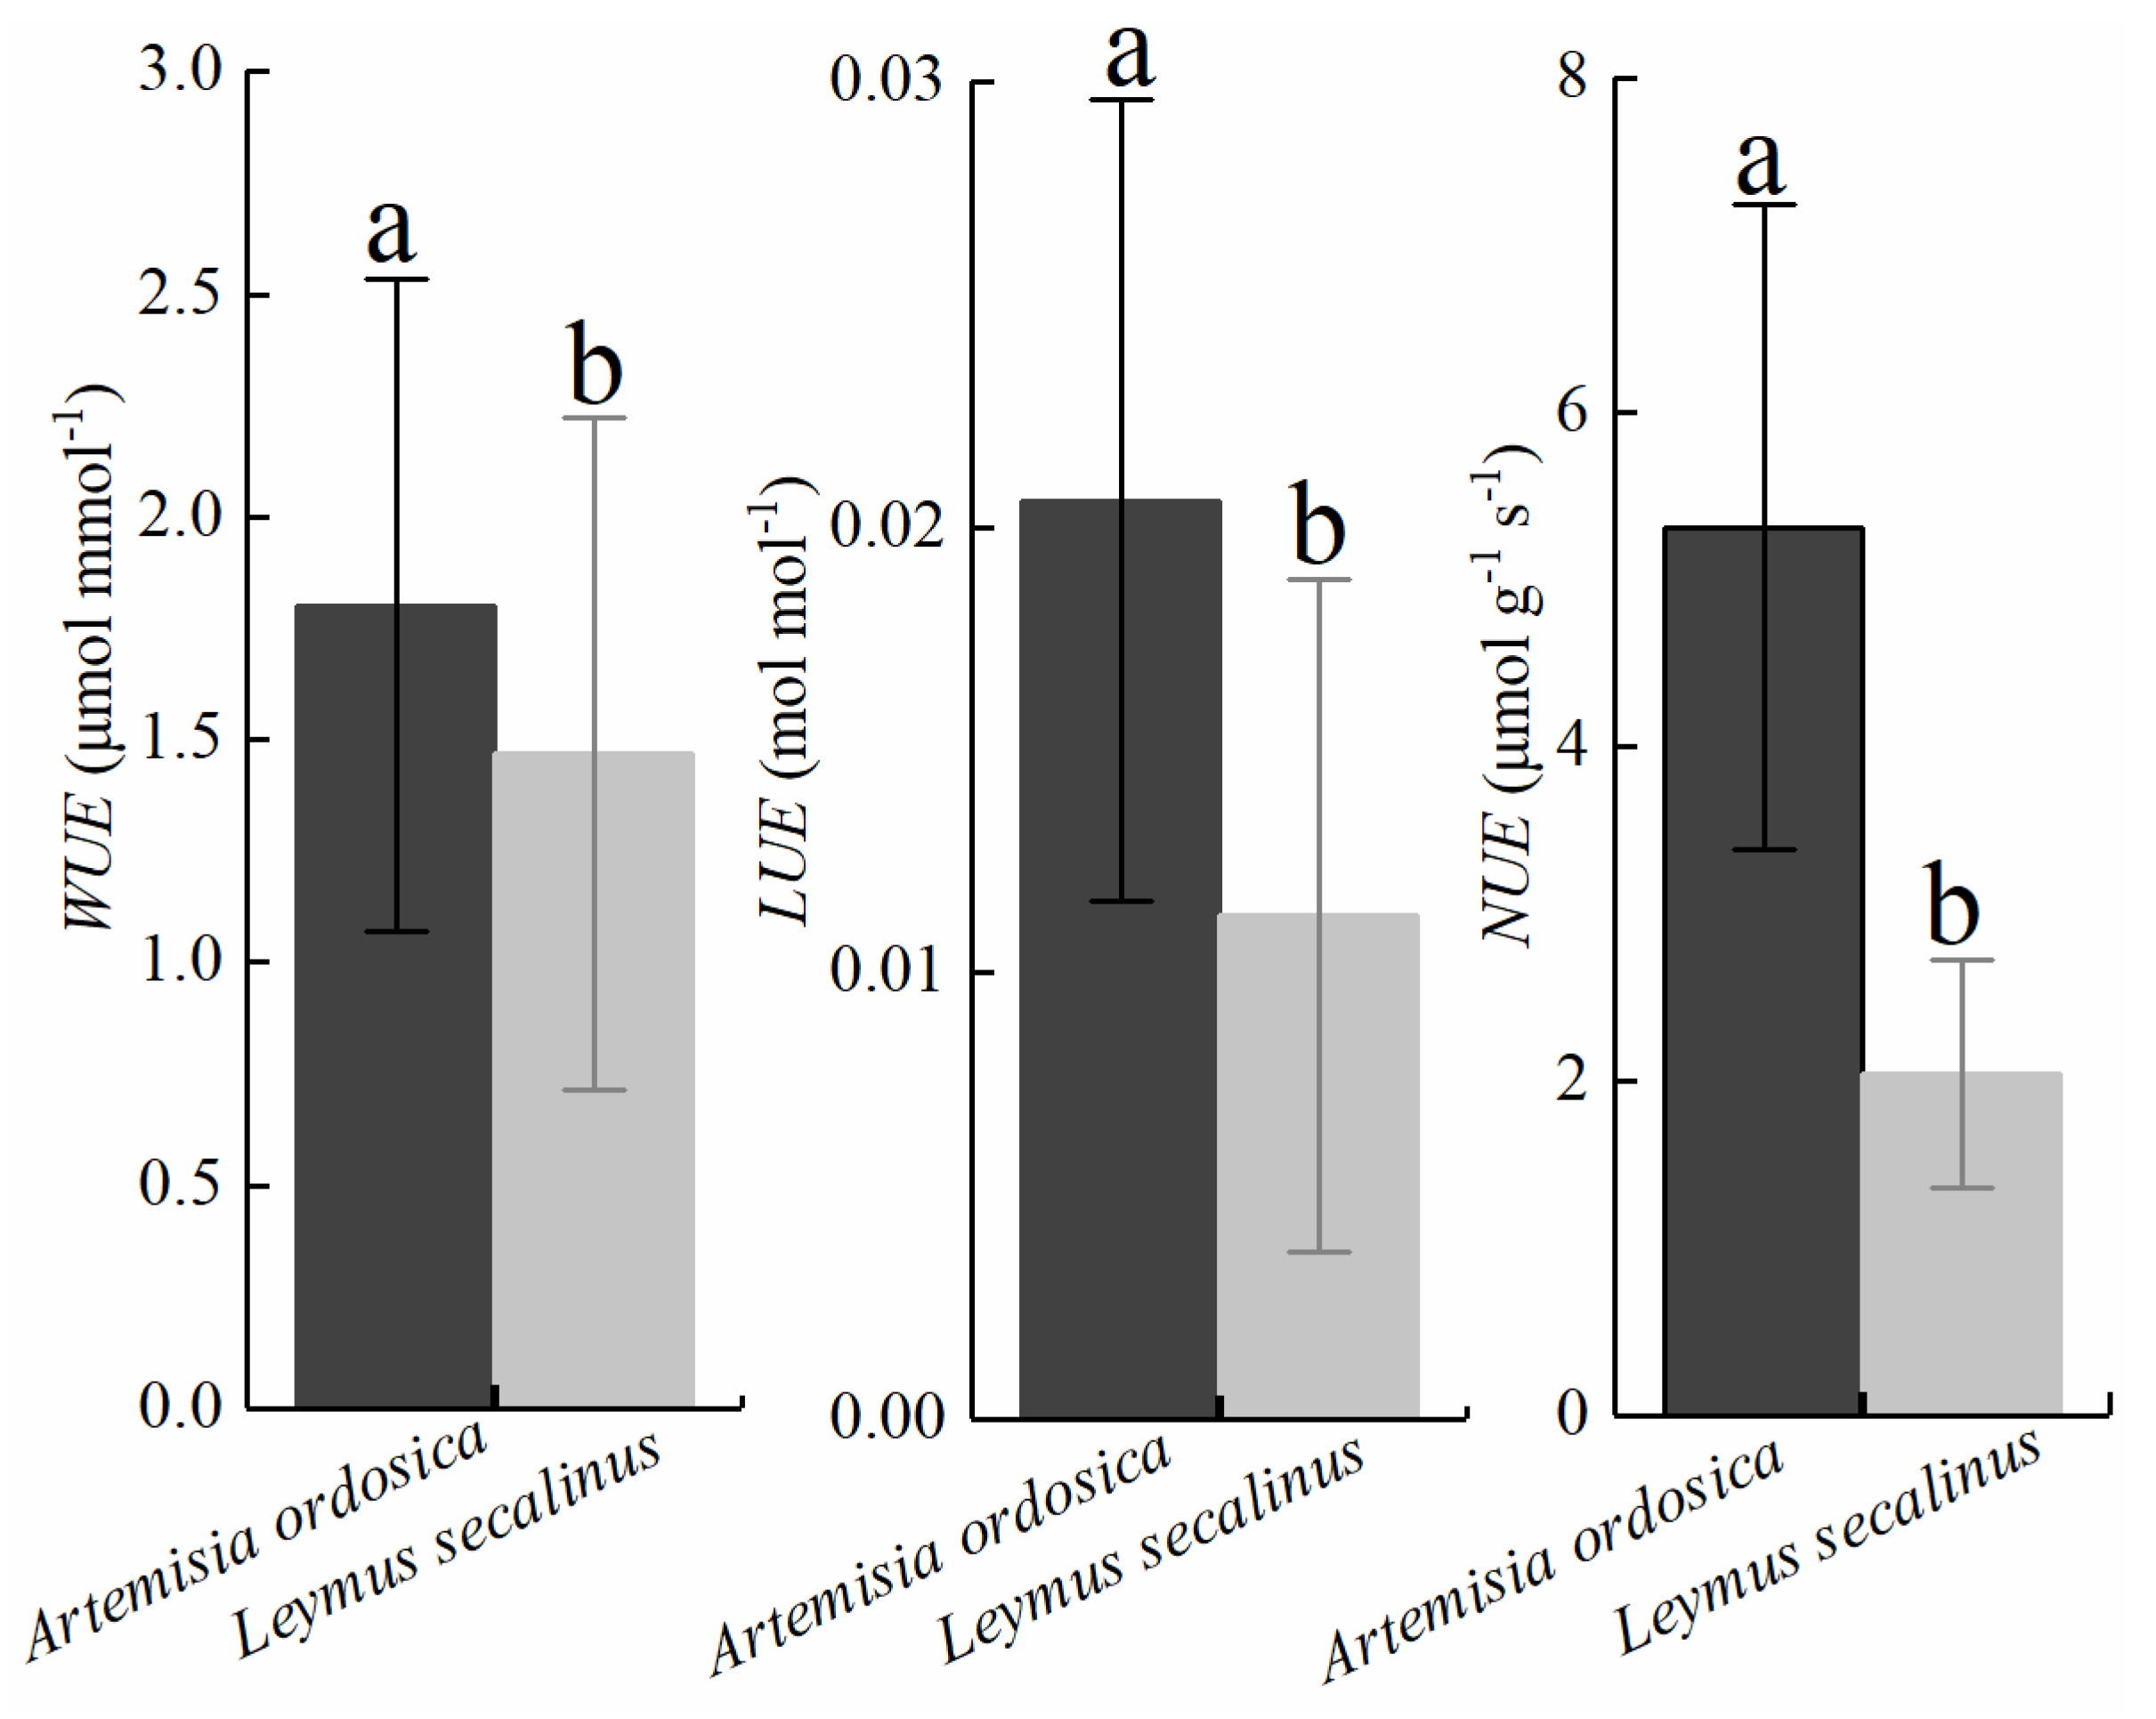
3.2. Seasonal Dynamics in Plant Resource Use Efficiencies

Both species had similar seasonal patterns in RUEs (i.e., WUE, LUE, and NUE) from May–September 2019 (Figure 5 and Figure 6). RUEs in A. ordosica were mostly larger than those in L. secalinus, with mean values of 1.84 μmol mmol−1, 0.023 mol mol1, and 5.59 μmol g−1 s−1 for WUE, LUE, and NUE for A. ordosica and 1.47 μmol mmol−1, 0.011 mol mol1, and 2.04 μmol g−1 s−1 for L. secalinus (Figure 5). Both species had significant seasonal differences in WUE, LUE, and NUE (Figure 5A–C), with CV of 43, 52, and 37% for A. ordosica and 53, 67, and 35% for L. secalinus (Figure 5).
Monthly WUE lowered in summer, with minima of 0.90 and 0.94 μmol mmol−1 in July for A. ordosica and L. secalinus (Figure 6A), respectively. Nitrogen use efficiency peaked in summer for both species, with maxima of 6.97 and 2.65 μmol g−1 s−1 in August (Figure 6C). Light use efficiency peaked at different months of the growing season for the two species, i.e., LUE being maximum in spring for A. ordosica, with a value of 0.033 mol mol1, and in summer for L. secalinus, with a value of 0.016 mol mol1 (Figure 6B).

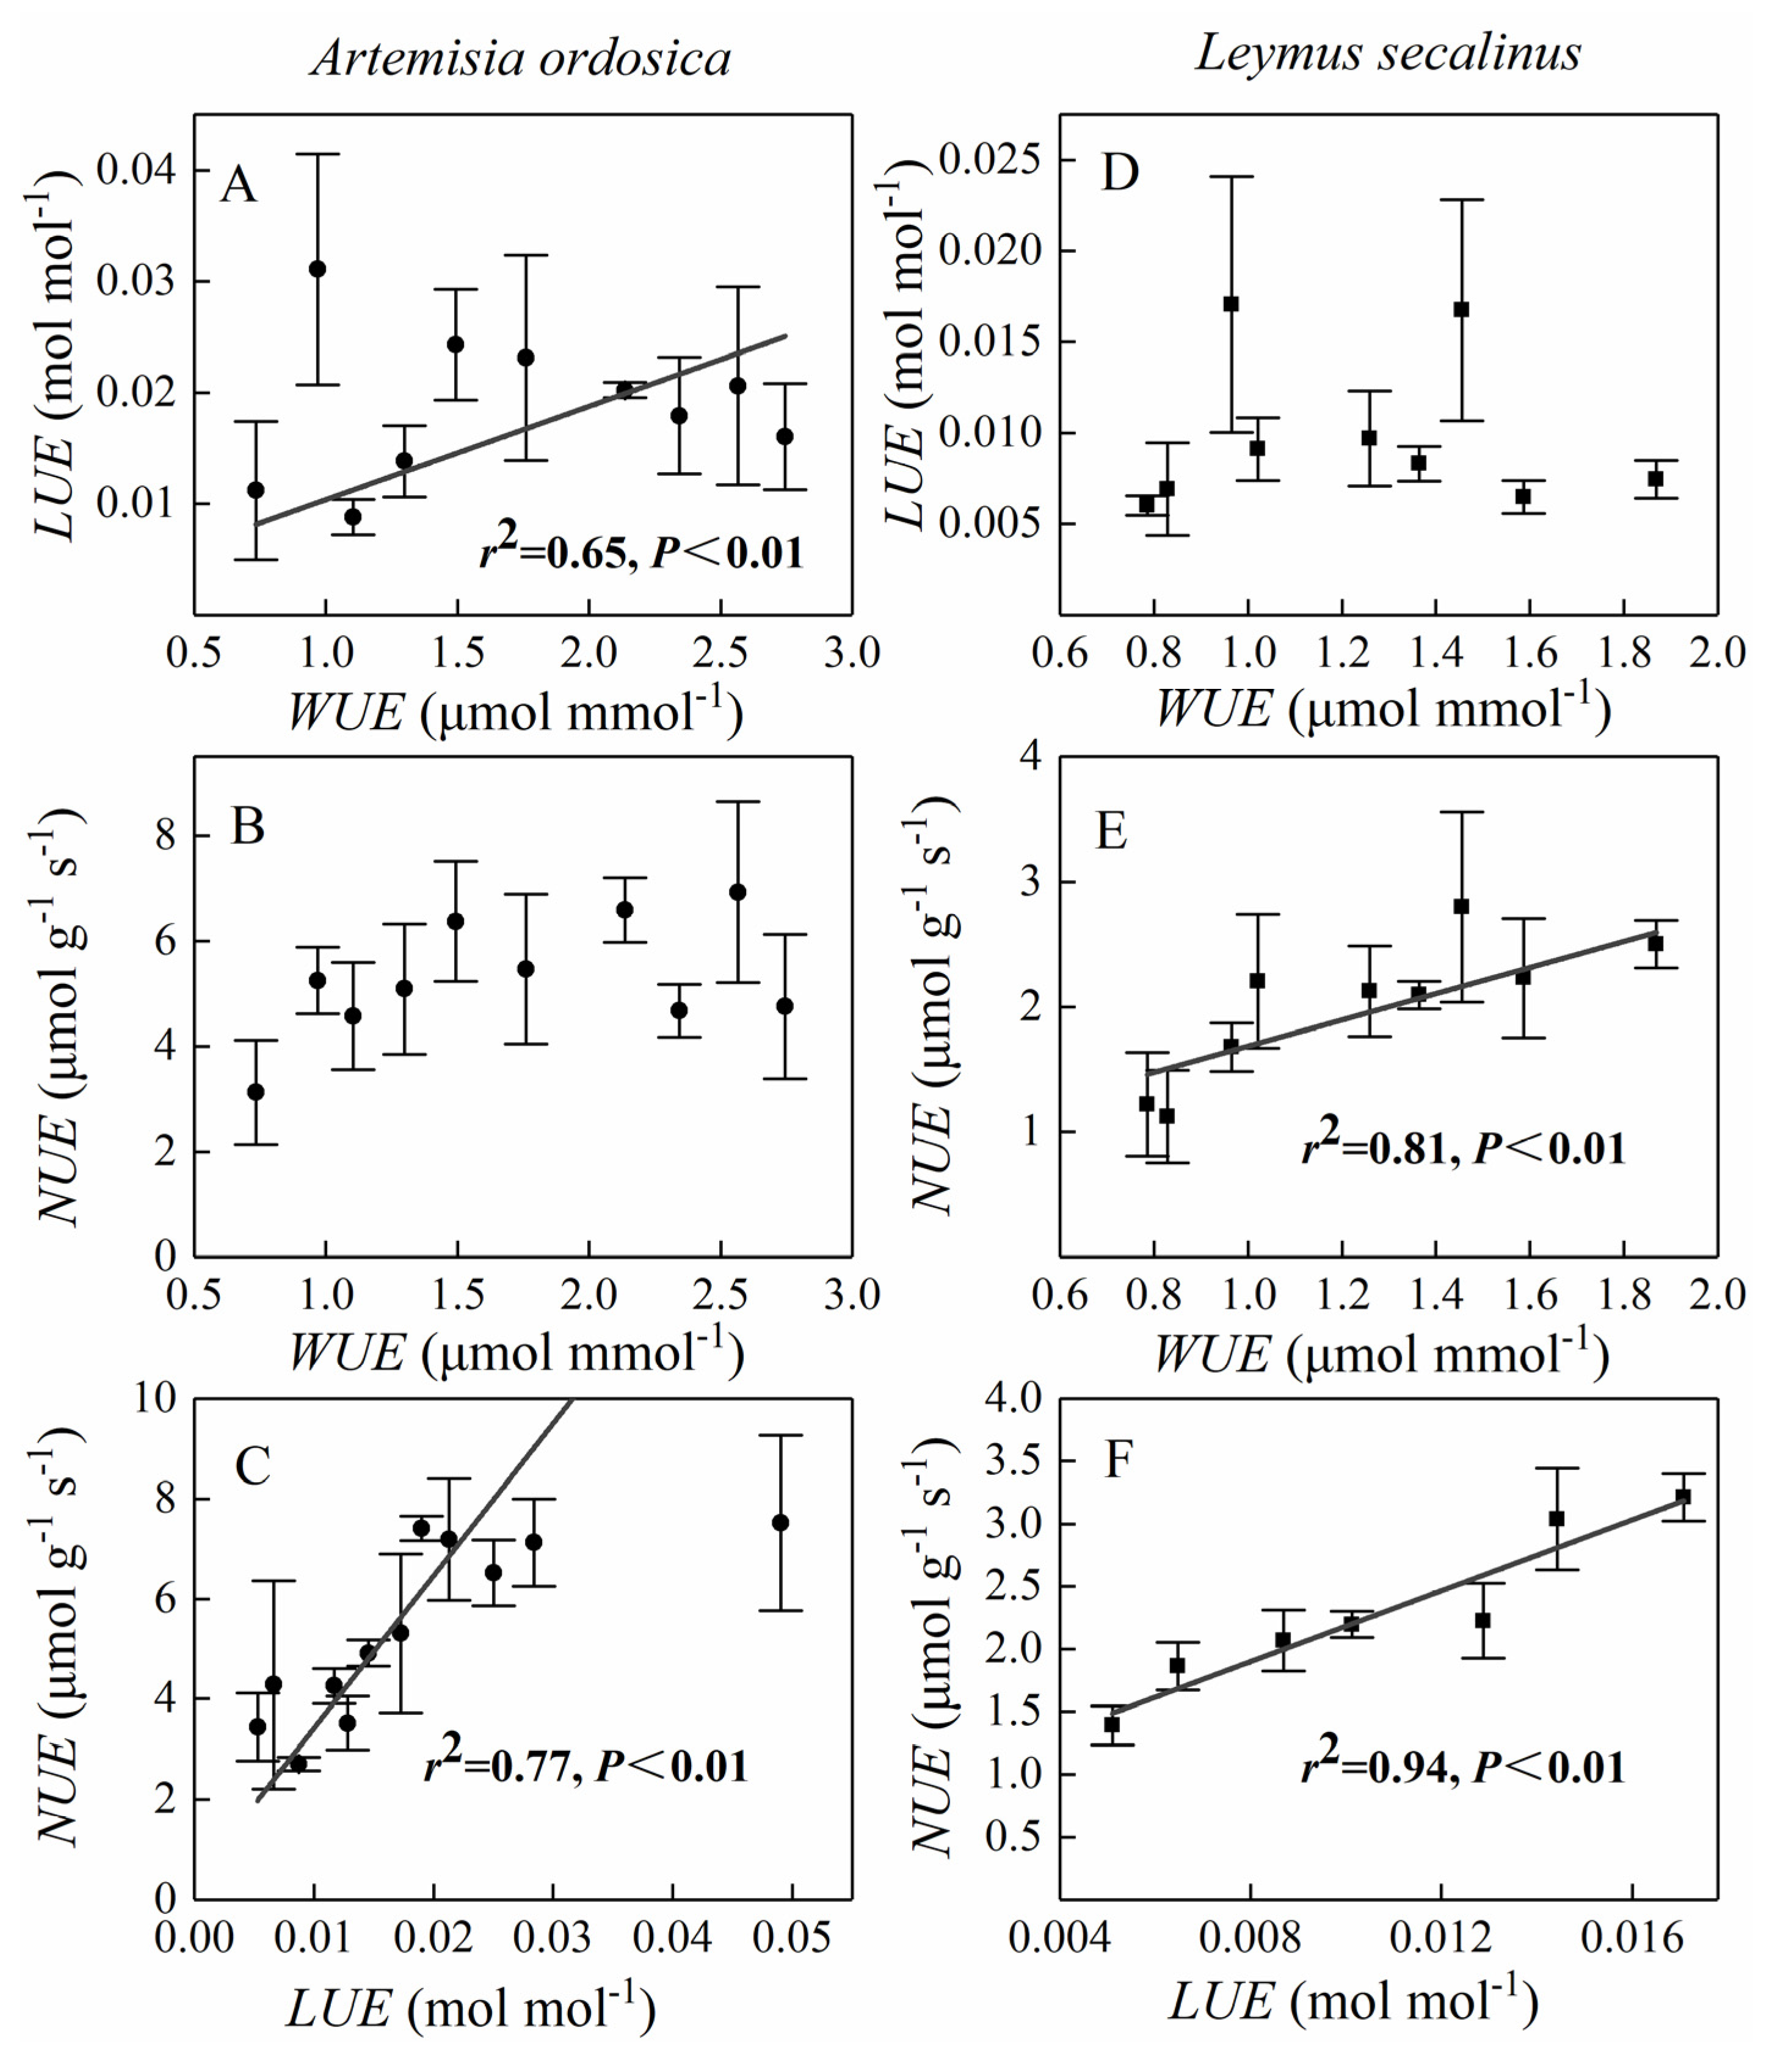
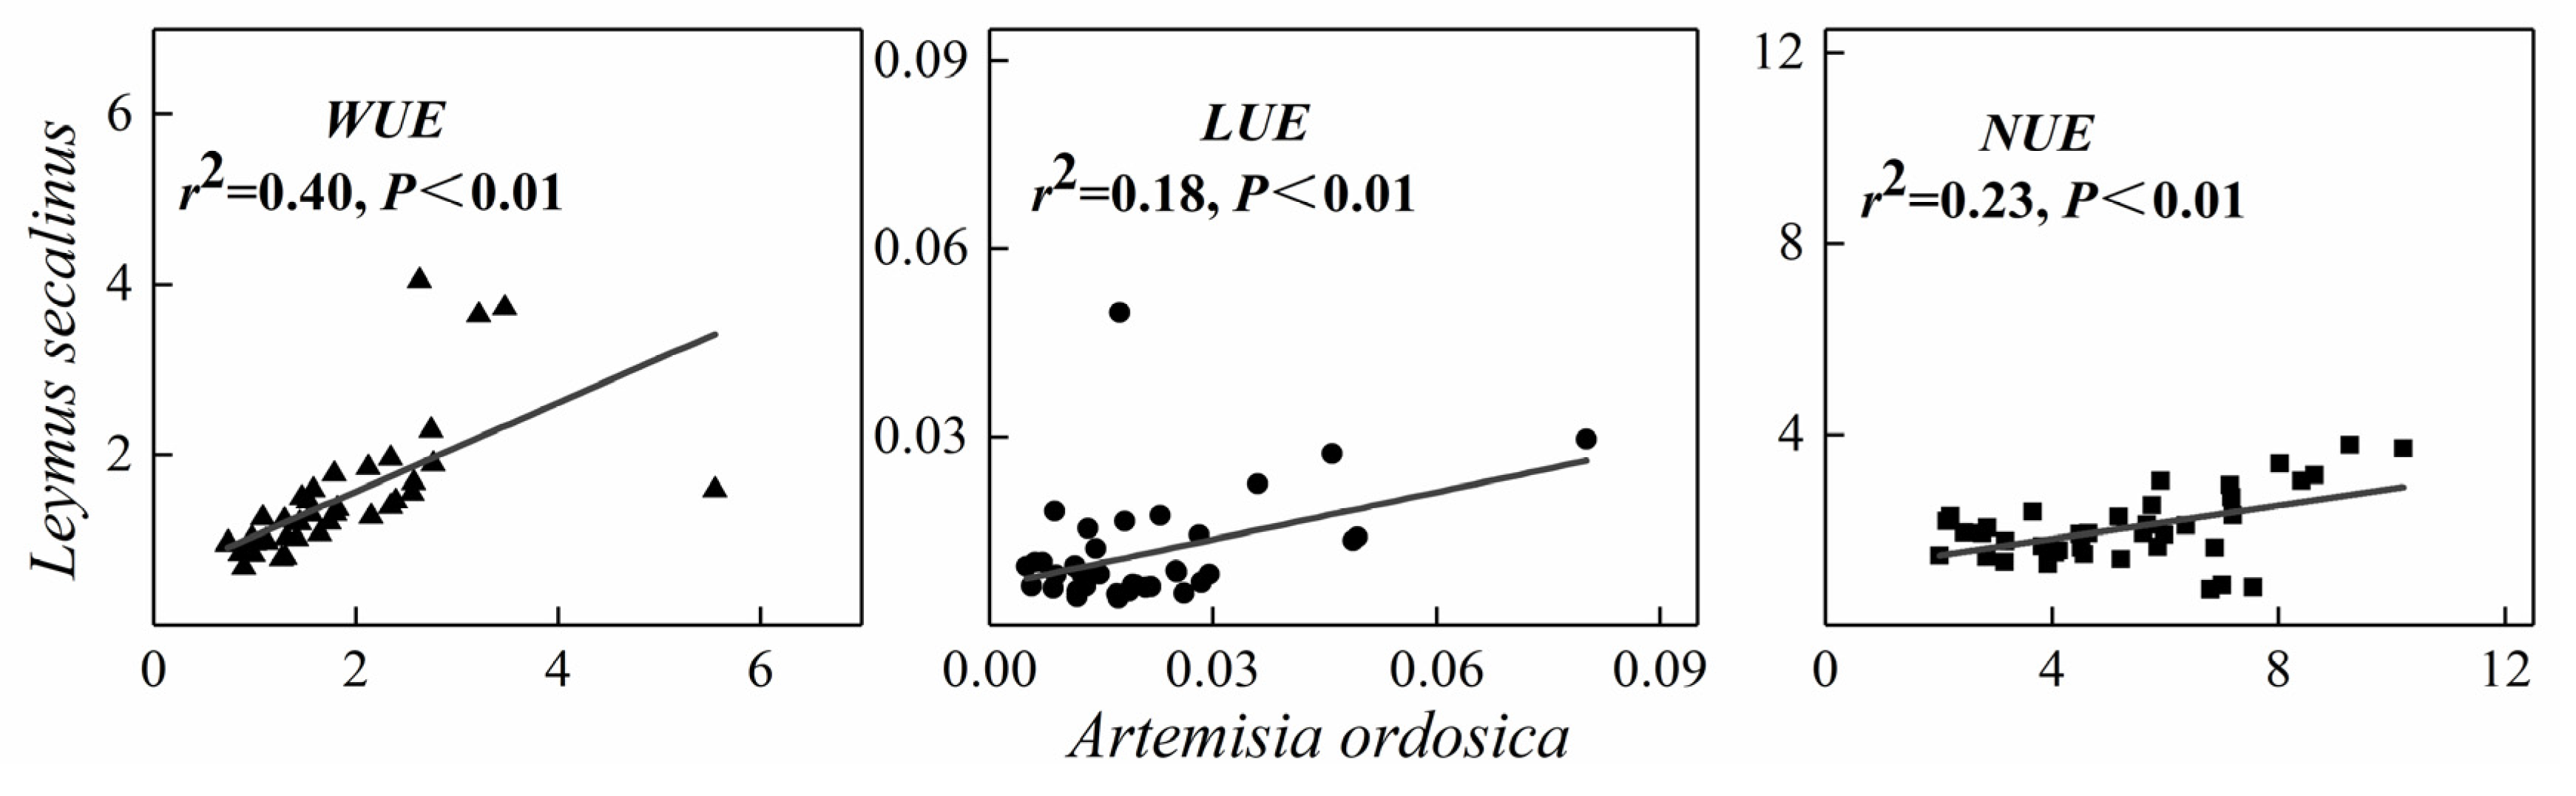
3.3. Relationships among RUEs for a Given Species and between Species

Positive correlations were detected between LUE and NUE for both A. ordosica (r2 = 0.77, p < 0.01; Figure 7C) and L. secalinus (r2 = 0.94, p < 0.01; Figure 7F). There were positive correlations between WUE and LUE (r2 = 0.65, p < 0.01; Figure 7A) for A. ordosica and WUE and NUE for L. secalinus (r2 = 0.81, p < 0.01; Figure 7E), but no such correlation existed when comparing the opposite use efficiency pairings (Figure 7B,D). RUEs for A. ordosica were positively correlated with those for L. secalinus (WUE, r2 = 0.40, p < 0.01; LUE, r2 = 0.18, p < 0.01; and NUE, r2 = 0.23; p < 0.01; Figure 8). Overall, there were statistically significant differences in WUE, LUE, and NUE between the two species (p < 0.01, based on student t-tests; Figure 9).

3.4. Controlling Factors on Variations in RUEs

Resource use efficiencies were mainly affected by Gs, SWC, and VPD for both species (Table 1). Specific leaf area only affected RUEs in L. secalinus. Control of biophysical factors on RUEs was through their direct and indirect effects on Pn, E, and Narea (Supplementary Material Figures S1A–C and S2A–C). Moreover, RUEs were essentially more strongly regulated by Pn than by E, PAR, or Narea (Supplementary Material Table S1). Net photosynthesis was more directly affected by Gs and VPD, while E was more directly affected by Gs and indirectly affected by SWC. Nitrogen concentration by leaf area was more directly controlled by SLA. An application of SEM further demonstrated that RUEs were mostly affected by VPD, SWC, and Gs, among which Gs affected RUEs the most in both species (Supplementary Material Figures S1D–F and S2D–F).

4. Discussion

4.1. Variations in RUEs and Their Controlling Factors

Variation in plant RUEs can indicate plant growth strategies in different environmental conditions [37,38]. Previous studies have reported that environmental fluctuations can cause changes in RUEs [16,17,26]. Our finding that RUEs is significantly affected by SWC and VPD over the growing season (Table 1), is supported by previous findings in arid-shrub species, such as S. psammophila and H. mongolicum [26,39]. Soil water content and VPD determined seasonal variation in RUEs by controlling Pn and E, but more predominantly Pn (Supplementary Material Figures S1A–C and S2A–C). High VPD induced stomatal closure, preventing excessive water loss, resulting in decreased Gs and, thus, a disproportionately larger decrease in Pn, than in E [40,41,42]. This led to a lowering of WUE, as shown by its negative relationship with VPD and Gs (Table 1). Soil water boosted by intermittent rain pulses, normally resulted in an elevated E, more than observed in Pn, leading to a reduction in WUE during the summer (Supplementary Material Figures S1D and S2D) [43,44,45].
The result that LUE was positively controlled by Gs and SWC (Table 1), is commonly observed in desert plants [46,47,48], for which light is not a limiting factor. Soil water supply in dry areas is often improved by intermittent rain pulses, leading to larger photosynthetic capacities [36]. When soil water was enough to meet atmospheric demand, Pn increased along with Gs (Supplementary Material Figures S1A–C and S2A–C) [9,45], causing LUE to be greater, and vice versa. Offset of water restrictions increased the efficiency by which PAR was converted to photosynthates. A reduction in stomatal constraint probably also played a positive role.
Since Narea changed very little over the growing season, the observed seasonality in NUE was mainly due to changes in Pn (Figure 3A and Figure 4C; Supplementary Material Table S1), establishing a positive relationship between NUE and Gs through its positive effect on Pn (Table 1). Higher stomatal conductance had caused Pn to be higher [11], which may have caused NUE to be greater during the summer.
Overall, variations in RUEs were largely controlled by Gs. Stomatal conductance was itself mostly controlled by SWC and VPD. Seasonal patterns in RUEs were due to the control applied by intermittent rain pulses and associated soil water supplies. This result confirmed that the presence of water was responsible for the large changes observed in resource use and efficiencies in arid and semiarid grasslands [10,13,49,50]. It submits that drier conditions at our site more likely decreased SWC in situ, which limited plant physiological activity and growth. It may be important for vegetation-climate models of net primary productivity to address these fundamentals in predicting plant responses in dryland ecosystems.
A. ordosica and L. secalinus, as indicator species, can be selected on the basis of their trait values’ responsiveness to environmental factors and their importance both locally and regionally [9,19,39], for monitoring trends in ecosystem-level properties across environmental gradients (e.g., pollution, drought, fertility) [51]. These field measurements always involve a balance between the number of replicates and precision. The number of replicates selected should depend on species variability in the trait of interest, as well as on the number of species sampled [34]. Pérez-Harguindeguy et al. showed that the minimum and preferred number of replicates for different traits is five and ten, respectively, based on common practice [34]. Prior studies in semiarid shrublands usually involved three to seven replicates [26,35,39,45]. Given constraints of time, we selected nine replicates for each species for an improved assessment, and thus could guarantee validity of our study results.

4.2. Tradeoffs between RUEs

High NUE occurred predominantly when LUE was high in both species (Figure 7C,F), such as those seen in boreal trees [52], suggesting that a level of convergence existed between LUE and NUE. It was previously reported that plants can reduce the constraints on carbon uptake by maximizing the use efficiency of the most limiting resource, while lowering the use efficiency of resources that are more abundant [53]. Some prior studies have shown a negative association between LUE and NUE, in contrast to our results [16,54]. One plausible explanation for this discrepancy may be associated with the fact that LUE in plants reflect processes of carbon fixation. This is not the case with NUE, where NUE is mostly the product of carbon fixation and protein synthesis, which are weakly coupled to carbon uptake. Temporal integration also tends to decrease the relative importance of resource availabilities and cause long-term RUE responses to differ from short-term observations [52,55]. As a key ecological function, long-term relative changes in RUE deserve further investigation for improved understanding in how plants may respond to climate change, especially with long-lasting effects of highly variable precipitation and extreme aridity in dryland ecosystems.
In A. ordosica, variation in NUE and LUE were mostly explained by variation in Pn, leading to a positive correlation between LUE and NUE (Supplementary Material Table S1). Increased Pn was accompanied by an elevated Gs, increasing LUE and NUE when leaf N concentrations were relatively stable [56]. In L. secalinus, positive correlation between LUE and NUE were explained by variations in Pn and Nmass (Figure 3A and Figure 4B; Supplementary Material Table S1). The plasticity of LUE to high insolation levels was largely due to Pn being limited by carboxylation capacity and associated Nmass [57]. High insolation acted to maximize instantaneous photosynthesis, which correlated positively with LUE due to reduced absorption of saturated light, and positively with NUE due to lower N investment that maximized Pn during the summer [58,59].
There was neither correlation between WUE and LUE, nor correlation between WUE and NUE in both species (Figure 7A,B,D,E). The Mu Us Desert is occasionally affected by drought; SWC was shown to be a key factor in controlling plant RUEs and constraining plant growth (Table 1) [10,26,45,50]. A. ordosica has an ability to avoid functional damage by reducing transpiration losses through stomatal closure during periods of excessive dryness [9,39]. Consequently, its RUEs response to drought largely depended on the physiological control conveyed by Gs. Physiological and structural variations in Gs and SLA both regulated RUEs in L. secalinus (Table 1). Drought-coping variations in plant morphological and physiological traits could have led to differences in tradeoffs between RUEs in the two species, as observed in prior studies [18,29,60]. The results indicated that dominant species have adaptive differentiation of resource use-related traits to achieve local coexistence in dryland ecosystems.

4.3. Relationships in RUEs between the Two Species

The finding that RUEs in A. ordosica was positively and linearly correlated with those in L. secalinus (Figure 8), provides some evidence of convergence. This result is consistent with trends seen in other studies e.g., [26,29,38], such as those reported for piñon pine and juniper [11]. RUEs in dominant plant species growing in harsh environments, such as arid [61], semiarid Mediterranean [38], and semiarid shrubland (this study) are subject to the effects of various levels of drought intensity and duration. Clearly, convergence in RUEs in the dominant plant species can be largely explained by soil water limitations experienced at these sites. It further confirms that ecosystem functioning is more sensitive and vulnerable to highly variable precipitation, extreme water scarcity, and pronounced fluctuations in diurnal temperatures in drylands [2,4].
Although convergence existed in RUEs between the two species, there was a difference in their magnitudes. RUEs in A. ordosica were mostly greater than those in L. secalinus (Figure 5 and Figure 6; p < 0.01, Figure 9), due to their elevated leaf photosynthetic capacity and Pn (Figure 3A). Prominent SLA in A. ordosica means that it has a larger capacity to capture light and acquire nutrients more directly than in L. secalinus. These results suggest that shrubs may be better suited for arid conditions, as previously proposed by Zha et al. and Wu et al. [9,26,36]. Compared to RUEs in L. secalinus, variation in RUEs was more limited in A. ordosica (Figure 5A,B), indicating that desert shrubs may be more resistant to drought. Suppression of SLA, Nmass, and Narea was greatest in A. ordosica, compared to that in L. secalinus (Figure 4). Soil water content (SWC) and VPD had more influence on LUE and WUE in L. secalinus, suggesting that the species is more responsive to drought than A. ordosica. Past studies have reported similar findings in other desert plants (e.g., [9,19,62]).
There was divergence in the relationship between plant drought tolerance and its RUEs [11]. Desert plants either select resource acquisition or resource conservation in their response to drought [63]. In this study, A. ordosica demonstrated a resource-conservation strategy [10,26,39]. This explains the high RUEs and low sensitivity to environmental change observed in A. ordosica, compared with L. secalinus (Figure 5 and Figure 6; Supplementary Material Figures S1D–F and S2D–F). A. ordosica had higher RUEs, and thus could accelerate phenological change, improve photosynthetic production, and complete its life cycle as quickly as possible to avoid dehydration and escape drought, which resulted in its better acclimatization to dry environments in comparison with L. secalinus [64]. With continued increases in drought severity and duration and associated lowering of groundwater reserves anticipated with future climate change, desert shrubs are projected to eventually replace grasses, impairing the function of natural ecosystems and, thus, diminishing the number and quality of ecological services they provide [2,65]. Our results suggest that the preservation of plant biodiversity in arid and semiarid drylands is crucial to buffer the undesirable effects of climate change and desertification.

5. Conclusions

Both species had similar seasonal patterns in RUEs (i.e., WUE, LUE, and NUE) and exhibited significant seasonal variation in RUEs from May–September 2019 (CV > 30%). Monthly WUE lowered in July and NUE peaked in August for both A. ordosica and L. secalinus. Light use efficiency peaked at different months for the two species. SWC and VPD were the environmental factors that affected variation in RUEs the most by regulating Gs. For a given RUE, there was a convergence in resource use efficiency between the two species, with A. ordosica exhibiting lower overall variation compared to L. secalinus. However, the tradeoffs between RUEs were divergent in the species. It was determined that A. ordosica was more adaptable to arid conditions than L. secalinus. Vegetation succession may lead to shifts in ecosystem composition in favor of more drought tolerant species, such as A. ordosica, in the near-to-immediate future. This may result in a reduction in biodiversity and ecosystem functioning, and enhanced vulnerability to global climate change and human disturbance in drylands. Dryland social-ecological systems are especially sensitive to rapid rates of physical and social change, such as those associated with climate change and urbanization. Our findings demonstrate the need to strengthen dryland ecosystem management methods for sustainable livelihoods and to advance progress towards the implementation of 2030 SDGs for drylands.

Supplementary Materials

The following are available online at https://0-www-mdpi-com.brum.beds.ac.uk/article/10.3390/f12101372/s1. Figure S1: Structural equation modelling (SEM, subfigures A–C) and standardized total effect (D–F) showing the effect of abiotic and biotic factors on RUEs in A. ordosica; Figure S2: Structural equation modelling (SEM, subfigures A–C) and standardized total effect (D–F) showing the effect of abiotic and biotic factors on RUEs in L. secalinus; Table S1: Partial correlation coefficients between RUEs [i.e., water, light, and nitrogen use efficiencies (i.e., WUE, LUE, and NUE)] and biophysical variables of photosynthesis (Pn), transpiration (E), incident photosynthetically active radiation (PAR), and N per unit leaf area (Narea) from 1 May–30 September 2019 for A. ordosica and L. secalinus.

Author Contributions

Y.T. and Y.J. conceived the study. Y.J., C.J., N.W. and S.G. conducted the fieldwork. Y.J., X.J. (Xiaoyan Jiang) and X.L. analyzed the data. Y.J. wrote the manuscript with the assistance of Y.T. and T.Z. T.Z., X.J. (Xin Jia) and P.L. revised the manuscript. C.P.-A.B. revised the initial and final writing of the manuscript. All authors have read and agreed to the published version of the manuscript.

Funding

This work was supported by the National Natural Science Foundation of China (NSFC: 31901366, 32071842, 32071843), the National Key Research and Development Program of China (2020YFA0608100), and by the Fundamental Research Funds for the Central Universities (No. 2015ZCQ-SB-02).

Institutional Review Board Statement

Not applicable.

Informed Consent Statement

Not applicable.

Data Availability Statement

The data and materials that support the findings of this study are all available from the corresponding author upon reasonable request.

Acknowledgments

We would like to thank X.W. Yang, S.J. Liu, G.P. Chen, C. Zhang, Y. Luo and H. Tian for their assistance with field measurements and instrument maintenance. The U.S.-China Carbon Consortium (USCCC) supported this work by way of helpful discussion and the exchange of scientific ideas.

Conflicts of Interest

The authors declare no conflict of interest.

Appendix A

Table A1. Acronyms addressed in this study and their units of measurement.
Full-NameAbbreviationUnit
Resource use efficienciesRUEs-
Water use efficiencyWUEμmol·mmol−1
Light use efficiencyLUEmol·mol−1
Nitrogen use efficiencyNUEμmol·g−1·s−1
Photosynthetic ratePnμmol·m−2·s−1
Transpiration rateEmmol·m−2·s−1
Stomatal conductanceGsmol·m2·s−1
Specific leaf areaSLAcm2·g−1
Leaf nitrogen content per unit areaNareag·m−2
Leaf nitrogen per unit dry massNmassg·kg−1
Air temperatureT°C
Relative humidityRH%
Net radiationRnW·m−2
Incident photosynthetically active radiationPARμmol·m−2·s−1
Soil water content at 30-cm depthSWCm3·m−3
Vapor pressure deficientVPDkPa
Coefficient of variationCV%

References

  1. Huang, J.; Yu, H.; Dai, A.; Wei, Y.; Kang, L. Drylands face potential threat under 2  °C global warming target. Nat. Clim. Chang. 2017, 7, 417–422. [Google Scholar] [CrossRef]
  2. Maestre, F.T.; Quero, J.L.; Gotelli, N.J.; Escudero, A.; Ochoa, V.; Delgado-Baquerizo, M.; García-Gómez, M.; Bowker, M.A.; Soliveres, S.; Escolar, C.; et al. Plant species richness and ecosystem multifunctionality in global drylands. Science 2012, 335, 214–218. [Google Scholar] [CrossRef] [Green Version]
  3. Stringer, L.C.; Reed, M.S.; Fleskens, L.; Thomas, R.J.; Le, Q.B.; Lala-Pritchard, T. A new dryland development paradigm grounded in empirical analysis of dryland systems science. Land Degrad. Dev. 2017, 28, 1952–1961. [Google Scholar] [CrossRef] [Green Version]
  4. Fu, B.; Stafford-Smith, M.; Wang, Y.; Wu, B.; Yu, X.; Lv, N.; Ojima, D.S.; Lv, Y.; Fu, C.; Liu, Y.; et al. The global-DEP conceptual framework—Research on dryland ecosystems to promote sustainability. Curr. Opin. Environ. Sustain. 2021, 48, 17–28. [Google Scholar] [CrossRef]
  5. Leach, M.; Rockström, J.; Raskin, P.; Scoones, I.; Stirling, A.C.; Smith, A.; Thompson, J.; Millstone, E.; Ely, A.; Arond, E.; et al. Transforming innovation for sustainability. Ecol. Soc. 2012, 17, 11. [Google Scholar] [CrossRef] [Green Version]
  6. Ahlström, A.; Raupach, M.R.; Schurgers, G.; Smith, B.; Arneth, A.; Jung, M.; Reichstein, M.; Canadell, J.G.; Friedlingstein, P.; Jain, A.K.; et al. The dominant role of semiarid ecosystems in the trend and variability of the land CO2 sink. Science 2015, 348, 895–899. [Google Scholar] [CrossRef] [Green Version]
  7. Berg, A.; Findell, K.; Lintner, B.; Giannini, A.; Seneviratne, S.I.; van den Hurk, B.; Lorenz, R.; Pitman, A.; Hagemann, S.; Meier, A.; et al. Land–atmosphere feedbacks amplify aridity increase over land under global warming. Nat. Clim. Chang. 2016, 6, 869–874. [Google Scholar] [CrossRef]
  8. Huang, J.; Yu, H.; Guan, X.; Wang, G.; Guo, R. Accelerated dryland expansion under climate change. Nat. Clim. Chang. 2015, 6, 166–171. [Google Scholar] [CrossRef]
  9. Zha, T.; Qian, D.; Jia, X.; Bai, Y.; Tian, Y.; Bourque, C.P.A.; Ma, J.; Feng, W.; Wu, B.; Peltola, H. Soil moisture control of sap-flow response to biophysical factors in a desert-shrub species, Artemisia ordosica. Biogeosciences 2017, 14, 4533–4544. [Google Scholar] [CrossRef] [Green Version]
  10. Chen, Z.-H.; Zha, T.; Jia, X.; Wu, Y.; Wu, B.; Zhang, Y.; Guo, J.; Qin, S.; Chen, G.; Peltola, H. Leaf nitrogen is closely coupled to phenophases in a desert shrub ecosystem in China. J. Arid Environ. 2015, 122, 124–131. [Google Scholar] [CrossRef]
  11. Limousin, J.M.; Yepez, E.A.; McDowell, N.G.; Pockman, W.T.; Tjoelker, M. Convergence in resource use efficiency across trees with differing hydraulic strategies in response to ecosystem precipitation manipulation. Funct. Ecol. 2015, 29, 1125–1136. [Google Scholar] [CrossRef] [Green Version]
  12. Hyvonen, R.; Agren, G.I.; Linder, S.; Persson, T.; Cotrufo, M.F.; Ekblad, A.; Freeman, M.; Grelle, A.; Janssens, I.A.; Jarvis, P.G.; et al. The likely impact of elevated CO2, nitrogen deposition, increased temperature and management on carbon sequestration in temperate and boreal forest ecosystems: A literature review. New Phytol. 2007, 173, 463–480. [Google Scholar] [CrossRef]
  13. Han, J.; Chen, J.; Miao, Y.; Wan, S. Multiple Resource Use Efficiency (mRUE): A New Concept for Ecosystem Production. Sci. Rep. 2016, 6, 37453. [Google Scholar] [CrossRef] [Green Version]
  14. Silvertown, J.; Araya, Y.; Gowing, D.; Cornwell, W. Hydrological niches in terrestrial plant communities: A review. J. Ecol. 2015, 103, 93–108. [Google Scholar] [CrossRef] [Green Version]
  15. Gong, X.Y.; Chen, Q.; Lin, S.; Brueck, H.; Dittert, K.; Taube, F.; Schnyder, H. Tradeoffs between nitrogen- and water-use efficiency in dominant species of the semiarid steppe of Inner Mongolia. Plant Soil 2010, 340, 227–238. [Google Scholar] [CrossRef]
  16. Tarvainen, L.; Rantfors, M.; Wallin, G. Seasonal and within-canopy variation in shoot-scale resource-use efficiency trade-offs in a Norway spruce stand. Plant Cell Environ. 2015, 38, 2487–2496. [Google Scholar] [CrossRef] [PubMed]
  17. Carlson, J.E.; Adams, C.A.; Holsinger, K.E. Intraspecific variation in stomatal traits, leaf traits and physiology reflects adaptation along aridity gradients in a South African shrub. Ann. Bot. 2016, 117, 195–207. [Google Scholar] [CrossRef] [PubMed] [Green Version]
  18. Carvajal, D.E.; Loayza, A.P.; Rios, R.S.; Gianoli, E.; Squeo, F.A. Population variation in drought-resistance strategies in a desert shrub along an aridity gradient: Interplay between phenotypic plasticity and ecotypic differentiation. Perspect. Plant Ecol. 2017, 29, 12–19. [Google Scholar] [CrossRef]
  19. Jia, X.; Zha, T.; Gong, J.; Zhang, Y.; Wu, B.; Qin, S.; Peltola, H. Multi-scale dynamics and environmental controls on net ecosystem CO2 exchange over a temperate semiarid shrubland. Agric. For. Meteorol. 2018, 259, 250–259. [Google Scholar] [CrossRef]
  20. Hodapp, D.; Hillebrand, H.; Striebel, M. “Unifying” the Concept of Resource Use Efficiency in Ecology. Front. Ecol. Evol. 2019, 6, 233–247. [Google Scholar] [CrossRef] [Green Version]
  21. Pérez-Ramos, I.M.; Roumet, C.; Cruz, P.; Blanchard, A.; Autran, P.; Garnier, E.; Aerts, R. Evidence for a ‘plant community economics spectrum’ driven by nutrient and water limitations in a Mediterranean rangeland of southern France. J. Ecol. 2012, 100, 1315–1327. [Google Scholar] [CrossRef] [Green Version]
  22. Blum, A. Drought resistance, water-use efficiency, and yield potential—Are they compatible, dissonant, or mutually exclusive? Aust. J. Agric. Res. 2005, 56, 1159–1168. [Google Scholar] [CrossRef]
  23. Fischer, R.A.; Maurer, R. Drought resistance in spring wheat cultivars. I Grain yield responses. Aust. J. Agric. Res. 1978, 29, 897–912. [Google Scholar] [CrossRef]
  24. Lübbe, T.; Schuldt, B.; Leuschner, C. Acclimation of leaf water status and stem hydraulics to drought and tree neighbourhood: Alternative strategies among the saplings of five temperate deciduous tree species. Tree Physiol. 2017, 37, 456–468. [Google Scholar] [CrossRef] [Green Version]
  25. Han, J.; Chen, J.; Shi, W.; Song, J.; Hui, D.; Ru, J.; Wan, S. Asymmetric responses of resource use efficiency to previous-year precipitation in a semi-arid grassland. Funct. Ecol. 2021, 35, 807–814. [Google Scholar] [CrossRef]
  26. Wu, Y.J.; Ren, C.; Tian, Y.; Zha, T.S.; Liu, P.; Bai, Y.J.; Ma, J.Y.; Lai, Z.R.; Bourque, C.P.A. Photosynthetic gas-exchange and PSII photochemical acclimation to drought in a native and non-native xerophytic species (Artemisia ordosica and Salix psammophila). Ecol. Indic. 2018, 94, 130–138. [Google Scholar] [CrossRef]
  27. Niu, S.; Xing, X.; Zhang, Z.H.E.; Xia, J.; Zhou, X.; Song, B.; Li, L.; Wan, S. Water-use efficiency in response to climate change: From leaf to ecosystem in a temperate steppe. Glob. Chang. Biol. 2011, 17, 1073–1082. [Google Scholar] [CrossRef]
  28. Xie, J.; Zha, T.; Zhou, C.; Jia, X.; Yu, H.; Yang, B.; Chen, J.; Zhang, F.; Wang, B.; Bourque, C.P.A.; et al. Seasonal variation in ecosystem water use efficiency in an urban-forest reserve affected by periodic drought. Agric. For. Meteorol. 2016, 221, 142–151. [Google Scholar] [CrossRef]
  29. Lübbe, T.; Schuldt, B.; Coners, H.; Leuschner, C. Species diversity and identity effects on the water consumption of tree sapling assemblages under ample and limited water supply. Oikos 2016, 125, 86–97. [Google Scholar] [CrossRef]
  30. Wei, H.; Luo, T.; Wu, B. Optimal balance of water use efficiency and leaf construction cost with a link to the drought threshold of the desert steppe ecotone in northern China. Ann. Bot. 2016, 118, 541–553. [Google Scholar] [CrossRef] [Green Version]
  31. Lai, Z.; Zhang, Y.; Liu, J.; Wu, B.; Qin, S.; Fa, K. Fine-root distribution, production, decomposition, and effect on soil organic carbon of three revegetation shrub species in northwest China. For. Ecol. Manag. 2016, 359, 381–388. [Google Scholar] [CrossRef]
  32. United Nations. Transforming Our World: The 2030 Agenda for Sustainable Development; General Assembly Resolution A/RES/70/1; United Nations: New York, NY, USA, 2015. [Google Scholar]
  33. She, W.; Bai, Y.; Zhang, Y.; Qin, S.; Liu, Z.; Wu, B. Plasticity in meristem allocation as an adaptive strategy of a desert shrub under contrasting environments. Front. Plant Sci. 2017, 8, 1933. [Google Scholar] [CrossRef] [Green Version]
  34. Pérez-Harguindeguy, N.; Díaz, S.; Garnier, E.; Lavorel, S.; Poorter, H.; Jaureguiberry, P.; Bret-Harte, M.S.; Cornwell, W.K.; Craine, J.M.; Gurvich, D.E.; et al. Corrigendum to: New handbook for standardised measurement of plant functional traits worldwide. Aust. J. Bot. 2016, 64, 715–716. [Google Scholar] [CrossRef] [Green Version]
  35. Ren, C.; Wu, Y.J.; Zha, T.S.; Jia, X.; Tian, Y.; Bai, Y.J.; Bourque, C.P.-A.; Ma, J.Y.; Feng, W. Seasonal changes in photosynthetic energy utilization in a desert shrub (Artemisia ordosica Krasch.) during its different phenophases. Forests 2018, 9, 176. [Google Scholar] [CrossRef] [Green Version]
  36. Zha, T.-S.; Wu, Y.J.; Jia, X.; Zhang, M.Y.; Bai, Y.J.; Liu, P.; Ma, J.Y.; Bourque, C.P.-A.; Peltola, H. Diurnal response of effective quantum yield of PSII photochemistry to irradiance as an indicator of photosynthetic acclimation to stressed environments revealed in a xerophytic species. Ecol. Indic. 2017, 74, 191–197. [Google Scholar] [CrossRef]
  37. Wright, I.J.; Reich, P.B.; Westoby, M.; Ackerly, D.D.; Baruch, Z.; Bongers, F.; Cavender-Bares, J.; Chapin, T.; Cornelissen, J.H.C.; Diemer, M.; et al. The worldwide leaf economics spectrum. Nature 2004, 428, 821–827. [Google Scholar] [CrossRef] [PubMed]
  38. De la Riva, E.G.; Tosto, A.; Pérez-Ramos, I.M.; Navarro-Fernández, C.M.; Olmo, M.; Anten, N.P.R.; Marañón, T.; Villar, R.; de Bello, F. A plant economics spectrum in Mediterranean forests along environmental gradients: Is there coordination among leaf, stem and root traits? J. Veg. Sci. 2016, 27, 187–199. [Google Scholar] [CrossRef] [Green Version]
  39. Iqbal, S.; Zha, T.; Jia, X.; Hayat, M.; Qian, D.; Bourque, C.P.A.; Tian, Y.; Bai, Y.; Liu, P.; Yang, R.; et al. Interannual variation in sap flow response in three xeric shrub species to periodic drought. Agric. For. Meteorol. 2021, 297, 108276. [Google Scholar] [CrossRef]
  40. Cowan, I.R. Regulation of Water Use in Relation to Carbon Gain in Higher Plants. In Physiological Plant Ecology II; Lange, O.L., Nobel, P.S., Osmond, C.B., Ziegler, H., Eds.; Springer: Berlin/Heidelberg, Germany, 1982; Volume 12/B, pp. 589–613. [Google Scholar]
  41. Sangines de Carcer, P.; Vitasse, Y.; Penuelas, J.; Jassey, V.E.J.; Buttler, A.; Signarbieux, C. Vapor-pressure deficit and extreme climatic variables limit tree growth. Glob. Chang. Biol. 2018, 24, 1108–1122. [Google Scholar] [CrossRef] [Green Version]
  42. Ma, J.; Jia, X.; Zha, T.; Bourque, C.P.A.; Tian, Y.; Bai, Y.; Liu, P.; Yang, R.; Li, C.; Li, C.; et al. Ecosystem water use efficiency in a young plantation in Northern China and its relationship to drought. Agric. For. Meteorol. 2019, 275, 1–10. [Google Scholar] [CrossRef]
  43. Chen, S.; Bai, Y.; Lin, G.; Huang, J.; Han, X. Isotopic carbon composition and related characters of dominant species along an environmental gradient in Inner Mongolia, China. J. Arid Environ. 2007, 71, 12–28. [Google Scholar] [CrossRef]
  44. Wittmer, M.; Auerswald, K.; Tungalag, R.; Bai, Y.F.; Schäufele, R.; Bai, C.H.; Schnyder, H. Carbon isotope discrimination of C3 vegetation in Central Asian Grassland as related to long-term and short-term precipitation patterns. Biogeosciences 2008, 5, 913–924. [Google Scholar] [CrossRef] [Green Version]
  45. Hayat, M.; Zha, T.; Jia, X.; Iqbal, S.; Qian, D.; Bourque, C.P.A.; Khan, A.; Tian, Y.; Bai, Y.; Liu, P.; et al. A multiple-temporal scale analysis of biophysical control of sap flow in Salix psammophila growing in a semiarid shrubland ecosystem of northwest China. Agric. For. Meteorol. 2020, 288–289, 107985. [Google Scholar] [CrossRef]
  46. Chasmer, L.; Mccaughey, H.; Barr, A.; Black, A.; Shashkov, A.; Treitz, P.; Zha, T. Investigating light-use efficiency across a jack pine chronosequence during dry and wet years. Tree Physiol. 2008, 28, 1395–1406. [Google Scholar] [CrossRef] [PubMed] [Green Version]
  47. Garbulsky, M.F.; Peñuelas, J.; Papale, D.; Ardö, J.; Goulden, M.L.; Kiely, G.; Richardson, A.D.; Rotenberg, E.; Veenendaal, E.M.; Filella, I. Patterns and controls of the variability of radiation use efficiency and primary productivity across terrestrial ecosystems. Glob. Ecol. Biogeogr. 2010, 19, 253–267. [Google Scholar] [CrossRef]
  48. Stocker, B.D.; Zscheischler, J.; Keenan, T.F.; Prentice, I.C.; Penuelas, J.; Seneviratne, S.I. Quantifying soil moisture impacts on light use efficiency across biomes. New Phytol. 2018, 218, 1430–1449. [Google Scholar] [CrossRef] [Green Version]
  49. Lü, X.T.; Kong, D.L.; Pan, Q.M.; Simmons, M.E.; Han, X.G. Nitrogen and water availability interact to affect leaf stoichiometry in a semi-arid grassland. Oecologia 2012, 168, 301–310. [Google Scholar] [CrossRef]
  50. Bai, Y.; Zha, T.; Bourque, C.P.A.; Jia, X.; Ma, J.; Liu, P.; Yang, R.; Li, C.; Du, T.; Wu, Y. Variation in ecosystem water use efficiency along a southwest-to-northeast aridity gradient in China. Ecol. Indic. 2020, 110, 105932. [Google Scholar] [CrossRef]
  51. De Bello, F.; Lavorel, S.; Albert, C.H.; Thuiller, W.; Grigulis, K.; Dolezal, J.; Janeček, Š.; Lepš, J. Quantifying the relevance of intraspecific trait variability for functional diversity. Methods Ecol. Evol. 2011, 2, 163–174. [Google Scholar] [CrossRef]
  52. Liu, P.; Black, T.A.; Jassal, R.S.; Zha, T.; Nesic, Z.; Barr, A.G.; Helgason, W.D.; Jia, X.; Tian, Y.; Stephens, J.J.; et al. Divergent long-term trends and interannual variation in ecosystem resource use efficiencies of a southern boreal old black spruce forest 1999–2017. Glob. Chang. Biol. 2019, 25, 3056–3069. [Google Scholar] [CrossRef]
  53. Bloom, A.J.; Chapin, F.S., III; Mooney, H.A. Resource limitation in plants-an economic analogy. Ann. Rev. Ecol. Syst. 1985, 16, 363–392. [Google Scholar] [CrossRef]
  54. Tarvainen, L.; Rantfors, M.; Wallin, G. Vertical gradients and seasonal variation in stem CO2 efflux within a Norway spruce stand. Tree Physiol. 2014, 34, 488–502. [Google Scholar] [CrossRef] [PubMed] [Green Version]
  55. Auzmendi, I.; Marsal, J.; Girona, J.; Lopez, G. Daily photosynthetic radiation use efficiency for apple and pear leaves: Seasonal changes and estimation of canopy net carbon exchange rate. Eur. J. Agron. 2013, 51, 1–8. [Google Scholar] [CrossRef]
  56. Patterson, T.B.; Guy, R.D.; Dang, Q.L. Whole-plant nitrogen- and water-relations traits, and their associated tradeoffs, in adjacent muskeg and upland boreal spruce species. Oecologia 1997, 110, 160–168. [Google Scholar] [CrossRef]
  57. Evans, J.R. Photosynthesis and nitrogen relationships in leaves of C3 plants. Oecologia 1989, 78, 9–19. [Google Scholar] [CrossRef]
  58. Niinemets, Ü.; Tenhunen, J.D. A model separating leaf structural and physiological effects on carbon gain along light gradients for the shade-tolerant species Acer saccharum. Plant Cell Environ. 1997, 20, 845–866. [Google Scholar] [CrossRef]
  59. Niinemets, U.; Keenan, T.F.; Hallik, L. A worldwide analysis of within-canopy variations in leaf structural, chemical and physiological traits across plant functional types. New Phytol. 2015, 205, 973–993. [Google Scholar] [CrossRef] [Green Version]
  60. Carvajal, D.E.; Loayza, A.P.; Rios, R.S.; Delpiano, C.A.; Squeo, F.A.; Cahill, J. A hyper-arid environment shapes an inverse pattern of the fast–slow plant economics spectrum for above-, but not below-ground resource acquisition strategies. J. Ecol. 2018, 107, 1079–1092. [Google Scholar] [CrossRef]
  61. Liu, G.; Freschet, G.T.; Pan, X.; Cornelissen, J.H.; Li, Y.; Dong, M. Coordinated variation in leaf and root traits across multiple spatial scales in Chinese semi-arid and arid ecosystems. New Phytol. 2010, 188, 543–553. [Google Scholar] [CrossRef] [PubMed]
  62. Sperdouli, I.; Moustakas, M. Spatio-temporal heterogeneity in Arabidopsis thaliana leaves under drought stress. Plant Biol. 2012, 14, 118–128. [Google Scholar] [CrossRef]
  63. Brouillette, L.C.; Mason, C.M.; Shirk, R.Y.; Donovan, L.A. Adaptive differentiation of traits related to resource use in a desert annual along a resource gradient. New Phytol. 2014, 201, 1316–1327. [Google Scholar] [CrossRef] [PubMed]
  64. Ivey, C.T.; Carr, D.E. Tests for the joint evolution of mating system and drought escape in Mimulus. Ann. Bot. 2012, 109, 583–598. [Google Scholar] [CrossRef] [PubMed] [Green Version]
  65. Lefcheck, J.S.; Byrnes, J.E.K.; Isbell, F.; Gamfeldt, L.; Griffin, J.N.; Eisenhauer, N.; Hensel, M.J.S.; Hector, A.; Cardinale, B.J.; Duffy, J.E. Biodiversity enhances ecosystem multifunctionality across trophic levels and habitats. Nat. Commun. 2015, 6, 6936. [Google Scholar] [CrossRef] [PubMed]
Figure 1. Map of the study site and its dominant plant cover.
Forests 12 01372 g001
Figure 2. Temporal variation in daily mean air temperature (T, (A)), relative humidity (RH) and water vapor pressure deficit (VPD, (B)), net radiation (Rn) and incident photosynthetically active radiation (PAR, (C)), and soil water content (SWC) and daily total precipitation (PPT, (D)) during a five-month field campaign from 1 May−30 September 2019. The horizontal dashed line in subfigure D represents the 0.10 m3 m−3 threshold assigned for SWC.
Forests 12 01372 g002
Figure 3. Diurnal variation in rates of photosynthesis (Pn, (A)), transpiration (E, (B)), and stomatal conductance (Gs, (C)) for A. ordosica and L. secalinus during a five-month field campaign from 1 May−30 September 2019. Photosynthetic parameters for L. secalinus are missing during the 1−10 May period.
Forests 12 01372 g003
Figure 4. Leaf characteristics, including specific leaf area (SLA, (a)), leaf N concentration by dry weigh (Nmass, (b)), and N concentration per unit leaf area (Narea, (c)) for A. ordosica and L. secalinus during the five-month field campaign from 1 May−30 September 2019.
Forests 12 01372 g004
Figure 5. Seasonal changes in water (A), light (B), and nitrogen use efficiencies (C) (i.e., WUE, LUE, and NUE) in A. ordosica and L. secalinus. Bars indicate standard error of estimate.
Forests 12 01372 g005
Figure 6. Monthly water (A), light (B), and nitrogen use efficiencies (C) (i.e., WUE, LUE, and NUE) from May−September 2109. Bars indicate standard error of estimate.
Forests 12 01372 g006
Figure 7. Relationships between resource use efficiencies (i.e., WUE, LUE, and NUE) during the growing season. Relationships between LUE and WUE (A), WUE and NUE (B), LUE and NUE (C) for A. ordosica and relationships between LUE and WUE (D), WUE and NUE (E), LUE and NUE (F) for L. secalinus. Data points are binned averages, with WUE and LUE specified in increments of 0.2 μmol mmol−1 and 0.002 mol mol−1, respectively. Bars indicate standard error of estimate.
Forests 12 01372 g007
Figure 8. Pairwise correlations of WUE, LUE, and NUE for A. ordosica and L. secalinus; R is the coefficient of correlation and p provides the level of significance.
Forests 12 01372 g008
Figure 9. Pairwise comparisons of WUE, LUE, and NUE for A. ordosica and L. secalinus. Different letters (a and b) indicate statistically significant differences by paired, student t-tests based on a critical probability of 0.01.
Forests 12 01372 g009
Table 1. Results of stepwise regression on the relationships between RUEs and the biophysical factors associated with A. ordosica and L. secalinus.
RUEsModelR2Fp
Artemisia ordosicaWUEy = −1.40VPD–0.71Gs + 3.500.247.55 (1,40)0.002
LUEy = 0.42SWC + 0.08Gs + 0.030.3210.46 (1,40)<0.001
NUEY = 8.99Gs + 2.580.5653.86 (1,40)<0.001
Leymus
secalinus
WUEy = −0.01SLA − 2.98Gs – 1.25VPD + 4.190.378.38 (1,37)<0.001
LUEy = 0.24SWC + 0.16Gs + 1.740.4117.66 (1,37)<0.001
NUEy = 0.02SLA + 3.88Gs + 0.060.3611.46 (1,37)<0.001
R2 is the coefficient of determination, F the F-ratio, and p the level of significance. Numbers in parentheses represent numerator and denominator degrees of freedom.
Publisher’s Note: MDPI stays neutral with regard to jurisdictional claims in published maps and institutional affiliations.

