Article

Deforestation and Biomass Production in Miombo Forest in Huambo (Angola): A Balance between Local and Global Needs

by
Luis M. Miapia
1,
David Ariza-Mateos
2,*,
Virgínia Lacerda-Quartín
1 and
Guillermo Palacios-Rodríguez
2
1
Department of Forest Engineering, Agricultural Sciences Faculty, José Eduardo dos Santos University, Catumbela 13301, Huambo, Angola
2
Depto. Ingeniería Forestal, Laboratorio de Selvicultura, Dendrocronología y Cambio Climático, DendrodatLab-ERSAF, Campus de Rabanales, Universidad de Córdoba, Ctra. N. IV, km. 396, 14071 Córdoba, Spain
*
Author to whom correspondence should be addressed.
Submission received: 8 October 2021 / Revised: 29 October 2021 / Accepted: 4 November 2021 / Published: 11 November 2021
(This article belongs to the Special Issue Adaptive Forest Management to Climatic Change)

Abstract

:
Miombo is one of the most widely distributed ecosystems in Angola, with a great social and environmental value. Thus, the rural population uses the biomass as fuel and miombo provides important ecosystem services, such as its carbon sequestration capacity. The objectives of this work were (i) to assess deforestation in miombo forest in Huambo province (Angola) during the last 20 years, (ii) to evaluate carbon storage capacity of miombo, and (iii) to calculate the charcoal productive capacity of those forests. From 2000 to 2019, 359,130 ha (12.96%) were deforested in Huambo province. Thirty-six woody species were identified as major components of miombo forest, the most frequent being Albizia anthunesiana, Brachystegia spiciformis, Julbernardia paniculata, Monote spp., Brachystegia boemii, Isoberlinea angolensis, Anisophyllea boehmii, Syzygium guineense, and Erythrophleum africanum. The total biomass estimated in miombo forest was 195.05 Mg ha−1 (55.02 Mg ha−1 radical and 140.04 Mg ha−1 area), with a total wood volume of 78.57 m3 ha−1. This represents values of 91.67 Mg ha−1 of accumulated carbon and 336.13 Mg ha−1 of CO2 equivalent. The potential charcoal productivity was 15,359.9 kg ha−1, corresponding to 24.78 trees ha−1. The Annual Allowable Cutting Volume was 10.77 m3 ha−1 year−1, 14.13 m3 ha−1 year−1, 21.17 m3 ha−1, and 32.85 m3 ha−1 year−1 for rotation lengths of 55, 40, 25, and 15 years, respectively, corresponding to a potential annual charcoal productivity of 2107.08 Kg ha−1 year−1, 2762.96 Kg ha−1 year−1, 4139.21 Kg ha−1, and 422.56 Kg ha−1 year−1. However, deforestation rates in the last 19 years and low charcoal productive capacity could compromise the sustainability of the Miombo ecosystem and its value as an ecosystem service provider in the province if appropriate management strategies are not developed.

1. Introduction

Miombo is one of the most important forest ecosystems in southern Africa, covering large areas of Angola, Mozambique, Tanzania, Zimbabwe, Zambia, and the Democratic Republic of Congo, covering between 2.5 to 3.6 million km2 [1]. This ecosystem includes mosaics of dry forests and wooded savannahs, with a high diversity of flora and fauna [2], with medium productivity and high social value in terms of woody fuel, building materials, pasture, food, and medicinal plants [3]. Miombo usually has a multistrata structure: an upper stratum with adult trees between 15 and 18 m tall and a density around 65 trees ha−1; an intermediate stratum with trees between 8 and 12 m tall and a density of 80 trees ha−1; and the lower stratum with saplings, shrubs, and grassland with a height lower than 8 m and a density range between 375 and 500 trees ha−1 [4,5]. The volume varies between 14 and 59 m3 ha−1 in dry Miombo and between 41 and 100 m3 ha−1 in wet Miombo [4], with higher productivity in wet Miombo forests [6].
More than 55% of Angola’s land area is forested, amounting to about 69 Mha, of which 58.6 Mha is Miombo lands, 3.6 Mha correspond to other native forest and plantation forest, and 2.1 Mha of other lands with scattered trees [7,8]. Angolan Miombo is characterized by species of the genus Brachystegia, Julbernardia, and Isoberlinia, [9]. This ecosystem provides many ecosystem services to the rural population, including timber and nontimber products biomass for household energy production (firewood and charcoal), fodder for livestock, medicinal plants, and wild fruits. Water cycle regulation, the reduction of erosion, and the diversity of habitats favoring a high biodiversity are also important ecosystem services of Miombo lands [9]. Estimated data confirm that Miombo forest in Angola has an annual harvest capacity of 326,000 m3 and an average annual commercial timber productivity of 0.3 m3 ha−1 year−1 [7]. In addition, Miombo forests play an important role in atmospheric CO2 sequestration with fixation rates of up to 39.6 MgC ha−1 in above-ground biomass [10]. Thus, under sustainable management criteria, the Miombo could be an important source of economic income and employment, especially in rural areas. However, at present, this ecosystem is under great pressure from the local population, which puts its sustainability at risk, mainly due to some specific deforestation drivers.
In general, there is a differentiation between proximate causes (or drivers) and driving forces (or indirect drivers). Proximate causes are human activities that have a direct influence on the deforestation while driving forces are complex interactions of key social, economic, political, cultural, and technological processes [11]. Several works have assessed deforestation drivers as a tool for decision-making to reduce emissions from deforestation [12]. The main drivers identified in tropical forests are the agriculture expansion [13], urban expansion, infrastructural development, mining activity, and commercial timber exploitation or as fuel (firewood and charcoal), grazing, and forest fires [14].
Studies carried out in sub-Saharan Africa have concluded that the subsistence agriculture is the main driver in the poorest rural populations, often associated with deforestation for charcoal production and/or forest fires [15,16]. Thus, some authors link deforestation to food security, with the most frequent causes being agriculture [17] and exploitation of biomass as fuel [18]. In Angola, the main proximate drivers are the overextraction of timber resources, clearing for agricultural purposes, unregulated burning, and overgrazing [19]. This has led to an increase in deforestation rate from 0.2% in 2000 to 0.8% in the period 2000–2019 [7], compromising the current and future ecosystem services of the Miombo.
Charcoal production is a very important activity in Miombo and is increasingly becoming a lucrative business. Charcoal production in rural areas causes large environmental impact, especially in comparison with that generated by fuelwood, mainly in periurban areas [7]. This activity, which is continuously growing in Africa, is one of the main causes of deforestation and forest degradation both in Africa and Angola [18,20]. One of the main problems related to charcoal production in the Angolan Miombo is the lack of data about the potential productive capacity of this ecosystem. This leads to a lack of tools for assessing admissible annual cut values and, thus, for sustainable management. Some of the tools often used for assessing productive capacity, such as dendrochronology, have not often been used in such studies in tropical forests due to the great diversity of species and the difficulty in assessing annual growth [21]. Previous works have assessed annual growth in Miombo species to determine the annual allowable cutting volume [22]. Therefore, study of the productivity of the Miombo ecosystem is an important tool to increase knowledge about the charcoal production capacity and the annual allowable cutting volume, including the variables in forest management plans to increase the sustainability of this activity.
The aim of this study was to assess the productivity of Miombo ecosystem in Huambo (Angola) to estimate C sequestration and charcoal production capacity. The specific objectives were (i) to assess deforestation in miombo forest in Huambo province (Angola) during the last 20 years, (ii) to evaluate carbon storage capacity of miombo, and (iii) to calculate the charcoal productive capacity of those forests and compare them with the carbon storage capacity. The results obtained will provide information about the charcoal production for the management of miombo woodland resources in Huambo province, ensuring the sustainability of the activity and ecosystem services and improving forest management in a context of vulnerability of the local population. This information could also open up new funding opportunities, facilitating the engagement of rural communities with initiatives for reducing emissions from deforestation, forest degradation, and forest management (REDD+) or Clean Development Mechanisms (CDM) [1,23].

2. Materials and Methods
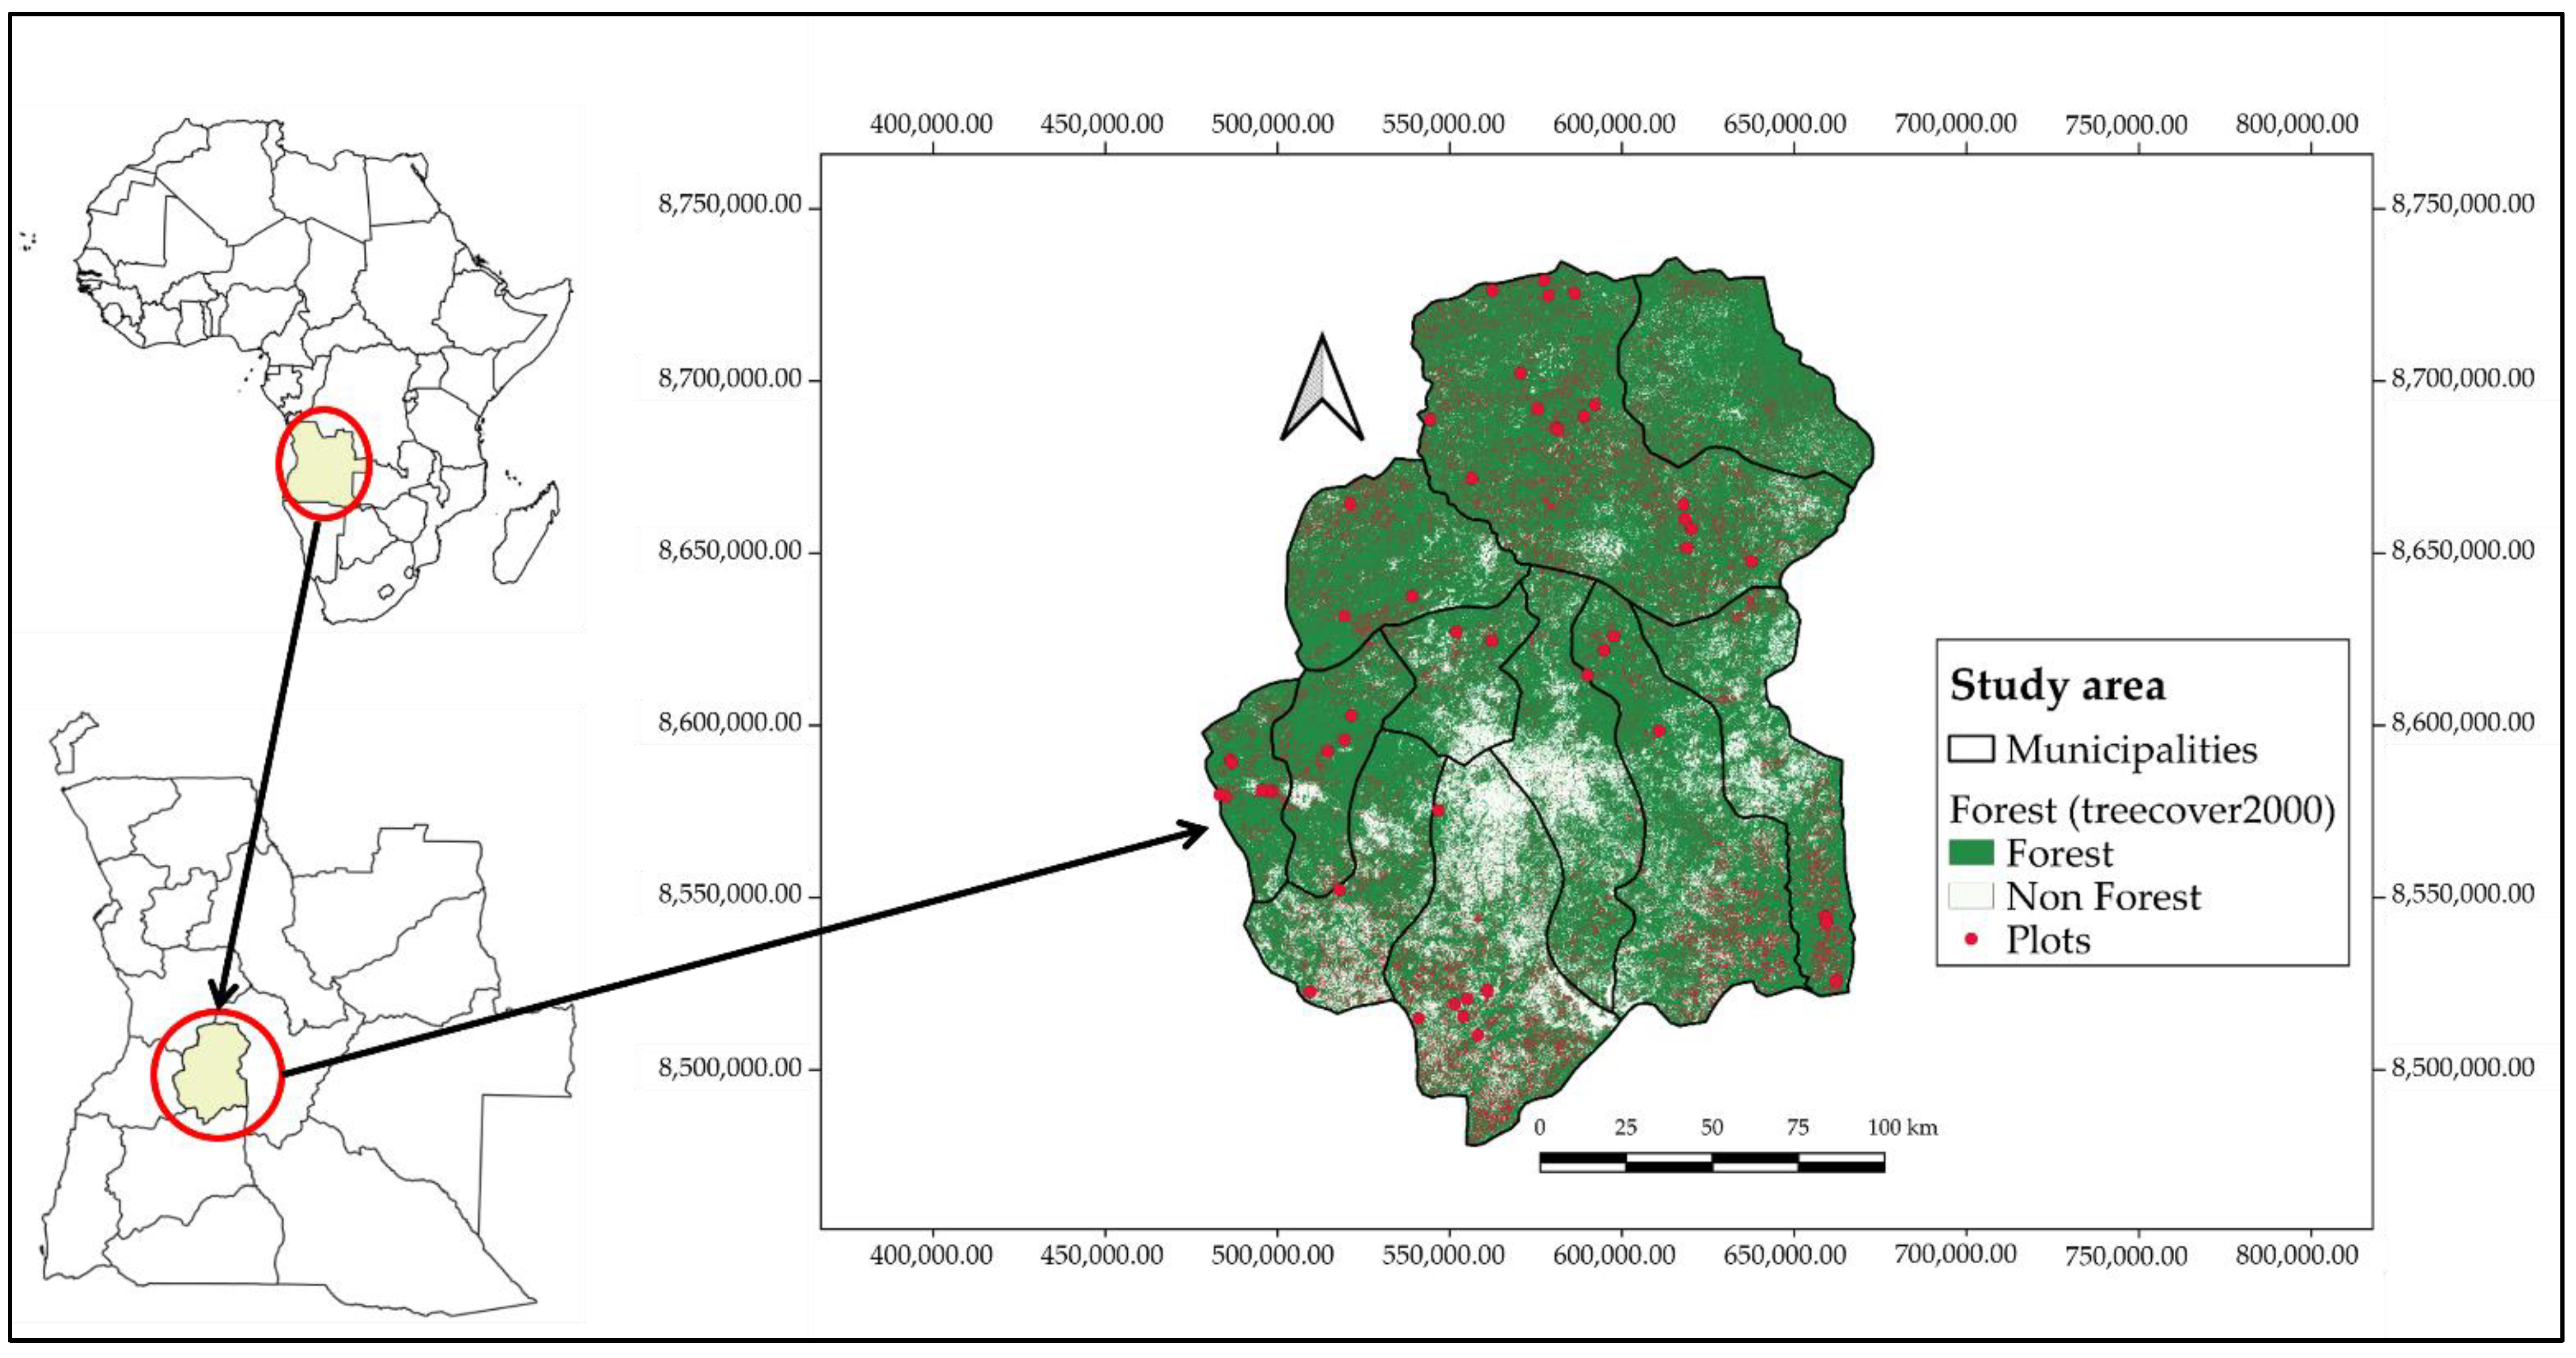
2.1. Study Sites

The study site is located in Huambo province (Angola), which covers an area of 34,270 km2 on the Central Plateau (Figure 1). Huambo is the province with the second-highest stock of biomass in Angola [24]; however, it is one of three provinces with the highest loss of forest cover in the country [25] and has the fifth-highest emissions [26]. In this case, it is not only the number of trees removed that threatens the stability of Miombo forests, but also the deforestation patterns associated with the demand for charcoal and firewood production for cooking and heating [20].
The climate—according to the Thornthwaite classification—is characterized as humid mesotherm, with cold and dry winters from May to September and hot and rainy summers from October to April [27]. The climatology is conditioned by a high altitude (more than 95% of its surface above 1500 m) with an average temperature of 20 °C, maximum temperatures of 25–27 °C, and minimum of 11–13 °C, precipitation of 1366 mm, and relative humidity that varies between 60 and 70% in January and 35 and 70% in August [27]. The predominant soils are of the ferralitic type. According to the Angolan Phytogeographic Chart [28], the province of Huambo is dominated by savanna-type Miombo forests with a high presence of Julbernardia and Brachystegia species with patches of low-density miombo on mesoplanaltic slopes (between the valleys of the Keve and Kwanza rivers) and high-elevation meadows (anharas) on ferralitic and thin soils.

2.2. Experimental Design

Forty-nine permanent plots were established according to stratified sampling into the Huambo province. At each stratum, plots were randomly distributed based on the forest cover phytogeographic map of the Huambo province by Jaxa in 2015 [29], the soil map of Angola [28], and Huambo roads with a buffer of 500 m per side (Open Street Map, 2016). Each plot was georeferenced taking the central coordinates (GPS Garmin MAP 60 csx) and projected according to the UTM projection system. Once each plot was located, a circular plot following the N–S direction of 10 m-radius (314 m2) was laid out using a handheld compass (Suunto KB-14/360R G Compass; Vantaa, Finland) and a 50-m measuring tape (Lufkin®, Apex Tool Group, Querétaro, Mexico) (Figure 1).

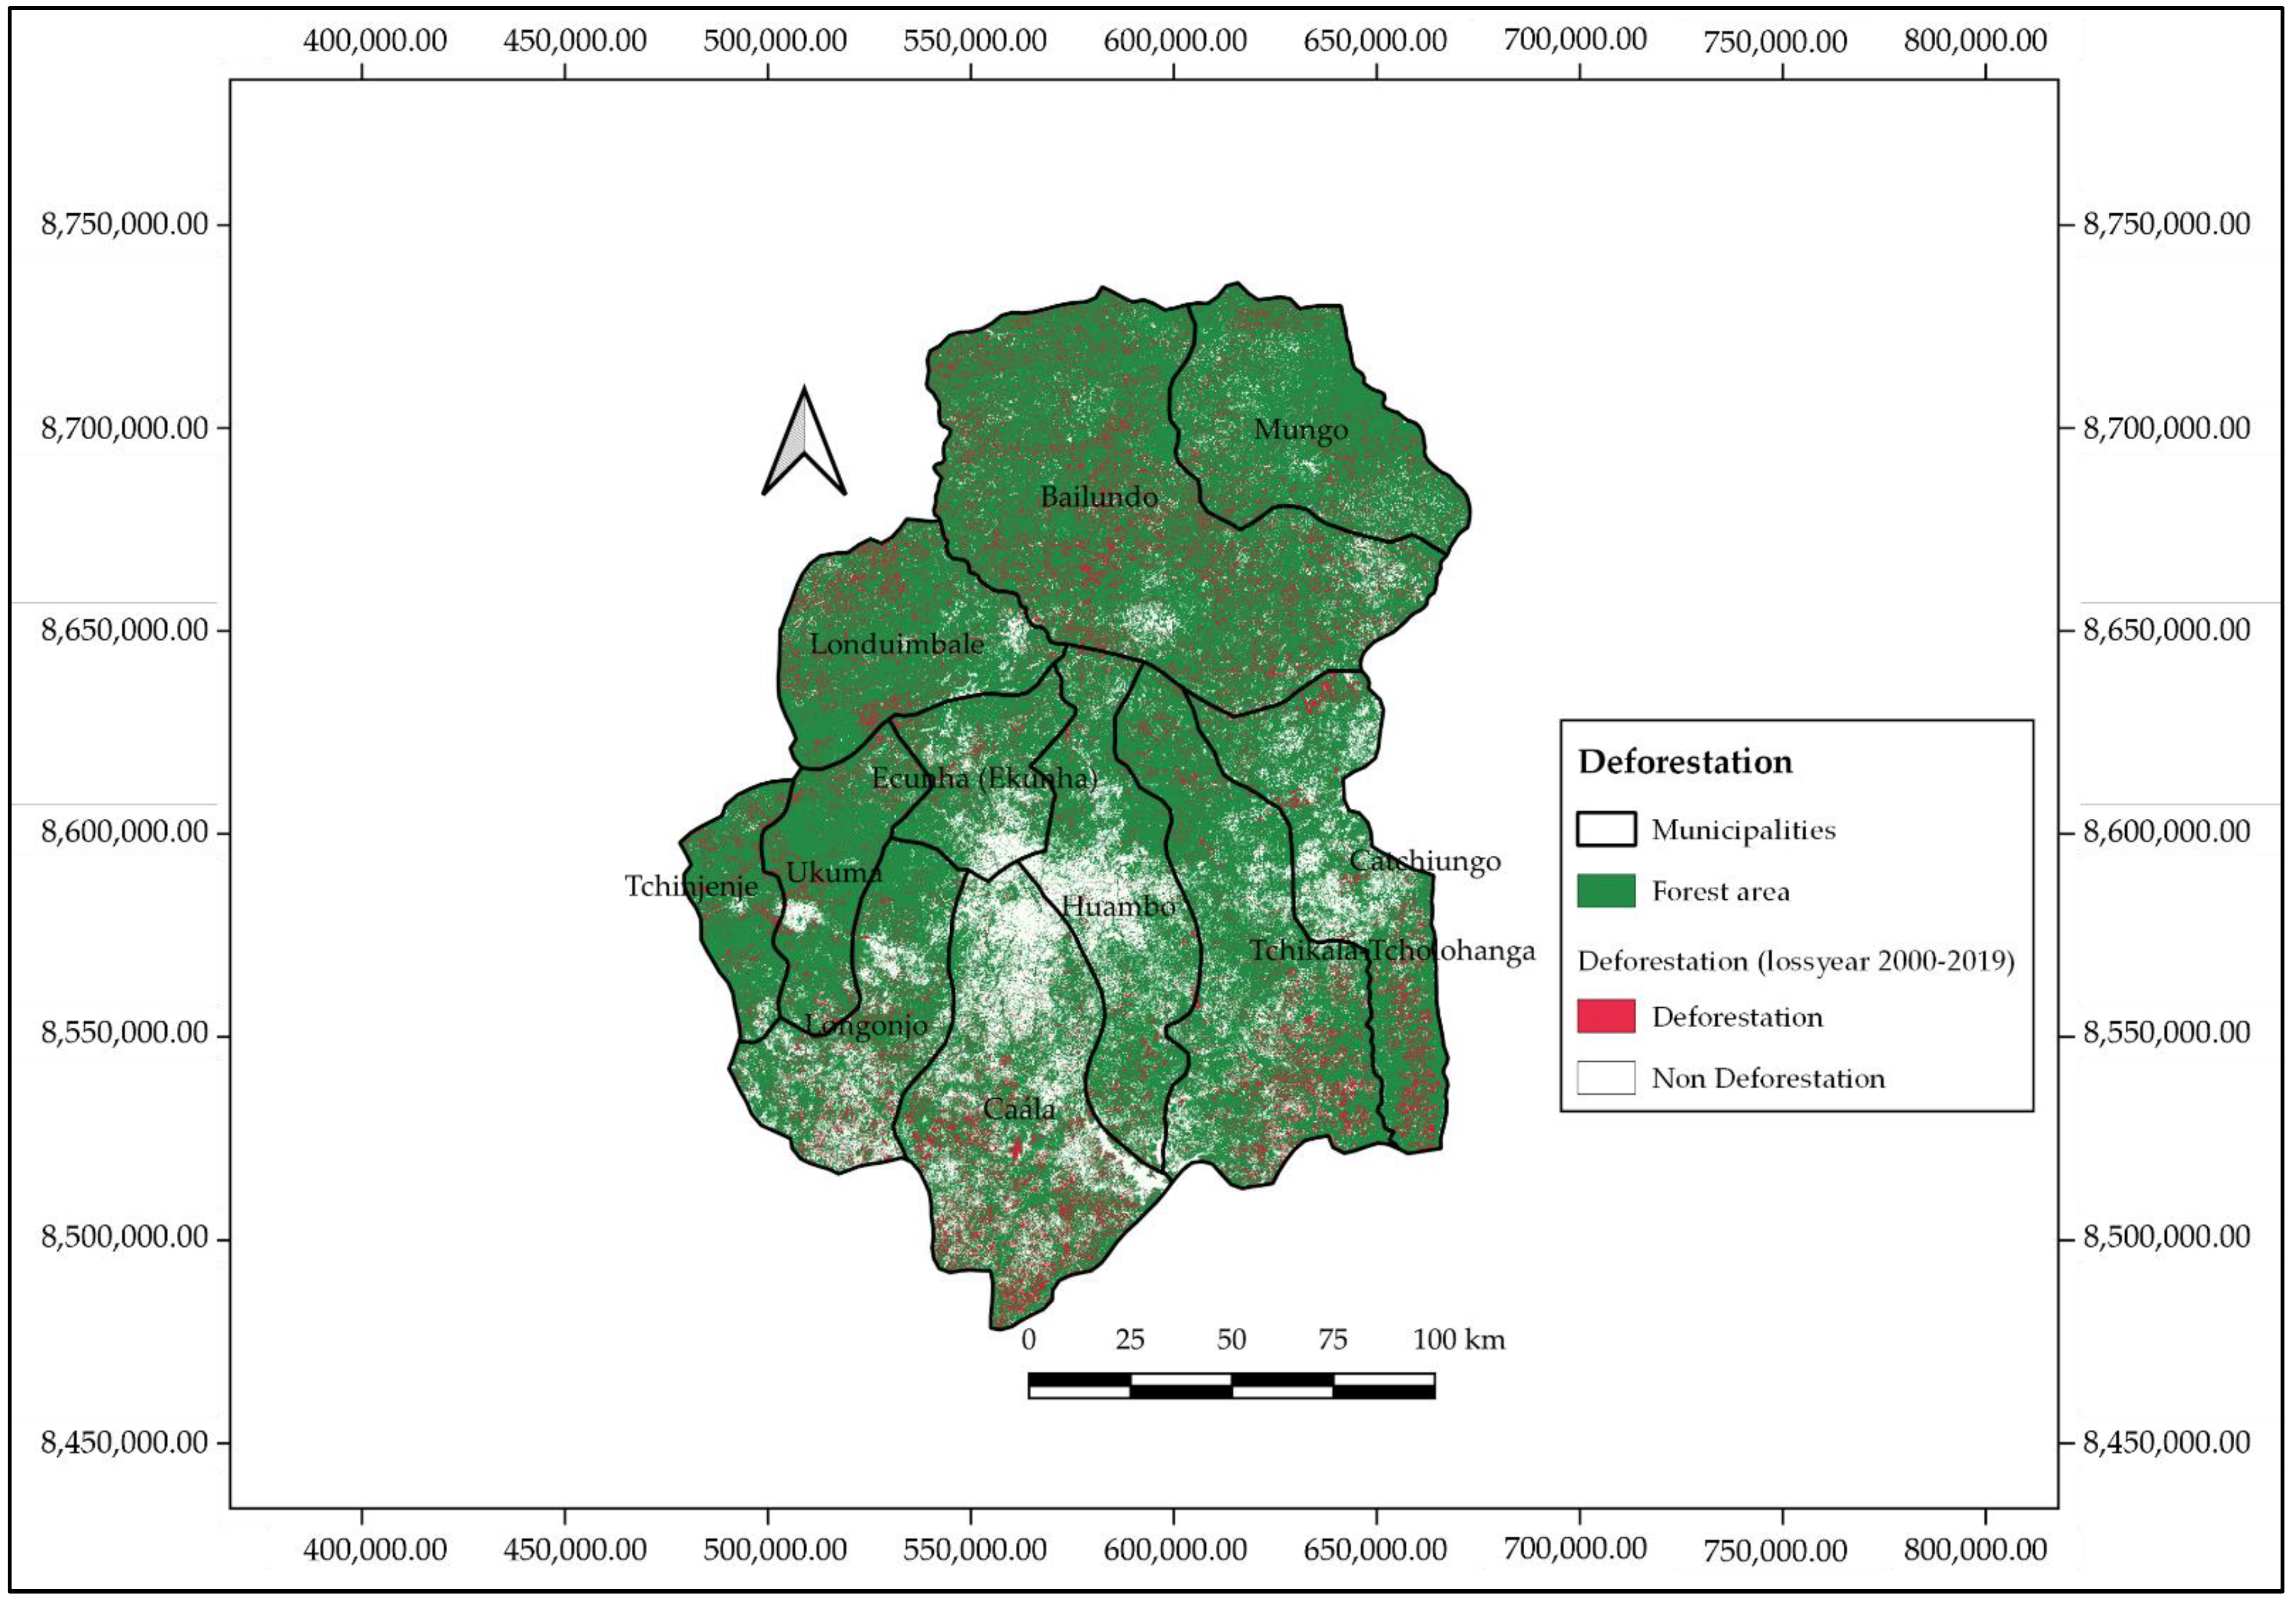
2.3. Deforestation Rate

The “Global Forest Change Data” [30] was used to estimate forest area loss. This dataset provides global forest area and deforestation data with a spatial resolution of 30 m that can be downloaded in raster format from the Google Earth Engine. To assess deforestation in the municipalities of Huambo province, the Treecover2000 coverage was used. The values of accumulated cover loss between 2000 and 2019 were obtained for the same area. This layer was reclassified into two categories (0—area not deforested; 1—area deforested, QGIS, 3.20.3) and the area deforested during the period 2000–2019 was extracted.

2.4. Composition and Structure

All living trees with a diameter at breast height (DBH, 1.3 m above the ground) ≥ 1.5 cm were numbered, species were identified [9,31], and the frequency was calculated. In each plot, DBH (cm, with an accuracy of 0.1 cm, Haglof calipers–Mantax Black), tree height (H, m, with an accuracy of 2 cm, hypsometer Blume-Leiss, Haglöf, Långsele, Sweden), and stand density (N, trees ha−1) were measured.

2.5. Accumulated Carbon and CO2 Equivalent

From dasometric data, above-ground biomass and below-ground biomass (Mg ha−1) were calculated following allometric equations [32]:
Y AGB = 0.0763 × DBH 2.2046   × H 0.4918
Y BGB = 0.1763 × DBH 1.7844   × H 0.3434
YAGB—Above-ground biomass;
YBGB—Below-ground biomass;
DBH—Diameter at breast height;
H—Height.
Further, the volume (V, m3 ha−1) was calculated according to Campbell et al.’s [33] approach in all plots of Huambo province.
V = 6.18 ×   X 0.86
V—Volume;
X—Basimetric area.
The assessment of carbon and CO2 equivalent was carried out in all study plots and by municipality. Biomass was transformed to carbon (C), accepting that 47% of tree biomass is C [34]. Carbon dioxide equivalent (CO2eq) was obtained by multiplying the C accumulated in the biomass by 44/12 [34].

2.6. Productive Capacity

Productive capacity was evaluated according to the methodology developed by Sanfilippo [9] in a work carried out for Miombo species in Angola, which considers the following values:

2.6.1. Potential Charcoal Productivity (PCP)

Potential Charcoal Productivity (PCP) was calculated from the volume of wood available in each plot and the efficiency factor of traditional charcoal production kilns [35].
Y = V w × 0.85 × 0.23 × 1000
Y—Wood productivity expressed in kg;
Vw—Volume of wood;
0.85—Conversion factor from wood fresh volume to woody biomass;
0.23—Conversion factor of efficiency of traditional charcoal production kilns;
1000—Conversion factor from tons to kg [35].

2.6.2. Allowable Cutting Value (ACV)

Allowable Cutting Value (ACV) is defined as the number of trees that can be cut during a productive cycle to ensure stand sustainability assuming a minimum cutting diameter, which in the case of miombo species in Angola, is 15 cm [9]. To determine the ACV, an equation was used that includes the number of trees with Dn above the minimum cutting diameter and the number of trees with a DBH below the minimum cutting diameter [36].
Z = 0.5 Y + 0.2 X
Z—Number of trees that can be cut during the production cycle;
Y—Number of trees with DBH higher than the minimum cutting DBH;
X—Number of trees with DBH lower than the minimum cutting DBH.

2.6.3. Annual Allowable Cut (AAC)

From the ACV value, the Annual Allowable Cut (AAC) was calculated. It is accepted that native species, regardless of species and site quality, have a mean annual increment (MAI) of 2.5 mm, corresponding to a growth cycle (GC) of 40 years [6,37,38]. In the absence of specific data for Angolan Miombo species, four rotation periods were used in this work to achieve the annual allowable cut (15 cm): 55 years (ACV/55), 40 years (ACV/40), 25 years (ACV/25), and 15 years (ACV/15). These assumptions are based on results presented in a work of Miombo species obtained from growth ring analysis [22]. Relative values obtained in each plot were transformed to absolute values expressed in AAC ha−1.

2.6.4. Annual Allowable Cutting Volume (AACV)

AACV was calculated using the volume equation [33] but only with potentially harvestable trees for each rotation length.
V 15 = 6.18 ×   X 15 0.86
V 25 = 6.18 ×   X 25 0.86
V 40 = 6.18 ×   X 40 0.86
V 55 = 6.18 ×   X 55 0.86
where V15, V25, V40, and V55 are the annual allowable cutting volumes for each rotation period and X15, X25, X40, and X55 are the mean basimetric area using only the potentially harvestable trees for each rotation length calculated before (AAC values).

2.6.5. Potential Annual Allowable Charcoal Productivity (PAACP)

From the annual allowable cutting volume (V15, V25, V40, and V55), the Potential Allowable Annual Charcoal Productivity was determined according to the equation developed by [35].
Y 15 = V 15 × 0.85 × 0.23 × 1000
Y 25 = V 25 × 0.85 × 0.23 × 1000
Y 40 = V 40 × 0.85 × 0.23 × 1000
Y 55 = V 55 × 0.85 × 0.23 × 1000
where Y15, Y25, Y40, and Y55 are the Potential Annual Allowable Charcoal Productivity and V15, V25, V40, and V55 are the annual allowable wood volume.

3. Results

3.1. Deforestation

The forest area in Huambo province in 2000 was 2,770,205 ha, of which 359,130 ha (12.96%) were deforested during the period 2000–2019 (Figure 2). The highest levels of deforestation occurred in the municipalities of Caála (20.67%), Bailundo (15.17%), and Longonjo (13.16%); the lowest levels occurred in the municipalities of Huambo and Ecunha, with 8.02% and 8.68% of deforested area, respectively (Table 1).

3.2. Composition and Structure

Forty tree species were found in the study area, of which 36 were identified by their scientific name and 33 by their local name. Two species were not identified by either their local name or scientific name, although they were perfectly discriminated from the rest, so they were identified as independent species. The species with the highest frequencies were Albizia anthunesiana (12.94%), Brachystegia spiciformis (12.28%), Julbernardia paniculata (8.44%), Monote spp. (8.42%), Brachystegia boemii (7.85%), Isoberlinea angolensis (5.88%), Anisophyllea boehmii (5.86%), Syzygium guineense (4.84%), and Erythrophleum africanum (4.50%) (Table S1 in Supplementary Material). The average density of adult trees was 3616.38 trees ha−1. Caála and Tchicala have the highest densities (4747.35 trees ha−1 and 4313.09 trees ha−1, respectively) and Ukuma and Bailundo have the lowest densities (3151.26 trees ha−1 and 3226.16 trees ha−1, respectively) (Table S2 in Supplementary Material).

3.3. Accumulated Carbon and CO2 Equivalent

Total biomass was 195.05 Mg ha−1 (55.02 Mg ha−1 below-ground biomass and 140.04 Mg ha−1 above-ground biomass (Table 2)). The highest biomass values were found in Ukuma and Bailundo (289.85 Mg ha−1 and 218.18 Mg ha−1, respectively), and the lowest in Tchicala and Longonjo (113.03 Mg ha−1 and 157.69 Mg ha−1, respectively) (Table 3, Tables S2 and S3 in Supplementary Material).
The mean wood volume in the Miombo forest was 78.57 m3 ha−1, with the highest values in Ukuma and Caála (96.71 m3 ha−1 and 92.39 m3 ha−1, respectively) and the lowest in Tchingenje and Loundimbale (70.62 m3 ha−1 and 70.88 m3 ha−1, respectively) (Table 3, Tables S2 and S3 in Supplementary Material).
The above-ground accumulated C was 65.82 Mg ha−1 and the below-ground accumulated C was 25.86 Mg ha−1; total accumulated C was 91.67 Mg ha−1 (Table 2). The highest values were found in Ukuma and Bailundo (136.23 Mg ha−1 and 102.55 Mg ha−1, respectively) and the lowest values in Tchicala and Longonjo (53.12 Mg ha−1 and 74.11 Mg ha−1, respectively) (Table 3, Tables S2 and S3 in Supplementary Material). These values correspond to a CO2 equivalent of 336.13 Mg ha−1 (94.81 Mg ha−1 of above-ground CO2eq and 241.32 Mg ha−1 of below-ground CO2eq) (Table 2). The highest values were found in Ukuma and Bailundo (499.51 Mg ha−1 and 376.00 Mg ha−1, respectively) and the lowest values in Tchicala and Longonjo (194.79 Mg ha−1 and 271.75 Mg ha−1, respectively) (Table 3, Tables S2 and S3 in Supplementary Material).

3.4. Productive Capacity

3.4.1. Potential Charcoal Productivity (PCP)

The PCP was 15,359.9 kg ha−1, although the variability between municipalities was very high, ranging from 11,034.87 Kg ha−1 for (Tchicala) to 18,907.60 Kg ha−1 for (Ukuma) (Table 4 and Table S4 in Supplementary Material).

3.4.2. Allowable Cutting Value (ACV)

The ACV was 24.78 trees ha−1, with the lowest values in Londuimbale (22 trees ha−1) and the highest values in Caála (31.57 trees ha−1) (Table 4 and Table S4 in Supplementary Material).
When comparing the biomass carbon storage with the potential charcoal productivity, there is a correlation at the extreme values (Tchicala and Ukuma) despite the correlation coefficient not being very high (0.5).

3.4.3. Annual Allowable Cutting (AAC)

For a rotation period of 55 years, the ACV was 14.31 ± 5,61 trees ha−1 year−1, increasing for shorter periods (40 years, 19.68 ± 7.72 trees ha−1 year−1; 25 years, 31.5 ± 12.35 trees ha−1 year−1; 15 years, 52.5 ± 20.58 trees ha−1 year−1) (Table S5 in Supplementary Material).

3.4.4. Annual Allowable Cutting Volume (AACV)

Values of AAC corresponding to values of AACV of 10.77 ± 6.05 m3 ha−1 year−1, 14.13 ± 7.96 m3 ha−1 year−1, 21.17 ± 11.93 m3 ha−1 year−1, and 32.85 ± 18.51 m3 ha−1 year−1 (55, 40, 25, and 15 years, respectively) (Table S5 in Supplementary Material).

3.4.5. Potential Annual Allowable Charcoal Productivity (PAACP)

The PAACP were 2107.08 ± 1183.53 kg ha−1 year−1, 2762.96 ± 1557.41 kg ha−1 year−1, 4139.21 ± 2333.17 kg ha−1 year−1, and 6422.56 ± 3620.24 kg ha−1 year−1 for the rotation lengths considered (55, 40, 25, and 15, respectively) (Table S5 in Supplementary Material).

4. Discussion

The study of the structure, composition, and forest dynamic is a starting point for designing strategies for the conservation and sustainable management of forest resources in the tropical forests of southern Africa. In this work, deforestation rate, carbon accumulated, and productive capacity of miombo forest on Huambo province were evaluated in order to provide information about the current situation and the future potentiality. This information will be provided to the authorities and local population to improve forest management, ensuring not only forest-based benefits but also their sustainability.

4.1. Deforestation

According to the National Forest Inventory of Angola [24], there is an increase in forest area in the country, but no data are provided by year, nor by provinces, and a comparison is made between current data and data from the 1980s obtained with different methodologies and sources; so, the level of confidence is very low. However, our results showed that in the last 19 years, the deforestation of miombo forests on Huambo province (Angola) was 359,130 ha, which represents an annual rate of 0.68%. These results were particularly worrying in some municipalities such as Caála, Bailundo, Longonjo, and Tchinjenje. The differences in deforestation between the municipalities are conditioned by their proximity to the main roads that carry charcoal to the country’s capital, Luanda, and to the port, Benguela. The municipalities with the least deforestation are those furthest away from the main road (Ecunha and Mungo) and Huambo, the provincial headquarters municipality, with little forestry activity. These data are similar with FAO data (2020), which place Angola among the 10 countries with the highest rate of net forest area change, losing 0.8% annually, similar to other dry forests in regions such as DRC (0.83%), Tanzania (0.88%) [7], Zambia (0.63%) [39], or Mozambique (0.59%) [38]. Despite the decrease in the deforestation rate in the last 5 years, Africa remains the continent with the highest deforestation level [7]. Several studies have identified the main drivers of deforestation [14,40,41]. In Angola, the main causes are associated with the activity of local populations [25], clearing for agricultural purposes [42], overextraction of wood with commercial and energy purposes [43,44], and unregulated burning [45,46], identified as the main drivers of this deforestation. In Huambo province, deforestation is associated with the demand for charcoal and firewood production for cooking and heating [11]. In fact, charcoal demand is having a particularly adverse impact on the natural Miombo woodlands of Huambo Province, leading to losses in forest stock, biodiversity, and opportunities for rural livelihoods.
Due to this high dependence between the economic activities of the local population and deforestation, there is a need to improve forest governance for the sustainable management of the Miombo.

4.2. Composition and Structure

Forty species were identified in miombo forests, with a higher frequency of species from the Fabaceae family (45.71%). These data coincide with previous results for Miombo forest [47]. The species with the higher frequencies were Albizia anthunesiana, Brachystegia spiciformis, Julbernardia paniculata, Monote spp., Brachystegia boemii, Isoberlinea angolensis, Anisophyllea boehmii, Syzygium guineense, and Erythrophleum africanum, coinciding with previous studies conducted in the Central Plateau of Angola [9]. The mean density in the forests studied was very high (3616.38 trees ha−1), with values higher than Miombo from other countries in the region [10,48,49,50]. Some municipalities show a high density due the plots coincided in private properties, in which forest management plans exist and, therefore, there has been no suppression of adult trees in recent years. These data should be used for the implementation of miombo management zoning according to density, as proposed by other authors [8].

4.3. Accumulated Carbon and CO2 Equivalent

The biomass and volume values found in Huambo province were similar to those found in other miombo forests in Angola [8,37]. The high biomass accumulation in this forest type implies a high C sequestration capacity, with values similar to those found by other authors in the region [51], though higher than values obtained in other degraded Miombo formations of Mozambique [2,38], Zambia and Zimbabwe [52], and Tanzania [53,54]. Further, the above-ground accumulated C in the most-degraded miombo forest of Huambo is higher than other Miombo forests in the central and southern region of Africa [10,55,56]. CO2 equivalent values were similar to miombo forest in Zambia [51], although higher than other studies in the region [38,57]. Other works have shown that when miombo is properly managed (conservation, e.g., in reserves), these values can increase, reaching up to 845 Mg ha−1 in areas with little human intervention [58].

4.4. Productive Capacity

Determining the amount of wood that an ecosystem can sustainably provide is very important for a country’s economy. This applies to both commercial wood and wood used as biofuel (fuelwood and charcoal). In the case of charcoal, production is conditioned by several factors, including the potential charcoal productivity and the annual allowable cut to be considered a sustainable activity, which—in this work—was translated into annual allowable cut volume and annual allowable potential charcoal productivity. Internationally, there are not many works of this type on Miombo forests, although there are some studies carried out in other African savanna ecosystems [6,59]. In the study area, the potential charcoal productivity in the Miombo forest was similar to that found in other works in the Huambo province [37], although below that reported in other works carried out on Miombo in other areas [9]. When comparing the biomass, the accumulated C, and the CO2 equivalent values with the potential charcoal productivity and allowable cutting values, there is correlation at the extreme values, which suggests that a greater conservation of tree cover would allow a greater use of resources for energy purposes.
The most common assumption for the Miombo in Angola is an ideal rotation length of 40 years [9,37]. With this assumption, the Annual Allowable Cutting (AAC) (19.6 ± 7.72 trees ha−1 year−1) and Annual Allowable Cutting Volume (AACV) (14.13 ± 7.96 m3 ha−1 year−1) shows very low values, coinciding with previous works in Angola [9,37]. This result shows a greater degradation of Miombo in Huambo in relation to other provinces of the country. Within Huambo, even though average values were presented in this work, there was a great variability according to the municipality. In fact, the Potential Annual Allowable Charcoal Productivity (PAACP) ranged from 761.84 kg ha−1 to 11,063.62 kg ha−1, the average being 2762.96 kg ha−1, far above that of the municipality of Caála [37]. Reducing the cutting shift to the minimum (15 years) presented the highest value of harvestable trees per hectare and year. Even in this case, the volume of sustainably explored wood was 9.29 m3 ha−1 year−1, with just 32 trees ha−1 year−1 and a potential annual allowable charcoal productivity of 6422.55 kg ha−1 year−1. For all hypotheses evaluated, results are far below those of cuttings currently carried out by the rural communities of the municipalities studied. Therefore, the activity of cutting wood for charcoal and firewood production is currently unsustainable.

5. Conclusions

Deforestation and forest degradation account for 17.4% of the world’s greenhouse gas emissions [60]. Despite the lack of official data, Angola’s contribution to global emissions is not very high, being ranked 88th out of 211 countries assessed [61] with a contribution of the LULUCF sector of 37.4% [62]. For this reason, it is important to develop works to know the capacity of the country’s forest systems to sequester and store carbon. Although progress is currently being made in this regard, there are not too many works carried out in Angola, so this work has relevance for the development of conservation strategies. An appropriate conservation strategy is including Miombo areas in carbon credit projects—REDD+, CDM, etc.—which could generate economic incentives for forest conservation, promoting the need to conserve miombo forests to ensure the regulation ecosystem service [63]. However, for the development of these projects, information about forest stock and CO2 sequestration is needed [51]. This work can contribute to the baseline (FRL) that Angola must establish to its Intended Nationally Determined Contribution (INDC). Carbon sequestered and CO2eq in the miombo forest of Huambo province is higher than other degraded Miombo ecosystems in the sub-Saharan region. These values could be exploited to develop projects to generate carbon credits—REDD+, CDM, etc.—which could generate economic incentives for forest conservation, especially in municipalities with higher C sequestered and CO2eq, such as Bailundo, Ukuma, and Ekunha. However, the high rate of deforestation in the last 19 years and the consequent low productive capacity could compromise this ecosystem service of the miombo in the short term. It is, therefore, necessary to develop forest management plans to reduce deforestation, especially in Bailundo, Caála, and Longonjo municipalities, where the highest deforestation rates are found.
Furthermore, looking at the Potential Charcoal Productivity (PCP), the Allowable Cutting Value (ACV), and the Potential Annual Allowable Charcoal Productivity (PAACP) in each municipality, regardless of the rotation lengths, it is necessary to establish protection and conservation figures in all municipalities because the charcoal production activity is currently not sustainable.

Supplementary Materials

The following are available online at https://0-www-mdpi-com.brum.beds.ac.uk/article/10.3390/f12111557/s1. Table S1. Identified species with local names, scientific names, and frequency of each species. Table S2. Density, diameter at breast height (DBH), height, above-ground biomass (AGB), below-ground biomass (BGB), total biomass, volume, above-ground accumulated Carbon (AGC), below-ground accumulate Carbon (BGC), total accumulate Carbon (TC), above-ground CO2eq (AGCO2eq), below-ground CO2eq (BGCO2eq), and total CO2eq (TCO2eq) by plot. Table S3. Above-ground biomass (AGB), below-ground biomass (BGB), total Biomass (TB), volume, above-ground accumulated Carbon (AGC), below-ground accumulated Carbon (BGC), total accumulated Carbon (TC), above-ground CO2eq, below-ground CO2eq, and total CO2eq by municipality. Table S4. Potential Charcoal Productivity (PCP) and Allowable Cutting Value (ACV) by plot. Table S5. Annual Cutting Value (ACV), Annual Allowable Cut Volume (AACV), and Potential Annual Allowable Charcoal Productivity (PAACP) for the rotation lengths considered (55, 40, 25, and 15 years).

Author Contributions

L.M.M., D.A.-M. and G.P.-R. planned and designed the research. L.M.M. and G.P.-R. conducted fieldwork. L.M.M., D.A.-M., V.L.-Q. and G.P.-R. contributed to data elaboration and analysis. L.M.M. and D.A.-M. wrote the manuscript, with contributions from all authors. All authors have read and agreed to the published version of the manuscript.

Funding

This research was funded by the Southern African Science Service Centre for Climate Change and Adaptive Land Management (SASSCAL) through the project “Deforestation monitoring in Huambo province from 2002–2012 using detection technologies and geographic information systems (GIS)-Task 137”.

Conflicts of Interest

The authors declare no conflict of interest.

References

  1. Ribeiro, N.S.; Syampungani, S.; Matakala, N.; Nangoma, D.; Barros, A. Miombo Woodlands Research towards the Sustainable Use of Ecosystem Services in Southern Africa. In Biodiversity in Ecosystems-Linking Structure and Function; Yueh-Hsin, L., Blanco, J., Shovonlal, J., Eds.; InTech: Rijeka, Croatia, 2015; pp. 475–491. [Google Scholar] [CrossRef] [Green Version]
  2. Ryan, C.; Williams, M.; Grace, J. Above and Belowground Carbon Stocks in a Miombo Woodland Landscape of Mozambique. Biotropica 2011, 43, 423–432. [Google Scholar] [CrossRef] [Green Version]
  3. Sanfilippo, M. Trinta árvores e arbustos do miombo angolano. In Guia de Campo Para a Identificação; COSPE: Kwanza Sul, Angola, 2013; p. 76. [Google Scholar]
  4. Frost, P. The ecology of Miombo woodlands. In The Miombo in Transition: Woodlands and Welfare in Africa; Campbell, B., Ed.; Center for International Forestry Research (CIFOR): Bongor, Indonesia, 1996; pp. 11–55. [Google Scholar]
  5. Abdallah, J.M.; Monela, G.G. Overview of Miombo Woodlands in Tanzania. Working Papers of the Finnish Forest Research Institute 2007. Available online: https://www.researchgate.net/publication/255586366_Overview_of_Miombo_Woodlands_in_Tanzania (accessed on 25 June 2017).
  6. Marzoli, A. Inventário florestal nacional. In Avaliação Florestal Integrada de Moçambique; Ministério da Agricultura: Maputo, Mozambique, 2007; p. 82. [Google Scholar]
  7. FAO. Global Forest Resources Assessment Main Report; FAO: Roma, Italia, 2020. [Google Scholar] [CrossRef]
  8. Chiteculo, V.; Surovy, P. Dynamic patterns of trees species in miombo forest and management perspectives for sustainable production—case study in Huambo Province, Angola. Forests 2018, 9, 321. [Google Scholar] [CrossRef] [Green Version]
  9. Sanfilippo, M. Inventário Florestal da Área Comunitária de Canjombe, Município da Cela; COSPE: Kwanza Sul, Angola, 2014; p. 64. [Google Scholar]
  10. Kalaba, F.K.; Quinn, C.; Dougill, A.J.; Vinya, R. Floristic composition, species diversity and carbon storage in charcoal and agriculture fallows and management implications in miombo woodlands of Zambia. Ecol. Manag. 2013, 304, 99–109. [Google Scholar] [CrossRef] [Green Version]
  11. Chowdhury, R.R. Driving forces of tropical deforestation: The role of remote sensing and spatial models. Singap. J. Trop. Geogr. 2006, 27, 82–101. [Google Scholar] [CrossRef]
  12. Hosonuma, N.; Herold, M.; De Sy, V.; De Fries, R.S.; Brockhaus, M.; Verchot, L.; Romijn, E. An assessment of deforestation and forest degradation drivers in developing countries. Environ. Res. Lett. 2012, 7, 044009. [Google Scholar] [CrossRef]
  13. Carr, D.L. Proximate population factors and deforestation in tropical agricultural frontiers. Popul. Environ. 2004, 25, 585–612. [Google Scholar] [CrossRef] [Green Version]
  14. Jayathilake, H.M.; Prescott, G.W.; Carrasco, L.R. Drivers of deforestation and degradation for 28 tropical conservation landscapes. Ambio 2020, 7, 13259. [Google Scholar] [CrossRef]
  15. Rudel, T.K.; Rudel, T.K. The national determinants of deforestation in sub-Saharan Africa. Philos. Trans. R. Soc. B-Biol Sci. 2013, 368, 20120405. [Google Scholar] [CrossRef] [Green Version]
  16. Bowers, S.; Ryan, C.; Jones, H. Understanding agricultural drivers of deforestation through remote sensing: Opportunities and limitations in sub-Saharan Africa. In IIED Working Paper; IIED: London, UK, 2017. [Google Scholar]
  17. Ordway, E.M.; Asner, G.P.; Lambin, E.F. Deforestation risk due to commodity crop expansion in sub-Saharan Africa. Environ. Res. Lett. 2017, 12, 044015. [Google Scholar] [CrossRef]
  18. Bamwesigye, D.; Hlavackova, P.; Darkwah, S.A.; Verter, N. Deforestation, Climate Change and Food Security Nexus in Sub-Sahara Africa: Content Analysis; MDPI: Basel, Switzerland, 2019. [Google Scholar] [CrossRef]
  19. Chiteculo, V.; Abdollahnejad, A.; Panagiotidis, D.; Surový, P.; Sharma, R.P. Defining deforestation patterns using satellite images from 2000 and 2017: Assessment of forest management in miombo forests-A case study of Huambo Province in Angola. Sustainability 2019, 11, 98. [Google Scholar] [CrossRef] [Green Version]
  20. Chiteculo, V.; Lojka, B.; Surový, P.; Verner, V.; Panagiotidis, D.; Woitsch, J. Value Chain of Charcoal Production and Implications for Forest Degradation: Case Study of Bié Province, Angola. Environments 2018, 5, 113. [Google Scholar] [CrossRef] [Green Version]
  21. Munalula, F.; Seifert, T.; Meincken, M. Inter-annual growth response of three Miombo tree species to climatic effects. South. For. J. For. Sci. 2020, 82, 135–147. [Google Scholar] [CrossRef]
  22. Syampungani, S.; Chirwa, P.W.; Akinnifesi, F.K.; Sileshi, G.; Ajayi, O.C. The miombo woodlands at the cross roads: Potential threats, sustainable livelihoods, policy gaps and challenges. Nat. Resour. Forum 2010, 33, 150–159. [Google Scholar] [CrossRef]
  23. Ferrer, V.R.; Köthke, M.; Lippe, M.; Günter, S. Scale and context dependency of deforestation drivers: Insights from spatial econometrics in the tropics. PLoS ONE 2020, 15, e0226830. [Google Scholar] [CrossRef]
  24. Inventário Florestal Nacional. IDF-Instituto de Desenvolvimento Florestal; Inventário Florestal Nacional: Luanda, Angola, 2018. [Google Scholar]
  25. Mendelsohn, J.M. Landscape changes in Angola. In Biodiversity of Angola. Science & Conservation: A Modern Synthesis; Huntley, B.J., Russo, V., Lages, F., Ferrand, N., Eds.; Springer: Berlin/Heidelberg, Germany, 2009. [Google Scholar]
  26. Ariza, D.; Moyano, A.; De la Higuera, M.; Lara, M.A.; Palacios, G. Linha de Base de Emissões de Gases de Efeito Estufa Para Floresta, Mudança do Uso da Terra e Carvão Vegetal para Angola; MCTA: Luanda, Angola, 2020. [Google Scholar]
  27. Cabral, A.I.R.; Vasconcelos, M.J.; Ooma, D.; Sardinha, R. Spatial dynamics and quantification of deforestation in the central-plateau woodlands of Angola (1990–2009). Appl. Geogr. 2011, 11, 1185–1193. [Google Scholar] [CrossRef]
  28. Barbosa, L. Carta Fitogeográfica de Angola; Instituto de Investigação Científica de Angola: Luanda, Angola, 2009; p. 242. [Google Scholar]
  29. FAO/Unesco. Generalized Soil Map of Angola According to Soil Units for the Soil Map of the World. FAO/Unesco Project. 1970. Available online: http://www.fao.org/soils-portal/soil-survey/soil-maps-and-databases/fao-soil-legacy-maps/details%20/en%20/en/ (accessed on 25 June 2017).
  30. Hansen, M.C.; Potapov, P.V.; Moore, R.; Hancher, M.; Turubanova, S.A.; Tyukavina, A.; Thau, D.; Stehman, S.V.; Goetz, S.J.; Loveland, T.R. High-Resolution Global Maps of 21st-Century Forest Cover Change. Science 2013, 342, 850–853. [Google Scholar] [CrossRef] [PubMed] [Green Version]
  31. Smith, P.; Allen, Q. Field Guide to the trees and shrubs of the miombo woodlands. Royal. Bot. Gard. Kew. 2004, 12, 176. [Google Scholar]
  32. Mugasha, W.A.; Eid, T.; Bollandsås, O.M.; Malimbwi, R.E.; Chamshama, S.A.O.; Zahabu, E.; Katani, J.Z. Allometric models for prediction of above- and belowground biomass of trees in the miombo woodlands of Tanzania. For. Ecol. Manag. 2013, 310, 87–101. [Google Scholar] [CrossRef]
  33. Campbell, B.M.; Angelsen, A.; Cunningham, A.; Katerere, Y.; Sitoe, A.; Wunder, S. Miombo Woodlands–Opportunities and Barriers to Sustainable Forest Management; Center for International Forestry Research (CIFOR): Bongor, Indonesia, 2007. [Google Scholar]
  34. IPCC. Guidelines for National Greenhouse Gas. Inventories, Prepared by the National Greenhouse Gas. Inventories Programme; Eggleston, H.S., Buendia, L., Miwa, K., Ngara, T., Tanabe, K., Eds.; IGES: Kanagawa, Japan, 2006. [Google Scholar]
  35. Malimbwi, R.E.; Zahabu, E.; Monela, G.C.; Misana, J.; Jambiya, G.C.; Mchome, B. Charcoal Potential of Miombo Woodlands at Kitulangalo, Tanzania. J. Trop. For. Sci. 2005, 17, 197–210. Available online: http://0-www-jstor-org.brum.beds.ac.uk/stable/23616567 (accessed on 5 June 2021).
  36. Wright, H.L. Yield Determination in Tropical Moist Forest. In a Workshop on Humid and Semi-Humid Tropical Forest Yield Regulation with Minimal Data; OFI Occasional Papers ; Wright, H.L., Alder, D., Eds.; University of Oxford, Department of Plant Sciences, Oxford Forestry Institute: Oxford, UK, 2000; pp. 3–14. [Google Scholar]
  37. Bahu, A.M. A Comercialização do Carvão Vegetal Versus Insustentabilidade Das Florestas Naturais Baseado Num Estudo De caso Nas Aldeias De Nazaré E Calombo Nos Municípios De Longonjo E Caála, Província Do Huambo, Angola. Mestrado Em Agronomia E Recursos Naturais—Faculdade De Ciências Agrárias. Universidade José Eduardo Dos Santos/Instituto Superior de Agronomia, Portugal. Repositorio da Universidade. 2015. Available online: https://www.repository.utl.pt/handle/10400.5/13103 (accessed on 6 October 2021).
  38. MITADER. Inventário florestal nacional. In Relatório Final; MITADER: Maputo, Moçambique, 2018; p. 118. [Google Scholar]
  39. Nansikombi, H.; Fischer, R.; Kabwe, G.; Günter, S. Exploring patterns of forest governance quality: Insights from forest frontier communities in Zambia´s Miombo ecoregion. Land Use Policy 2020, 99, 104866. [Google Scholar] [CrossRef]
  40. Geist, H.J.; Lambin, E.F. Proximate causes and underlying driving forces of tropical deforestation. Bio Sci. 2002, 52, 143–150. [Google Scholar] [CrossRef]
  41. Brink, A.B.; Eva, H.D. Monitoring 25 years of land cover change dynamics in Africa: A sample based remote sensing approach. Appl. Geogr. 2009, 16, 501–512. [Google Scholar] [CrossRef]
  42. Wallenfang, J.; Finckh, M.; Oldeland, J. Impact of shifting cultivation on dense tropical woodlands in southeast Angola. Trop. Conserv. Sci. 2015, 8, 863–892. [Google Scholar] [CrossRef] [Green Version]
  43. Schneibel, A.; Stellmes, M.; Röder, A.; Finckh, M.; Revermann, R.; Frantz, D.; Hill, J. Evaluating the trade-off between food and timber resulting from the conversion of Miombo forests to agricultural land in Angola using multi-temporal Landsat data. Sci. Total Environ. 2016, 548–549, 390–401. [Google Scholar] [CrossRef]
  44. Temudo, M.P.; Cabral, A.I.; Talhinhas, P. Urban and rural household energy consumption and deforestation patterns in Zaire province, Northern Angola: A landscape approach. Appl. Geogr. 2020, 119, 102207. [Google Scholar] [CrossRef]
  45. Catarino, S.; Romeiras, M.M.; Figueira, R.; Aubard, V.; Silva, J.; Pereira, J. Spatial and temporal trends of burnt area in Angola: Implications for natural vegetation and protected area management. Diversity 2020, 12, 307. [Google Scholar] [CrossRef]
  46. Pelletier, J.; Paquette, A.; Mbindo, K.; Zimba, N.; Siampale, A.; Chendauka, B.; Roberts, J.W. Carbon sink despite large deforestation in African tropical dry forests (miombo woodlands). Environ. Res. Lett. 2018, 13, 094017. [Google Scholar] [CrossRef] [Green Version]
  47. Nanvonamuquitxo, S.; Rojas, F.; Hofiço, N.S. Estructura y composición florística de un bosque de Miombo en el distrito de Mocuba, Mozambique. Rev. Cuban. Cienc. For. 2017, 5, 140–152. [Google Scholar]
  48. Backeus, I.; Pettersson, B.; Strömquist, L.; Ruffo, C. Tree communities and structural dynamics in miombo (Brachystegia-Julbernardia) woodland, Tanzania. For. Ecol. Manag. 2006, 230, 171–178. [Google Scholar] [CrossRef]
  49. Giliba, R.A.; Boon, E.K.; Kayombo, C.J.; Musamba, E.B.; Kashindye, A.M.; Shayo, P.F. Species composition, richness and diversity in Miombo woodland of Bereku Forest Reserve, Tanzania. J. Biodivers. 2011, 2, 1–7. [Google Scholar] [CrossRef]
  50. Ribeiro, N.S.; Matos, C.N.; Moura, I.R.; Washington-Allen, R.A.; Ribeiro, A.I. Monitoring vegetation dynamics and carbon stock density in miombo woodlands. Carb. Bala. Manag. 2013, 8, 1–9. [Google Scholar] [CrossRef] [Green Version]
  51. Handavu, F.; Syampungani, S.; Sileshi, G.W.; Chirwa, P.W. Aboveground and belowground tree biomass and carbon stocks in the miombo woodlands of the Copperbelt in Zambia. Carb. Manag. 2021, 33, 1–15. [Google Scholar] [CrossRef]
  52. Chirwa, P.W.; Adeyemi, O. Deforestation in Africa: Implications on Food and Nutritional Security. In Zero Hunger Encyclopedia of the UN Sustainable Development Goals; Leal Filho, W., Azul, A.M., Brandli, L., Özuyar, P.G., Wall, T., Eds.; Springer: Berlin/Heidelberg, Germany, 2020. [Google Scholar] [CrossRef]
  53. Jew, E.; Dougill, A.; Sallu, S.M.; O’Connell, J.; Benton, T.G. Miombo woodland under threat: Consequences for tree diversity and carbon storage. For. Ecol. Manag. 2016, 361, 144–153. [Google Scholar] [CrossRef] [Green Version]
  54. Mayes, M.; Mustard, J.; Melillo, J.; Neill, C.; Nyadzi, G. Going beyond the green: Senesced vegetation material predicts basal area and biomass in remote sensing of tree cover conditions in an African tropical dry forest (miombo woodland) landscape. Environ. Res. Lett. 2017, 12, 085004. [Google Scholar] [CrossRef] [Green Version]
  55. Williams, M.R.C.M.; Ryan, C.M.; Rees, R.M.; Sambane, E.; Fernando, J.; Grace, J. Carbon sequestration and biodiversity of re-growing miombo woodlands in Mozambique. For. Ecol. Manag. 2008, 254, 145–155. [Google Scholar] [CrossRef]
  56. Munishi, P.K.T.; Mringi, S.; Shirima, D.D.; Linda, S.K. The Role of the Miombo Woodlands of the Southern Highlands of Tanzania as Carbon Sinks. J. Ecol. Nat. Environ. 2010, 2, 261–269. [Google Scholar]
  57. Malunguja, G.K.; Devi, A.; Kilonzo, M.; Rubanza, C.D. Climate change mitigation through carbon dioxide (CO2) sequestration in community reserved forests of northwest Tanzania. Arch. Agric. Environ. Sci. 2020, 5, 231–240. [Google Scholar] [CrossRef]
  58. Missanjo, E.; Thole, G.K.; Ndema, A. Biomass and Carbon Stock Estimation for Miombo Woodland in Selected Part of Chongoni Forest Reserve, Dedza, Malawi. Int. J. For. Hort. 2015, 1, 12–17. Available online: https://www.arcjournals.org/international-journal-of-forestry-and-horticulture/volume-1-issue-1/3 (accessed on 5 June 2021).
  59. Adam, Y.; Klaey, A.; Machele, J. Relatório do Trabalho de Campo nas Concessões COMADEL e a FMJ, Cabo Delgado; Center for Development and Environment (CDE): Cabo Delgado, Maputo, 2011. [Google Scholar]
  60. Kapinga, K.; Syampungani, S.; Kasubika, R.; Yambayamba, A.M.; Shamaoma, H. Species-specific allometric models for estimation of the above-ground carbon stock in miombo woodlands of Copperbelt Province of Zambia. For. Ecol. Manag. 2018, 417, 184–196. [Google Scholar] [CrossRef]
  61. Crippa, M.; Oreggioni, G.; Guizzardi, D.; Muntean, M.; Schaaf, E.; Lo Vullo, E.; Vignati, E. Fossil CO2 and GHG Emissions of all world Countries; Publication Office of the European Union: Luxemburg, 2019. [Google Scholar] [CrossRef]
  62. USAID Greenhouse Gas Emissions in Angola. 2019. Available online: https://www.climatelinks.org/sites/default/files/asset/document/2019_USAID_Angola%20GHG%20Factsheet.pdf (accessed on 5 June 2021).
  63. Day, M.; Gumbo, D.; Moombe, K.B.; Wijaya, A.; Sunderland, T. Zambia Country Profile: Monitoring, Reporting and Verification for REDD+; Occasional Paper 113; Center for International Forestry Research (CIFOR): Bongor, Indonesia, 2014. [Google Scholar]
Figure 1. Distribution of miombo plots in the Huambo province (Angola). Forest area corresponds to the year 2000.
Forests 12 01557 g001
Figure 2. Deforestation in Huambo province. Forest area in 2000 (treecover2000); deforested area and non-deforested area from 2000 to 2019.
Forests 12 01557 g002
Table 1. Deforestation in Huambo province. Forest area in 2000 (ha); deforested area from 2000 to 2019 expressed in ha and as a percentage.
MunicipalityForest Area 2000 (ha)Deforestation (ha)Deforestation (%)
Bailundo662,026100,44915.17
Caála270,14655,82620.67
Cathiungo225,17526,56811.80
Ecunha113,31198378.68
Huambo205,78016,5118.02
Londuimbali241,02530,93112.83
Longonjo177,23223,32513.16
Mungo280,71925,5339.10
Tchikala358,48244,21112.33
Tchinjenje82,76510,78813.03
Ukuma153,54315,1519.87
Total2,770,205359,13012.96
Table 2. Biomass, accumulated Carbon, and CO2 equivalent in the Miombo of Huambo province expressed in Mg ha−1.
VariableAbove-GroundBelow-GroundTotal
Biomass 1140.04 ± 108.59
(24.68–716.41)
55.02 ± 31.69
(14.68–209.55)
195.05 ± 140.14
(39.36–925.96)
Accumulated Carbon 265.82
(11.60–336.71)
25.86 ± 14.89
(6.90–98.48)
91.67
(18.50–435.20)
CO2 equivalent 3241.32
(42.53–1234.61)
94.81
(25.30–361.12)
336.13
(67.84–1595.74)
1 Total biomass, above-ground biomass, and below-ground biomass expressed in Mg ha−1. 2 Total accumulated Carbon, above-ground Carbon, and Below-ground Carbon expressed in Mg ha−1. 3 Total CO2 eq., above-ground CO2 eq., and below-ground CO2 eq. expressed in Mg ha−1. For each variable, the mean value and standard deviation of all plots of Huambo province are included; further, maximum and minimum values found in plots are included.
Table 3. Biomass, volume, accumulated Carbon, and CO2 equivalent by municipality. Mean values expressed in Mg ha−1 and standard deviation are presented in the table.
MunicipalityTotal Biomass 1Volume 2Accumulated C 3CO2eq 4
Bailundo218.18 ± 214.3579.09 ± 36.01102.55 ± 100.75376.00 ± 369.40
Caála177.10 ± 75.4292.39 ± 46.7383.24 ± 35.45305.21 ± 129.98
Ekunha212.01 ± 49.7272.86 ± 27.1699.65 ± 23.37365.37 ± 85.68
Katchiungo178.48 ± 46.6683.87 ± 5.4983.88 ± 21.93307.58 ± 80.42
Londuimbale181.23 ± 42.1170.88 ± 12.1485.18 ± 19.79312.32 ± 72.57
Longonjo157.69 ± 55.7577.24 ± 17.7374.11 ± 26.20271.75 ± 96.08
Tchicala113.03 ± 58.7456.44 ± 23.1553.12 ± 27.61194.79 ± 101.23
Tchingenje184.29 ± 112.7270.62 ± 26.2886.62 ± 52.98317.59 ± 194.26
Ukuma289.85 ± 6.7496.71 ± 10.48136.23 ± 3.17499.51 ± 11.62
1 Total biomass, expressed in Mg ha−1. 2 Wood volume, expressed in m3 ha−1. 3 Total accumulated Carbon, expressed in Mg ha−1. 4 Total CO2 eq., expressed in Mg ha−1. For each variable, the mean value and standard deviation by municipality are included.
Table 4. Potential Charcoal Productivity (PCP) and Allowable Cutting Value (ACV) by municipality. Mean values and standard deviation of PCP expressed in Kg ha−1 are included. Mean values and standard deviations of ACV expressed in number of trees ha−1 are included.
Municipality1 PCP (Kg ha−1)2 ACV (N. Trees ha−1)
Bailundo15,461.62 ± 7040.9223.06 ± 5.41
Caála18,061.42 ± 9136.6331.57 ± 21.69
Ekunha14,245.06 ± 5310.4925.50 ± 3.54
Kacthiungo16,395.84 ± 1073.1724.75 ± 4.79
Londuimbale13,857.53 ± 2373.4822.00 ± 1.00
Longonjo15,100.04 ± 3465.8525.00 ± 4.24
Tchicala11,034.87 ± 4525.1727.50 ± 11.12
Tchingenje13.806.39 ± 5136.8722.43 ± 5.91
Ukuma18,907.60 ± 2048.3322.67 ± 4.51
1 Mean values and standard deviations of PCP expressed in Kg ha−1. 2 Mean values and standard deviation of ACV expressed in number of trees ha1.
Publisher’s Note: MDPI stays neutral with regard to jurisdictional claims in published maps and institutional affiliations.

