Article

Growth Recovery and Phenological Responses of Juvenile Beech (Fagus sylvatica L.) Exposed to Spring Warming and Late Spring Frost

by
Kristine Vander Mijnsbrugge
1,*,
Jessa May Malanguis
2,
Stefaan Moreels
1,
Amy Lauwers
1,
Arno Thomaes
1,
Luc De Keersmaeker
1 and
Kris Vandekerkhove
1
1
Department of Forest Ecology and Management, Research Institute for Nature and Forest, 9500 Geraardsbergen, Belgium
2
Natural Sciences and Mathematics, University of the Philippines, Visayas Tacloban College, 6500 Tacloban City, Philippines
*
Author to whom correspondence should be addressed.
Submission received: 27 October 2021 / Revised: 15 November 2021 / Accepted: 17 November 2021 / Published: 20 November 2021
(This article belongs to the Special Issue Vulnerability of Forests to Climate Variability and Change)

Abstract

:
Global change increases the risk of extreme climatic events. The impact of extreme temperature may depend on the tree species and also on the provenance. Ten provenances of Fagus sylvatica L. were grown in a common garden environment in Belgium and subjected to different temperature treatments. Half of the one year old seedlings were submitted to a high thermal stress in the spring of the first year, and all plants were exposed to a late spring frost in the second year. The high-temperature treated plants displayed reduced growth in the first year, which was fully compensated (recovery with exact compensation) in the second year for radial growth and in the third year for height growth. Frost in the spring of the second year damaged part of the saplings and reduced their growth. The frost damaged plants regained the pre-stress growth rate one year later (recovery without compensation). The high temperature treatment in the first year and the frost damage in the second year clearly influenced the phenological responses in the year of the event and in the succeeding year. Little population differentiation was observed among the provenances for growth and for phenological responses. Yet, a southern provenance, a non-autochthonous provenance (original German provenance that was planted in Belgium about a century ago) and a more continental provenance flushed earlier than the local Atlantic provenances in the year of the frost event, resulting in more frost damage. Some caution should therefore be taken when translocating provenances as an anticipation of the predicted climate warming.

1. Introduction

Higher global temperatures and increasing extreme weather events are predicted to happen in the near future due to climate change [1,2]. Over the past decades, the temperature gradient between the arctic and the tropics has been diminishing by climate warming, with an intensified warming of the arctic compared to the rest of the northern hemisphere [3]. This has caused a retarding and increased meandering of the northern hemisphere jet stream, which has been linked with increasing frequency of extreme weather events in the mid-latitudes [4,5,6].
Forests play a key role in controlling climate change, as they cover about 30% of the Earth’s land surface [7] and are a substantial terrestrial carbon sink [8]. At the same time, forests are also increasingly vulnerable to climate change. Not only the raising global temperatures but also the more frequent extreme climatic events will affect forests [9]. This can increase stress in individual trees and ultimately result in an altered composition and structure of forests. The ability of a population of trees to withstand environmental change depends on its phenotypic plasticity (traits responding to a varying environment) and on the genetic diversity [10]. Especially for economically and ecologically important tree species, it is relevant to study genetic differentiation and phenotypic plasticity, as the predicted climate will influence their growth and competitive performance. A major concern is that migration and adaptive evolution of forest trees are slower than needed to keep pace with the current and predicted climate change [11]. Therefore, phenotypic plasticity may well be the most important capacity for trees, as long living organisms, to cope with the current evolutionary rapid speed of climate change [12].
Beech (Fagus sylvatica L.) is a widespread tree species in European temperate forests, with a range reaching from Scandinavia to the Mediterranean, and being dominantly present in Central and Western European forests [13]. It is a long-lived late-successional climax species in many forests, and it is very shade-tolerant and grows relatively fast. Because beech has a broad eco-physiological niche, it has been suggested that beech dominated forests may resist climate change in the humid and cool Atlantic area of its range. Still, recent modeling of the range shifts of beech under climate change scenarios has resulted in contradictory findings and conclusions [14,15], in particular in the center of its present area. This could indicate that our knowledge of the sturdiness of beech related to climate change is still inadequate for accurate predictions. Phenotypic plasticity and evolutionary adaptability in beech may have been underestimated in the past [16], justifying research on adaptive responses of key functional traits [17]. Phenotypic plasticity has already been documented for several traits in beech, including growth [18], leaf anatomy [19] and bud burst [20,21].
Trees adapt to their local environments by tuning the timing of their bud burst in spring as a trade-off between an early start of carbon assimilation while minimizing chances of exposure to late frosts. In general, a warmer climate will lead to a longer growing season for beech, mainly by an earlier bud burst [22]. Unless water is a limiting factor, this will result in increased productivity [23]. Elevated temperatures in spring may favor growth, but in conditions with limited water supply, this may also result in drought stress, resulting in lower carbon fixation [24].
Climate change not only results in elevated mean temperatures in spring, but also increases the risk of late spring frost events, particularly in Europe and Asia [25,26,27]. Late spring frosts are rare but may heavily impact forest ecosystems as they can negatively affect, both directly and indirectly, tree survival, growth, regeneration and stem form [28,29]. For instance, radial growth in central European beech was reduced by 90% due to late spring frosts [30]. Late spring frosts can heavily damage newly emerging leaves, which results in a drop of photosynthetic activity, followed by a decline in the stocks of nutrients [31]. These effects may become more frequent and provoke aggravated damage to newly unfolding leaves, as spring phenology is currently advancing in central Europe [32]. Several studies showed that late flushing trees are less susceptible to late spring frosts in Eastern Europe, both for oak [26,33] and for beech [34,35,36].
Natural selection allows provenances of tree species to adapt to local site conditions [37], resulting in genetic differentiation between provenances for adaptive traits along environmental gradients [38]. Genetic differentiation between provenances is typically studied in common gardens [39], where provenances originating from different sites are grown together in the same environment, so that inter-provenance differences can be attributed to a genetic cause. For instance, in a common garden study of 77 Swiss beech provenances, the climate-driven population differentiation was found to be stronger for the phenological responses bud burst and leaf senescence than for growth traits [40]. Bud burst was analyzed in different provenances of beech planted in 13 different common gardens throughout Europe, and the results showed that the bud burst timing followed gradual changes according to South–North, East–West and low–high elevational gradients [41].
Based on experiments of herbivory in grasses, a terminology has been put forward to classify the types of recovery after a stress event [42], which can be applied more generally (Figure 1). Recovery with exact compensation occurs when an affected growth trait in treated plants is compensated by enhanced growth after the stress event so that after a certain amount of time, the trait regains the level of the control plants [42]. Recovery without compensation indicates that the trait does not compensate for the lost amount of growth during the stress period but does regain the pre-stress level of the growth rate [42]. Damage (no recovery) occurs when the pre-stress growth rate is not attained anymore after the stress period [42].
Climate change will increase the frequency of extreme climatic events, and the impact on tree growth is species (and provenance) dependent [43]. The aim of this study was to investigate how growth and phenological responses (i.e., altered bud burst and leaf senescence) of beech seedlings responded to an elevated spring temperature regime and a spring frost event. For this experiment, beech seedlings from different provenances were reared in a common garden without water limitation. We analyzed the following questions: (i) Does an elevated spring temperature influence growth and phenological responses in beech seedling in the same and the following years? (ii) Does a late spring frost influence growth and phenological responses in beech seedling in the same and the following years? (iii) Do the provenances respond differently to the stress events?

2. Materials and Methods

2.1. Seed Collection and Germination of Plants

F. sylvatica seeds were collected in the autumn of 2016 at eight sites in Belgium, one in The Netherlands and one in Spain (Table 1). Seeds were collected underneath several mother trees at each site, within 2 m of the stem to avoid mixture with seeds from neighboring trees. The Belgian samples included six autochthonous (local) provenances and two non-autochthonous (non-local) provenances. A mother tree was considered to belong to an autochthonous and thus local provenance if the tree was over 200 years old, and located in an ancient woodland site. The two sampled non-autochthonous and thus non-local provenances had mother trees of German origin (precise origin unknown), imported and planted in the 1920s as part of WWI war reparations. From the six local Belgian provenances, four had a home site that was characterized by an Atlantic climate, which is typical for the northern part of Belgium, and two a continental climate that is more typical for the southern part of Belgium (Table 1). The provenances sampled in Spain (alpine climate, 1270 m above sea level) and in the Netherlands (Atlantic climate) were both autochthonous and thus local at their home sites.
Mean monthly maximum and minimum temperature and mean monthly precipitation at the growth sites of the provenances is shown in Figure 2 (data from WorldClim [44]). For the two non-local provenances with German origin, the data of the actual growth site in Belgium is shown.
Seeds were sown in pots using standard nursery potting soil (organic matter 20%, pH 5.0–6.5, electrical conductivity (EC) of 450 µS/cm, dry matter 25%, 1.5 kg/m3 powdered compound fertilizer NPK 12 + 14 + 24). They were kept in an open greenhouse (a greenhouse without walls) at the nursery of the Research Institute of Nature and Forest in Geraardsbergen, Belgium. In 2017, up to 10 germinated seedlings were retained for each mother tree, resulting in 311 seedlings in total (Table 2). The emerged seedlings were transferred to propagation trays for forest tree seedlings, using the same standard nursery potting soil, and kept in the open greenhouse during the first growing season, with an automatically regulated grey shade net protecting the plants against strong sunlight.

2.2. Temperature Treatment in the Spring of 2018 and Late Spring Frost in 2019

At the end of 2017, the seedlings were divided in two groups (155 and 156 plants each), with the seedlings from each mother tree being equally partitioned among the two groups (Table 2). Within each group, the seedlings from the different provenances were spatially randomized in the propagation trays. On 20 February 2018, the seedlings were brought to two separate greenhouse chambers and were submitted to two temperature regimes. One chamber was heated while the other was not (on average 5.2 °C difference, Figure S1). Seedlings were kept in the chambers till leaves were fully unfolded for all the plants, which was on 24 April 2018. After the temperature treatment, all seedlings were brought to the open greenhouse.
In January 2019, the seedlings were transferred to 1-litre pots using standard nursery potting soil. The pots were placed on a container field with automatic watering at the Research Institute for Agriculture, Fisheries and Food, located in Melle, Belgium. All plants were again individually intermingled. Because of a storm in the beginning of March 2019, 21 plants lost their label and had to be excluded from the trial. Therefore, the total amount of plants from 2019 onwards was 290 (Table 2). Temperatures dropped below 0 °C in the mornings of 13 and 14 April 2019, and frost damage quickly became visible on part of the plants as leaves wilted and turned brown and some new shoots died away (Tables S1 and Table 2). Daily minimum temperatures from a weather station in Destelbergen (9 km distance) are shown in Figure S2. In January 2020, all plants were transferred to 4-L pots using standard nursery potting soil. All plants were once more individually intermingled and remained on the same container field in 2020.
Plant height and stem diameter 1 cm above soil level were measured in the winters of 2017–2018, 2018–2019, 2019–2020 and 2020–2021 (Figure 3).
Bud burst was scored about weekly in the springs of 2018, 2019 and 2020 following a 5 level protocol (1: winter buds, 2: buds swollen, 3: first green leaves protruding but still folded, 4: leaves unfolding, 5: leaves unfolded, Figure 3). In 2018 (in the greenhouse chamber experiment), bud burst was scored on 19 and 26 March, and on 3, 9, 17 and 20 April. In 2019, bud burst scores were given on 29 March and on 4 and 10 April. Scoring was performed in 2020 on 6, 8, 10 and 13 April.
Leaf senescence was scored in the autumns of 2018, 2019 and 2020 according to a 5 level protocol (1: green leaves, 2: light green leaves, 3: yellowing leaves, 4: leaves turning brown, 5: brown leaves fallen off, Figure 3). Scores were given on 28 September and 16 October 2018, on 12 September and 15 October 2019 and finally on 14 September and 2 October 2020.
The relative leaf chlorophyll content was measured in a non-destructive way with a chlorophyll content meter (CCM-200, Edaphic Scientific, Melbourne, Australia). This instrument measures optical absorbance of leaf samples in two different wavebands: 653 nm (chlorophyll) and 931 nm (near infra-red). The result is a relative chlorophyll content, which is the ratio of optical transmission at 931 nm to optical transmission at 653 nm. For this measurement, the first fully developed and damage free leaf at the top shoot of a seedling was chosen. The relative chlorophyll content was measured in 2019 on 8 May, 11 June, 29 July, 20 August, 16 September, 10 October and 7 November. The dataset of the relative chlorophyll content measurements was split into two sets, one from 8 May to 29 July in which the CC values were linear, and one with the data measured after this date, when the relative chlorophyll content values decreased non-linearly.
Spring frost damage was observed as absence or presence of damage on young emerging leaves and shoot tips: wilted brown leaves or part of the leaves and/or new shoot tips that become brown and curled down.

2.3. Statistical Analysis

The statistical analyses were performed in the open source software R version 3.6.1 [45] using mixed modelling. We looked at the responses of the plants (growth, phenology and relative chlorophyll content) to two stress events: the temperature treatment in 2018 (T: cold or warm) and the late spring frost in 2019 (Fr: frost damage present or absent). The phenological observations and the relative chlorophyll content measurements were scored at different dates. Therefore, the day of observation (D) was added to these models. The height of the plants was also included in the phenological models, with H1 as the height at the end of 2017 till H4 as the height at the end of 2020. Finally, the provenance (P: ten provenances) was added to the models. The local provenance “Sonian” was set as the standard provenance to which the others were compared. When provenance was significant in a model, differential responses among the provenances upon the stress events were looked at by adding an interaction term between provenance and the stress event. The models without and with interaction term were compared using AIC (Akaike Information Criterion) to allow selection of the best fitted model. A unique identity code for each mother tree was added in the random parts of all the models, and, if needed, an individual plant identity code was also added to account for different observations on the same plants.
Plant height and stem diameter were modelled using linear mixed models in the package lme4 [46].
Plant height and stem diameter (H1 and D1, respectively) at the end of the first growing season were calculated as follows:
H1 = αH1 + βPH1P
D1 = αD1 + βPD1P
The growth increments of plant height and stem diameter during the second growing season (Hi2 and Di2, respectively) were calculated as follows:
Hi2 = αHi2 + βPHi2P + βTHi2T + βH1Hi2H1
Di2 = αDi2 + βPDi2P + βTDi2T + βH1Di2H1
The growth increments of plant height and stem diameter during the third growing season (Hi3 and Di3, respectively) were calculated as follows:
Hi3 = αHi3 + βPHi3P + βTHi3T + βFrHi3Fr + βH2Hi3H2
Di3 = αDi3 + βPDi3P + βTDi3T + βFrDi3Fr + βH2Di3H2
The growth increments of plant height and stem diameter during the fourth growing season followed the same structure as the increment models of the third growing season, with starting height H3 instead of H2.
The phenological observations belonged to a data type with ordered levels. Therefore, models were built with cumulative logistic regression, available in the package ordinal [47]. The function “clmm” in this package fits cumulative link mixed models to ordinal data. The cumulative probability of the ith observation having the jth level of the response variable or a level below the jth level is modelled. Thus, the cumulative probability (p) is the chance to maximally have reached a given level of the ordinal response variable.
The bud burst observations were ordered in reverse (from 5 to 1), whereas for leaf senescence, the scores were ordered in a normal chronological way (from 1 to 5). Reversing the levels of bud burst data allowed for an easier understanding of the modeled probabilities. A probability of having reached a maximal score of 3 in a bud burst response variable then meant a chance to have reached a score of 5, 4 or 3. Thus, plants displaying early bud burst (higher score levels than other plants at a given time) had a higher modelled probability of having reached a score of 5, 4 or 3 than the others.
Bud burst in the spring of 2018 is as follows:
log(p1/(1−p1)) = αTrp1 − βDp1D − βTp1T − βDTp1DT − βH1p1H1 − βPp1P
where αTrp1 is an estimated threshold value for the passing on from one level of the ordinal bud burst variable to the next. A significant interaction term between day of observation (D) and the temperature treatment (T) indicated that the duration of the bud burst process differed between the warm and the cold conditions.
Leaf senescence in 2018 and bud burst in 2019 were modelled using a similar model structure as for bud burst in 2018. Plant height at the end of 2017 (H1) was replaced by the plant height at the end of 2018 (H2).
log(p2/(1−p2)) = αTrp2 − βDp2D − βTp2T − βDTp2DT − βH2p2H2 − βPp2P
Frost damage (Fr) was added in the fixed part, and plant height at the end of 2018 was replaced by plant height in 2019 (H3) for the modelling of the leaf senescence scores in 2019 and the bud burst scores in 2020:
log(p3/(1−p3)) = αTrp3 − βDp3D − βTp3T − βH3p3H3 − βPp3P − βFrp3Fr
Leaf senescence in 2020 was modelled using the same model structure as for bud burst in 2020, but with plant height at the end of 2020 (H4) instead of 2019 (H3).
log(p4/(1−p4)) = αTrp4 − βDp4D − βTp4T − βH4p4H4 − βPp4P − βFrp4Fr
The relative leaf chlorophyll content (C) was modelled using linear mixed models in the package lme4 [46]. The model for the linear part of the relative chlorophyll content measurements was as follows:
C1 = αC1 + βDC1D + βTC1T + βH2C1H2 + βPC1P + βFrC1Fr
The model for the non-linear part of the relative chlorophyll content measurements followed a similar structure as the model for the linear part, but with a quadratic term for day (D) to account for the non-linear decrease in relative chlorophyll content in autumn.
C2 = αC2 + βDC2D + βD2C2D2 + βTC2T + βH2C2H2 + βPC2P + βFrC2Fr
The presence/absence of frost damage on the plants was modelled with a general linear mixed model (logistic regression). The chance for displaying visual frost damage symptoms was as follows:
log(p5/(1−p5)) = αp5 + βT p5T + βH2 p5H2 + βPp5P

3. Results

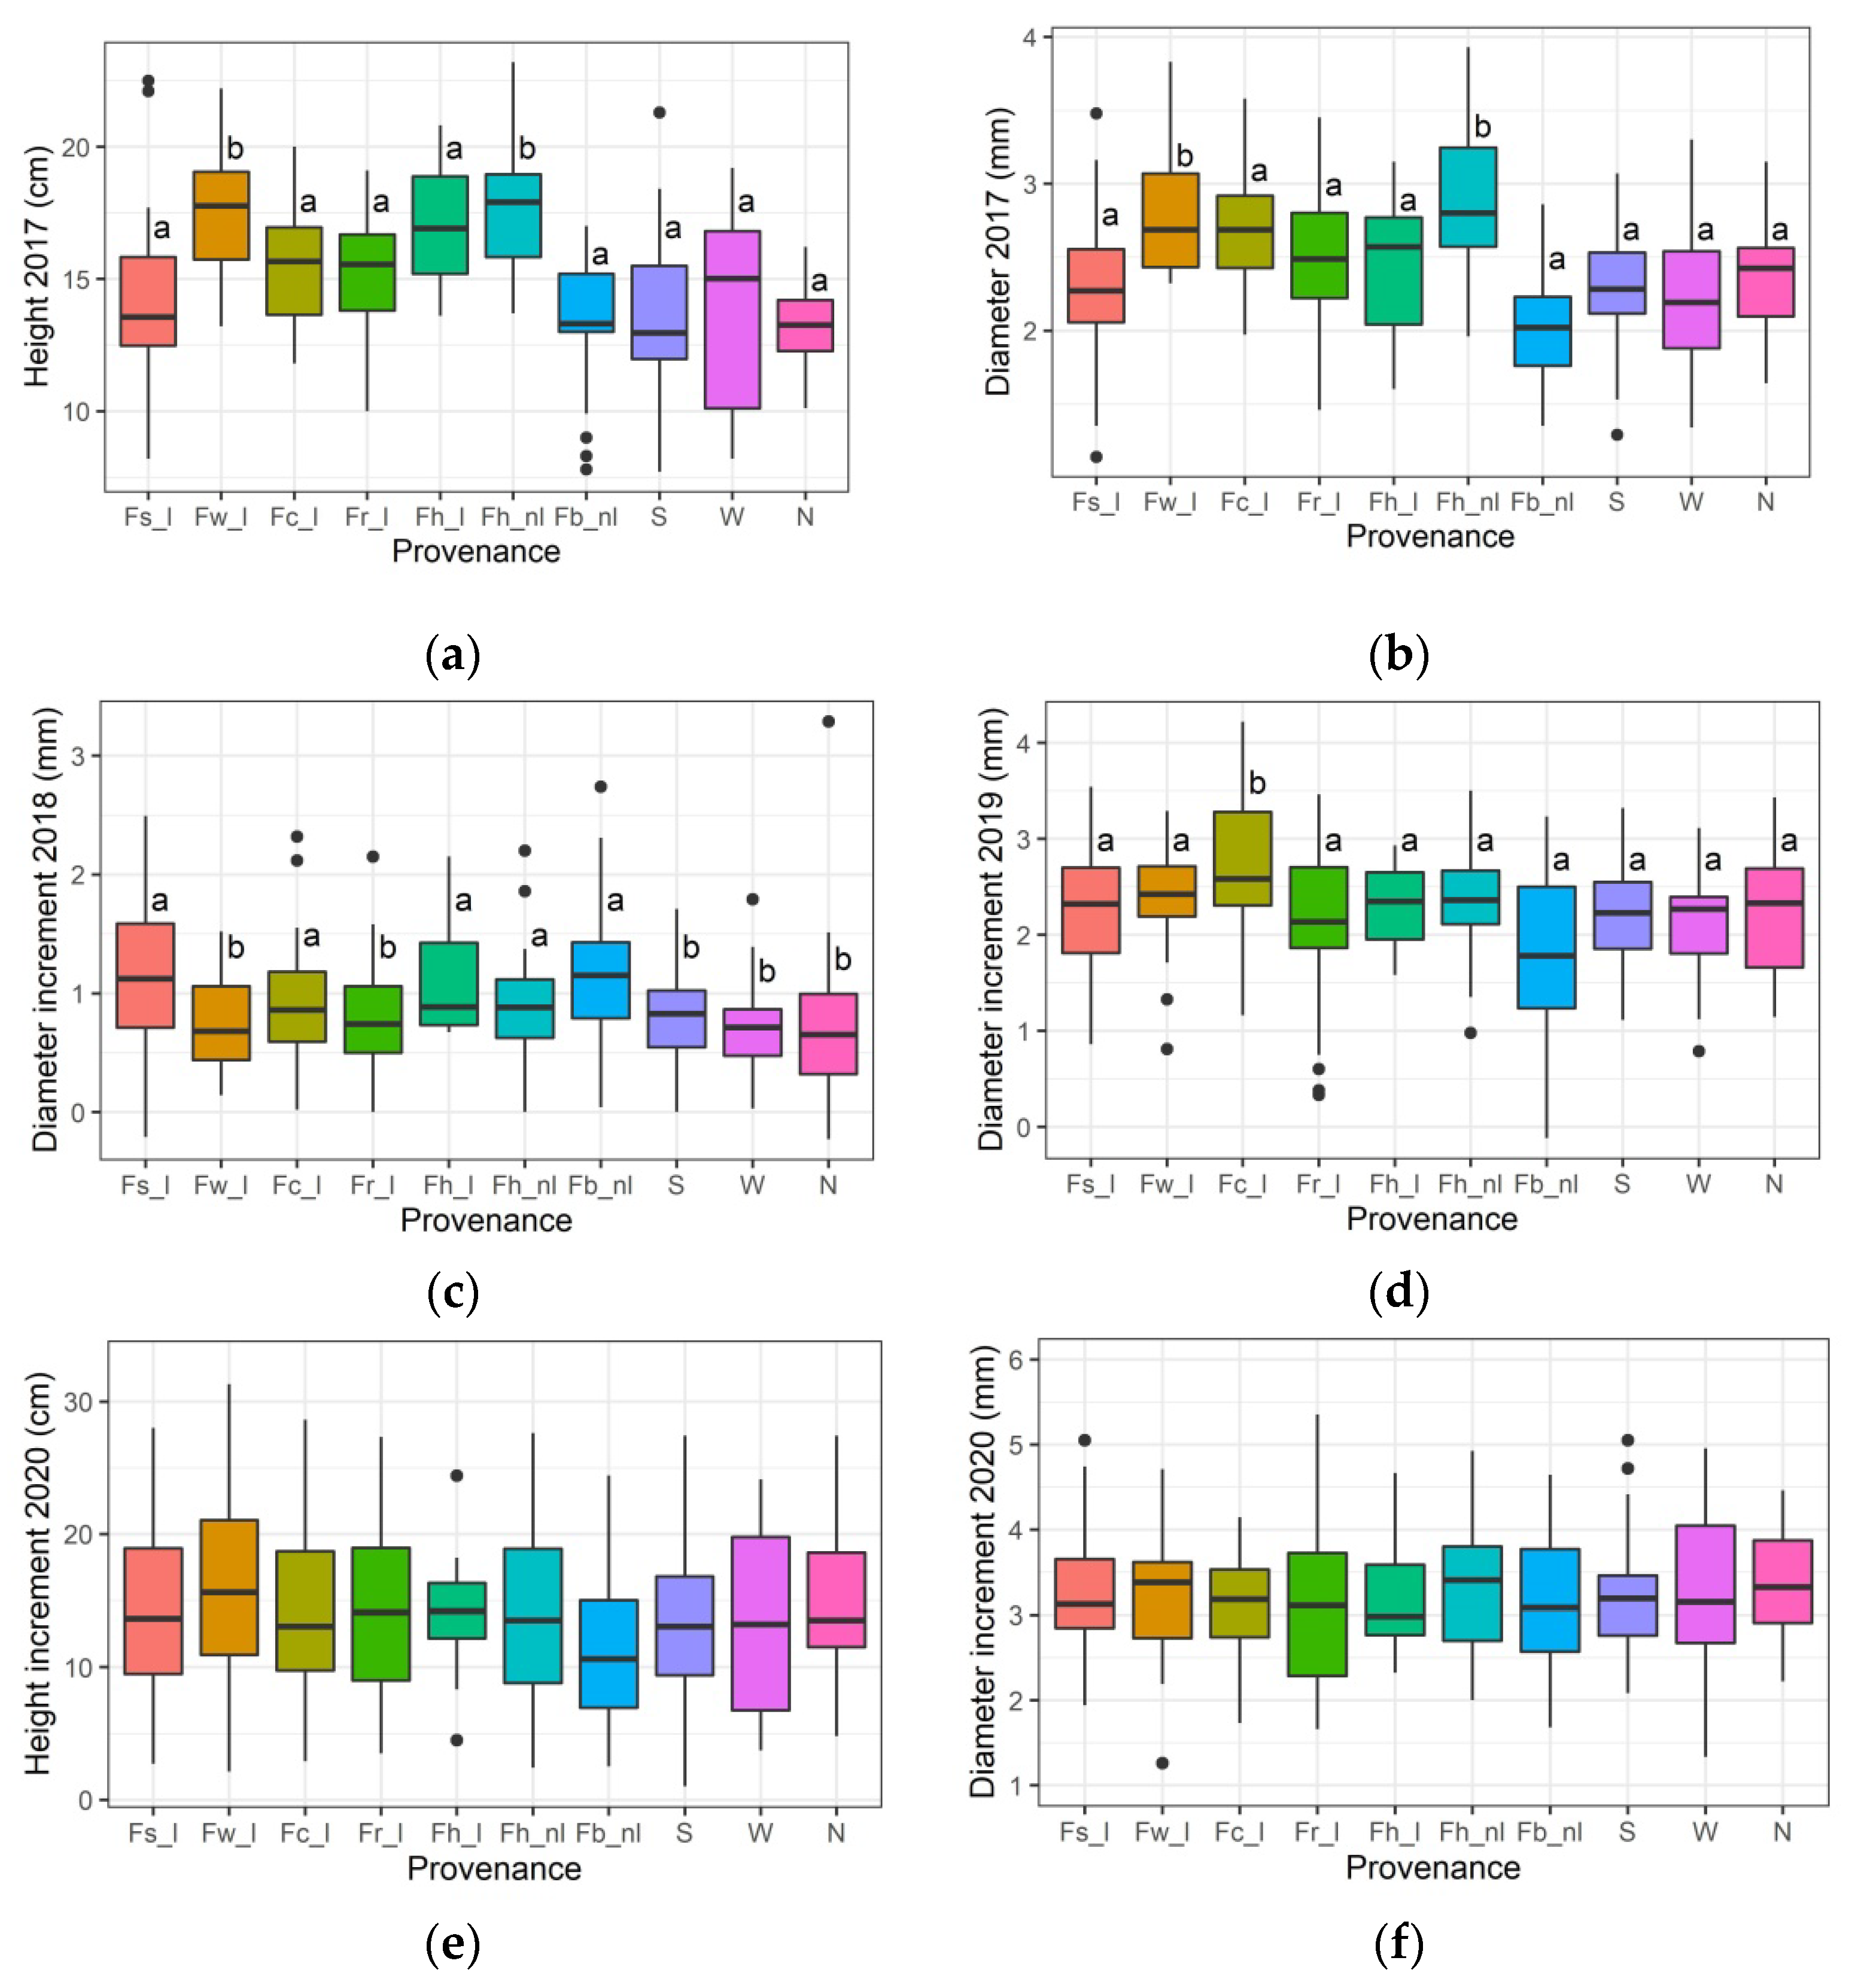
3.1. Growth Responses to the Temperature Treatment in the Spring of 2018

Height and diameter of the beech seedlings for the growth seasons 2017 until 2020, according to the temperature treatment in the spring of 2018, are shown in Figure 4. In 2018, both plant height increment and stem diameter increment were significantly lower in the group of plants that experienced the warm spring treatment in comparison with the cold treatment (treatment with p-value = 0.004 and <0.001 for the height and diameter increment respectively in Table S2). The height increment for the warm-treated plants was on average 17% lower compared to the cold-treated plants, and the diameter increment 30%. The following year, the increment in height did no longer differ between the warm- and cold-treated plants (p-value = 0.278 in Table S3), whereas the diameter increment of the warm-treated plants was significantly higher than that of the cold-treated plants (p-value < 0.001 in Table S3), with a 13% faster diameter increment for the warm-treated plants. In 2020, two years after the temperature treatment, the height increment was significantly higher for the warm-treated plants compared to the cold-treated plants (p-value = 0.012 in Table S4), whereas in this year the diameter increment did not differ anymore between both treatments (p-value = 0.971 in Table S4). Thus, in 2020, the warm-treated plants displayed 15% faster height increment compared to the cold-treated plants. Together, the growth reduction following the warm spring condition in 2018 was fully restored (with exact compensation) in the following year for the stem diameter, whereas it was fully restored two years after the treatment for plant height.

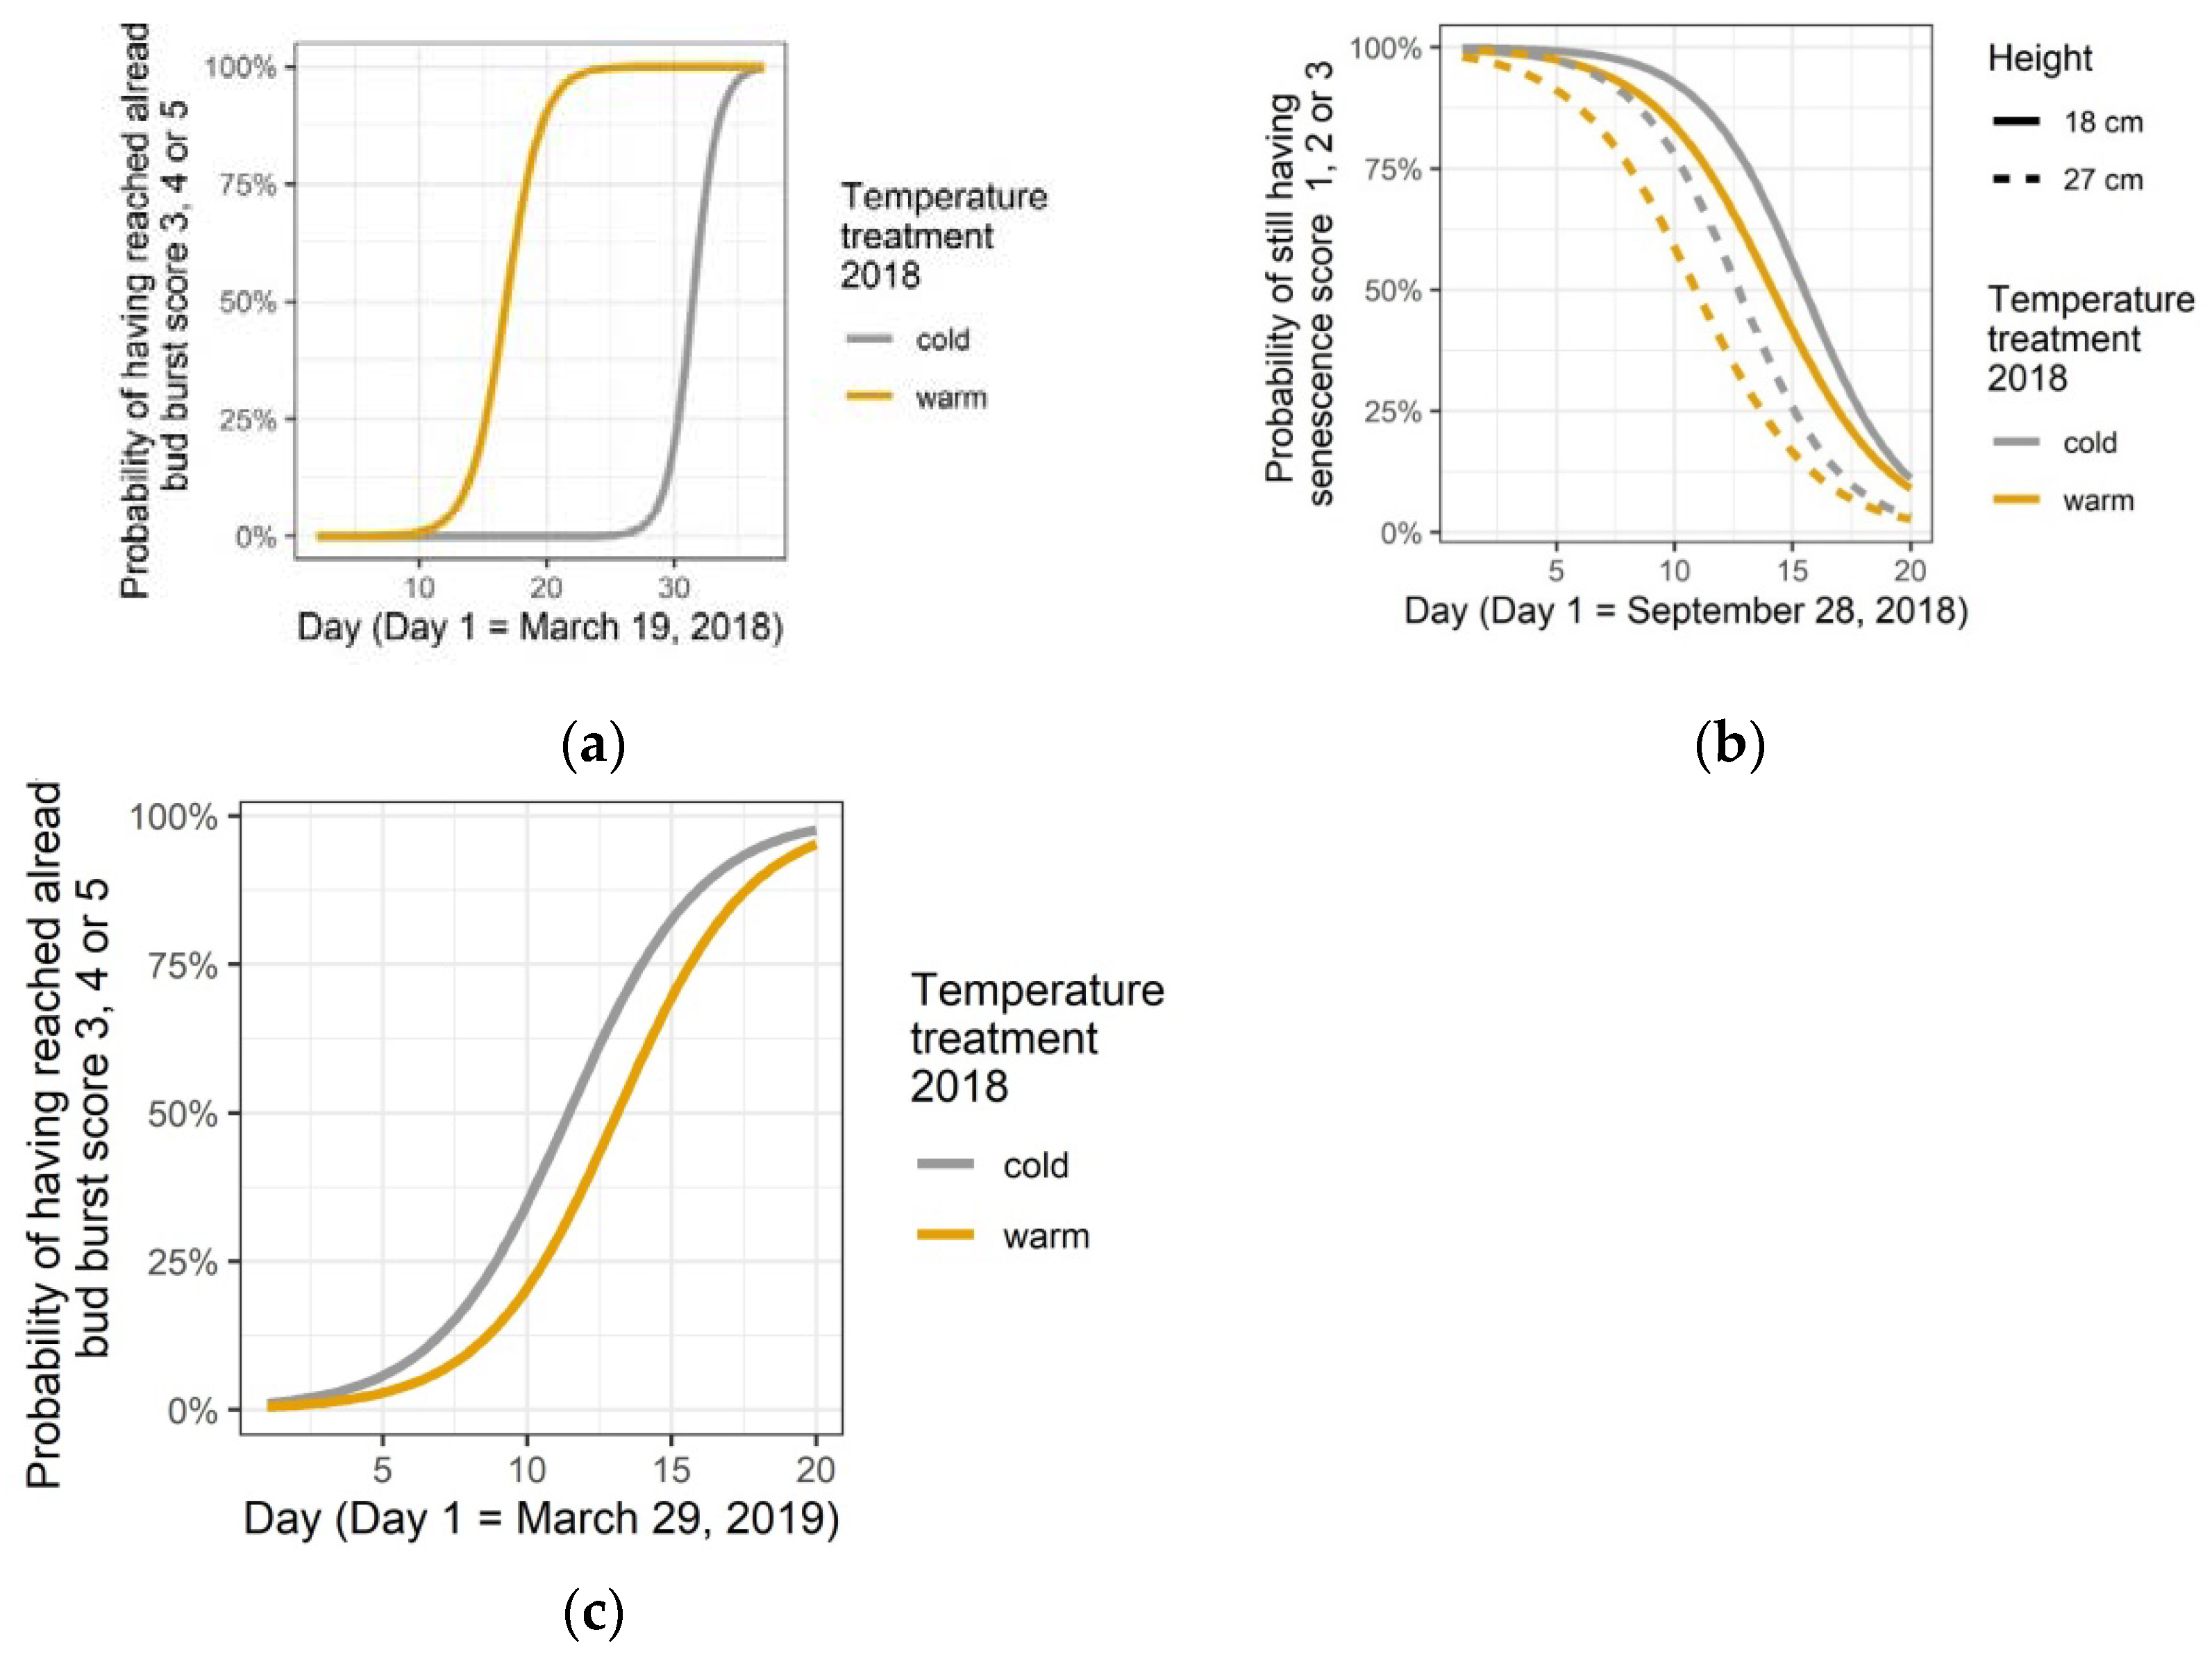
3.2. Phenological Responses to the Temperature Treatment in the Spring of 2018

As expected, during the temperature treatment in the spring of 2018, bud burst started significantly earlier in the warm condition than in the cold condition (p-value < 0.001 in Table S5). The curve in Figure 5a also shows a significant steeper slope for cold-treated plants than for warm-treated, indicating a longer duration of the process of leaf unfolding for the warm-treated plants (interaction between day and treatment with p-value < 0.001 in Table S5). At the end of the growing season in 2018, leaf senescence occurred significantly earlier for the warm-treated plants (p-value < 0.001 in Table S6, Figure 5b), with higher plants senescing earlier. Next spring (2019), bud burst in the warm-treated plants was delayed (p-value = 0.004 in Table S6, Figure 5c).

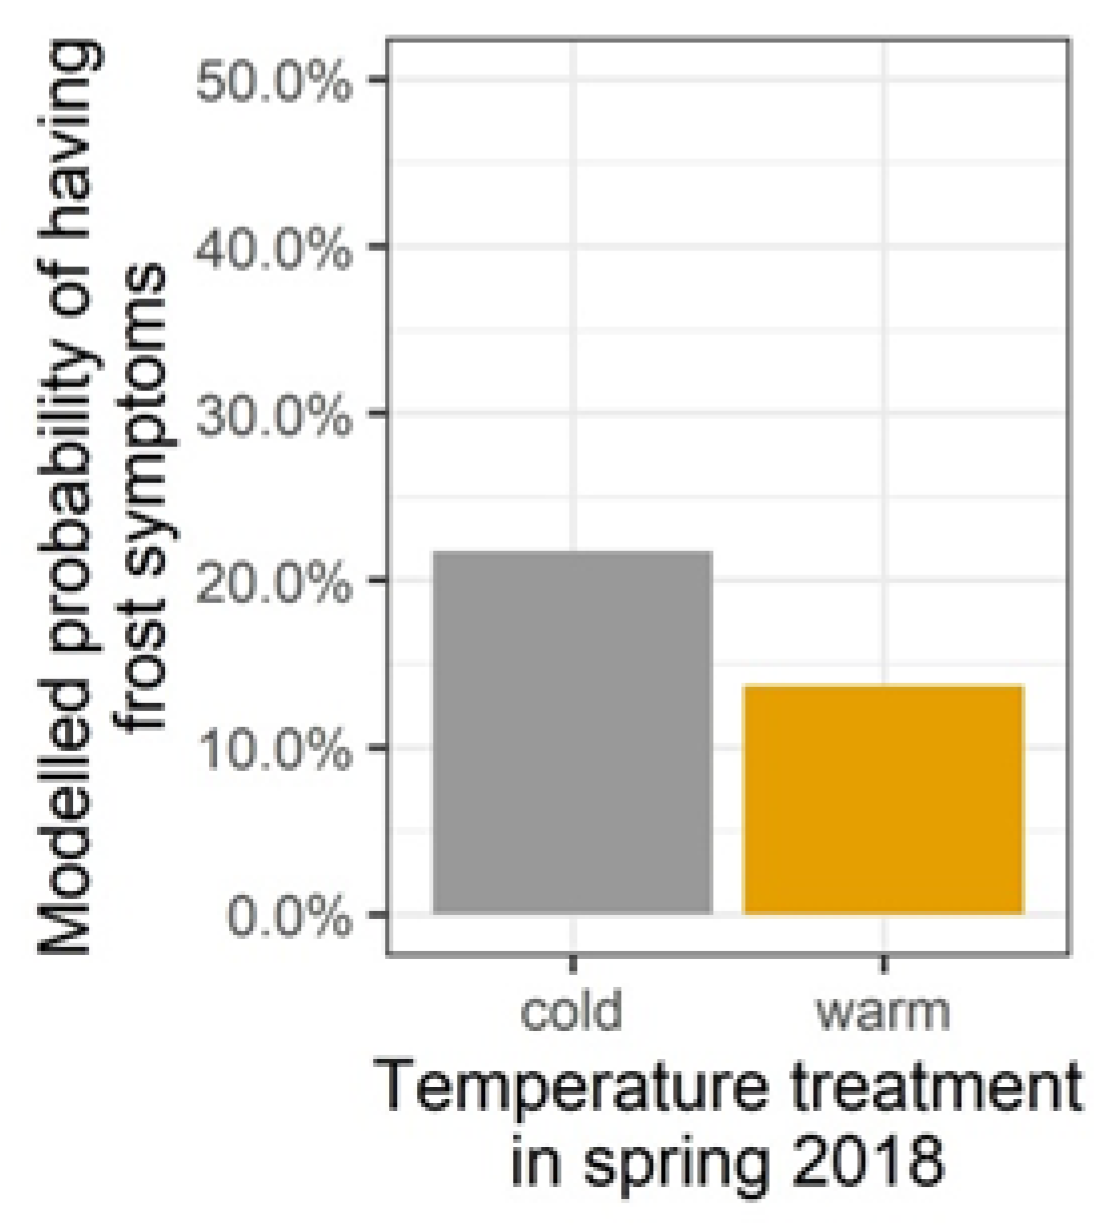
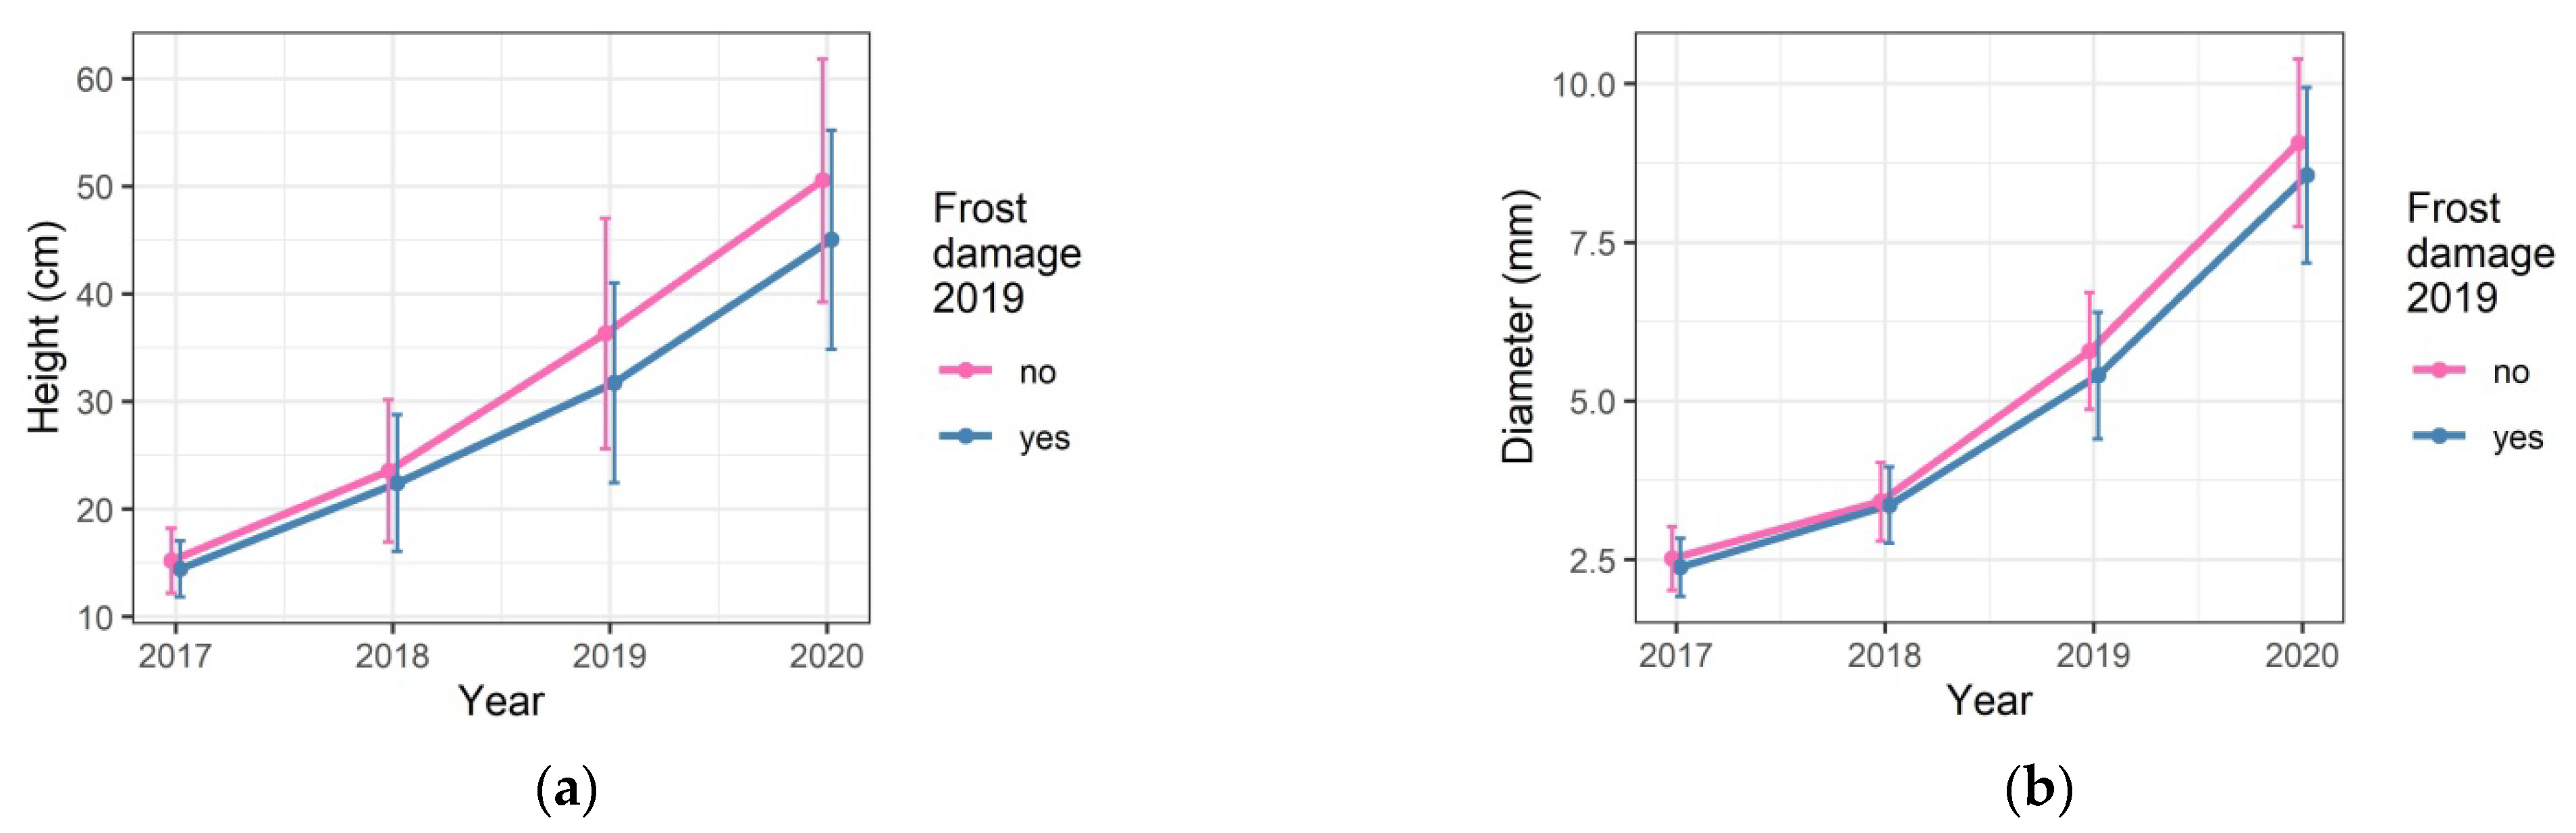
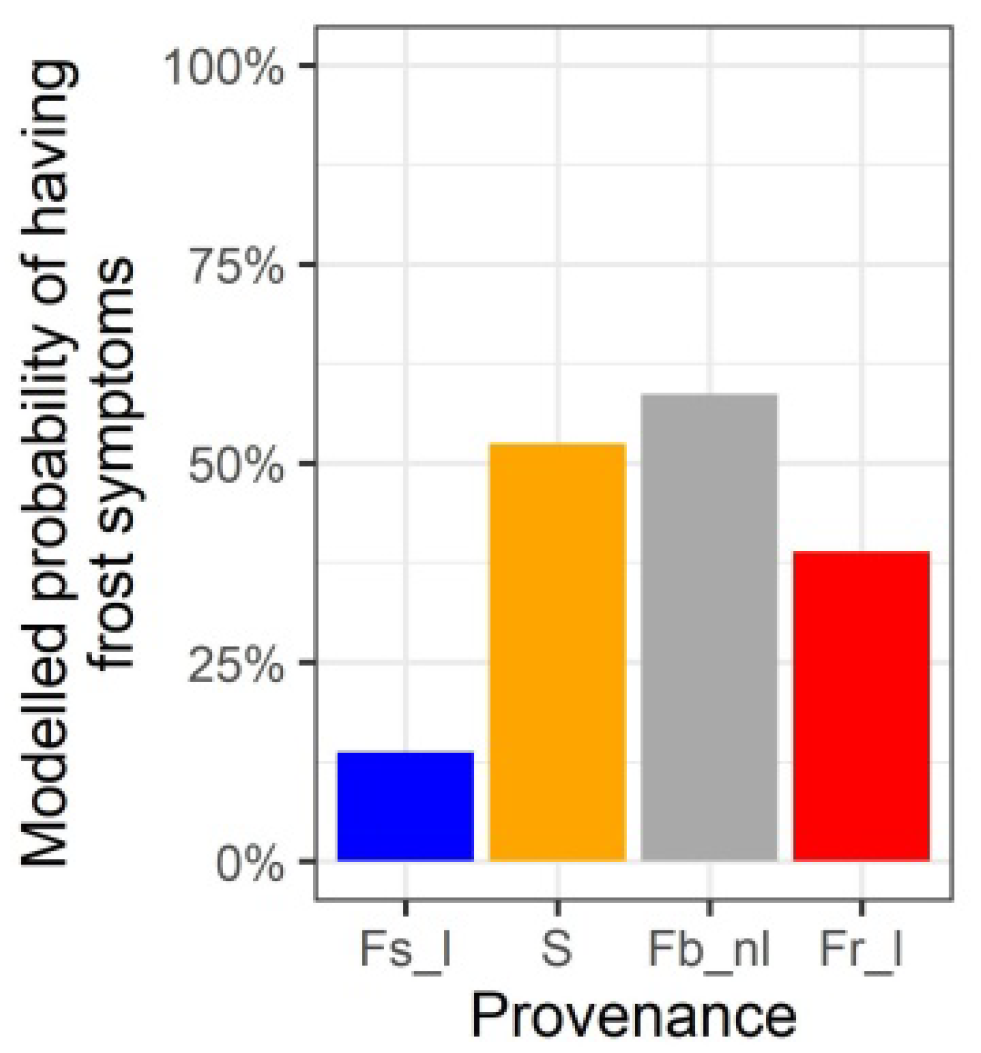
3.3. Damage and Growth Responses to the Late Spring Frost in 2019

This late spring frost in 2019 caused damage to the emerging leaves and growing shoots of 111 plants on a total of 290 plants (38%). Plants that experienced the warm temperature treatment in the spring of 2018 displayed a lower incidence of frost damage, as the warm-treated plants had a later bud burst in 2019 (treatment with p-value = 0.036 in Table S7, Figure 6). Most of the affected plants reacted by forming a new shoot with newly emerging leaves quickly after the frost event (Figure S3). Height and diameter of the beech seedlings for the growth seasons 2017 until 2020, according to the frost damage in the spring of 2019, are shown in Figure 7. The frost damaged plants displayed a reduced diameter and height increment in the same year (frost damage with p-value < 0.001 for height and = 0.001 for diameter increment in Table S3). The height and diameter increments of the frost damaged plants were 27% and 8% reduced in comparison to the non-affected plants. However, in the subsequent year (2020) no further influence of the frost event on growth rates could be detected anymore (p-value = 0.340 and =0.546 for height and diameter increment, respectively, in Table S4). This means that increments for frost damaged plants and non-damaged plants did not differ significantly in this year. Together with the growth retardation of the year before, this was a recovery to pre-stress in 2020 (Figure 1).

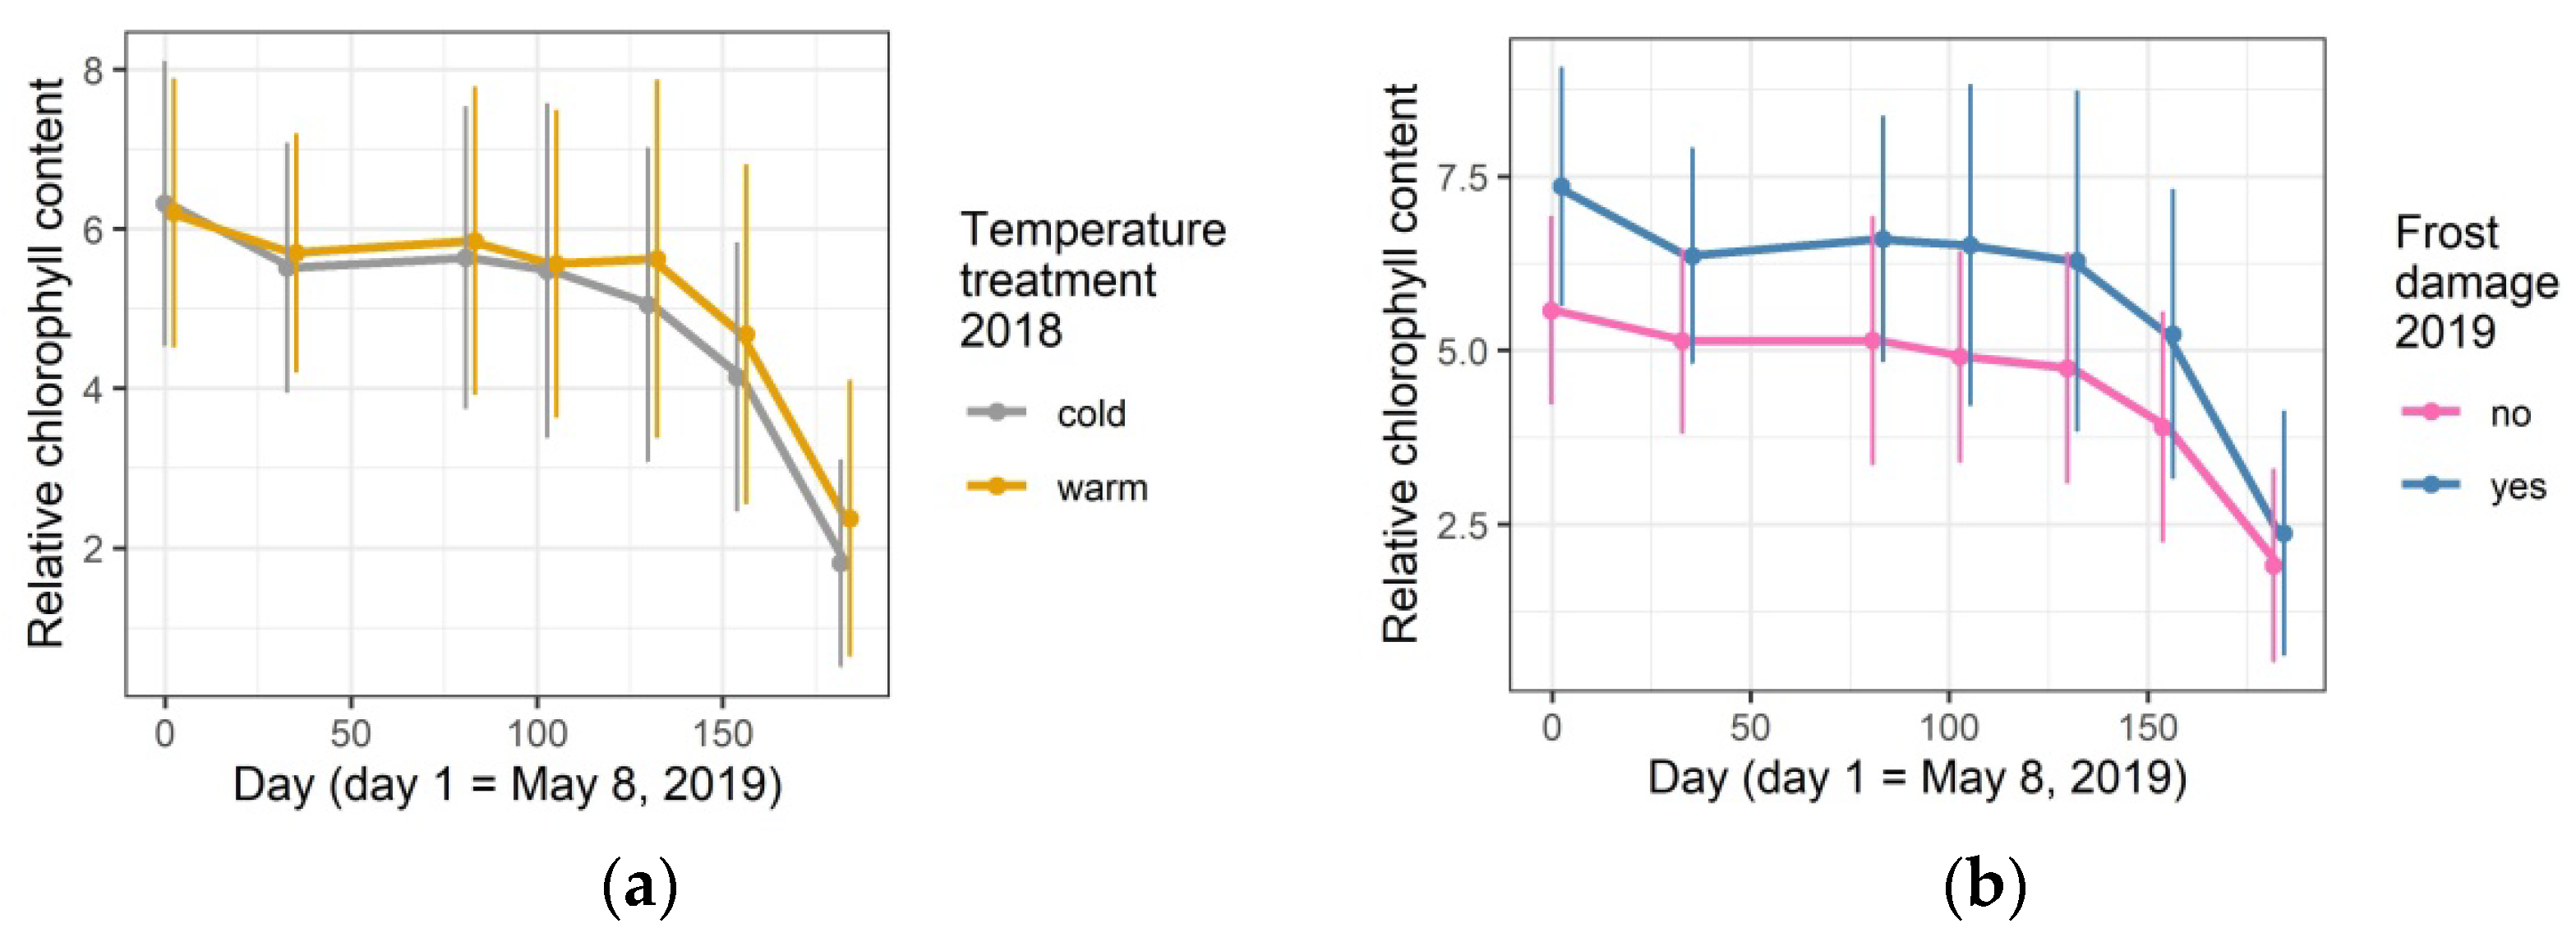
3.4. Relative Leaf Chlorophyll Content in 2019

The relative leaf chlorophyll content was measured during the whole growing season of 2019, looking for putative influences of the temperature treatment in the spring of 2018 and the late spring frost in 2019 (Figure 8a,b). The relative chlorophyll content in the first part of the growing season was not influenced anymore by the temperature treatment from the year before (p-value = 0.133 in Table S8), but it was clearly higher in the frost damaged plants (frost event from this year, p-value < 0.001 in Table S8).
In the second part of the growing season, the relative chlorophyll content remained high for a longer time in the plants that were treated with a warmer temperature in the year before (p-value = 0.002 in Table S8). Furthermore, it was higher in the frost damaged plants (frost event from this year, p-value < 0.001 in Table S8).

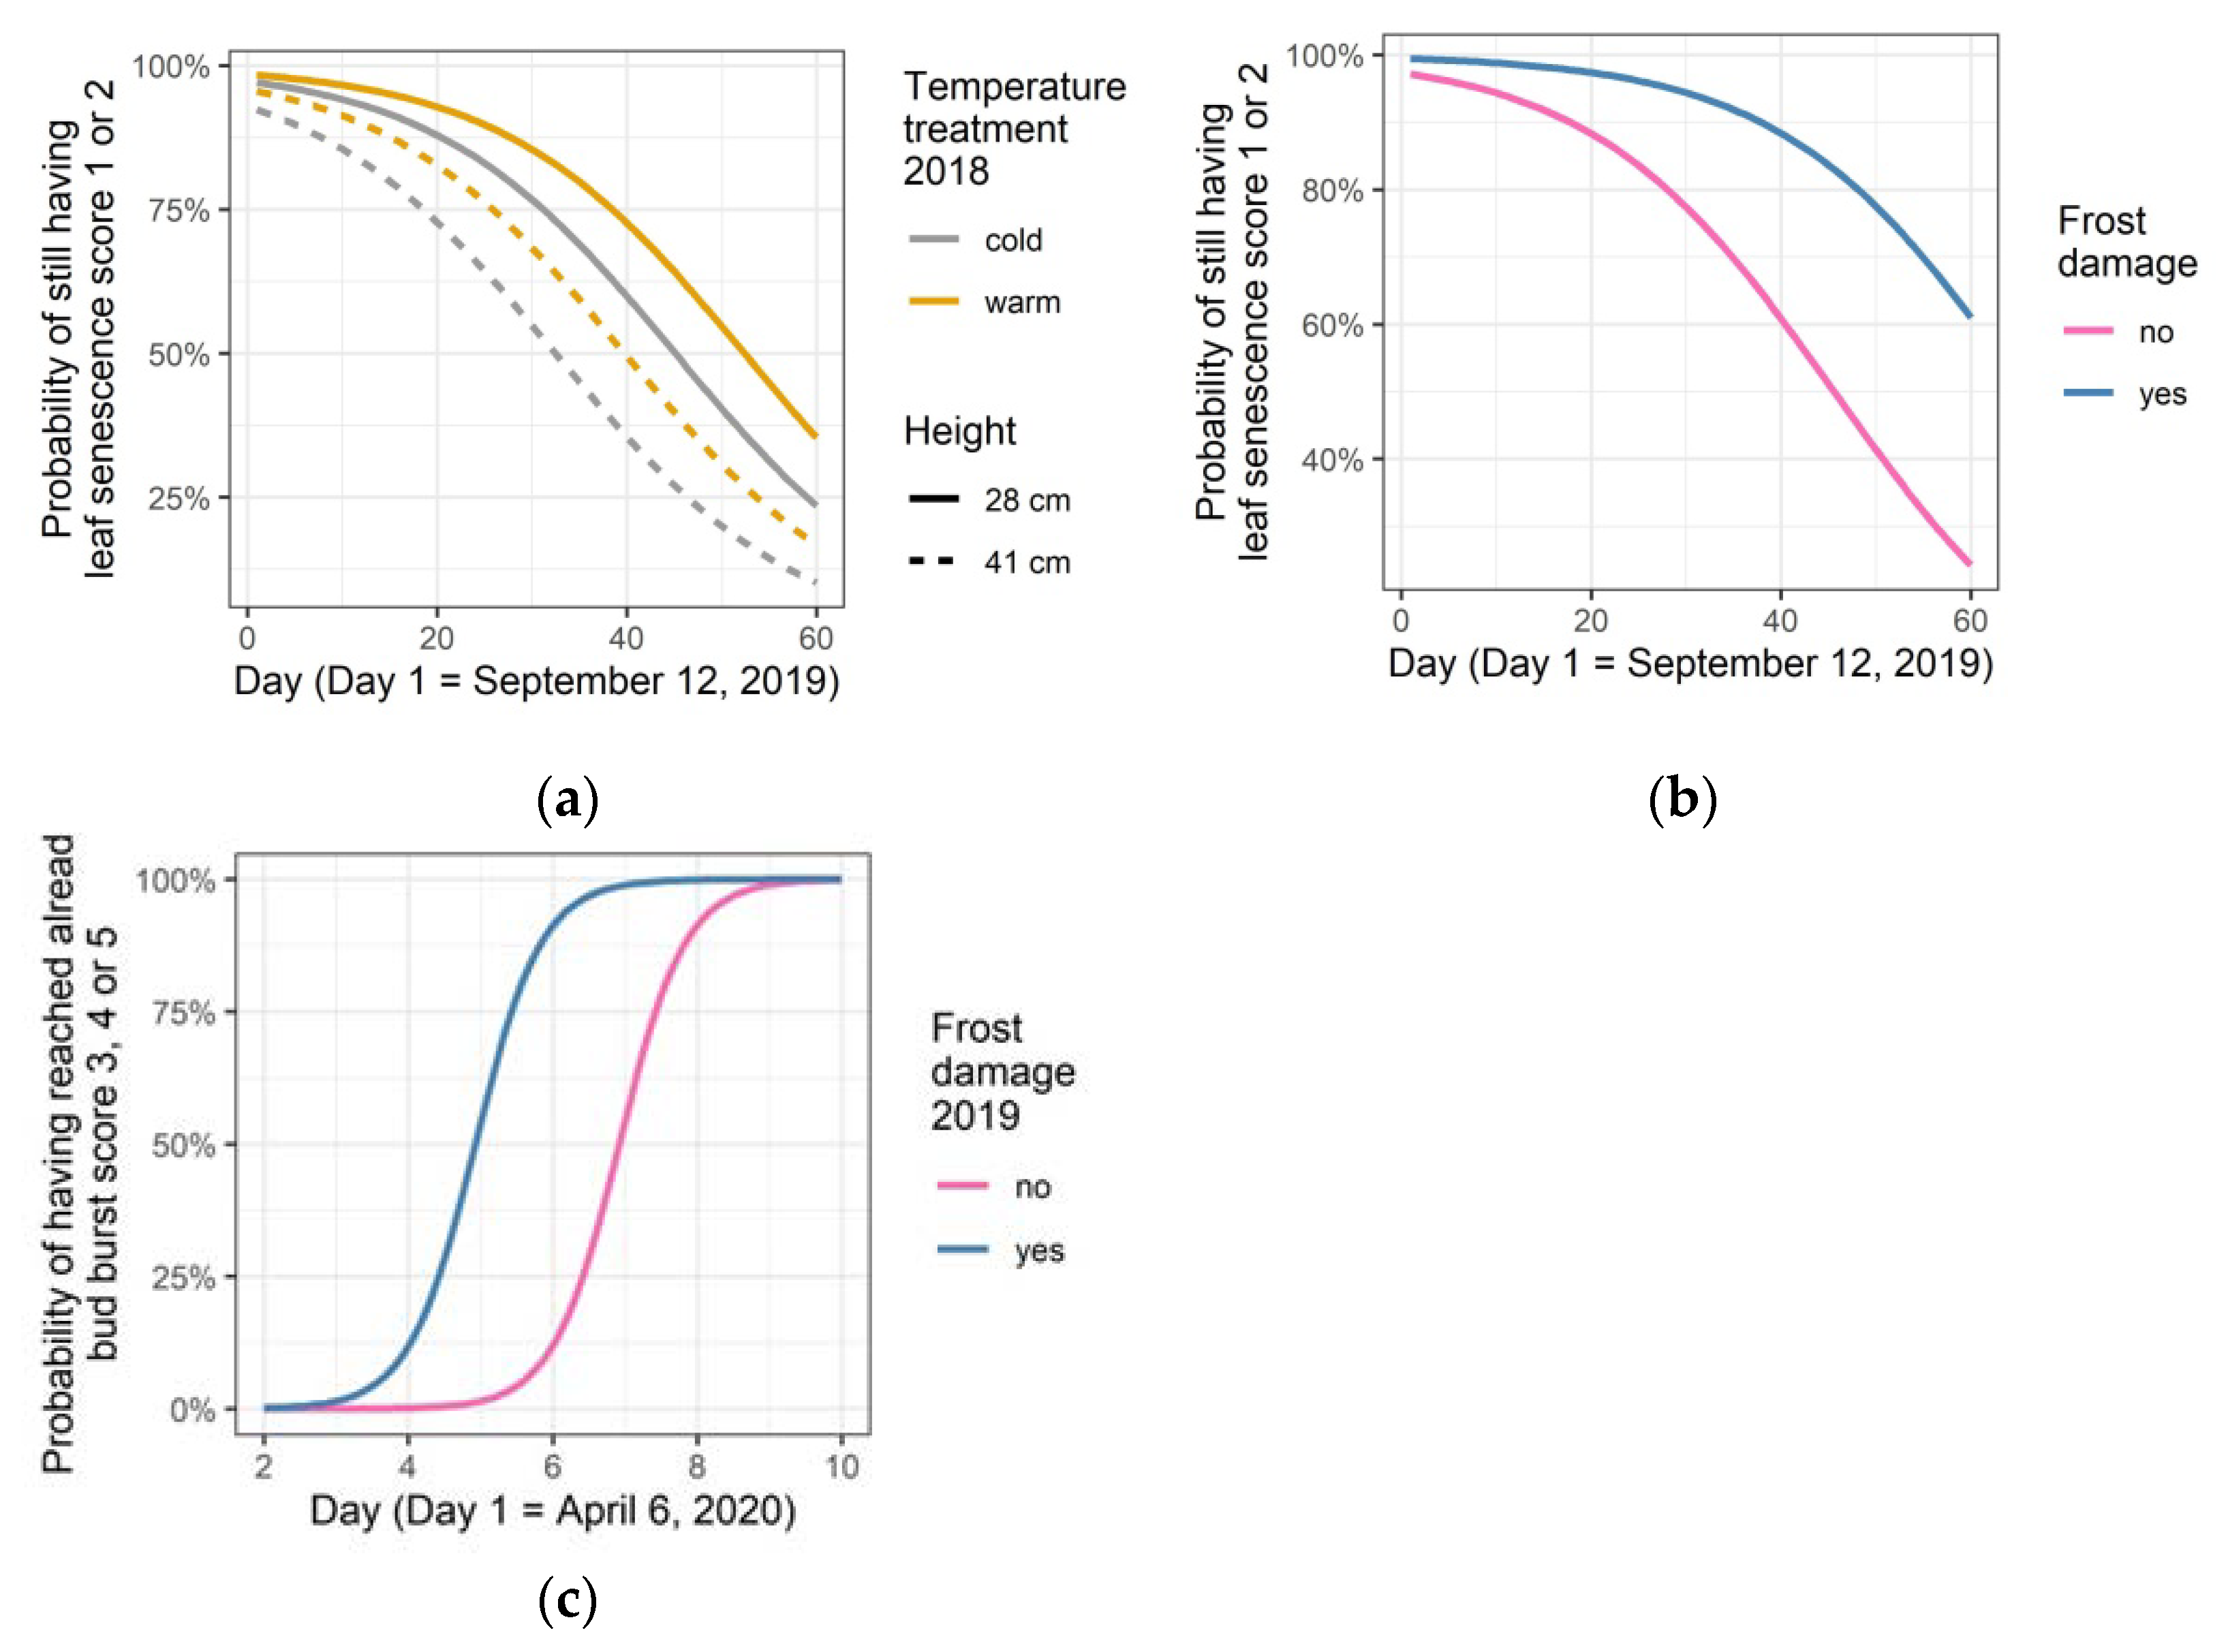
3.5. After Effects: Leaf Senescence in 2019, Bud Burst and Leaf Senescence in 2020

Leaf senescence in the autumn of 2019 followed a comparable pattern as observed in the relative chlorophyll content data of 2019 (Figure 9a,b). Plants that experienced the warm treatment the year before tended to a delay in leaf senescence (treatment with p-value = 0.067 in Table S9). Frost damage in the spring of this year delayed leaf senescence significantly (frost damage with p-value < 0.001 in Table S9). Higher plants senesced earlier (Table S9).
The timing of bud burst and leaf senescence in 2020 was no longer affected by the temperature treatment in the spring of two years before (treatment not significant anymore in Table S9 and Table S10, respectively). Bud burst in the frost damaged plants, however, was significantly earlier in 2020 (a year after the frost event) compared to the non-damaged plants (Figure 9c, frost damage with p-value < 0.001 in Table S9), but leaf senescence in this year was no longer influenced by the frost event from the year before (Table S10).

3.6. Differentiation among the Provenances

As the experimental set-up was a common garden, provenance differentiation could be explored in the growth and phenological responses, using the local Belgian Atlantic provenance Sonian (Fs_l) as reference. The height and diameter of the plants in the first growing season of 2017, before the treatments, is shown in Figure 10a,b. Plant height was significantly larger for the local Belgian Atlantic provenance Warande (Fw_l) and the German provenance that was planted in Belgium in Hallerbos (Fh_nl, non-local) (p-value = 0.033 and 0.011 for Fw_l and Fh_nl, respectively, in Table S11). For diameter in this year, Warande and Hallerbos were also significantly thicker than Sonian (p-value = 0.047 and 0.013 for Fw_l and Fh_nl, respectively, in Table S11).
In 2018, the year of the spring temperature treatment, none of the provenances differed significantly from Sonian for height increment (no significant p-values for the different provenances in Table S2). However, in this year, several provenances had a significantly lower diameter increment than Sonian (p-value = 0.030; =0.013; =0.013; =0.026 and =0.016 for Fw_l, Fr_l, S, W and N, respectively, in Table S2, Figure 10c). Addition of an interaction term between provenance and temperature treatment to the model did not lead to a lower AIC value (data not shown), indicating that the provenances with a larger diameter increment than Sonian in this year still reacted similarly to Sonian to the temperature treatment, i.e., displayed a similar increment reduction in this year.
Analogous to 2018, no provenance differed significantly from Sonian for height increment in 2019, the year of the late spring frost event. Only one local Belgian Atlantic provenance showed a significantly higher diameter increment (p-value = 0.013 for Fc_l in Table S3, Figure 10d). Two additional diameter increment models were run with interaction terms, one between provenance and temperature treatment from the year before, and one with provenance and frost damage in the same year (data not shown). In both cases, the AIC values of the models were higher than that of the model without interaction terms. This means that the year after the temperature treatment in spring (2019), heat-treated plants displayed an enhanced diameter growth (recovery with compensation), but the provenance with a larger diameter increment than Sonian in this year reacted similarly to Sonian upon the heat treatment. Likewise, the frost damage caused reduced diameter growth in the frost-damaged plants in this year (2019), but the provenance with a larger diameter increment than Sonian in this year reacted similarly to Sonian upon frost damage.
In 2020, the provenances did not differ significantly from the standard provenance Sonian for both height and diameter increment (no significant p-values for the provenances in Table S4, Figure 10e,f).
When looking at the phenological responses, the German provenance that was planted in Belgium in Brakelbos (Fb_nl) displayed an earlier bud burst during the spring temperature treatment in 2018 (Figure 11a, p-value = 0.008 in Table S5). An interaction term between provenance and temperature treatment did not lead to a model with a lower AIC value (data not shown), indicating that this provenance responded to the treatment in a similar way as Sonian.
In 2019, not only Brakelbos but also the local Belgian continental provenance Roodbos (Fr_l) and the alpine provenance from Spain (S) were significantly earlier in bud burst (Figure 11b, p-values = 0.005; =0.021 and <0.001, respectively, in Table S6). In this spring, the timing of the bud burst was still influenced by the temperature treatment the year before. An interaction term between provenance and temperature treatment did not lead to a model with a lower AIC value (data not shown), indicating that the provenances responded in the same way as Sonian to the temperature treatment from the year before.
More importantly, provenances with a significantly earlier bud burst in 2019 (Brakelbos, Roodbos and Spain) turned out to be more susceptible to frost damage in the late spring frost of this year (Figure 12, p-values < 0.001 for Brakelbos and Spain, and p-value = 0.013 for Roodbos in Table S7). Addition of an interaction term between provenance and temperature treatment did not result in a model with a lower AIC value (data not shown), indicating that the influence of the temperature treatment on the responses of the provenances upon the frost was not different among the provenances. In other words, the plants that experienced the warm temperature treatment in 2018 displayed a phenological carry-over effect in the next year, which was the year with the late spring frost event, with a later bud burst in comparison to the control plants, resulting in less frost damage among the heat-treated plants, but the relative difference in frost damage between the cold and the warm temperature treatment did not differ among the provenances.
In 2020, two years after the temperature treatment and one year after the frost event, the German provenance that was planted in Belgium Hallerbos (Fh_nl) and the alpine provenance from Spain were earlier in bud burst (Figure 11c, p-values = 0.002 and = 0.001, respectively, in Table S9). In this year, Brakelbos (German provenance planted in Belgium) only showed a tendency for earlier bud burst (p-value = 0.061 in Table S9), whereas the Atlantic provenance from the Netherlands (N) tended to a later bud burst (p-value = 0.063 in Table S9).
No significant differentiation among the provenances was detected for leaf senescence in the three years of observation (2018 till 2020).

4. Discussion

4.1. High Temperature Stress in Early Spring

In the spring temperature experiment of 2018, the warm treatment reduced the growth of the beech seedlings. A positive influence could have been assumed given the higher spring temperature without any water limitation and the prolonged growing season because of the earlier bud burst. The observed longer growing season is a well-studied direct effect of experimental warming in boreal and temperate tree species [48]. Still, an increased growth due to a winter–spring warming was not observed by Fu et al. [49], where, contrary to our results, no influence on growth was detected. Most interestingly, the growth in our experiment was restored one year (diameter) or two years (height) after the temperature treatment up to the level of the control group of plants. This was a recovery with exact compensation, meaning that beech seedlings may possess a mechanism for an enhanced growth after heat stress, seemingly to compensate for the period with retarded growth. The enhanced growth may have exploited standard starch reserves in the plant, or a storage of starch that was increased by a preceding unfavorable condition. An increased accumulation of starch in roots of beech seedlings was observed upon soil warming [50], with the starch accumulation functioning as a reservoir for future use, in contrast to soluble sugars being exploited for immediate use [51]. Accumulation of starch as a “carbon saving strategy” was suggested to act as a storage of energy needed for the “recovery phase” when environmental conditions return to normal. Our results may suggest that the heat treatment may have caused elevated photosynthesis, as warmer temperatures increase the photosynthetic processes that are associated with light [52], and that this was not invested in growth but led to an increased starch accumulation that was exploited in the following years, resulting in an enhanced post-stress growth. An analogous result was found in a simulated browsing experiment on beech saplings, where a single experimental removal of terminal buds was compensated by increased growth (in comparison to the control) in the following year [53]. Additionally, in black oak, carbohydrate storage was shown to be favored relative to growth upon experimental defoliation [54], supporting the hypothesis of enlarged stress induced carbon storage that in its turn can lead to enhanced growth.
The heat treatment on beech seedlings in the spring of 2018 forced the plants to an earlier bud burst in this year and resulted at the end of the growing season in an advanced leaf senescence. Earlier bud burst leading to an advanced leaf senescence was observed in beech saplings when treated with warmer temperatures during bud burst in spring [55] and upon winter–spring warming [49]. Our results therefore corroborate the finding that autumnal leaf senescence is not only regulated by external abiotic cues, including photoperiod, temperature and water supply, but also by the onset of the growing season [55]. In the winter–spring warming experiment of Fu et al. [49], beech saplings displayed not only an advanced leaf senescence following the advanced bud burst in warmer spring conditions, but they still exhibited a tendency towards an earlier bud burst in the spring of the succeeding growing season (p-value = 0.06). We, however, observed a significant carryover effect on the next year’s timing of bud burst, but in the opposite direction, with a slightly delayed bud burst for the plants that received a heat treatment in the preceding spring. These opposing carryover effects could be related to the different growth reactions in both studies; while our heat treatment resulted in reduced growth, it did not influence growth in the winter–spring warming experiment of Fu et al. [49]. Possibly, the levels of nonstructural carbohydrates that influence the timing of bud burst may have played a role here [49]. Cold acclimation in winter together with the subsequent bud burst in spring involves complex modifications of the plant metabolome [56,57].
Interestingly, the carryover effect was still present in the leaf senescence of the next year’s growing season (2019), with heat treated saplings displaying not only a delayed bud burst in this year but also a delayed leaf senescence. In this case, the leaf senescence was more clearly significant in the relative chlorophyll content measurements than in the leaf decoloration observations. This result corroborates again the finding that autumnal leaf senescence is not only regulated by external cues but can also be positively correlated with the timing of the preceding bud burst [55]. No effect of the spring temperature treatment on the phenological responses was present anymore two years after the thermal treatment.

4.2. Effects of a Late Spring Frost

Late spring frosts can result in growth reduction due to the shortening of the growing season and the carbon resources that need to be allocated for the production of new leaves [58]. In our experiment, growth of the beech saplings was indeed reduced in the frost damaged plants in the year of the frost event, and the growth recovered up to a pre-stress growth rate in the year following the frost, without compensation. It should be mentioned that our experiment did not include a control group of plants that did not experience any frost at all, which means that we cannot exclude any influence of the frost event on the non-damaged plants. In any case, our results are in line with findings from a large tree-ring width analysis of beech in Germany showing recovery to the pre-frost level, with tree-ring widths in the subsequent years being comparable to the years preceding the late spring frost event [59]. In a study of beech saplings treated with an experimental severe late spring frost, new cohorts of leaves immediately following the frost event were produced, and leaf senescence in autumn was delayed [55]. Our results corroborated this finding. As the frost-damaged plants in our experiment suffered from reduced height and radial growth, the higher chlorophyll content and thus the likely higher photosynthetic activity can be attributed to a higher build-up of reserves of nonstructural carbohydrates. Interestingly, the temperature treatment in 2018 influenced the frost damage occurring in 2019, as warm-treated plants displayed a delay of the bud burst as a carry-over effect and therefore had a lower chance on developing frost damage.

4.3. Population Differentiation

Common garden studies have revealed relatively little genetic population differentiation for growth and for the phenological traits bud burst and leaf senescence in beech [18,60]. Our results are in line with these findings. Modest provenance differentiation for height and radial growth in the first pre-treatment year and the following two years with a temperature treatment and a frost event disappeared in the fourth year. It concerns minor differences with p-values between 0.01 and 0.05 (Tables S2, S3 and S11) and may indicate some juvenile instability, possibly influenced by maternal effects, rather than genetic differentiation. Together, these results illustrate that variation between the provenances for growth is lower than the variation within the provenances, which can likely be interpreted as an effect of a combination of phenotypic plasticity to the common garden environment and to high genetic diversity within the provenances.
When looking at the phenological responses, the German provenance planted in Brakel as a WWI war reparation was the only provenance to burst its buds earlier in the second growing season (2018) during the temperature treatment, both in the warm and the cold condition. One year later (2019), this provenance displayed an earlier bud burst together with the alpine provenance from Spain and the continental Belgian provenance Roodbos. Consequently, the three provenances with earlier bud burst were also significantly more damaged by the late spring frost occurring in this year. Timing of bud burst in the fourth year (2020) seemed to approach better the expected variation with the Southern provenance of Spain and the two Belgian provenances of German (more continental) origin flushing or tending to flush earlier and the more northerly located provenance of the Netherlands tending to flush later. Although the home site of the Spanish provenance is characterized by an alpine climate, it is also known that photoperiod may play a role in timing of bud burst in beech [61], putatively explaining the earlier flushing in our common garden. Although we do not detect a univocal pattern in timing of bud burst related to the continentality of the Belgian provenances, the potency of the continental Walloon provenance to an earlier bud burst may be hampered by the higher altitude of the home-site (604 m above sea level) in comparison to the other continental provenance Roodbos (273 m above sea level). Although common garden studies have shown that bud burst in beech is stable across the years [41,60], our results suggest that the high-temperature treatment and the frost event on the juvenile plants may have somewhat disrupted the putative provenance-specific phenological responses.
The higher vulnerability of provenances with an earlier bud burst to damage caused by a late spring frost may indicate a potential negative consequence of transporting provenances from home-sites characterized by a longer growing season to a new environment (from more southerly to more northerly sites or from more continental to more Atlantic sites), where they may display earlier bud burst compared to locally adapted provenances, resulting in a higher vulnerability to late spring frosts. This type of assisted migration is indeed sometimes proposed as an anticipation to the predicted climate warming [62]. However, this assumption focuses on adaptation to mean annual temperature or annual precipitation, whereas these variables may poorly reflect the actual driving forces of climatic adaptation [63]. For instance, exceptional late spring frosts are known to have a critical impact on forests in temperate and boreal regions and are projected to occur more frequently due to climate change [25].

5. Conclusions

Overall, our results show that beech seedlings can recover from a stressful high spring temperature treatment and a late spring frost. Growth both in height and in diameter increased after a retardation due to the spring thermal stress, to reach the same level as the controls, i.e., recovery with full compensation. After the late spring frost event, growth of the damaged plants regained the pre-stress level of growth, but without compensation.
The effect of provenance in the growth and phenological responses upon a spring heat treatment and a late spring frost event was limited. Furthermore, this effect was not straightforward and not stable across the study years, only showing a tendency of subdivision along climate (Atlantic versus continental) and/or latitude (Spain, Belgium, the Netherlands) of the home sites. Still, the observed early bud burst and concurring higher frost damage in 2019 in certain provenances, including a non-local German provenance planted in Belgium more than a century ago as a WWI war reparation, advocates caution when considering transportation of provenances as an anticipation to the predicted climate. To date, phenology as a criterion in the selection of provenances for afforestation purposes may have been given too little attention in forestry practices. It should be mentioned here that the choice of the home-sites of the different provenances in this study was limited, and further research may strengthen or weaken our conclusions.
Finally, the probability that a damaging frost and a severe drought will occur in the timespan of one or two years will likely increase in the future [64], and higher average temperatures often concur with more drought stress events [65]. It is unclear if recovery of young beech trees will be sustained in cases of multiple stress events over short time intervals. Critical levels may be reached where the capacity of trees in general to withstand and to recover from stress events may decline.

Supplementary Materials

The following are available online at https://0-www-mdpi-com.brum.beds.ac.uk/article/10.3390/f12111604/s1, Figure S1: Mean daily temperatures in the two growth chambers in the spring of 2018, Figure S2: Daily minimum temperatures at Destelbergen in the spring of 2019 (9 km from the trial), Figure S3: Number of plants that displayed frost damage versus number of plants that produced new shoot growth after the frost event, Table S1: Number of seedlings according to the temperature treatment in the spring of 2018 and the presence/absence of frost damage in the spring of 2019, Table S2: Model statistics for the response variables height increment and diameter increment in 2018. H1 is the plant height at the beginning of 2018, T is the temperature treatment in the spring of 2018 (categorical variable with the cold condition as standard level to which the warm condition is compared) and P is the provenance (categorical variable with Sonian as the standard provenance to which the other provenances are compared). Abbreviations of provenances are in Table 1, Table S3: Model statistics for the response variables height increment and diameter increment in 2019. H2 is the plant height at the beginning of 2019, T is the temperature treatment in the spring of 2018 (categorical variable with the cold condition as standard level to which the warm condition is compared), Fr is frost damage occurrence after the late spring frost in 2019 (categorical variable with frost damage as the standard level to which no frost damage is compared) and P is the provenance (categorical variable with Sonian as the standard provenance to which the other provenances are compared). Abbreviations of provenances are in Table 1, Table S4: Model statistics for the response variables height increment and diameter increment in 2020. H3 is the plant height at the beginning of 2020, T is the temperature treatment in the spring of 2018 (categorical variable with the cold condition as standard level to which the warm condition is compared), Fr is frost damage occurrence after the late spring frost in 2019 (categorical variable with frost damage as the standard level to which no frost damage is compared) and P is the provenance (categorical variable with Sonian as the standard provenance to which the other provenances are compared). Abbreviations of provenances are in Table 1, Table S5: Model statistics for the response variable bud burst in 2018. H1 is the plant height at the beginning of 2018, D is the day of observation, T is the temperature treatment in the spring of 2018 (categorical variable with the cold condition as standard level to which the warm condition is compared) and P is the provenance (categorical variable with Sonian as the standard provenance to which the other provenances are compared). Abbreviations of provenances are in Table 1, Table S6: Model statistics for the response variables leaf senescence in 2018 and bud burst in 2019. H2 is the plant height at the end of 2018, D is the day of observation, T is the temperature treatment in the spring of 2018 (categorical variable with the cold condition as standard level to which the warm condition is compared) and P is the provenance (categorical variable with Sonian as the standard provenance to which the other provenances are compared). Abbreviations of provenances are in Table 1, Table S7: Model statistics for the response variable frost damage in the spring of 2019. H2 is the plant height at the beginning of 2019, T is the temperature treatment in the spring of 2018 (categorical variable with the cold condition as standard level to which the warm condition is compared) and P is the provenance (categorical variable with Sonian as the standard provenance to which the other provenances are compared). Abbreviations of provenances are in Table 1, Table S8: Model statistics for the response variable relative chlorophyll content. H2 is the plant height at the end of 2018, D is the day of observation, T is the temperature treatment in the spring of 2018 (categorical variable with the cold condition as standard level to which the warm condition is compared), Fr is the frost damage in the spring of 2019 (categorical variable with absence of frost damage as standard level to which presence of frost damage is compared) and P is the provenance (categorical variable with Sonian as the standard provenance to which the other provenances are compared). Abbreviations of provenances are in Table 1, Table S9: Model statistics for the response variables leaf senescence in 2019 and bud burst in 2020. H3 is the plant height at the end of 2019, D is the day of observation, T is the temperature treatment in the spring of 2018 (categorical variable with the cold condition as standard level to which the warm condition is compared), Fr is the frost damage in the spring of 2019 (categorical variable with absence of frost damage as standard level to which presence of frost damage is compared) and P is the provenance (categorical variable with Sonian as the standard provenance to which the other provenances are compared). Abbreviations of provenances are in Table 1, Table S10: Model statistics for the response variables leaf senescence in 2020. H4 is the plant height at the end of 2020, D is the day of observation, T is the temperature treatment in the spring of 2018 (categorical variable with the cold condition as standard level to which the warm condition is compared), Fr is the frost damage in the spring of 2019 (categorical variable with absence of frost damage as standard level to which presence of frost damage is compared) and P is the provenance (categorical variable with Sonian as the standard provenance to which the other provenances are compared). Abbreviations of provenances are in Table 1, Table S11: Model statistics for the response variables height and diameter in 2017. P is the provenance (categorical variable with Sonian as the standard provenance to which the other provenances are compared). Abbreviations of provenances are in Table 1.

Author Contributions

K.V.M., J.M.M., A.T., L.D.K. and K.V. all added to the conceptualization of the research presented here and helped in outlining the methodology. K.V.M. together with S.M. supervised the whole experiment, while J.M.M., A.L. and S.M. took care of the plant growth in the nursery and in the greenhouse. J.M.M., A.L., S.M. and K.V.M. performed observations and measurements. J.M.M., A.L. and K.V.M. performed the statistical analyses. K.V.M., J.M.M., A.T., L.D.K. and K.V. prepared the manuscript. All authors have read and agreed to the published version of the manuscript.

Funding

This research received no external funding.

Institutional Review Board Statement

Not applicable.

Informed Consent Statement

Not applicable.

Data Availability Statement

The data presented in this study are available on request from the corresponding author.

Acknowledgments

We thank Eduardo Notivol Paíno for help with the seed collection in Spain and Bert Maes, Suruchi Beeckman, Arion Turcsan, Caro Vercuateren, Hans Beeckman, Bruno Rutten and Steven Haelterman in other places. Lisa Carnal, Cédric Van Dun, Yorrick Aguas Guerreiro, Segolene Bauduin, Stijn De Leenheer, Denis Cattoir and Matthieu Gallin are thanked for their contribution to the data acquisition. We also thank Marc Schouppe and Nico De Regge for taking care of the plants.

Conflicts of Interest

The authors declare no conflict of interest.

References

  1. Reichstein, M.; Bahn, M.; Ciais, P.; Frank, D.; Mahecha, M.D.; Seneviratne, S.I.; Zscheischler, J.; Beer, C.; Buchmann, N.; Frank, D.C.; et al. Climate extremes and the carbon cycle. Nature 2013, 500, 287–295. [Google Scholar] [CrossRef]
  2. Perkins-Kirkpatrick, S.E.; Lewis, S.C. Increasing trends in regional heatwaves. Nat. Commun. 2020, 11, 1–8. [Google Scholar] [CrossRef]
  3. Gillett, N.P.; Stone, D.A.; Stott, P.A.; Nozawa, T.; Karpechko, A.Y.; Hegerl, G.C.; Wehner, M.F.; Jones, P.D. Attribution of polar warming to human influence. Nat. Geosci. 2008, 1, 750–754. [Google Scholar] [CrossRef]
  4. Tachibana, Y.; Nakamura, T.; Komiya, H.; Takahashi, M. Abrupt evolution of the summer Northern Hemisphere annular mode and its association with blocking. J. Geophys. Res. Atmos. 2010, 115. [Google Scholar] [CrossRef] [Green Version]
  5. Francis, J.A.; Vavrus, S.J. Evidence linking Arctic amplification to extreme weather in mid-latitudes. Geophys. Res. Lett. 2012, 39. [Google Scholar] [CrossRef]
  6. Belmecheri, S.; Babst, F.; Hudson, A.R.; Betancourt, J.; Trouet, V. Northern Hemisphere Jet Stream Position Indices as Diagnostic Tools for Climate and Ecosystem Dynamics. Earth Interact. 2017, 21, 1–23. [Google Scholar] [CrossRef]
  7. Bonan, G.B. Forests and climate change: Forcings, feedbacks, and the climate benefits of forests. Science 2008, 320, 1444–1449. [Google Scholar] [CrossRef] [Green Version]
  8. Pan, Y.D.; Birdsey, R.A.; Fang, J.Y.; Houghton, R.; Kauppi, P.E.; Kurz, W.A.; Phillips, O.L.; Shvidenko, A.; Lewis, S.L.; Canadell, J.G.; et al. A Large and Persistent Carbon Sink in the World’s Forests. Science 2011, 333, 988–993. [Google Scholar] [CrossRef] [Green Version]
  9. Teskey, R.; Wertin, T.; Bauweraerts, I.; Ameye, M.; McGuire, M.A.; Steppe, K. Responses of tree species to heat waves and extreme heat events. Plant Cell Environ. 2015, 38, 1699–1712. [Google Scholar] [CrossRef]
  10. Nicotra, A.B.; Atkin, O.K.; Bonser, S.P.; Davidson, A.M.; Finnegan, E.J.; Mathesius, U.; Poot, P.; Purugganan, M.D.; Richards, C.L.; Valladares, F.; et al. Plant phenotypic plasticity in a changing climate. Trends Plant Sci. 2010, 15, 684–692. [Google Scholar] [CrossRef]
  11. Shaw, R.G.; Etterson, J.R. Rapid climate change and the rate of adaptation: Insight from experimental quantitative genetics. New Phytol. 2012, 195, 752–765. [Google Scholar] [CrossRef] [PubMed]
  12. Vitasse, Y.; Bresson, C.C.; Kremer, A.; Michalet, R.; Delzon, S. Quantifying phenological plasticity to temperature in two temperate tree species. Funct. Ecol. 2010, 24, 1211–1218. [Google Scholar] [CrossRef]
  13. Dittmar, C.; Zech, W.; Elling, W. Growth variations of Common beech (Fagus sylvatica L.) under different climatic and environmental conditions in Europe—A dendroecological study. For. Ecol. Manag. 2003, 173, 63–78. [Google Scholar] [CrossRef]
  14. Thurm, E.A.; Hernandez, L.; Baltensweiler, A.; Ayan, S.; Rasztovits, E.; Bielak, K.; Zlatanov, T.M.; Hladnik, D.; Balic, B.; Freudenschuss, A.; et al. Alternative tree species under climate warming in managed European forests. For. Ecol. Manag. 2018, 430, 485–497. [Google Scholar] [CrossRef]
  15. Dyderski, M.K.; Paz, S.; Frelich, L.E.; Jagodzinski, A.M. How much does climate change threaten European forest tree species distributions? Glob. Chang. Biol. 2018, 24, 1150–1163. [Google Scholar] [CrossRef]
  16. Bolte, A.; Czajkowski, T.; Kompa, T. The north-eastern distribution range of European beech—A review. Forestry 2007, 80, 413–429. [Google Scholar] [CrossRef]
  17. Kramer, K.; Degen, B.; Buschbom, J.; Hickler, T.; Thuiller, W.; Sykes, M.T.; de Winter, W. Modelling exploration of the future of European beech (Fagus sylvatica L.) under climate change-Range, abundance, genetic diversity and adaptive response. For. Ecol. Manag. 2010, 259, 2213–2222. [Google Scholar] [CrossRef]
  18. Muller, M.; Kempen, T.; Finkeldey, R.; Gailing, O. Low Population Differentiation but High Phenotypic Plasticity of European Beech in Germany. Forests 2020, 11, 1354. [Google Scholar] [CrossRef]
  19. Stojnic, S.; Orlovic, S.; Miljkovic, D.; Galic, Z.; Kebert, M.; von Wuehlisch, G. Provenance plasticity of European beech leaf traits under differing environmental conditions at two Serbian common garden sites. Eur. J. For. Res. 2015, 134, 1109–1125. [Google Scholar] [CrossRef]
  20. Vitasse, Y.; Hoch, G.; Randin, C.F.; Lenz, A.; Kollas, C.; Scheepens, J.F.; Körner, C. Elevational adaptation and plasticity in seedling phenology of temperate deciduous tree species. Oecologia 2013, 171, 663–678. [Google Scholar] [CrossRef]
  21. Kramer, K.; Ducousso, A.; Gomory, D.; Hansen, J.K.; Ionita, L.; Liesebach, M.; Lorent, A.; Schuler, S.; Sulkowska, M.; de Vries, S.; et al. Chilling and forcing requirements for foliage bud burst of European beech (Fagus sylvatica L.) differ between provenances and are phenotypically plastic. Agric. For. Meteorol. 2017, 234, 172–181. [Google Scholar] [CrossRef]
  22. Vitasse, Y.; Porte, A.J.; Kremer, A.; Michalet, R.; Delzon, S. Responses of canopy duration to temperature changes in four temperate tree species: Relative contributions of spring and autumn leaf phenology. Oecologia 2009, 161, 187–198. [Google Scholar] [CrossRef]
  23. Lindner, M.; Maroschek, M.; Netherer, S.; Kremer, A.; Barbati, A.; Garcia-Gonzalo, J.; Seidl, R.; Delzon, S.; Corona, P.; Kolstrom, M.; et al. Climate change impacts, adaptive capacity, and vulnerability of European forest ecosystems. For. Ecol. Manag. 2010, 259, 698–709. [Google Scholar] [CrossRef]
  24. Richardson, A.D.; Keenan, T.F.; Migliavacca, M.; Ryu, Y.; Sonnentag, O.; Toomey, M. Climate change, phenology, and phenological control of vegetation feedbacks to the climate system. Agric. For. Meteorol. 2013, 169, 156–173. [Google Scholar] [CrossRef]
  25. Zohner, C.M.; Mo, L.D.; Renner, S.S.; Svenning, J.C.; Vitasse, Y.; Benito, B.M.; Ordonez, A.; Baumgarten, F.; Bastin, J.F.; Sebald, V.; et al. Late-spring frost risk between 1959 and 2017 decreased in North America but increased in Europe and Asia. Proc. Natl. Acad. Sci. USA 2020, 117, 12192–12200. [Google Scholar] [CrossRef] [PubMed]
  26. Puchałka, R.; Koprowski, M.; Gričar, J.; Przybylak, R. Does tree-ring formation follow leaf phenology in Pedunculate oak (Quercus robur L.)? Eur. J. For. Res. 2017, 136, 259–268. [Google Scholar] [CrossRef] [Green Version]
  27. Sangües-Barreda, G.; Di Filippo, A.; Piovesan, G.; Rozas, V.; Di Fiore, L.; Garcia-Hidalgo, M.; García Cervigón, A.I.; Muñoz-Garachana, D.; Baliva, M.; Olano, J.M. Warmer springs have increased the frequency and extension of late-frost defoliations in southern European beech forests. Sci. Total Environ. 2021, 775, 145860. [Google Scholar] [CrossRef]
  28. Ningre, F.; Colin, F. Frost damage on the terminal shoot as a risk factor of fork incidence on common beech (Fagus sylvatica L.). Ann. For. Sci. 2007, 64, 79–86. [Google Scholar] [CrossRef] [Green Version]
  29. Hufkens, K.; Friedl, M.A.; Keenan, T.F.; Sonnentag, O.; Bailey, A.; O’Keefe, J.; Richardson, A.D. Ecological impacts of a widespread frost event following early spring leaf-out. Glob. Chang. Biol. 2012, 18, 2365–2377. [Google Scholar] [CrossRef]
  30. Dittmar, C.; Fricke, W.; Elling, W. Impact of late frost events on radial growth of common beech (Fagus sylvatica L.) in Southern Germany. Eur. J. For. Res. 2006, 125, 249–259. [Google Scholar] [CrossRef]
  31. Augspurger, C.K. Frost damage and its cascading negative effects on Aesculus glabra. Plant Ecol. 2011, 212, 1193–1203. [Google Scholar] [CrossRef]
  32. Vitasse, Y.; Rebetez, M. Unprecedented risk of spring frost damage in Switzerland and Germany in 2017. Clim. Chang. 2018, 149, 233–246. [Google Scholar] [CrossRef]
  33. Utkina, I.A.; Rubtsov, V.V. Studies of Phenological Forms of Pedunculate Oak. Contemp. Probl. Ecol. 2017, 10, 804–811. [Google Scholar] [CrossRef]
  34. Dolnicki, A.; Kraj, W. Leaf morphology and the dynamics of frost-hardiness of shoots in two phenological forms of European beech (Fagus sylvatica L.) from Southern Poland. Electronic Journal of Polish Agricultural Universities. 2001. 4. Available online: http://www.ejpau.media.pl/volume4/issue2/forestry/art-01.html (accessed on 27 October 2021).
  35. Kraj, W.; Sztorc, A. Genetic structure and variability of phenological forms in the European beech (Fagus sylvatica L.). Ann. For. Sci. 2009, 66, 203. [Google Scholar] [CrossRef] [Green Version]
  36. Kempf, M.; Banach, J.; Skrzyszewska, K. Morphological variability of beech leaves from early and late flushing provenances. Balt. For. 2018, 24, 210–217. [Google Scholar]
  37. Savolainen, O.; Pyhäjärvi, T.; Knürr, T. Gene Flow and Local Adaptation in Trees. Annu. Rev. Ecol. Evol. Syst. 2007, 38, 595–619. [Google Scholar] [CrossRef]
  38. Alberto, F.J.; Aitken, S.N.; Alia, R.; Gonzalez-Martinez, S.C.; Hanninen, H.; Kremer, A.; Lefevre, F.; Lenormand, T.; Yeaman, S.; Whetten, R.; et al. Potential for evolutionary responses to climate change—Evidence from tree populations. Glob. Chang. Biol. 2013, 19, 1645–1661. [Google Scholar] [CrossRef] [Green Version]
  39. Kawecki, T.J.; Ebert, D. Conceptual issues in local adaptation. Ecol. Lett. 2004, 7, 1225–1241. [Google Scholar] [CrossRef] [Green Version]
  40. Frank, A.; Pluess, A.R.; Howe, G.T.; Sperisen, C.; Heiri, C. Quantitative genetic differentiation and phenotypic plasticity of European beech in a heterogeneous landscape: Indications for past climate adaptation. Perspect. Plant Ecol. Evol. Syst. 2017, 26, 1–13. [Google Scholar] [CrossRef]
  41. Robson, T.M.; Alia, R.; Bozic, G.; Clark, J.; Forsteuter, M.; Gomory, D.; Liesebach, M.; Mertens, P.; Rasztovits, E.; Zitova, M.; et al. The timing of leaf flush in European beech (Fagus sylvatica L.) saplings. In Genetic Resources of European Beech (Fagus Sylvatica L.) for Sustainable Forestry, Proceedings of the COST E52 Final Meeting, Burgos, Spain, 4–6 May 2010; INIA: Madrid, Spain, 2011; Volume 22, pp. 61–80. [Google Scholar]
  42. Belsky, A.J. Does Herbivory Benefit Plants—A Review of the Evidence. Am. Nat. 1986, 127, 870–892. [Google Scholar] [CrossRef]
  43. D’Orangeville, L.; Maxwell, J.; Kneeshaw, D.; Pederson, N.; Duchesne, L.; Logan, T.; Houle, D.; Arseneault, D.; Beier, C.M.; Bishop, D.A.; et al. Drought timing and local climate determine the sensitivity of eastern temperate forests to drought. Glob. Chang. Biol. 2018, 24, 2339–2351. [Google Scholar] [CrossRef]
  44. Fick, S.E.; Hijmans, R.J. WorldClim 2: New 1-km spatial resolution climate surfaces for global land areas. Int. J. Climatol. 2017, 37, 4302–4315. [Google Scholar] [CrossRef]
  45. R_Core_Team. R: A Language and Environment for Statistical Computing; R Foundation for Statistical Computing: Vienna, Austria, 2019. [Google Scholar]
  46. Bates, D.; Machler, M.; Bolker, B.M.; Walker, S.C. Fitting Linear Mixed-Effects Models Using lme4. J. Stat. Softw. 2015, 67, 1–48. [Google Scholar] [CrossRef]
  47. Christensen, R.H.B. Ordinal: Regression Models for Ordinal Data. R Package Version 2015.6–28. 2015. Available online: http://www.cran.r-project.org/package=ordinal/ (accessed on 9 November 2020).
  48. Chung, H.; Muraoka, H.; Nakamura, M.; Han, S.; Muller, O.; Son, Y. Experimental warming studies on tree species and forest ecosystems: A literature review. J. Plant Res. 2013, 126, 447–460. [Google Scholar] [CrossRef]
  49. Fu, Y.S.; Campioli, M.; Vitasse, Y.; De Boeck, H.J.; Van den Berge, J.; AbdElgawad, H.; Asard, H.; Piao, S.; Deckmyn, G.; Janssens, I.A. Variation in leaf flushing date influences autumnal senescence and next year’s flushing date in two temperate tree species. Proc. Natl. Acad. Sci. USA 2014, 111, 7355–7360. [Google Scholar] [CrossRef] [Green Version]
  50. Di Iorio, A.; Giacomuzzi, V.; Chiatante, D. Acclimation of fine root respiration to soil warming involves starch deposition in very fine and fine roots: A case study in Fagus sylvatica saplings. Physiol. Plant. 2016, 156, 294–310. [Google Scholar] [CrossRef]
  51. Martinez-Vilalta, J.; Sala, A.; Asensio, D.; Galiano, L.; Hoch, G.; Palacio, S.; Piper, F.I.; Lloret, F. Dynamics of non-structural carbohydrates in terrestrial plants: A global synthesis. Ecol. Monogr. 2016, 86, 495–516. [Google Scholar] [CrossRef]
  52. Saxe, H.; Cannell, M.G.R.; Johnsen, B.; Ryan, M.G.; Vourlitis, G. Tree and forest functioning in response to global warming. New Phytol. 2001, 149, 369–399. [Google Scholar] [CrossRef]
  53. Frank, A.; Heiri, C.; Kupferschmid, A.D. Growth and quality of Fagus sylvatica saplings depend on seed source, site, and browsing intensity. Ecosphere 2019, 10, e02580. [Google Scholar] [CrossRef] [Green Version]
  54. Wiley, E.; Casper, B.B.; Helliker, B.R. Recovery following defoliation involves shifts in allocation that favour storage and reproduction over radial growth in black oak. J. Ecol. 2017, 105, 412–424. [Google Scholar] [CrossRef]
  55. Zohner, C.M.; Rockinger, A.; Renner, S.S. Increased autumn productivity permits temperate trees to compensate for spring frost damage. New Phytol. 2019, 221, 789–795. [Google Scholar] [CrossRef]
  56. Pagter, M.; Andersen, U.B.; Andersen, L. Winter warming delays dormancy release, advances budburst, alters carbohydrate metabolism and reduces yield in a temperate shrub. AoB Plants 2015, 7, plv024. [Google Scholar] [CrossRef] [Green Version]
  57. Fernandez, E.; Cuneo, I.F.; Luedeling, E.; Alvarado, L.; Farias, D.; Saa, S. Starch and hexoses concentrations as physiological markers in dormancy progression of sweet cherry twigs. Trees 2019, 33, 1187–1201. [Google Scholar] [CrossRef]
  58. Augspurger, C.K. Spring 2007 warmth and frost: Phenology, damage and refoliation in a temperate deciduous forest. Funct. Ecol. 2009, 23, 1031–1039. [Google Scholar] [CrossRef]
  59. Principe, A.; van der Maaten, E.; van der Maaten-Theunissen, M.; Struwe, T.; Wilmking, M.; Kreyling, J. Low resistance but high resilience in growth of a major deciduous forest tree (Fagus sylvatica L.) in response to late spring frost in southern Germany. Trees 2017, 31, 743–751. [Google Scholar] [CrossRef]
  60. Vitasse, Y.; Delzon, S.; Bresson, C.C.; Michalet, R.; Kremer, A. Altitudinal differentiation in growth and phenology among populations of temperate-zone tree species growing in a common garden. Can. J. For. Res. 2009, 39, 1259–1269. [Google Scholar] [CrossRef] [Green Version]
  61. Vitasse, Y.; Basler, D. What role for photoperiod in the bud burst phenology of European beech. Eur. J. For. Res. 2013, 132, 851–864. [Google Scholar] [CrossRef]
  62. Williams, M.I.; Dumroese, R.K. Preparing for Climate Change: Forestry and Assisted Migration. J. For. 2013, 111, 287–297. [Google Scholar] [CrossRef]
  63. Gomory, D.; Krajmerova, D.; Hrivnak, M.; Longauer, R. Assisted migration vs. close-to-nature forestry: What are the prospects for tree populations under climate change? Cent. Eur. For. J. 2020, 66, 63–70. [Google Scholar] [CrossRef]
  64. Vitasse, Y.; Bottero, A.; Cailleret, M.; Bigler, C.; Fonti, P.; Gessler, A.; Levesque, M.; Rohner, B.; Weber, P.; Rigling, A.; et al. Contrasting resistance and resilience to extreme drought and late spring frost in five major European tree species. Glob. Chang. Biol. 2019, 25, 3781–3792. [Google Scholar] [CrossRef] [PubMed]
  65. Dolschak, K.; Gartner, K.; Berger, T.W. The impact of rising temperatures on water balance and phenology of European beech (Fagus sylvatica L.) stands. Modeling Earth Syst. Environ. 2019, 5, 1347–1363. [Google Scholar] [CrossRef] [PubMed] [Green Version]
Figure 1. Schematic representation of plant responses to stress.
Forests 12 01604 g001
Figure 2. Climate at the growth sites of the provenances of F. sylvatica L.(data from WorldClim). (a) Mean monthly maximum temperature; (b) mean monthly minimum temperature; (c) mean monthly precipitation. Abbreviations of provenances in Table 1.
Forests 12 01604 g002
Figure 3. Time line indicating the temperature treatment in the spring of 2018 (horizontal red arrow), the frost event in the spring of 2019 (vertical red arrow) and measurements on the plants during the years 2018 till 2020. H: plant height; D: stem diameter; CC: relative chlorophyll content (CC1: up till 29 July, CC2: after 29 July); BB: bud burst and LS: leaf senescence.
Forests 12 01604 g003
Figure 4. Mean and standard deviation for height (a) and diameter (b) of the plants from 2017 to 2020 according to the temperature treatment in the spring of 2018.
Forests 12 01604 g004
Figure 5. Modelled probabilities of having reached the given score levels for bud burst in 2018 (a), for leaf senescence in 2018 (b) and for bud burst in 2019 (c). The probabilities depend on the temperature treatment in the spring of 2018. Leaf senescence additionally depends on the height of the plants (model fit shown for lower and upper quartiles).
Forests 12 01604 g005
Figure 6. Modeled probability of displaying frost damage in the spring of 2019, depending on the temperature treatment in the spring of 2018.
Forests 12 01604 g006
Figure 7. Mean and standard deviation for height (a) and diameter (b) of the plants from 2017 to 2020 according to the frost damage that occurred in the spring of 2019.
Forests 12 01604 g007
Figure 8. Mean and standard deviation for relative leaf chlorophyll content of the seedlings in 2019, according to the temperature treatment in 2018 (a) and the late spring frost in the spring of 2019 (b).
Forests 12 01604 g008
Figure 9. Modelled probabilities of having reached the given score levels for leaf senescence in 2019 (a,b) and for bud burst in 2020 (c). The probabilities depend on the temperature treatment in the spring of 2018 (a) and on the late spring frost in 2019 (b,c). Leaf senescence depends on the height of the plants (model fit in (a) for lower and upper quartiles).
Forests 12 01604 g009
Figure 10. Box plots displaying the height (a) and diameter (b) of the plants in 2017, the diameter increment in 2018 (c) and 2019 (d), and the height increment (e) and diameter increment (f) of the plants in 2020, for the different provenances in the common garden. Any provenance differing significantly from Sonian (“a”), which is the standard provenance in the modelling to which the other provenances are compared, is given a letter “b”. Provenances that do not differ significantly are also given an “a”. Abbreviations of provenances are in Table 1.
Forests 12 01604 g010
Figure 11. Differentiation among the provenances in the modelling analysis. Only the provenances that differ significantly from the standard provenance Sonian are shown: modelled bud burst in 2018 (a) and 2019 (b) for the two temperature conditions in the spring of 2018; modelled bud burst in 2020 (c). Abbreviations of provenances are in Table 1.
Forests 12 01604 g011
Figure 12. Modelled frost damage in 2019. Only the provenances that differ significantly from the standard provenance Sonian are shown. Abbreviations of provenances are in Table 1.
Forests 12 01604 g012
Table 1. Description of the sampled beech provenances. Abb.: abbreviation with l = local (autochthonous) and nl = non-local (non-autochthonous) at the home site.
Country/Region/CityProvenance NameOrigin (Climate) at Home SiteAbb.LatitudeLongitudeAltitude (m)
Belgium, Flanders, BrusselsSonianLocal (Atlantic)Fs_l50.7552744.418704132
Belgium, Flanders, WetterenWarandeLocal (Atlantic)Fw_l51.0076123.9049239
Belgium, Flanders, AsCaelenbergLocal (Atlantic)Fc_l51.0284845.60810681
Belgium, Flanders, VoerenRoodbosLocal (continental)Fr_l50.7424255.854472273
Belgium, Flanders, HalleHallerbosLocal (Atlantic)Fh_l50.70364.283928138
Belgium, Flanders, HalleHallerbosNon-local: German *Fh_nl50.70364.283928138
Belgium, Flanders, BrakelBrakelbosNon-local: German *Fb_nl50.7709693.720924124
Spain, PyreneesLinas De BrotoLocal (alpine)S42.630049−0.1690681270
Belgium, Walloon regionRurbuschLocal (continental)W50.5060356.163101604
The Netherlands, NunspeetElspeterboschLocal (Atlantic)N52.2924675.81791657
* Exact origin unknown, planted as WWI war reparation.
Table 2. Description of the beech seedlings in the common garden experiment. Abb.: abbreviation of provenance; n° mpl: number of mother plants from which seedlings were obtained; n° 2017: number of seedlings at the start of the experiment; n°t c/w: number of seedlings in the cold (c) and warm (w) temperature treatment in the spring of 2018; n° 2019: number of remaining seedlings at the beginning of 2019 that were exposed to spring frost; % frost: percentage of seedlings with visual frost damage in 2019. Abbreviation of provenances are in Table 1.
Abb.n° mpln° 2017n°t c/wn° 2019% frost
Fs_l44020/203918
Fw_l22010/10186
Fc_l33015/152638
Fr_l54924/254846
Fh_l1105/51010
Fh_nl33015/152931
Fb_nl32513/122365
S66030/305459
W2199/101839
N32814/142528
Publisher’s Note: MDPI stays neutral with regard to jurisdictional claims in published maps and institutional affiliations.

