Article

Assessment of Structural Differences between Water-Extracted and Non-Extracted Hydro-Thermally Treated Spruce Wood by NIR Spectroscopy

1
Graduate School of Life and Environment Sciences, University of Tsukuba, Tsukuba 305-8577, Japan
2
Petru Poni Institute of Macromolecular Chemistry of the Romanian Academy, 700487 Iasi, Romania
3
Graduate School of Bioagricultural Sciences, Nagoya University, Nagoya 464-8601, Japan
*
Author to whom correspondence should be addressed.
Submission received: 1 November 2021 / Revised: 29 November 2021 / Accepted: 29 November 2021 / Published: 2 December 2021
(This article belongs to the Special Issue Thermal Modification of Wood: Process and Properties)

Abstract

:
Sitka spruce wood samples were subjected to different conditions of hydro-thermal treatment by varying the relative humidity (RH) and period of exposure at a constant temperature of 120 °C. Near infrared (NIR) spectroscopy, principal component analysis (PCA) and two dimensional correlation spectroscopy (2D-COS) were employed to examine the structural changes which occur in the wood samples during the applied treatment conditions and to quantify the differences between non-extracted and water-extracted wood specimens after the treatment. Modifications were dependent on the amount of water molecules present the medium and also on treatment time. Higher variations were observed for samples treated at higher RH values and for longer periods. At the same time, it was also observed that during the hydro-thermal treatment a high amount of extractives remain in the wood structure, extractives which vary in quantity and composition. PCA and 2D-COS made it possible to discriminate modifications in the wood samples according to treatment time and relative humidity. Non-extracted and water-extracted samples were also examined to identify the sequential order of band modification.

1. Introduction

Wood, a natural composite material, is used in many applications, but due to its structural features and depending on the environmental conditions (humidity, temperature and biological agents), it can be easily degraded. Three major components (cellulose, lignin and hemicelluloses) along with low molecular compounds are the major components of wood [1,2,3]. In order to understand wood degradation mechanisms taking place under natural environmental conditions (during material service life), many researchers have simulated accelerated ageing by using biodegradation factors, such as soft, brown and white rot fungi or termites [4,5,6]; thermal and hydro-thermal ageing [7,8,9] or weathering and UV light exposure [10,11].
Thermal and hydro-thermal treatments are often used to improve the dimensional stability, durability and hydrophobicity of wood [12,13,14], but at the same time they can be used as an accelerated technique to simulate the natural ageing of wood [7,8,9,15,16,17]. In order to simulate, as close as possible, natural ageing conditions, a certain amount of water should be added in the degradation medium, because natural ageing takes place at moderate relative humidity. However most studies were conducted in thermal dry conditions or in 100% RH atmosphere. Few studies investigate the intermediate values of RH during heating [7,8,9,17,18,19,20,21,22].
To investigate modifications taking place in wood during different treatments, spectral techniques, particularly near infrared spectroscopy (NIRS), are used, owing to a combination analysis speed, little or no sample preparation, ease of use, non-destructiveness, good reproducibility and low cost instrumentation [21,23]. Small changes in the chemical composition or physico-chemical properties of materials will cause spectral changes in diffusely reflected NIR radiation, with multiple chemical absorptions considerably affecting the shape of the near infrared spectra giving shifts in position of maxima, band intensity changes and baseline offset [6,7,23]. For wood, NIRS can be successfully used for the non-destructive evaluation of stiffness (i.e., [24]) and structural changes during thermal treatment [7,21,25].
Principal component analysis (PCA) is a well-established chemometric technique. By converting the data into the dimensionally reduced PCA space, the input data set is decomposed into two matrices of interest: scores and loadings [26,27]. The loadings matrix defines the new axes of the dimensionally reduced data set, while the scores matrix describes the samples in the PC space. With PCA, the most important features of the NIR spectra of examined samples can be identified, and band shifts and non-symmetries in bands amongst the samples can be quickly determined [7,21,26].
Two dimensional correlation spectroscopy (2D-COS), a technique established by Noda in 1993 [28], is based on the computation of auto-correlation and cross-correlation between spectra and provides a graphical overview for the analysis of external perturbation induced variations. This external perturbation can be related to temperature, pressure, moisture, concentration, composition, pH or time change [28,29,30]. 2D correlation analysis can be applied to various types of systems, once the external perturbation is described as a specific function. The method was applied in wood science to both mid (i.e., [6,10,31]) and near infrared spectroscopy [7,21,32]. 2D-COS provides two different correlation maps: a synchronous map which displays correlations between the spectral bands changing in phase and indicate whether they increase or decrease relative to each other; and an asynchronous map, which relates to spectral bands that change at different rates and contains information about the sequence of the occurring events.
In previous papers [8,9], the time-temperature-superposition relationship for prediction of mass loss of wood after hydro-thermal treatment at arbitrary temperature and relative humidity, as well as the mass loss dependencies of vibrational properties and color parameters, were discussed. In this study, we intend to evaluate the relationship between the applied treatment and the related structural changes taking place, and to assess the differences between non-extracted and water-extracted samples after treatment by using NIRS, PCA and 2D-COS.

2. Materials and Methods

2.1. Materials

Sitka spruce (Picea sitchensis) wood samples cut from the same lumber (which was selected for use as harp soundboard) having an average density of 439 kg/m3 and dimensions 15 mm (radial) × 1.6 mm (tangential) × 120 mm (longitudinal) were used. The hygroscopic history during seasoning was removed by moistening the wood samples for 5 days at 100 %RH and 25 °C, and then vacuum drying on phosphorus pentoxide for 7 days at the same temperature.
For the hydrothermal treatment a closed system was used. The samples previously conditioned for 30 days at different values of RH (0, 35, 60, 80 or 91% RH) and 25 °C, were placed in an autoclave with different amounts of deionized water to achieve specified RH values (in the medium), then sealed and heated up to 120 °C. The system was equipped with thermocouple and pressure sensor (PHS-B-500KP, Kyowa Electronic Instruments Co., Tokyo, Japan). Details about the system and the calculation of the parameters are given in a previous paper [17]. For the treatment at 0% RH an air-circulating oven was used. The samples were treated for 1, 2, 4 and 7 days in five replicates.
After treatment all samples were removed from the autoclave, cooled at room temperature and vacuum dried on P2O5 to determine absolute dry mass.
To remove the decomposition products trapped in the wood, all samples were cut in half. One was kept for further analysis, while the other was soaked in the water at room temperature (20–25 °C) for a period of 8 days with the water replaced every day. After this period, the samples were again vacuum-dried on P2O5 for one week in order to determine again the absolute dry mass.
The two series of samples (non-extracted and extracted) were further analyzed.

2.2. Methods

Near Infrared spectra were recorded in the diffuse reflection mode for non-extracted and water-extracted control and hydro-thermal-treated wood samples on a NIRFlex-N500 instrument (BÜCHI Labortechnik AG, Flawil, Switzerland), in the 4000–10,000 cm−1 spectral range with 4 cm−1 intervals. Each sample was represented by five specimens.
In order to identify the differences which may appear after the hydro-thermal treatment and water extraction, the treated samples were compared with the non-treated ones, used as the control. The data processing and chemometric methods were performed using The Unscrambler® X 10.4.1 program (CAMO AS, Trondheim, Norway), and the generalized 2D correction spectra were processed in a Matlab program (developed by Maria-Cristina Popescu). For the NIR spectra and their second derivatives, as well as to draw the PC scores and 2D-COS maps only the medium spectrum obtained from the five components spectra was used. Second derivative spectra were obtained using Savitzky-Golay method with 21-points smoothing. For PCA, the second derivative spectra in the 4520–7104 cm−1 region were used. 2D-COS was employed to highlight the differences between the non-extracted and water-extracted specimens and to identify the sequential order of chemical modifications.

3. Results and Discussion

NIR spectroscopy is a useful and sensitive tool for highlighting the small modifications taking place in the wood structure during these treatments. The modifications induced by the hydro-thermal treatments in the structure and content of non-extracted and water-extracted Sitka spruce wood are reflected in the NIR bands intensities, maxima and width.

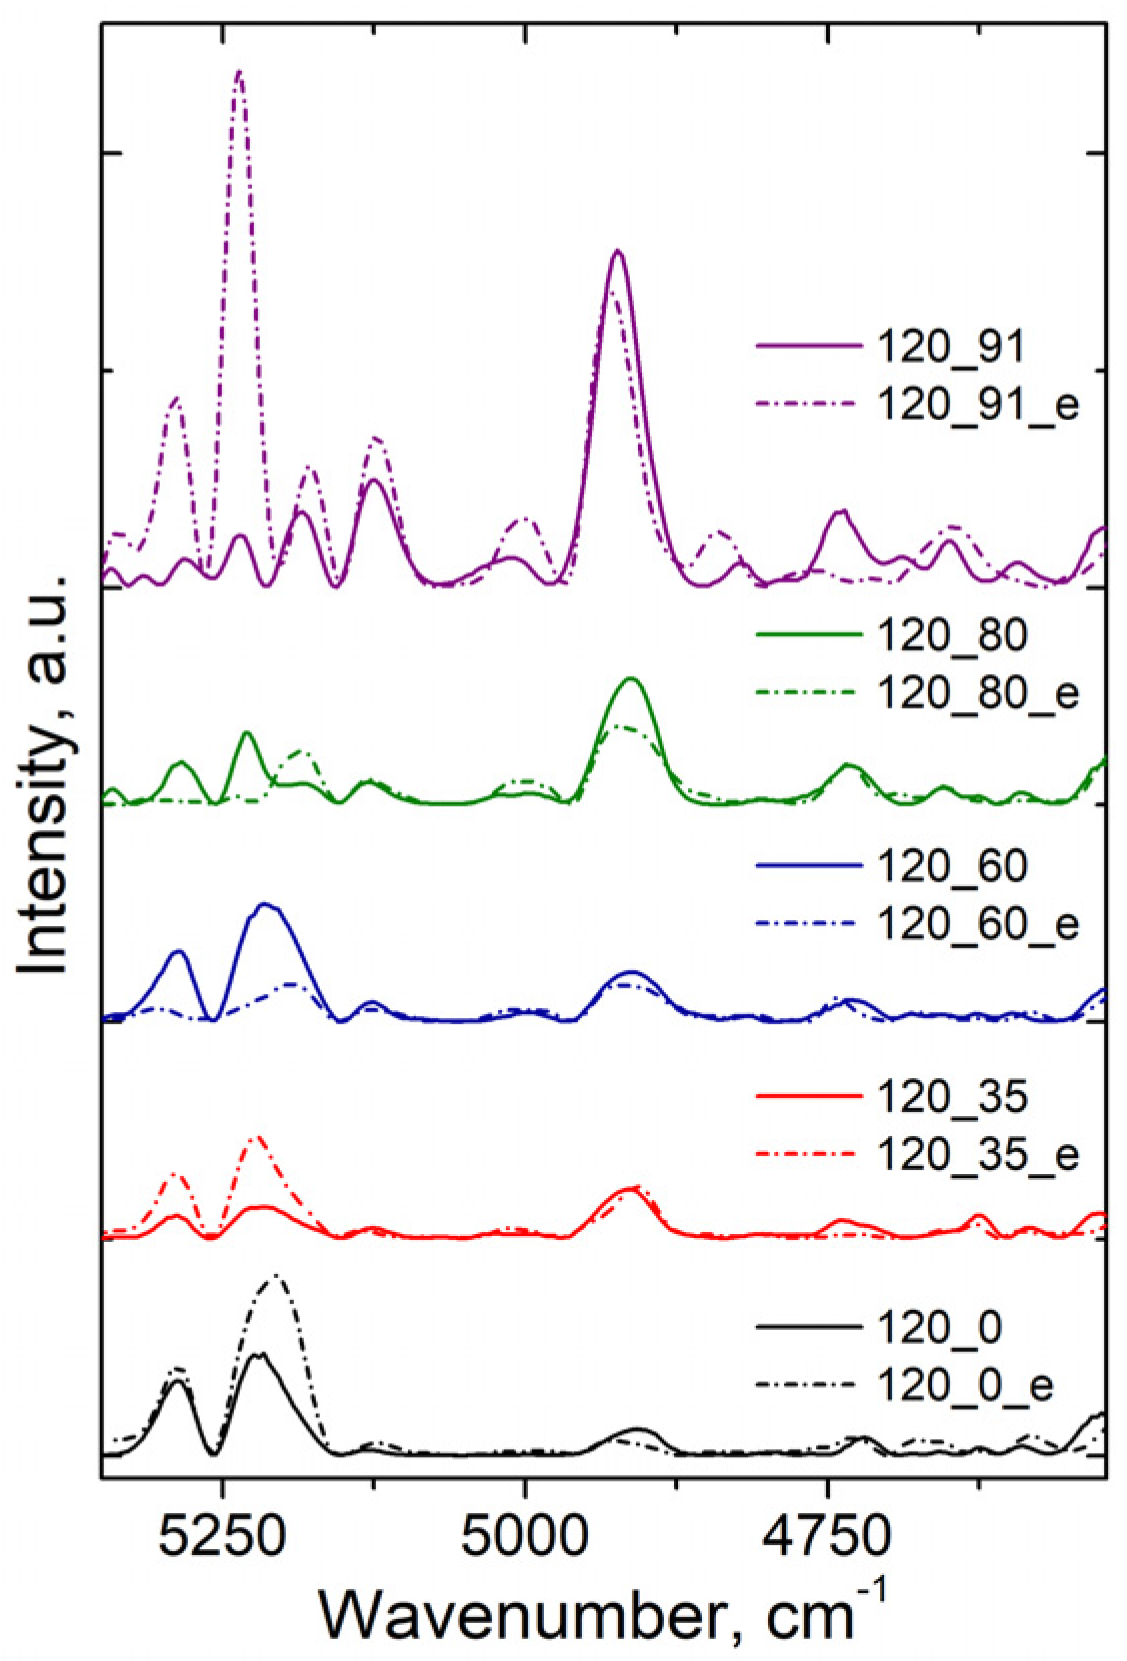
3.1. NIR Spectroscopy

NIR spectra for all samples (control/ untreated, hydro-thermally treated and hydro-thermally treated and water-extracted) were recorded on dried specimens. Independent of the applied treatment, the spectra (not shown) showed similar shapes with typical broad absorption bands. Small variations in band intensities and width, as well as shifting of their maxima were observed. In contrast to mid-infrared spectroscopy, in NIRS it is more difficult to assign bands to specific functional groups because broad spectral features are comprised of several overlapping signals. Moreover, the reason of increase or decrease a certain band intensity may be due to only one component band intensity modification or shifting of its position. Therefore, it is sensible to use the second derivative in order to examine the individual bands, and to detect the variations between the samples.
Figure 1 highlights second derivative spectra in two regions (4520–5350 cm−1—left side graphs and 5600–6950 cm−1—right side graphs), where higher differences between the sample sets were observed.
In the first region (4520–5350 cm−1) several bands were identified at 4559, 4632, 4676, 4756, 4816, 4878, 5092, 5140, 5216 and 5312 cm−1 and their assignments are presented in Table 1.
The bands from 5140, 5216 and 5312 cm−1 are generally overlapped with the band from water with a maximum at 5155 cm−1 [33], but in this case, the spectra of the dried specimens were recorded. Hence, there is little or no influence of water in the spectra. Therefore, these bands may be assigned to O-H groups involved in strong intramolecular hydrogen bonds [34], as well as to a 2nd overtone of C=O stretching vibration [23].
Two separate types of differences can be identified in the second derivative spectra of the studied samples: (I) the modifications induced by the hydro-thermal treatment (full line contours), and (II) the modifications induced by the water extraction process (dotted line contours).
During the treatment, the bands from 4630 and 4676 cm−1 slightly decrease for the treated samples at 0 and 35% RH, are almost constant for the hydro-thermal treated samples at 60% RH and increase for those treated at 80 and 91% RH, compared to the control. These variations are induced by the elimination and further formation of new compounds, mostly from hemicelluloses during the treatment [7], but also may be due to condensation reactions or some conformational and molecular rearrangements in lignin (lignin undergo glass transition around the temperature used for treatment, transitions which can be accelerated due to the presence of water molecules) [7,35,36]. The bands at 4756 and 4816 cm−1 are shifted to lower wavenumber, with 4756 cm−1 presenting a slight intensity increase, while for 4816 cm−1, intensity and width decreased. Bands at 5140, 5216 and 5312 cm−1 slightly increase in intensity with an increase of treatment time. These modifications are stronger when the moisture content in the samples increases during the treatment (i.e., 80 and 91% RH in the treatment environment).
Comparing non-extracted (full line contour) and water-extracted (dotted line contour) wood samples, a further decrease and shifting to lower wavenumber of bands from 4756 and 4816 cm−1, increase and shifting to lower wavenumber of the band from 5212 cm−1 and decrease/disappearance of the band from 5312 cm−1 is observed. The modification induced for these bands indicate that the non-volatile low molecular carbonyl or carboxyl compounds formed during treatment and trapped in the wood structure are leaching out in cold (room temperature) water. The band from 5212 cm−1 assigned to stronger intermolecular hydrogen bonds may reveal the formation of new hydrogen bonds after the removal of low molecular compounds from the wood structure.
In the second region (5600–6950 cm−1), the second derivative spectra reveal bands at: 5667, 5720, 5796, 5880, 5972, 6136, 6283, 6418, 6464, 6647, 6708, 6753 and 6908 cm−1. Band assignments are presented in Table 2.
After treatment, the band from 5667 cm−1 is shifted to 5680 cm−1 in the spectrum of the sample treated at 91 %RH, while the band from 5720 cm−1 increases in intensity with increasing time and RH values and is shifted to lower wavenumber, almost merging with the previous band at the higher relative humidity values. The other three bands (5796, 5880 and 5972 cm−1) present almost no modification for the samples treated at RH values of 0 and 35%, but modify at higher RH values. The first band (5796 cm−1) decreases and is shifted to lower wavenumber, while the other two bands (5880 and 5972 cm−1) increase in intensity with the increasing time and RH values. The reduction of the first band might be due to the degradation of hemicelluloses and/or their deacetylation, while the increase in intensity of the other two bands might be due to the relative increase and structural variation of lignin (demethoxylation and condensation reactions may occur in lignin structure during the thermal and hydro-thermal treatment). Similar behaviours have been reported by Bächle et al. [40] (for a higher temperature treatment), and by Popescu et al. [7], which used 130 °C and up to 25% RH.
The bands from 6647, 6708 and 6753 cm−1 decrease in intensity and shift to lower wavenumber, indicating modifications in the hydrogen-bonded OH groups. The band from 6908 cm−1 increases in intensity with the increase of the treatment time and RH values. The modifications in this region are due mostly to hemicelluloses degradation, but also amorphous cellulose or lignin can be affected, with the formation of new extractive compounds, which affect absorption bands in this region.
Comparing NIR spectra from non-extracted (full line contour) and water-extracted (dotted line contour) specimens, bands from 5796, 5880, 6647 and 6908 cm−1 decrease in intensity, while bands from 6708 and 6753 cm−1 are shifted towards each other and present a slight intensity decrease. The decrease in intensity of these bands is due to a decrease in the amount of CH groups as well as OH groups, which are involved in intermolecular hydrogen bond interactions. These observations indicate further the elimination of the non-volatile low molecular weight compounds containing OH groups in their structures and which were formed during hydro-thermal treatment and remain trapped in the wood structure.
The wet chemical analysis of extractives [22] indicated an increase in the water soluble low molecular weight compounds with an increase in water content in the autoclave during treatment (up to almost 16% for the treated samples at the highest RH level and for the longest period). At the same time, the content of monomeric and oligomeric structures varied among the applied treatment. The wood treated at values of RH lower than 75% presented oligomers as the major fraction in the water-extracted substances, while the samples treated at higher values presented large amounts of monomeric structures.

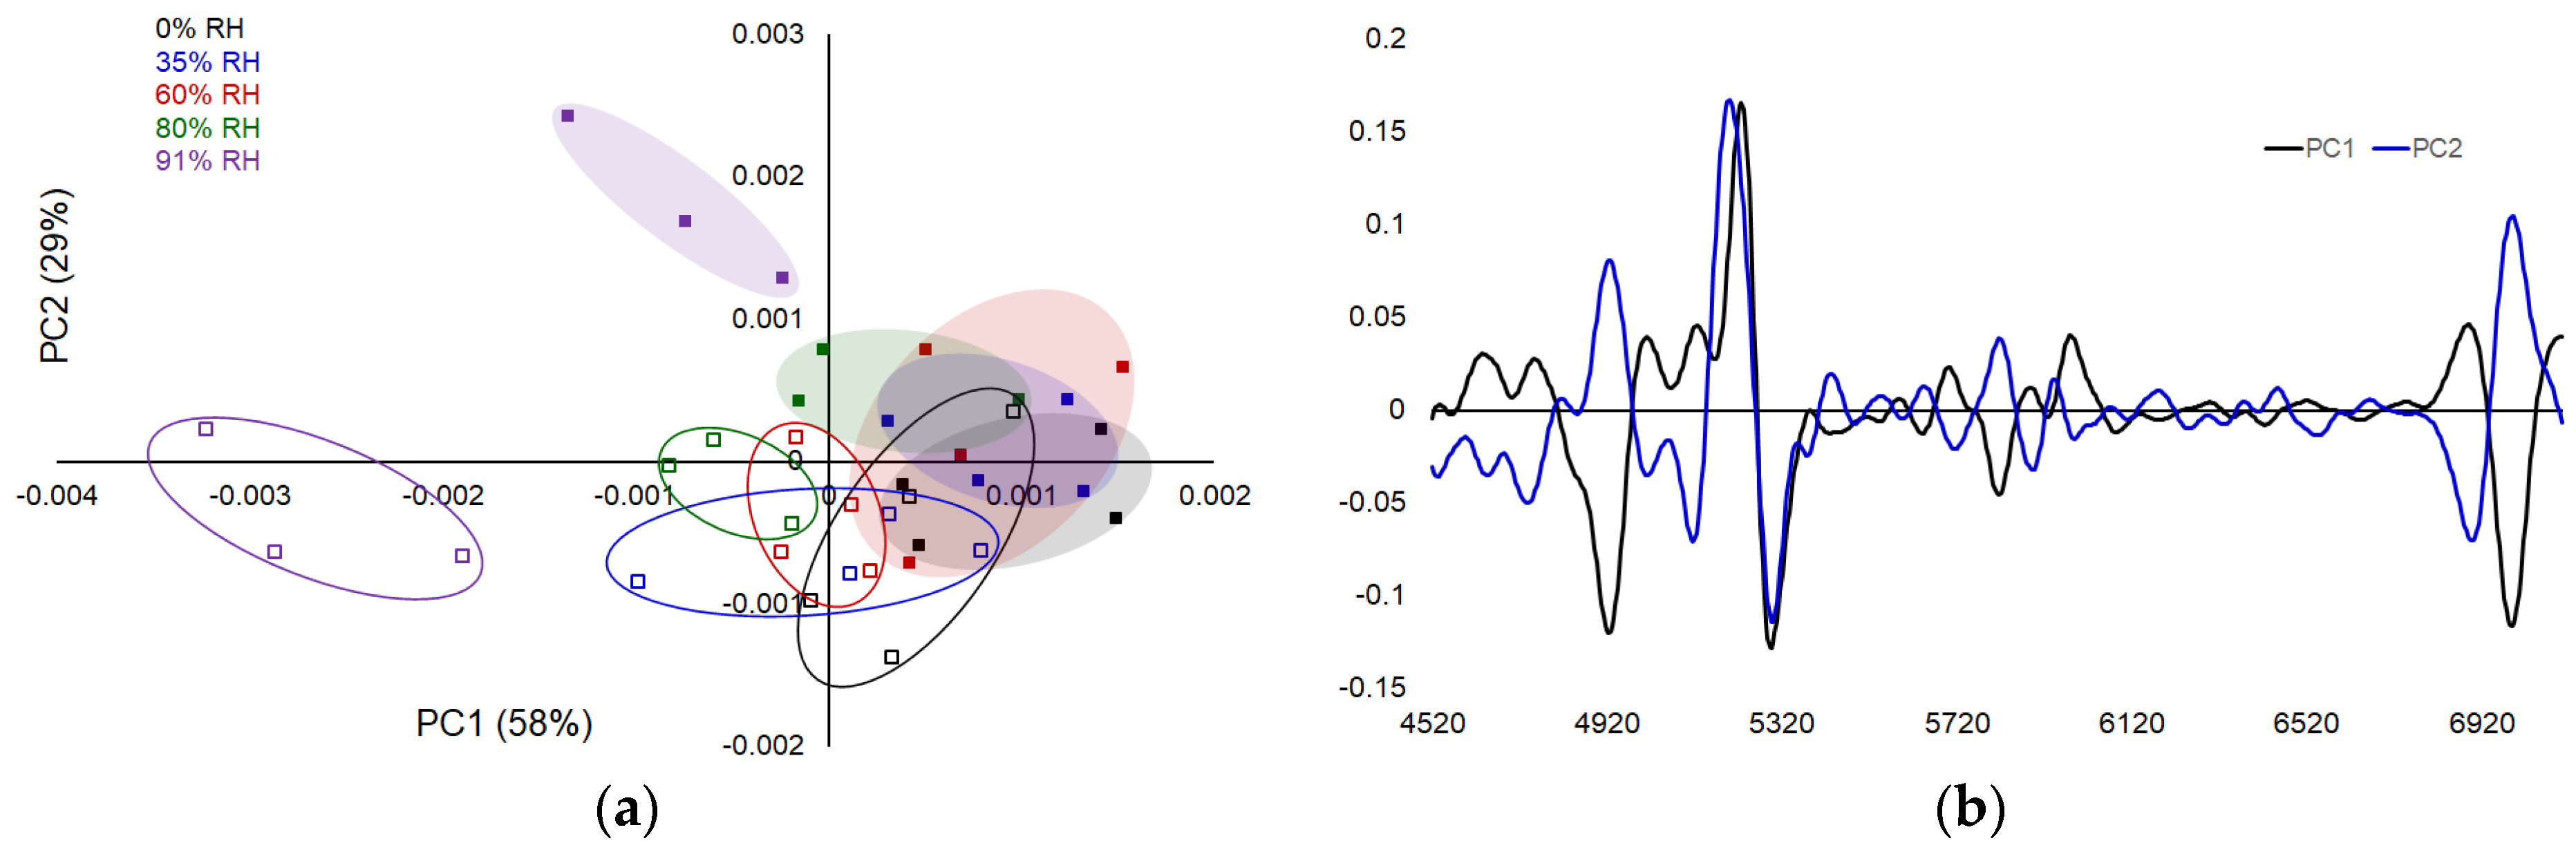
3.2. Principal Component Analysis (PCA)

PCA was used to compare the non-extracted and water-extracted spruce wood NIR spectra. Variations were identified by the first two principal components (PC1 and PC2) with 58% of the total variance in the spectra explained by PC1 and 29% explained by PC2. Therefore, the score and loading plots of the first two principal components can be used to explain the differences/similarities of constituents in terms of chemical structure.
The PC scores and loadings are presented in Figure 2. Because it would have been difficult to follow the colours and position of plots, it has been decided to use only the medium spectrum obtained from all the spectra with similar samples characteristics.
PC1 and PC2 scores are plotted in Figure 2a.
The PC1 explains all the spectral modification taking place due to applied treatment, while the PC2 can be attributed to the spectral differences as a function of the extraction process.
Figure 2b presents the chemical features (loading plots) which differentiate the treated specimens, as well as non-extracted and water-extracted ones. PC1 loadings show several negative (5296, 5820 and 6988 cm−1) and positive (4644, 4764, 5132, 5208, 5712, 5988 cm−1) bands. The negative signals appear to be shifts of the bands from 5312 and 5796 cm−1 assigned to weakly hydrogen-bonded OH groups in amorphous carbohydrates and CH groups in extractives [7,23,37], while the positive ones are shifts of the bands from 4632, 4756, 5140, 5216, 5720, 5972 and 6908 cm−1 assigned to CH groups in extractives and lignin as well as OH groups in extractives and amorphous carbohydrates [7,23,37].
PC2 loadings show negative bands at 4648, 4740, 5116, 5296, 5720, 5896, 6896 cm−1 and positive ones at 5204, 5824, 6996 cm−1. The negative signals are shifts of bands from 4632, 4756, 5140, 5312, 5720, 5880, 6908 cm−1 which are assigned to CH and C=O groups in extractives, hemicelluloses and lignin, as well as weakly hydrogen-bonded OH groups in extractives and amorphous carbohydrates [7,23,37]. The positive signals in PC2 loadings represent shifts of bands from 5216 and 5796 cm−1 which are assigned to CH groups in hemicelluloses and to weakly hydrogen-bonded OH groups in amorphous carbohydrates [7,23,37].
Because the bands assigned to extractives overlap with those assigned to lignin or hemicelluloses, it is difficult to identify their exact contribution. However, the bands appearing in PC2 loadings are opposite to those which appear in PC1.

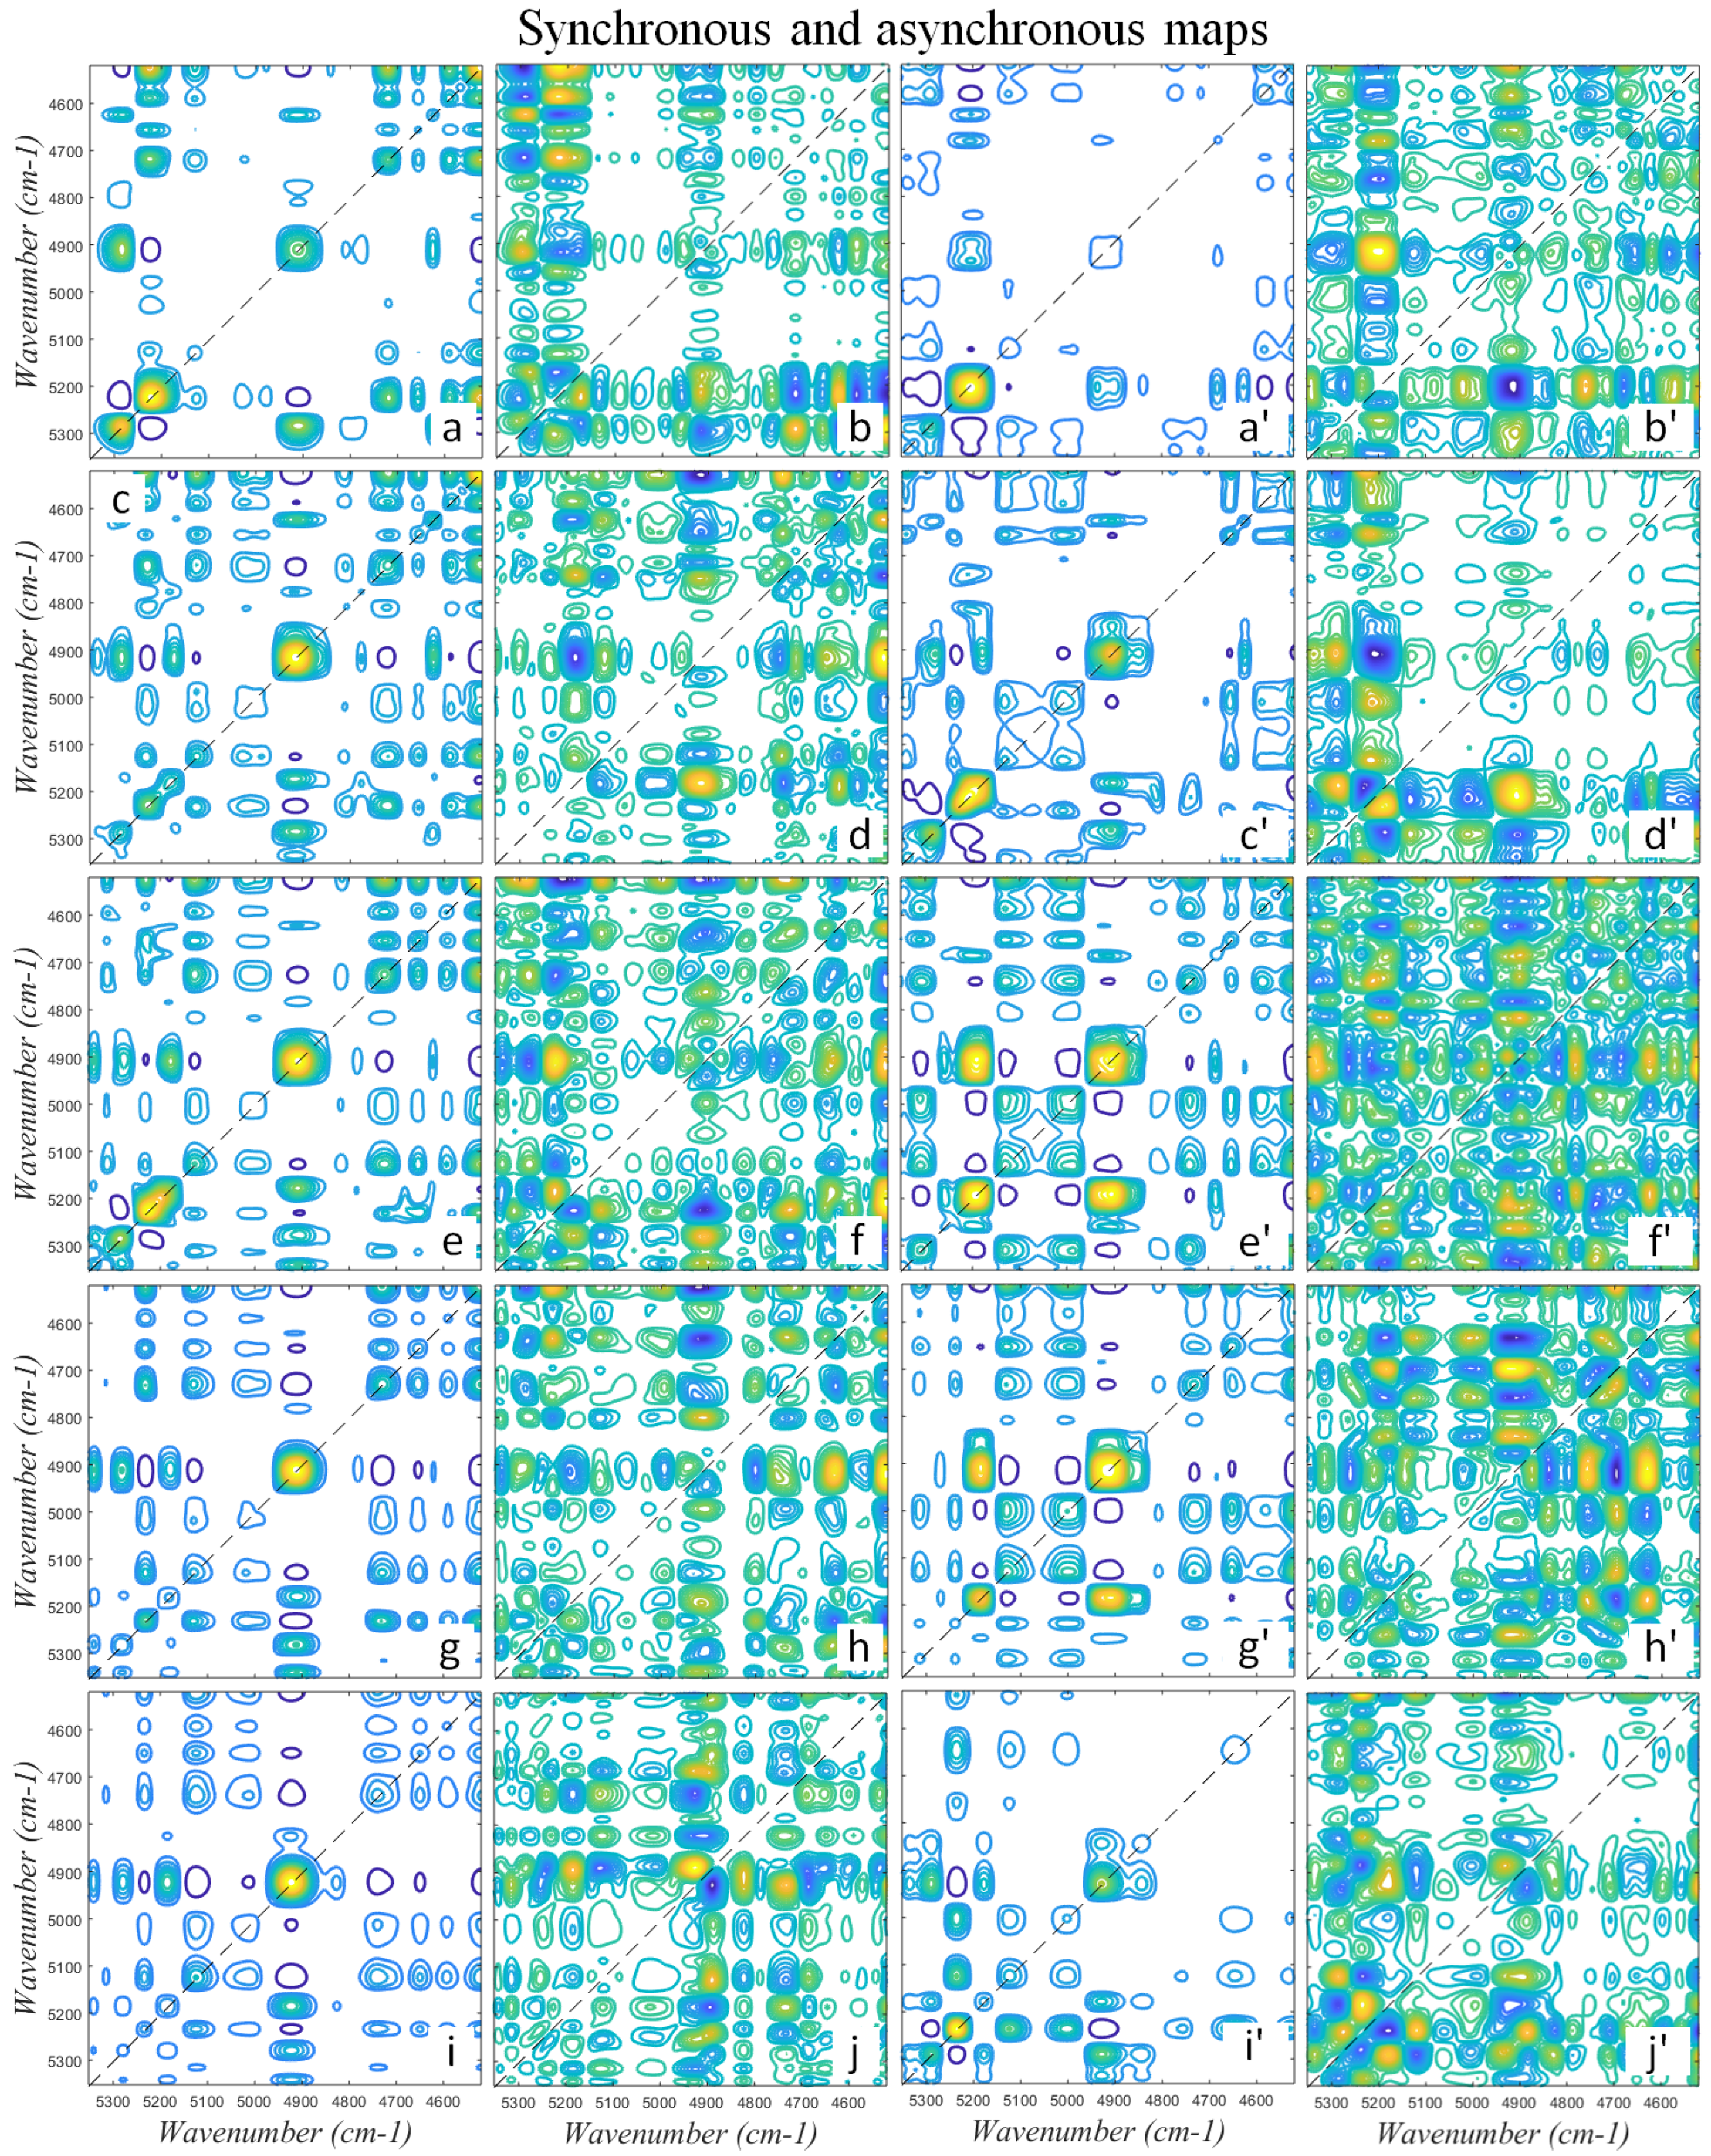
3.3. Two-Dimensional Correlation Spectroscopy (2D-COS)

2D-COS is a powerful tool used to observe differences appearing in wood during external perturbation. The method enhances spectral resolution and gives information that cannot be established through conventional or derivative spectra. It was performed to identify spectral sequences and better differentiate between the differences which appear after extraction in the structure of samples. Figure 3 present examples of the 2D-COS maps in the 4520–5350 cm−1 region.
Synchronous and asynchronous spectra present differences both for non-extracted and water-extracted samples, as well as when a certain level of RH is used during the treatment. Synchronous spectra of thermal treated samples at 0 % RH present fewer modifications, indicating only three auto-peaks at 5280, 5216 and 4890 cm−1 and a series of positive and negative cross-peaks related to them for the non-extracted samples (Figure 3a) and only two auto-peaks at 5288 and 5204 cm−1 in water-extracted samples (Figure 3a′). At the same time, the synchronous spectra of thermally treated samples at 91 % RH present eight auto-peaks at 5280, 5220, 5180, 5120, 4920, 4728, 4664 and 4580 cm−1 for non-extracted samples (Figure 3i) and at 5292, 5228, 5176, 5120, 4996, 4928, 4832, 4664 cm−1 for water-extracted samples (Figure 3i′) as well as a series of positive and negative cross-peaks related to them.
Figure 4 represents auto-correlation spectra extracted from the synchronous spectra and differences which appear in the intensities and positions of the maxima of the auto-peaks can be observed. Each set of samples present different behaviours, indicating the occurrence of different reactions taking place in the wood structure during treatment, reactions which are strongly dependent on the content of water present in the environment. At the same time, differences in auto-correlation spectra of non-extracted and water-extracted samples are observed, differences which appear to be more obvious for samples treated at high relative humidity. These modifications are correlated with the modifications observed in second derivative spectra, as well as loading plots.
Combining both synchronous and asynchronous spectra and following Noda’s rules [28,30] it was possible to identify the auto-peaks and cross-peaks, as well as the sequential order of band modification under hydro-thermal treatment, as follows:
120_0_n: 4570 cm−1 > 4612 cm−1 > 4650 cm−1 > 4904 cm−1 > 5280 cm−1 > 5216 cm−1
120_0_e: 5116 cm−1 > 5204 cm−1 > 5288 cm−1 > 4920 cm−1 > 4724 cm−1 > 4668 cm−1, 4628 cm−1 > 4580 cm−1
120_35_n: 4570 cm−1 > 4612 cm−1 > 4650 cm−1 > 4904 cm−1 > 5280 cm−1 > 5216 cm−1
120_35_e: 5116 cm−1 > 5204 cm−1 > 5288 cm−1 > 4920 cm−1 > 4724 cm−1 > 4668 cm−1, 4628 cm−1 > 4580 cm−1
120_60_n: 4570 cm−1 > 4650 cm−1 > 4724 cm−1 > 4915 cm−1 > 5120, 5216 cm−1 > 5280 cm−1
120_60_e: 5120 cm−1 > 5210 cm−1 > 5280 cm−1 > 4570, 4990 cm−1 > 4910 cm−1 > 4665 cm−1 > 4740 cm−1
120_80_n: 4724 cm−1 > 5225, 5128 cm−1 > 4916 cm−1 > 4652 cm−1 > 4590 cm−1 > 5172 cm−1 > 5280 cm−1
120_80_e: 5288 cm−1 > 5130, 5188 cm−1 > 4921 cm−1 > 4995 cm−1 > 4740 cm−1 > 4570 cm−1 > 5240 cm−1 > 4650 cm−1
120_91_n: 4728 cm−1 > 5120 cm−1 > 4920 cm−1 > 4590 cm−1 > 4664 cm−1 > 5230 cm−1 > 5180 cm−1 > 5284 cm−1
120_91_e: 5292 cm−1 > 5228 cm−1 > 5120 cm−1 > 5176 cm−1 > 4750 cm−1, 4832 cm−1, 4996 cm−1 > 4928 cm−1 > 4664 cm−1
In non-extracted samples the bands related to O-H, C-H groups in hemicelluloses are modified first, followed by the C=O and C-H groups in extractives and lignin, and O-H groups involved in stronger hydrogen bonds. In water-extracted samples it is observed that the first modifications occur for the bands assigned to O-H groups involved in stronger hydrogen bonds followed by C=O and C-H groups from extractives and lignin.
It is known that a series of processes takes place when wood is exposed to thermal or hydro-thermal treatment. During the thermal treatment in dry conditions, wood (especially hemicelluloses, extractives and to some extent lignin) undergoes a series of reactions, such as: oxidation, dehydration and/or decarboxylation combined with mass and heat transfer, as well as molecular rearrangements and conformational changes. In wet conditions (depending on the amount of water present in the medium)—hydro-thermal treatment—the degradation reactions occur more quickly and hydrolysis reactions occur prior to oxidation (due to water which act as a catalyst) leading to the formation of saturated and unsaturated structures and the crystallization of wood cellulose might be affected [7,21,41]. The degradation of wood components is reached mostly by means of hydronium catalysed reactions, at a first stage, when these ions are generated from the water molecule autohydrolysis, followed by generation of the acetic acid (the hydrolysis of the acetyl groups from the wood structure). Further ionization provides most of the catalytic species involved in the degradation process [42]. Dehydration reactions cause the decomposition of hydrolysed sugars and deacetylation is caused by the cleavage of acetyl groups linked as ester groups to hemicelluloses. Moreover, it has been mentioned in the literature [12] that the presence of water molecules in the medium, during the thermal process can prevent oxidative processes, “favouring” hydrolysis. All depends on the wood structure—the susceptibility to hydro thermolysis of a specific type of wood depends on its ability to generate acetic acid in the reaction media [43] as well as the applied temperature, treatment time, and moisture content.

4. Conclusions

Sitka spruce wood samples were treated at 120 °C using different values (0, 35, 60, 80 and 91%) of relative humidity during treatment. After treatment, the modifications were analyzed by NIR spectroscopy coupled with PCA and 2D-COS. Modification in chemical structure of thermally and hydro-thermally treated wood were observed, with higher variation occurring with an increase in time and RH. Hemicelluloses were the most sensitive to the applied treatment, but also lignin and cellulose were affected to some extent. Thermal degradation of hemicelluloses starts with the release of acetic acid in the medium, which induces further the acid catalysed reactions. Modification in the cellulose structure by affecting the semi-crystalline and crystalline regions and demethoxylation and condensation reactions in lignin structure were also observed. All these modifications result in the release of low molecular weight compounds which are released during treatment, and were extracted in water or remained trapped in the wood.
Further PCA was able to separate the modifications occurring in wood structure according to relative humidity variations and time (via PC1) and non-extracted and extracted wood (via PC2). 2D-COS gave information about the sequential order of modifications taking place in the wood structure after the hydro-thermal treatment and water extraction.

Author Contributions

Conceptualization, C.-M.P. and E.O.; methodology, C.-M.P. and T.G.; software, C.-M.P.; investigation, C.-M.P., N.Z., K.E., M.M.-U.; resources, E.O.; writing—original draft preparation, C.-M.P.; writing—review and editing, C.-M.P., E.O., T.G., N.Z., K.E., M.M.-U.; funding acquisition, E.O. All authors have read and agreed to the published version of the manuscript.

Funding

This research was funded by JSPS (FY2018-L18536) International Research Fellowship Program.

Data Availability Statement

Data available on request.

Acknowledgments

This work has been performed under the JSPS (FY2018) International Research Fellowship Program. Carmen-Mihaela Popescu acknowledges the financial support as a JSPS International Research Fellow—FY2018-L18536.

Conflicts of Interest

The authors declare no conflict of interest.

References

  1. Chang, T.C.; Chang, H.T.; Wu, C.L.; Lin, H.Y.; Chang, S.T. Stabilizing effect of extractives on the photo-oxidation of Acacia confusa wood. Polym. Degrad. Stabil. 2010, 95, 1518–1522. [Google Scholar] [CrossRef]
  2. Mazela, B.; Popescu, C.-M. Solid Wood, in Ch2: Wood as bio-based building materials. In Performance of Bio-Based Building Materials; Jones, D., Brischke, C., Eds.; Wood head Publishing Elsevier: Sawston, UK, 2017; pp. 22–39. [Google Scholar]
  3. Assor, C.; Placet, V.; Chabbert, B.; Habrant, A.; Lapierre, C.; Pollet, B.; Perre, P. Concomitant changes in viscoelastic properties and amorphous polymers during the hydrothermal treatment of hardwood and softwood. J. Agric. Food Chem. 2009, 57, 6830–6837. [Google Scholar] [CrossRef]
  4. Fackler, K.; Schwanninger, M. Accessibility of hydroxyl groups of brown-rot degraded spruce wood to heavy water. J. Near Infrared Spectrosc. 2011, 19, 359–368. [Google Scholar] [CrossRef]
  5. Lekounougou, S.; Kocaefe, D. Comparative study on the durability of heat-treated White Birch (Betula papyrifera) subjected to the attack of brown and white rot fungi. Wood Mater. Sci. Eng. 2012, 7, 101–106. [Google Scholar] [CrossRef]
  6. Popescu, C.-M.; Gradinariu, P.; Popescu, M.-C. Structural analysis of lime wood biodegraded by white rot fungi through infrared and two dimensional correlation spectroscopy techniques. J. Mol. Struct. 2016, 1124, 78–84. [Google Scholar] [CrossRef]
  7. Popescu, C.-M.; Navi, P.; Placencia Peña, M.I.; Popescu, M.-C. Evaluation of the structural changes occurring in wood during hydro-thermal and thermal treatment using NIR spectroscopy and principal component analysis. Spectrochim. Acta A 2018, 191, 405–412. [Google Scholar] [CrossRef]
  8. Zeniya, N.; Obataya, E.; Endo-Ujiie, K.; Matsuo-Ueda, M. Application of time-temperature-humidity superposition to the mass loss of wood through hygrothermally accelerated ageing at 95–140 °C and different relative humidity levels. SN Appl. Sci. 2019, 1, 3. [Google Scholar] [CrossRef] [Green Version]
  9. Zeniya, N.; Obataya, E.; Endo-Ujiie, K.; Matsuo-Ueda, M. Changes in vibrational properties and colour of spruce wood by hygrothermally accelerated ageing at 95–140 °C and different relative humidity levels. SN Appl. Sci. 2019, 1, 7. [Google Scholar] [CrossRef] [Green Version]
  10. Popescu, C.-M.; Popescu, M.-C.; Vasile, C. Structural analysis of photodegraded lime wood by means of FT-IR and 2D IR correlation spectroscopy. Int. J. Biol. Macromol. 2011, 48, 667–675. [Google Scholar] [CrossRef]
  11. Tolvaj, L.; Popescu, C.-M.; Molnar, Z.; Preklet, E. Dependence of the Air Relative Humidity and Temperature on the Photodegradation Processes of Beech and Spruce Wood Species. BioRes 2016, 11, 296–305. [Google Scholar]
  12. Hill, C.A.S. Wood Modification: Chemical, Thermal and Other Processes; Wiley: Chichester, UK, 2006. [Google Scholar]
  13. Sandberg, D.; Haller, P.; Navi, P. Thermo-hydro and thermo-hydro-mechanical wood processing: An opportunity for future environmentally friendly wood products. Wood Mater. Sci. Eng. 2013, 8, 64–88. [Google Scholar] [CrossRef] [Green Version]
  14. Esteves, B.M.; Pereira, H.M. Wood modification by heat treatment: A review. BioRes 2009, 4, 370–404. [Google Scholar] [CrossRef]
  15. Candelier, K.; Chaouch, M.; Dumarcay, S.; Pétrissans, A.; Pétrissans, M.; Gérardin, P. Utilization of thermodesorption coupled to GC-MS to study stability of different wood species to thermodegradation. J. Anal. Appl. Pyrol. 2011, 92, 376–383. [Google Scholar] [CrossRef]
  16. Matsuo, M.; Yokoyama, M.; Umemura, K.; Sugiyama, J.; Kawai, S.; Gril, J.; Kubodera, S.; Mitsutani, T.; Ozaki, H.; Sakamoto, M.; et al. Ageing of wood: Analysis of color changes during natural ageing and heat treatment. Holzforschung 2011, 65, 361–368. [Google Scholar] [CrossRef] [Green Version]
  17. Endo, K.; Obataya, E.; Zeniya, N.; Matsuo, M. Effects of heating humidity on the physical properties of hydrothermal treated spruce wood. Wood Sci. Technol. 2016, 50, 1161–1179. [Google Scholar] [CrossRef] [Green Version]
  18. Bekhta, P.; Niemz, P. Effect of high temperature on the change in color, dimensional stability and mechanical properties of spruce wood. Holzforschung 2003, 57, 539–546. [Google Scholar] [CrossRef]
  19. Borrega, M.; Kärenlampi, P.P. Mechanical behavior of heat-treated spruce (Picea abies) wood at constant moisture content and ambient humidity. Holz. Roh. Werkst. 2008, 66, 63–69. [Google Scholar] [CrossRef]
  20. Borrega, M.; Kärenlampi, P.P. Hygroscopicity of heat-treated Norway spruce (Picea abies) wood. Eur. J. Wood Prod. 2010, 68, 233–235. [Google Scholar] [CrossRef] [Green Version]
  21. Popescu, C.-M.; Popescu, M.-C. A near infrared spectroscopic study of the structural modifications of lime (Tilia cordata Mill.) wood during hydro-thermal treatment. Spectrochim. Acta A 2013, 115, 227–233. [Google Scholar] [CrossRef] [PubMed]
  22. Zeniya, N.; Endo-Ujiie, K.; Obataya, E.; Nakagawa-Izumi, A.; Matsuo-Ueda, M. Effects of water-soluble extractives on the vibrational properties and color of hygrothermally treated spruce wood. Wood Sci. Technol. 2019, 53, 151–164. [Google Scholar] [CrossRef]
  23. Schwanninger, M.; Rodrigues, J.C.; Fackler, K. A review of band assignments in near infrared spectra of wood and wood components. J. Near Infrared Spectrosc. 2011, 19, 287–308. [Google Scholar] [CrossRef]
  24. Meder, R.; Thumm, A.; Bier, H. Venner stiffness predicted by NIR spectroscopy calibrated using mini-LVL test panels. Holz als Roh- und Werkstoff 2002, 60, 159–164. [Google Scholar] [CrossRef]
  25. Schwanninger, M.; Hinterstoisser, B.; Gierlinger, N.; Wimmer, R.; Hnager, J. Application of Fourier Transform Near Infrared Spectroscopy (FT-NIR) to thermally modified wood. Holz als Roh- und Werkstoff 2004, 62, 483–485. [Google Scholar] [CrossRef]
  26. Via, B.K.; Zhou, C.; Acquah, G.; Jiang, W.; Eckhardt, L. Near Infrared Spectroscopy Calibration for Wood Chemistry: Which Chemometric Technique Is Best for Prediction and Interpretation? Sensors 2014, 14, 13532–13547. [Google Scholar] [CrossRef] [Green Version]
  27. dos Santos Grasel, F.; Flôres Ferrão, M.; Wolf, C.R. Development of methodology for identification the nature of the polyphenolic extracts by FTIR associated with multivariate analysis. Spectrochim. Acta A 2016, 153, 94–101. [Google Scholar] [CrossRef]
  28. Noda, I. Generalized two-dimensional correlation method applied to infrared, Raman, and other types of spectroscopy. Appl. Spectrosc. 1993, 47, 1329–1336. [Google Scholar] [CrossRef]
  29. Czarnecki, M.A. Interpretation of Two-Dimensional Correlation Spectra: Science or Art? Appl. Spectrosc. 1998, 52, 1583–1590. [Google Scholar] [CrossRef]
  30. Noda., I.; Ozaki., Y. Two Dimensional Correlation Spectroscopy: Applications in Vibrational and Optical Spectroscopy; John Wiley & Sons Ltd.: Chichester, UK, 2004. [Google Scholar]
  31. Popescu, C.-M.; Popescu, M.-C.; Singurel, G.; Vasile, C.; Argyropoulos, D.S.; Willför, S. Spectral characterization of Eucalyptus wood. Appl. Spectrosc. 2007, 61, 1168–1177. [Google Scholar] [CrossRef]
  32. Wanga, C.; Xianga, B.; Zhanga, W. Application of two-dimensional near-infrared (2D-NIR) correlation spectroscopy to the discrimination of three species of Dendrobium. J. Chemometrics. 2009, 23, 463–470. [Google Scholar] [CrossRef]
  33. Workman, J., Jr.; Weyer, L. Practical Guide to Interpretive Near-Infrared Spectroscopy; CRC Press: Boca Raton, FL, USA, 2008. [Google Scholar]
  34. Basch, A.; Wasserman, T.; Lewin, M. Near-Infrared Spectrum of cellulose: A new method for obtaining crystallinity ratios. J. Polym. Sci. Polym. Chem. 1974, 12, 1143–1156. [Google Scholar] [CrossRef]
  35. Vasile, C.; Popescu, M.-C.; Stoleriu, A.; Gosselink, R. Thermal characterization of lignins. In New Trends in Natural and Synthetic Polymer Science; Vasile, C., Zaikov, G.E., Eds.; Nova Science Publishers Inc.: New York, NY, USA, 2006; pp. 135–163. [Google Scholar]
  36. Hatakeyama, H. Thermal Analysis. In Methods in Lignin Chemistry; Lin, S.Y., Dence, C.W., Eds.; Springer: Berlin, Germany, 1992; p. 200. [Google Scholar]
  37. Inagaki, T.; Matsuo, M.; Tsuchikawa, S. NIR spectral–kinetic analysis for thermally degraded Sugi (Cryptomeria japonica) wood. Appl. Phys. A 2016, 122, 208. [Google Scholar] [CrossRef]
  38. Watanabe, A.; Morita, S.; Ozaki, Y. Temperature dependent structural changes in hydrogen bonds in microcrystalline cellulose studied by infrared and near-infrared spectroscopy with perturbation-correlation moving-window two-dimensional correlation analysis. Appl. Spectrosc. 2006, 60, 611–618. [Google Scholar] [CrossRef] [PubMed]
  39. Mitsui, K.; Inagaki, T.; Tsuchikawa, S. Monitoring of hydroxyl groups in wood during heat treatment using NIR spectroscopy. Biomacromol 2008, 9, 286–288. [Google Scholar] [CrossRef]
  40. Bächle, H.; Zimmer, B.; Windeisen, E.; Wegener, G. Evaluation of thermally modified beech and spruce wood and their properties by FT-NIR spectroscopy. Wood Sci. Technol. 2010, 44, 421–433. [Google Scholar] [CrossRef]
  41. Akgul, M.; Gumuskaya, E.; Korkut, S. Crystalline structure of heat-treated Scots pine [Pinus sylvestris L.] and Uludağ fir [Abies nordmanniana (Stev.) subsp. bornmuelleriana (Mattf.)] wood. Wood Sci. Technol. 2007, 41, 281–289. [Google Scholar] [CrossRef]
  42. Conner, A.H. Kinetic modeling of hardwood prehydrolysis. Part I: Xylan removal by water prehydrolysis. Wood Fiber. Sci. 1984, 16, 268–277. [Google Scholar]
  43. Garrote, G.; Dominguez, H.; Parajó, J.C. Study of the deacetylation of hemicelluloses during the hydrothermal processing of Eucalyptus wood. Holz als Roh- und Werkstoff 2001, 59, 53–59. [Google Scholar] [CrossRef]
Figure 1. Second derivative of the NIR spectra in the 4520–5350 and 5600–6950 cm−1 regions for control (black full line colour), hydro-thermal treated (coloured full line contours) and water-extracted (dotted line contours) spruce wood samples (T = 120 °C; RH = 0, 35, 60, 80, 91%; treatment time = 7 days; e—extracted). The spectral lines of the control and samples after the thermal treatment were highlighted, while the spectra of the samples with intermediary treatment time are represented with thinner grey lines. We kept the same colours for the extracted and non-extracted samples.
Forests 12 01689 g001
Figure 2. PC scores (a) in the 4520–6950 cm−1 region for non-extracted and water-extracted spruce wood specimens (full symbols—non-extracted specimens; open symbols—water-extracted specimens; colours represent the different levels of RH during heating) and loadings (b) in the same region.
Forests 12 01689 g002
Figure 3. Synchronous (a,c,e,g,i) and asynchronous (b,d,f,h,j) maps of the spectra of the non-extracted (aj) and water-extracted (a′j′) reference (a,b) and hydrothermal treated wood samples at 35 (c,d), 60 (e,f), 80 (g,h) and 91 (i,j) %RH.
Forests 12 01689 g003
Figure 4. Autocorrelation spectra extracted from the synchronous spectra for the 4520–5350 cm−1 region (T = 120 °C, RH = 0, 35, 60, 80, 91%, e—extracted).
Forests 12 01689 g004
Table 1. Band position and their assignment in the 4520–5350 cm−1 region [7,23].
Band PositionAssignment
4559combination band of C-H and C=O stretching vibration associated to lignin
4632combination bands of Car-H and C=O stretching vibration associated to lignin and extractives
4676C-H and C=O stretching vibration associated to hemicelluloses
4756O-H and C-H deformation and O-H stretching vibrations in cellulose and hemicelluloses
4816O-H and C-H deformation vibrations in cellulose and hemicelluloses
4878C=O stretching vibration associated to hemicelluloses
5092combination bands of O-H and C-H stretching vibration
5140O-H groups involved in strong intramolecular hydrogen bonds and 2nd overtone of C=O stretching vibration mainly in hemicelluloses
5216
5315
Table 2. Band position and their assignment in the 5600–6950 cm−1 region [7,23,37,38,39].
Band PositionAssignment
56671st overtone of C-H stretching vibration in carbohydrates and lignin
57201st overtone of C-H groups in hemicelluloses
57961st overtone of C-H stretching in lignin
58801st overtone of C-H stretching in lignin and CH2 groups in cellulose
5972Car-H stretching vibration in lignin
61361st overtone of O-H stretching vibration in cellulose
62831st overtone of O-H stretching vibration in cellulose, strongly bonded O-H groups in crystalline regions and Iβ phase
64181st overtone of O-H stretching vibration of the O(6)-H(6)…O(3)’ intermolecular H-bonds in cellulose
64641st overtone of O-H stretching vibration of the O(3)-H(3)…O(5) intramolecular H-bonds in cellulose (crystalline regions C1)
66471st overtone of O-H stretching vibration of the O(6)-H(6)…O(3)’ intermolecular H-bonds in cellulose
67081st overtone of O-H stretching vibration of the O(3)-H(3)…O(5) intramolecular H-bonds in cellulose and glucomannan
6753weakly hydrogen bonded OH groups of cellulose O(6)-H(6), 1st overtone of O-H stretching vibration in semi-crystalline cellulose
6908phenolic O-H groups of lignin with intramolecular H-bonding to an ether group in ortho position and to extractives
56671st overtone of C-H stretching vibration in carbohydrates and lignin
57201st overtone of C-H groups in hemicelluloses
Publisher’s Note: MDPI stays neutral with regard to jurisdictional claims in published maps and institutional affiliations.

