Article

Variations in Soil Properties and CO2 Emissions of a Temperate Forest Gully Soil along a Topographical Gradient

1
Institute of Agrophysics, Polish Academy of Sciences, Doświadczalna 4, 20-290 Lublin, Poland
2
School of Applied Sciences and Technology, Prudence College Dublin, 22 Dublin, Ireland
3
UCD School of Biology and Environmental Science and UCD Earth Institute, University College Dublin, Belfield, 4 Dublin, Ireland
*
Author to whom correspondence should be addressed.
Submission received: 14 January 2021 / Revised: 10 February 2021 / Accepted: 11 February 2021 / Published: 17 February 2021

Abstract

:
Although forest soils play an important role in the carbon cycle, the influence of topography has received little attention. Since the topographical gradient may affect CO2 emissions and C sequestration, the aims of the study were: (1) to identify the basic physicochemical and microbial parameters of the top, mid-slope, and bottom of a forest gully; (2) to carry out a quantitative assessment of CO2 emission from these soils incubated at different moisture conditions (9% and 12% v/v) and controlled temperature (25 °C); and (3) to evaluate the interdependence between the examined parameters. We analyzed the physicochemical (content of total N, organic C, pH, clay, silt, and sand) and microbial (enzymatic activity, basal respiration, and soil microbial biomass) parameters of the gully upper, mid-slope, and bottom soil. The Fourier Transformed Infrared spectroscopy (FTIR) method was used to measure CO2 emitted from soils. The position in the forest gully had a significant effect on all soil variables with the gully bottom having the highest pH, C, N concentration, microbial biomass, catalase activity, and CO2 emissions. The sand content decreased as follows: top > bottom > mid-slope and the upper area had significantly lower clay content. Dehydrogenase activity was the lowest in the mid-slope, probably due to the lower pH values. All samples showed higher CO2 emissions at higher moisture conditions, and this decreased as follows: bottom > top > mid-slope. There was a positive correlation between soil CO2 emissions and soil microbial biomass, pH, C, and N concentration, and a positive relationship with catalase activity, suggesting that the activity of aerobic microorganisms was the main driver of soil respiration. Whilst the general applicability of these results to other gully systems is uncertain, the identification of the slope-related movement of water and inorganic/organic materials as a significant driver of location-dependent differences in soil respiration, may result in some commonality in the changes observed across different gully systems.

Graphical Abstract

1. Introduction

Forests ecosystems, which cover about 30% of the terrestrial global area [1], make a significant contribution to the carbon cycle through C accumulation in living biomass and C exchange with the atmosphere through photosynthesis and respiration [2,3]. Numerous studies have investigated the role of temperate forest soils in C cycling, but there is still a need to understand the often-marked spatial variability in soil properties and how these impact on CO2 emissions and CO2 budgets. Many afforested areas in Europe and elsewhere have been eroded, largely due to water runoff and this, combined with natural undulations in the landscape, creates major variations in topographic relief. Whilst changes in topography are known to influence soil physio-chemical parameters and greenhouse gas emissions (GHG) the reason(s) for these variations and their quantification is often still unclear [4,5,6,7,8,9]. Clearly, the quantification of topography-related variations in GHG emissions is essential for accurate annual assessments and for regional upscaling.
A gully, i.e., a deep soil incision in the landscape, is formed as part of the erosion process when runoff water cuts new unstable channels through erodible soil and weathered rock [10]. Whilst gully erosion is often thought to be most common in farmed lands [10] it also occurs in forests [11], especially in Central Europe [12]. Extreme high magnitude-low frequency rainfall events or human-induced land-use changes in areas with a disturbed forest cover (e.g., due to cropland incursion, intensive cattle grazing, forest logging, and subsequent reforestation) or a combination of these natural and human factors are the likely sources of surface runoff, resulting in the formation of gullies [13]. Gullies occurring in forests may also have previously been an element of the agricultural landscape prior to reforestation; in Central Europe, forests with gullies are often surrounded by cropland [14]. Currently, forests have a high infiltration capacity, which makes surface run-off unlikely; therefore, gullies are most likely a relic of older forests and may also be periglacial features [13,15].
At the local scale, the slope characteristic of a gully is a key abiotic factor controlling soil processes [16]. Due to the leaching, displacement, and accumulation of surface material during run-off (the steeper the slope, the greater the run-off), gully layers differ in several properties, including nutrient content, granulometric composition, structure, and density [17]. Fine soil particles may be transported because of downward runoff which results in their deposition at the gully bottom and the clay soil particles may absorb soil organic carbon (SOC) [17]. Studies on forest soils have shown a higher SOC stock in the bottom positions [17,18] or in the mid-slope [19] compared to the upper levels, although the differences in various components are not always significant [20]. An important factor regulating the activity of soil microorganisms is also the presence of vegetation, which through a demand for nitrogen or water decreases these constituents in the soil [16]. Due to the spatial variation in soil properties, topography also influences the soil microbial populations [16,18]. Higher availability of C and N for microorganisms results in higher enzymatic activity and microbial biomass and, as a consequence, the amount of CO2 emitted [4,5,6,7,8,9,21]. Soil moisture conditions may also affect microbial activity (and respiration) through a reduction in gas diffusion (and oxygen availability for soil microorganisms) when it is too wet, or by osmotic stress when it is too dry [22].
The functionality of eroded soils can be evaluated by various biological indicators, which provide sensitive markers of soil degradation by wind or water erosion. These include dehydrogenase (DHA) and catalase (CAT) activity, basal respiration (BR), and microbial biomass (Cmic) [23,24]. Determinations of different enzyme activities may characterize soil quality, fertility, and microbial properties [25]. Among the enzymes that have been studied, the activity of soil dehydrogenases (EC 1.1.1.) is used as an indicator of overall soil microbial activity [25,26], and is strongly associated with microbial redox processes [27,28]. Catalase (H2O2:H2O2-oxidoreductase, EC 1.11.1.6.) is considered an indicator of aerobic microbial activity, since the activity of this enzyme has been shown to correlate with the number of aerobic soil microorganisms, microbial biomass, respiratory activity, the activity of other enzymes, organic carbon stocks, and aeration status [29,30]. Low values of DHA and CAT indicate low biological activity of the degraded soils [24]. Soil microbial biomass (Cmic) is also an important ecological parameter reflecting soil functionality due to the role of soil microbiota (mainly fungi and bacteria) in organic matter transformation and nutrient cycling [31]. The total activity of soil microorganisms, as well as the mineralization of soil organic matter (SOM) may be indicative of soil respiratory activity and evaluated by determining the amount of CO2 emitted in the short term without organic substrate supplements (basal respiration, BR) and CO2 emitted over a relatively longer time interval, respectively [32,33].
Despite their high variability in many European regions, forest gullies are still not fully recognized as an important topographic feature influencing GHG emissions. As most of the research on GHG exchanges and C sequestration by forest soils treats the area under study as being largely homogeneous, often ignoring local topographical variations due in part to practical and logistical constraints, this could lead to significant errors. In this regard, the identification of CO2-regulating properties of eroded soils with varying topography needs investigating. Although a quantitative assessment based on local observations will not necessarily translate to larger scales, it can identify some general trends that may be useful in estimating and modeling the C balance in eroded soils. The likely dominant role of slope/inclination in determining spatially related changes in soil properties may also mean that there is some commonality in any modifications in soil respiration across different gully systems.
We hypothesized that the topographical gradient associated with gullies significantly differentiates soil variables according to gully location and result in:
(1)
Higher clay fractions in the gully bottom, because of downward runoff;
(2)
Higher SOC stocks in the gully bottom due to absorption by clay particles;
(3)
Higher total N contents in the gully bottom because of a higher SOC and the absence of vegetation;
(4)
A higher microbial biomass in locations with a higher C and N availability;
(5)
Generally higher soil water contents which will either stimulate or decrease soil microbial activity, depending on the range of soil moisture values experienced.
Based on these hypotheses, we expect higher CO2 emissions in the gully bottom.
To address these hypotheses the aims of the study were: (1) to characterize the basic physicochemical and microbial parameters of soil from different positions in a deciduous forest gully; (2) to quantitatively assess related soil CO2 emissions in different parts of the gully under controlled temperature and two moisture conditions; (3) to evaluate the interrelationships among the examined parameters to identify the drivers of any variations in soil CO2 emissions.

2. Materials and Methods

The laboratory experiment was conducted on soil samples collected from a forest gully located in the Lublin Upland, Poland (coordinates 50.969296, 23.095330; altitude of 202 m above sea level), where the mean annual temperatures (1951–2000) are in the range 6.9–9.8 °C [34]. In the sampling year, the average annual temperature in this region was 10.12 °C and the annual rainfall was 504.9 mm, based on data from the weather station of the Institute of Agrophysics, PAS in Lublin. The forest is in the Niemienice gully region, on the left slope of the Żółkiewka river, with a gully density of 3.71 km/km2 [11]. The gully is U-shaped, and of medium size (based on the classification proposed by Bhat et al. (2019) [35]) and intersected by a road. The forest stand is dominated by 75-year-old oaks with a lower contribution of European hornbeam and surrounded by cultivated fields. The top (plateau) and slope positions are covered with trees, while the bottom has no trees with the density of trees significantly decreasing downwards with the slope.
Soils (Dystric Gleysol) were sampled in July 2019 along the topographical gradient of the forest gully (top, mid-slope, and bottom). Five representative soil samples (surface layer i.e., 0–20 cm depth; after removal of litter) were collected at 1 m intervals from each slope position using a soil auger. They were subsequently thoroughly homogenized, separately for the top, mid-slope, and bottom samples, to provide a representative sample per position. All laboratory tests were performed in triplicate from a representative sub-sample for each position. The soils were air-dried, sieved to <2 mm, and stored in the dark at room temperature.

2.1. Soil Physicochemical Characterization

The total C and N concentrations were determined by a dry combustion method using a Thermo Scientific Flash 2000 Organic Elemental Analyzer, according to the standard methodology provided by the manufacturer (Thermo Fisher Scientific Inc., Waltham, MI, USA), with an oven temperature of 1020 °C (before analysis the soil was ground in a mortar). Soil inorganic and organic carbon (SOC) were determined with a TOC-VCPH analyzer (Shimadzu, Kyoto, Japan). Soil pH was measured potentiometrically at room temperature in a soil and water slurry, after the soil had settled, with a ratio of soil:water of 1:2.5 w/w. Particle size distribution (PSD: clay (diameter < 2 µm), silt (diameter 50–2 µm), and sand (diameter 2000–50 µm)) was determined using a Mastersizer 2000 laser diffractometer with a Hydro G dispersion unit (Malvern Ltd., Malvern, UK). The measurement settings were as follows: a two light-source laser (633 nm), a diode (466 nm), stirrer speed 700 rpm, and pump speed 1750 rpm [36]. Disintegration of soil aggregates was carried out using an ultrasound probe (35 W for 3 min). For calculations, these were based on Mie theory with a refractive index of 1.52 and an absorption coefficient of 0.1 was used [37]. Based on the results obtained, the silt:clay ratio was calculated for the soil from each gully position.

2.2. Soil Microbial Parameters

Microbial soil parameters were determined under controlled laboratory conditions (n = 3). The measurement procedures were performed after a three-day preincubation period to homogenize the water potential and stabilize the soil indigenous microbial communities [38]. Dry soils (5 g × three replicates for each parameter) were weighed into 60 cm3 glass vessels, moistened to the level corresponding to the moisture conditions on the collection day (mean 10.58 ± 2.10% vol.), and preincubated in the dark at 25 °C. The methods were described previously by Walkiewicz et al. (2020) [39]. The enzymatic analysis included the determination of catalase (CAT) and dehydrogenase (DHA) activity. Determination of CAT was made using gas chromatography [40]. The concentration of O2 was measured after 10 min of static incubation at 30 °C with 3% H2O2 and sterile soils (autoclaved at 126 °C and 140 kPa for 22 min; Prestige Classic 210001; Prestige Medical, Chesterfield, England) were used as controls. Following this, the gas sample from the headspace (200 µl) was injected into a gas chromatograph (Shimadzu GC-14A; Shimadzu Corp., Kyoto, Japan) equipped with Molecular Sieve 5A to determine the O2 concentration. The temperature of the detector and the column was 40 °C, and helium (40 cm3/min) was used as the carrier gas [41]. The results for CAT were expressed as µmol O2 per gram of dry soil per minute. The pressure in the vessel, measured in the headspace before each injection with an Infield 7 m (UMS GmbH, München, Germany), was included in the calculation of the O2 concentration. For DHA this was determined using the triphenyl tetrazolium chloride (TTC) method [42]. The activity was calculated based on the amount of triphenyl formazan (TPF) produced after a 20-h incubation of the soil samples at 30 °C. The results obtained for DHA (expressed in µg TPF g/20 h) were reduced by the activity of the blank control without TTC addition. DHA was measured spectrophotometrically based on an absorbance measured at 485 nm (UV-1601PC, Shimadzu Corp., Kyoto, Japan).
Basal respiration (BR) was measured after a 2-h incubation of the soil samples (5 g, n = 3) in the dark at 25 °C. The headspace air was then injected (200 µL) into the gas chromatograph to determine the CO2 level. The results for BR were expressed in µg CO2-C/g/h. Soil microbial biomass (Cmic) was determined using the substrate-induced respiration (SIR) method with glucose amendments as an easily available source of C and energy [43]. The soil samples were enriched with the glucose solution (10 mg per gram of soil) and incubated with shaking at 25 °C in a water bath. After 2 h, the CO2 produced was measured using gas chromatography. Soil microbial biomass was calculated based on the equation [44]:
C mic   ( mg / g ) =   50.4   × cm 3   ( CO 2 / g / h )
The concentration of CO2 in the headspace was measured with a gas chromatograph (Shimadzu GC-14A, Shimadzu Corp., Kyoto, Japan) equipped with a thermal conductivity detector (TCD) and a 2-m column (3.2 mm diameter) packed with Porapak Q, with He as the carrier gas at a flow rate of 40 cm3/min. The detector response was calibrated using a certified gas standard (Air Products, Warsaw, Poland) containing 1% CO2 in He.

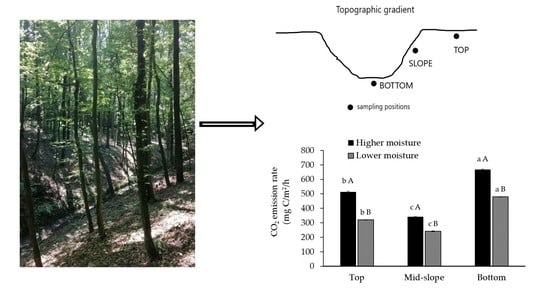
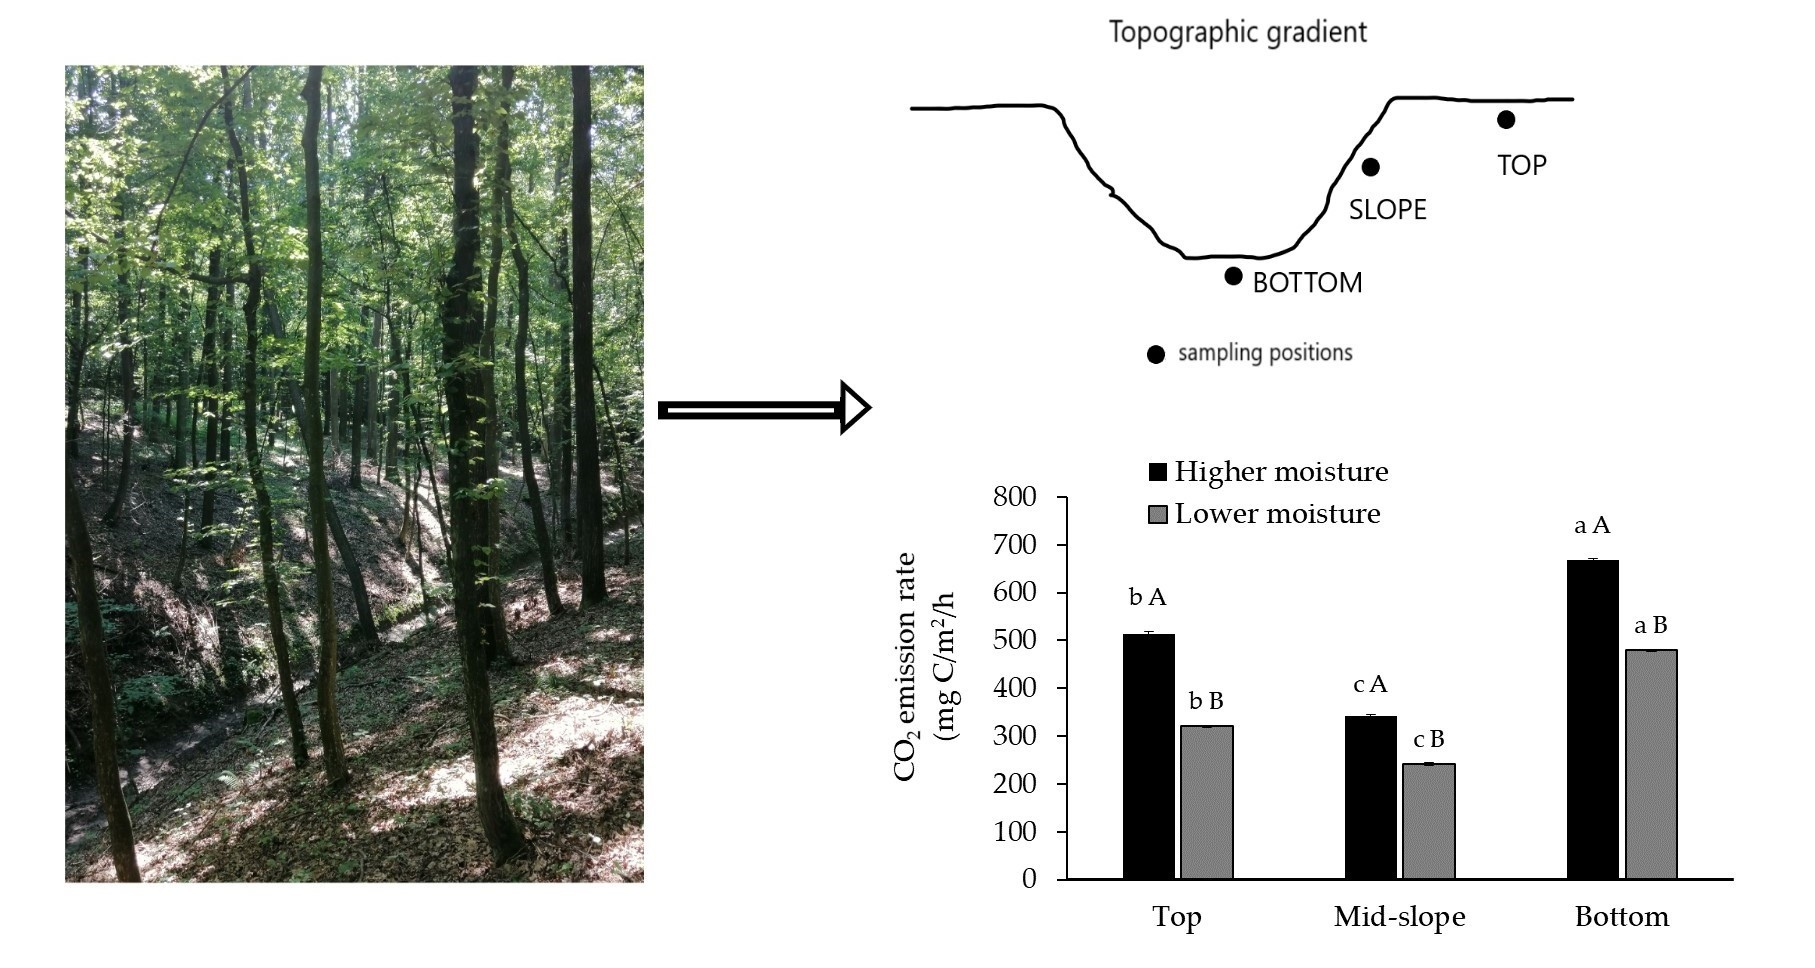
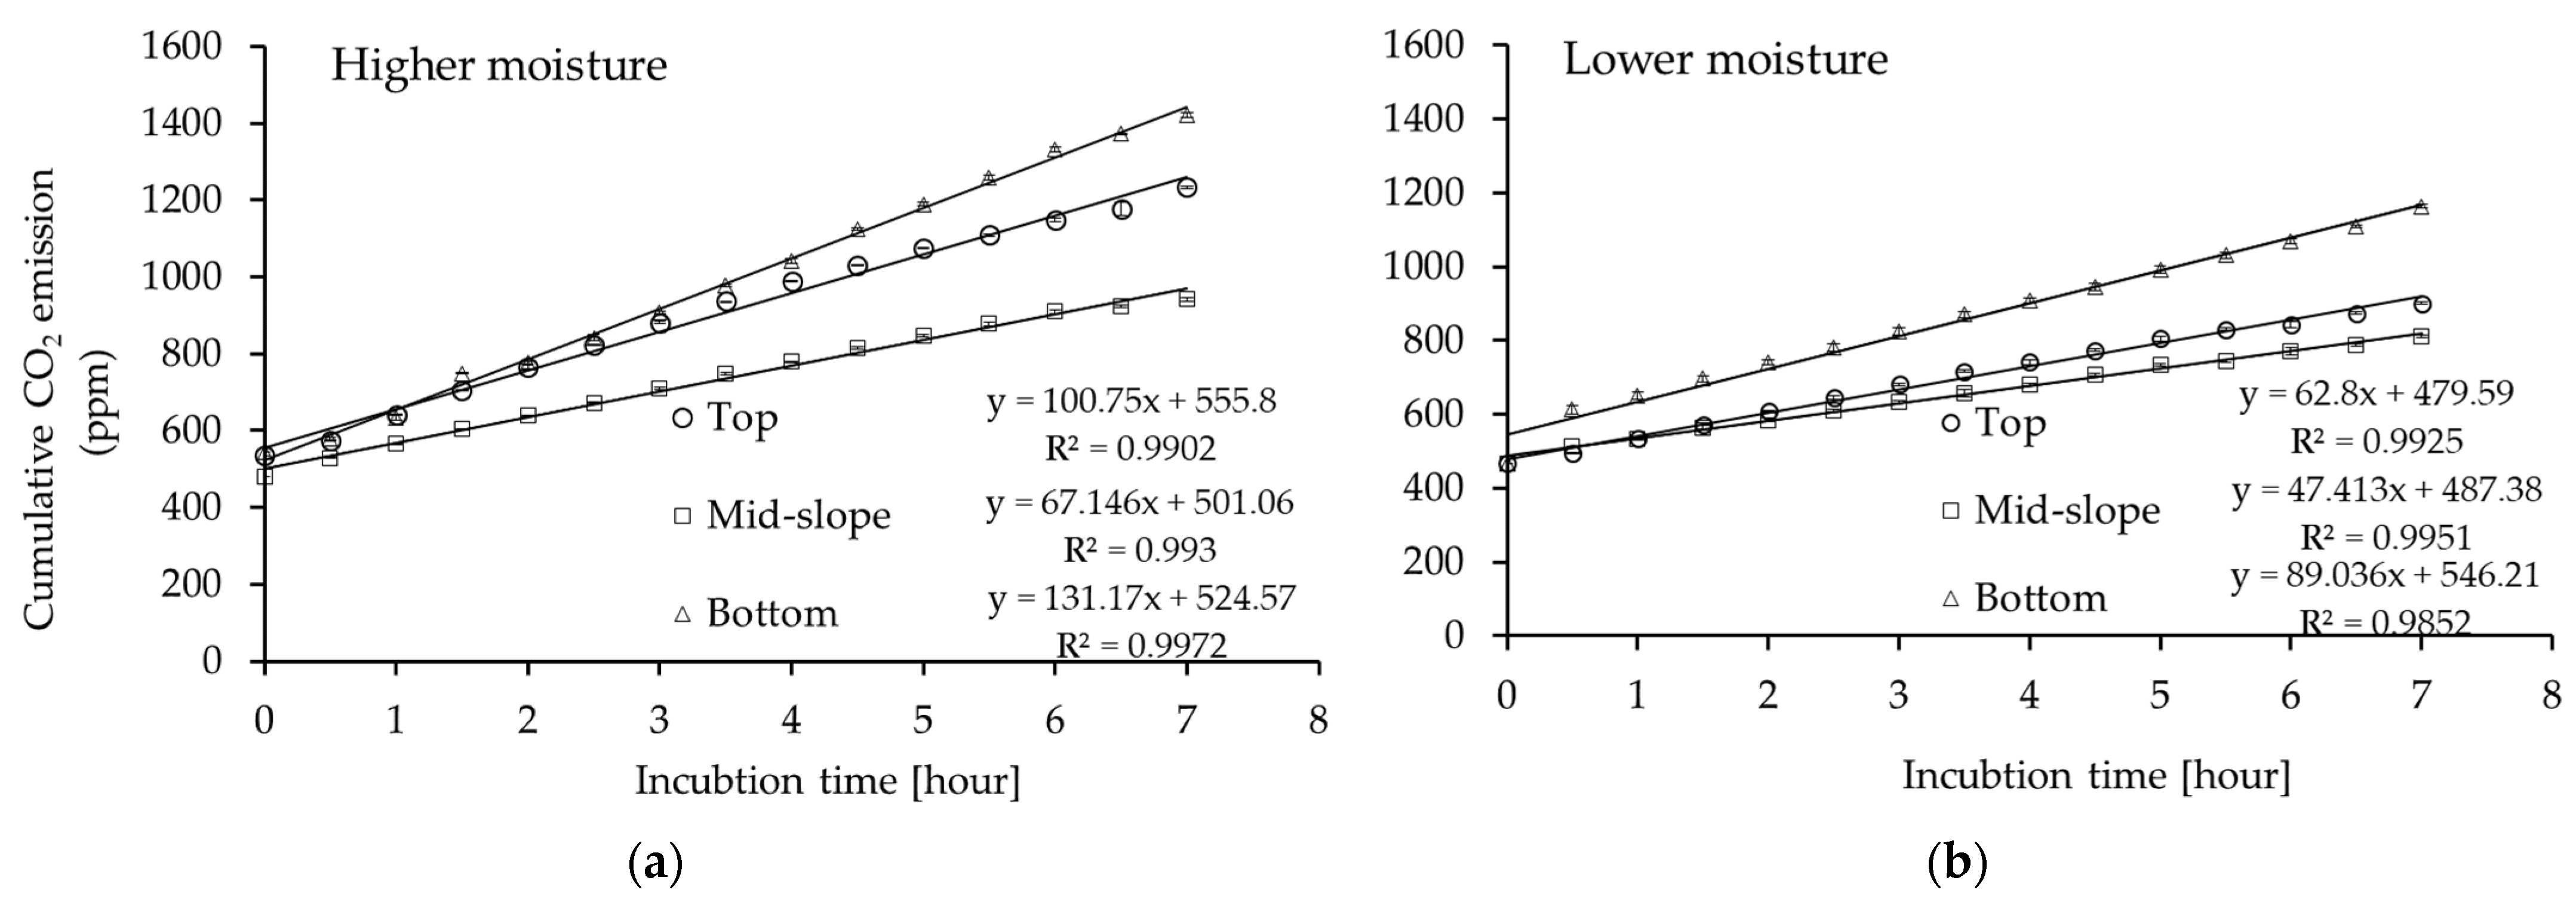
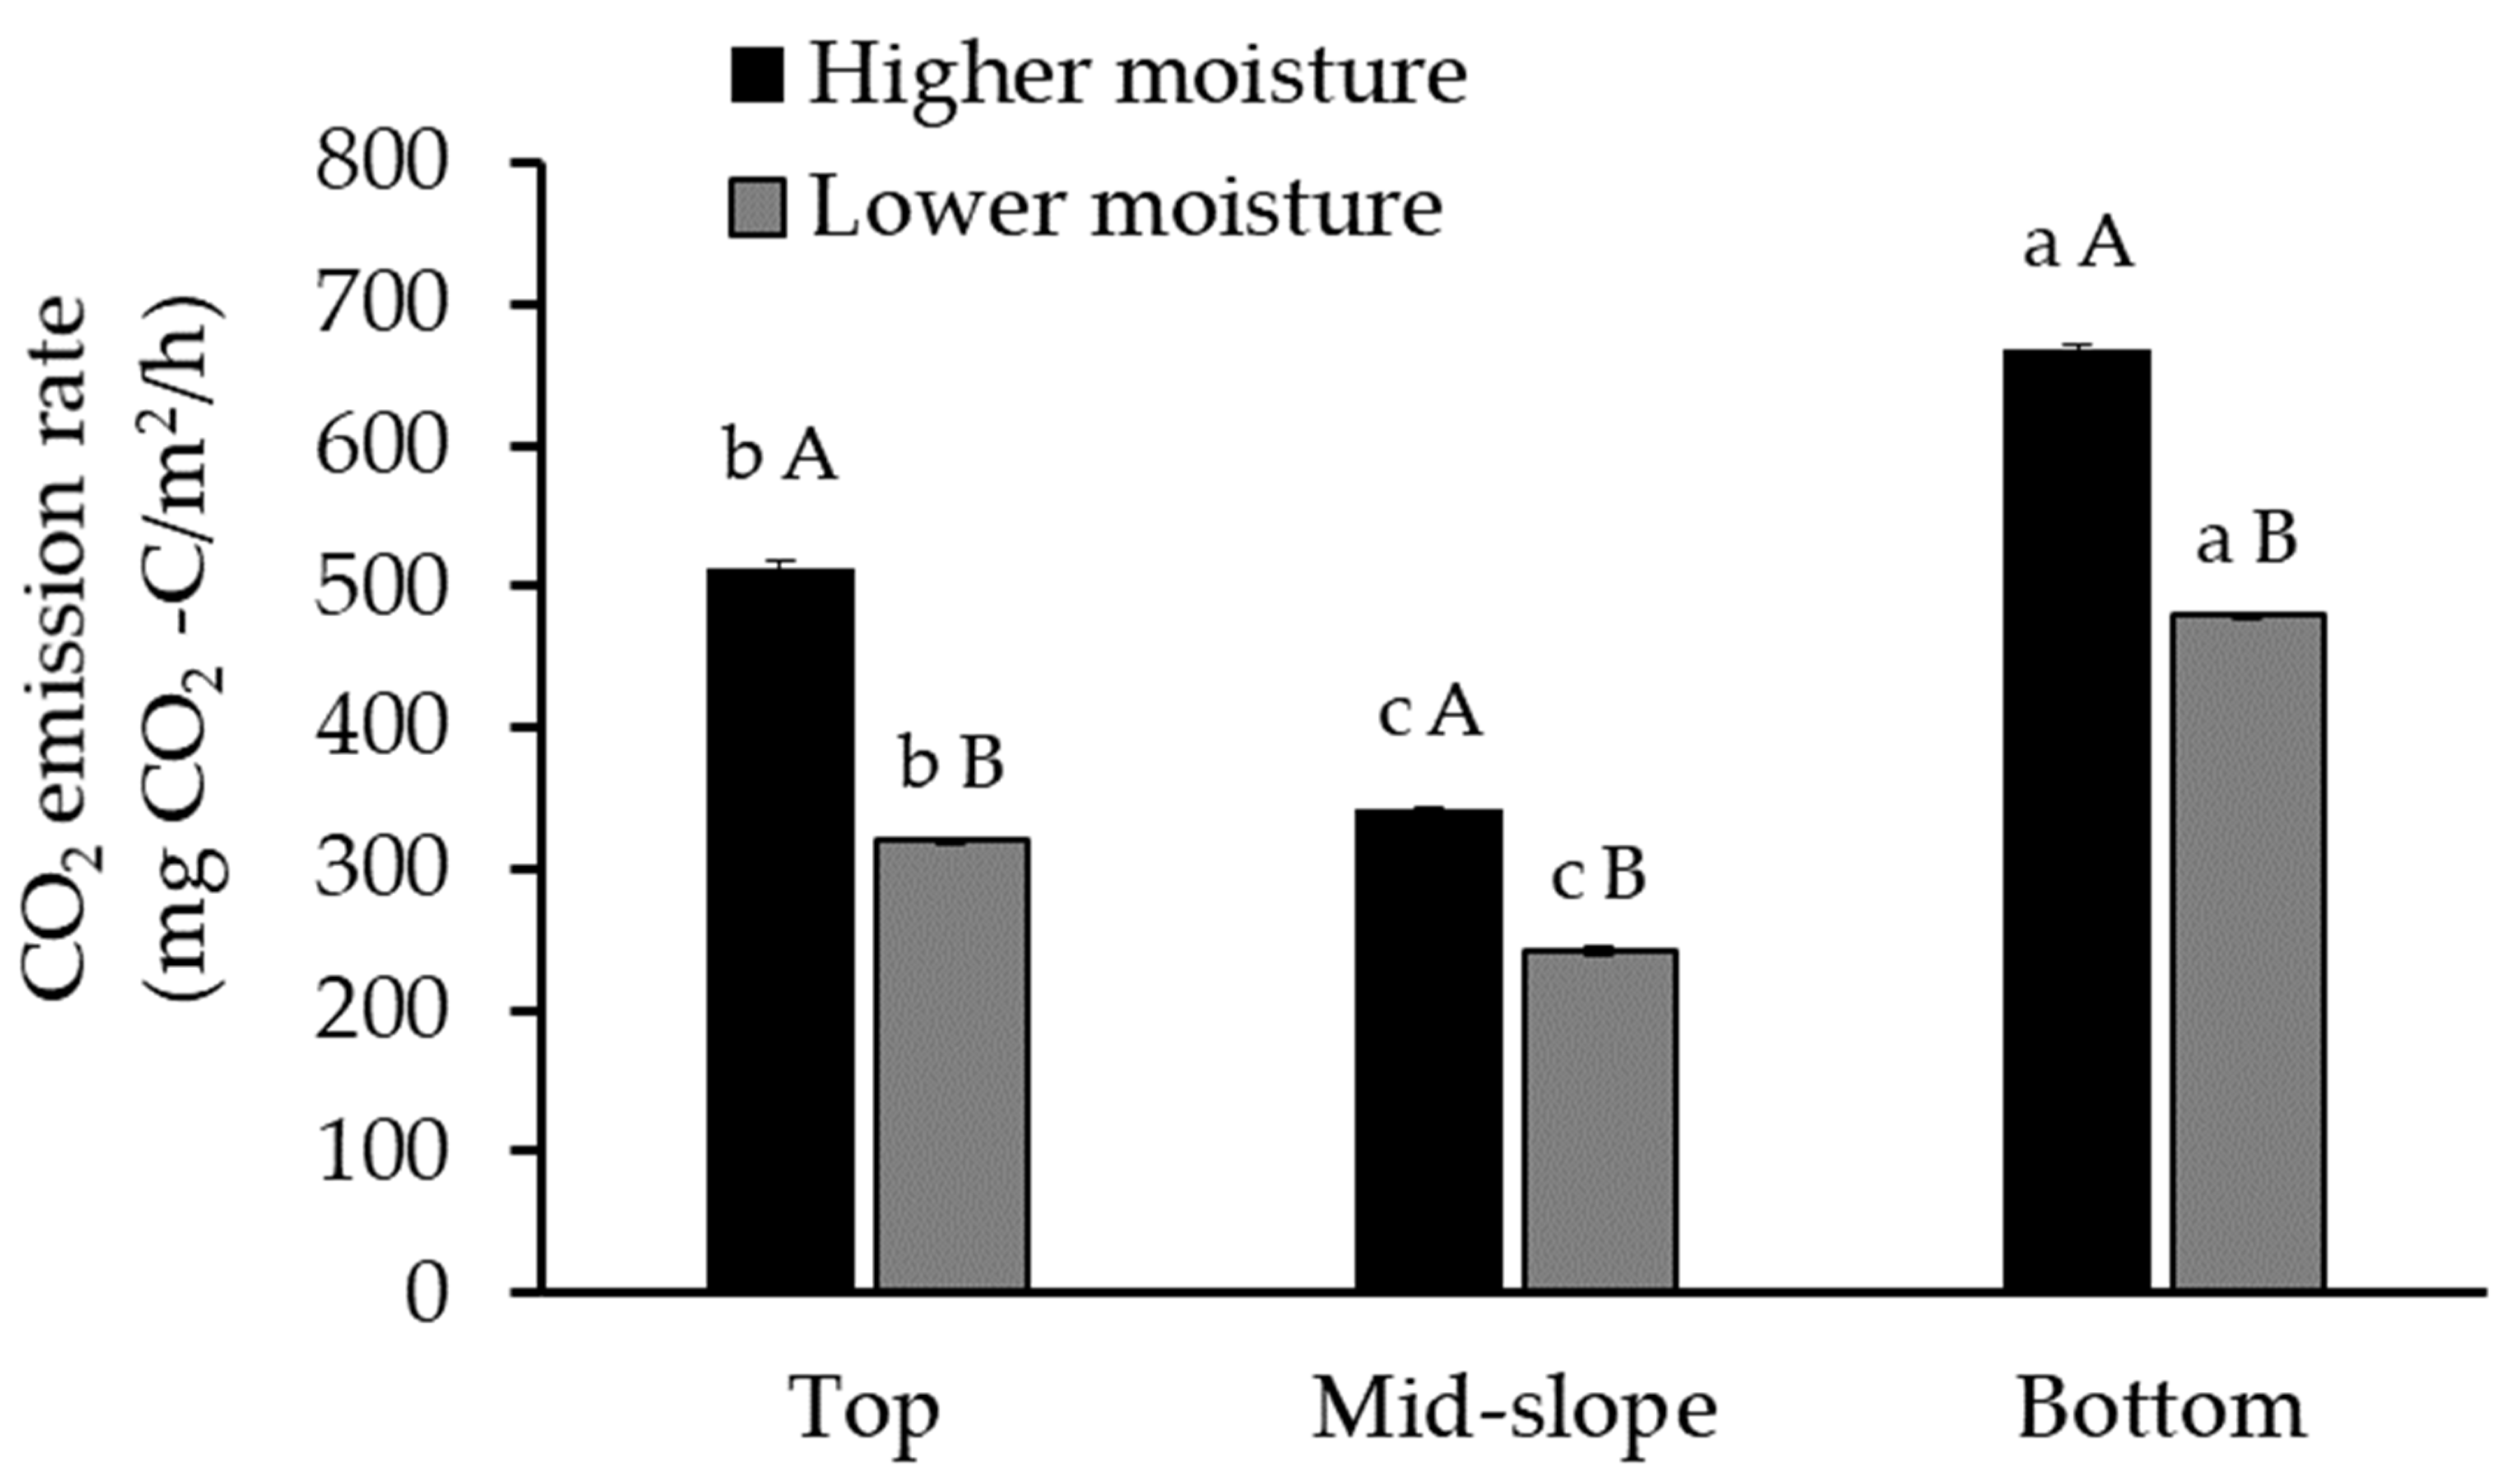
2.3. CO2 Emission Measurements

Air-dried soil samples of approximately 500 g dry weight were placed in 5-dm3 air-tight dark chambers. Three sets were prepared for each of the two moisture conditions, separately, for the soil from the top (plateau), mid-slope, and bottom of the gully. The samples were then moistened with distilled water to a higher level (corresponding to 12% vol.) and a lower level (corresponding to 9% vol.) for each position related to the lowest and highest moisture conditions noted in this area during the sampling period (three positions x two moisture conditions x three replicates: 18 samples in total). After three days of preincubation in the dark at 25 °C (to unify water potential and stabilize indigenous soil microbial communities [38]), the chambers were ventilated and tightly closed again. The soils were incubated at 25 °C, and the CO2 concentration in the headspace was measured for seven hours every half an hour using a Gasmet DX-4040 Fourier-Transform Infrared Gas Analyzer (FTIR-GA) (Gasmet Technologie Oy, Helsinki, Finland).
The CO2 flux (F) (emission rate) was calculated from the slope of the change with time in the concentration of gases in the closed chamber according to the following equation [45,46]:
F   CO 2 = kCO 2   ( 273 / T ) ( V / A ) S
  • kCO2 = gas constant at 273.15 K (0.536 µg C/µL)
  • T—air temperature (°K)
  • V—chamber headspace volume (dm3)
  • A—area of the soil in the chamber (m2)
  • S—CO2 concentration change in the chamber based on the slope (dc/dt; ppm/min)
The resultant CO2 emissions and CO2 fluxes are shown as a time course separately for each sampling position and moisture conditions.

2.4. Statistical Analysis

The results were statistically processed with Statistica 13 software (StatSoft Inc., Tulsa, OK, USA) and Statgraphics Centurion XVI (Statgraphics Technologies, Inc., The Plains, VA, USA). One-way ANOVA (Tukey HSD post-hoc test) was used to test the significance of the differences in soil parameters between the different locations (top, mid-slope, and bottom) of the forest gully. Multifactorial analysis of variance (MANOVA) was used to test which of the factors (moisture or the position tested) significantly affected the CO2 fluxes. Correlation statistics were carried out to examine the relationships among CO2 emission, soil microbial (CAT, DHA, BR, Cmic), and physicochemical (pH, C:N ratio, Ntot and SOC concentration, sand, silt, and clay content) parameters. The statistical analysis was evaluated at the 5% level of significance.

3. Results and Discussion

3.1. Characteristics of the Forest Gully Soil

Soils collected from different positions in the gully varied in their physicochemical and microbial parameters (Table 1). Results showed that the soil from the unvegetated location at the bottom of the gully had a 33% higher soil organic carbon (SOC) concentration compared to the upper parts covered by trees. This is in agreement with a two-year field study conducted on a semiarid forest soil in a hilly gully region in China [18]. However, the area in China is different from our investigated forest in terms of tree cover. Both in our study and the forest stand in China, the density of trees decreased from the top to the bottom but there was no vegetation at the bottom of our gully in contrast to that in China. The Chinese study showed that the soil SOC at the top and mid-slope position was at a similar level, and the soil at the bottom had about 30% higher SOC [18].
Variations in topography can be associated with major differences in soil C sequestration and may be useful in the prediction of the spatial distribution of SOC stocks [47]. However, the major source of SOC is plant leaves, roots, and root exudates [48]. Whilst trees produce more litterfall and have larger roots than crops and grasses [49], and afforestation of degraded soils has considerable potential to reduce soil losses and enhance SOC sequestration this clearly varies with slope/topography, and sequestration is greater towards the bottom of steeper slopes than it is for gentler slopes [49,50].
Among the soil properties examined texture may play a key role in C storage since SOC may be absorbed onto the soil clay mineral surface [51]. Therefore, soils with a high clay content generally show a higher potential for SOC storage compared to sandy soils [52]. We also showed significant differences in particle size distribution, depending on gully position. The proportion of sand decreased as follows: top > bottom > mid-slope and soil from the top had a significantly lower clay content than soil from the mid-slope and bottom parts (p < 0.05) (Table 1). Differences in particle size distribution are consistent with those found in a study conducted in an afforested area in Brazil. The sand fraction was significantly higher, while the clay fraction was lower in flatter areas compared to slope positions (p < 0.001) [53]. The mechanism of SOC absorption on the surface of clay particles may also explain our results where the bottom gully had the highest SOC and the highest CO2 emissions, which was significantly less than the soils with a high sand content at the top of the gully. Whilst the clay content was the same in the bottom and mid-slope soils, significant leaching from the mid-slope position, associated with water movement, may reduce C storage. This indicates that soil texture strongly influenced SOC content in our experiment presumably by influencing how much material is retained in response to water movement at any location, which also supports our hypothesis. The particle size distribution could also affect water storage/movement and this was higher in the forest gully bottom where there was a lower sand content. The high-moisture conditions at this largely depositional position would also limit decomposition rates and simultaneously stabilize SOC [54]. Li et al. (2019) [54] suggested that depositional topsoil SOC is prone to mineralization (in consequence more CO2 is emitted) while SOC is stabilized at subsoil depths. Moreover, Hou et al. (2020) [49] showed a dependency of C sequestration on tree species, and slope and afforestation with broadleaf trees significantly increased the SOC stock in the topsoil (without significant changes in the subsoil). Conversely, afforestation with conifer trees caused a significant increase in SOC stock in the subsoil, although this was not significant in the topsoil.
However, it should be considered that the properties of soils from different parts of the gully may be specific to the location under study. This is related in part to gully orientation which largely determines the local microclimatic conditions through the extent of exposure to solar radiation. North-facing slopes receive less sunlight, resulting in cooler and wetter conditions, often with a denser vegetation cover compared to exposed and drier south-facing slopes [55,56,57]. In relation to C sequestration, it has been documented that afforestation under shady slopes (vs. sunny gentle slopes) maintained more SOC [50]. Also, including the position of the gully, the SOC storage at the middle and upper parts of the shady slope and the bottom were the highest, followed by storage at the bottom of the sunny slope. The vegetation C storage at the bottom, the bottom of the sunny slope, and the upper and middle of the shady slope were significantly higher than those at the middle and upper parts of the sunny slope and the bottom of the shady one [58].
Like SOC, the total soil N concentration was also significantly higher in the bottom than in the upper parts of the gully (Table 1). This may also relate to the absence of vegetation (and, consequently, absence of litter) in the bottom part, as N can be taken up by trees [59] resulting in a lower N content in the top and mid-slope soils covered by vegetation.
The highest C:N ratio in our study was recorded in the top gully parts, whereas the lowest value was found in the bottom soil (Table 1). The significantly higher SOC and Ntot contents, along with the lower C:N ratio in the bottom soil than in soils collected in upper positions, suggests that the soil at the bottom contained relatively more active components of the soil organic matter. Land use can affect the C:N ratio and in the forest soil it was higher than in cultivated soils (cassava, corn, and paddy rice crops) due to a reduction in decomposition rates and an increase in storage of SOC in the surface layers of uncultivated soils that are compacted and sealed [48]. Based on our study, we concluded that the higher C:N ratios in both top and mid-slopes are an effect of tree growth. Lower C:N in the bottom part positively affects microbial activity, partly due to a higher N content.
The soils from all gully parts differed significantly in pH, which decreased in the order: bottom > top > mid-slope (Table 1). The higher pH values in the gully bottom soil may be associated with the absence of litter, as the presence of oak leaves, which are predominant in the forest studied, can lead to a lower pH [60]. Similarly, a study on a subtropical forest in Taiwan showed that the pH was lower in bottom soils due to a reduction in leaf litter compared to upper positions with extensive vegetation cover [61]. The pH of sandy soil from the bottom of a forest ravine in the Bohemian Switzerland National Park was higher by 0.5–1.0 than in soil from slopes and upper parts [62].
The value of the silt: clay ratio differed statistically between the samples from the positions studied and ranged from 9.80 ± 0.83 in the gully bottom to 11.72 ± 0.13 in the uppermost sampling location (Table 1). The silt: clay ratio, can be considered as a post-depositional weathering index [63] and provides an indication of the volume of migrating particles and their saturated hydraulic conductivities [17,64]. When this ratio is high there is a greater chance of migration compared to soil from the lower parts with a lower silt: clay ratio. Our results (Table 1) suggest that soil collected from the top part is most likely to migrate compared to soils associated with other locations in the gully.
The values for the microbial parameters also varied between different parts of the gully (Table 2).
It has been documented that variations in the microbial populations might result from the physical conditions of the topographical gradient, which determines the distribution of light, heat, and rainwater, by altering surface runoff [18,65]. The leaching and accumulation of nutrients and the composition of the soil solution depends on the slope position, causing differences in soil properties and creating different conditions for soil microbial activity [16].
In our study, dehydrogenase activity (DHA) was at a similar level in the top and bottom soils, but lower (p < 0.05) in the soil from the mid-slope position (Table 2). This may be related to the occurrence of the lowest pH in the mid-slope soil because other key parameters (Ntot, SOC, Cmic) were also at a similar level both in the top and mid-slope gully positions with a higher DHA value. A study on Mediterranean forests (cork oak) showed a positive correlation between DHA and pH, which was an even better predictor of DHA than the amount and quality of soil organic matter [66]. Since water erosion may reduce the soil water-holding capacity it can, in combination with a low pH, also alter the normal succession of soil microbiota [67]. In addition, the abundance of microbial communities decreased moving down the slope, which corresponded to the decrease in temperature [18]. Low DHA was also reported in eroded slopes of mining spoils, which was related to limited vegetation development and low soil organic matter [67].
Catalase activity (CAT) was significantly higher in the soil from the gully bottom, and this may be associated with microbial cell protection against toxic O2 species produced during aerobic respiration associated with the higher microbial biomass (Cmic) (Table 2), which has previously been reported [29,68]. A study on different landforms showed that CAT tended to have the highest activity in plateau soils and the lowest value in a terraced land, but the differences were not significant [17].
Microbial biomass (Cmic) at the bottom gully position was 19% higher than the top and mid-slope positions (p < 0.05), and basal respiration (BR) was 39% higher compared to the mid-slope location (p < 0.05) (Table 2). The Cmic and the BR provide an indication of soil functionality and biological activity [31,32]. Since soil parameters strongly regulate microbial growth and activity, we concluded that the high Cmic and BR are associated with the higher SOC content and pH in the bottom gully location. It has also been reported that gullies provided the best conditions for soil microorganisms in comparison with other erosional topographies [69].

3.2. CO2 Emissions from Forest Gully Soil

Soils from different parts of the forest gully, incubated at a higher (12% v/v) and lower (9% v/v) moisture level, varied in their CO2 emissions (Figure 1).
We concluded that soil CO2 emissions depended on gully position and the soil moisture conditions to which they were exposed. At the higher moisture level, all soils emitted more CO2 than at the lower moisture level. During soil incubation at the higher moisture level, the final CO2 concentration was 1233.51 ppm for the top, 941.20 ppm for the mid-slope, and 1421.35 ppm for the bottom position (Figure 1a) which corresponds to 73.14, 55.81, and 84.28 g CO2-C/kg, respectively. At the lower moisture level, the final CO2 emissions were significantly lower, by 27% for the top, 14% for the slope, and 18% for the bottom (Figure 1b). As a consequence of this, the hourly CO2 flux decreased in the following order: bottom > top > slope (p < 0.05) for both moisture levels (Figure 2).
The results suggest that the position in the gully is significantly related to the amount of CO2 emitted (Figure 2, Table 3), in agreement with a field study on eroding blanket peat gullies [70]. As in our experiment, this study also observed the highest CO2 emissions from the gully bottom, and these differences were attributed mainly to the absence of vegetation. In our gully, there was also variation in vegetation cover and no trees were present at the bottom.
Based on a field experiment on soils from riparian buffer zones, including slope alder forest, the emissions of all GHGs measured varied markedly at both temporal and spatial scales and were mainly controlled by soil moisture and temperature [71]. A study on a sandy loam soil in a mixed forest in Korea showed that intra-slope variability in soil respiration and related soil parameters for longer slopes (50 m) were generally greater than inter-slope variability [72]. In contrast, a two-year study of semiarid forest soils showed that, despite the varying physical and biogeochemical properties of the soil across the topographic gradient, soil respiration did not differ across the three slope positions [18].
Soil moisture is one of the microsite factors that often varies significantly in topographically different areas [72]. In addition to soil biogeochemical properties (SOC, soil nutrients, and structure) variations in moisture belong to physical processes that affect soil respiration [18]. In our experiment, CO2 emissions were lower at the lower soil moisture level, regardless of gully position (Figure 1 and Figure 2). We concluded that together with the tortuosity of soil pores, moisture not only controls soil CO2 concentrations (Table 3), mainly through an influence on soil gas diffusivity [73] but also through its effect on soil microbial activity [74]. Laboratory tests of undisturbed soil cores from different land-use types (croplands, forests, grasslands, and wetlands) showed that the maximum CO2 emissions occurred at intermediate soil moisture (between 20 and 60% WFPS, water-field pore space) contents and the optimum soil moisture conditions for CO2 emissions was dependent on soil texture [75]. At forest sites with sand and sandy loam soils, higher soil microbial respiration rates were recorded under drier soil conditions than in a clay loam associated with grassland [75].

3.3. Analysis of Interrelationships

Considering the soil properties measured along the topographical gradient of the gully, it was evident that the emissions of CO2 to the atmosphere (an environmental consequence of soil biological activity) was much less differentiated by the sand, silt, and clay contents, but was significantly influenced by SOC, Ntot, and Cmic and, especially, by soil pH (Table 4).
A positive relationship was found between CO2 emissions and CAT. Interestingly, CO2 emission showed no correlation with DHA (Table 4), probably due to the relatively low soil moisture conditions during soil sampling since the dehydrogenase enzymes are stimulated more by flooding/high water availability [76]. For CAT there was a significant positive relationship with soil pH, SOC, Ntot concentration, and microbial biomass (Cmic), which confirms the higher CAT values are indicative of higher biological activity in soils [24]. The C:N ratio was negatively correlated with Cmic but significantly positively correlated with pH, SOC, and Ntot concentration (Table A1 in Appendix A). A low C:N indicates a higher N concentration [77], which may result in a higher microbial biomass.
The interrelationships among CO2 emissions and soil-related factors confirm the complexity of the potential drivers of soil respiration in soil ecosystems, especially in a heterogeneous forest landscape. Wang et al. (2017) [69] reported that the relationships between physical and chemical soil properties, microbial populations, and enzymatic activities differed significantly amongst the different erosional topographies. A study conducted in a Pinus massoniana forest reported that the highest numbers of soil bacteria, fungi, and microorganisms were found in the gullies [69]. Heterotrophic respiration was also regulated by temperature through effects on changes in soil microbial structure and processes [18]. In an eroded area, soil CO2 flux is affected by run-off since this process influences SOC stocks and dynamics [78]. Regardless of the land use, both SOC and Ntot are concentrated in the near-surface (0–10 cm) soil layer and, in eroded areas, may be easily mineralized and transported, thus increasing CO2 emissions in depositional environments [79]. Higher SOC stocks in the depositional site, as in the gully bottom in our study, may be a result of displacement of finer particles and associated soil SOC from the eroding slope [78]. The results from an eroded area in China indicated that soil deposition beneficially enhanced soil microbial biomass in contrast to water erosion and, as in our research, CAT activity was higher in depositional (the bottom) than erosional sites [80]. The authors also observed a positive relationship between CAT and dissolved organic content.
There was a positive correlation between DHA and the amount of the sand fraction (but negatively with the silt and clay content; p < 0.05) (Table A1 in Appendix A). It is well known that DHA provides information about the active soil microbial population [25]. It was previously reported that the particle size distribution influenced both bacterial and fungal communities, regardless of soil management practice [81]. Bacterial richness increased with an increasing proportion of the sand fraction, because of the higher number of isolated hydrated microhabitats in coarser soils [82]. Soil texture also influences the activity of soil microbes, as differently sized particles create different microenvironments that influence microbial activity or support specific bacterial taxa [83]. The predominance of the sand fraction or coarse silt may result in better soil aeration, as individual particles are incorporated into macro-aggregates (>250 µm) where aerobic microorganisms are exposed to oxygenated conditions and, consequently, may dominate in these zones [83,84].

4. Conclusions

A failure to recognize the effect of local topographical variations in forests may be important in the estimation of ecosystem CO2 emissions and C sequestration. The position of soils in forest gullies has a significant effect on several soil variables, including C and N concentrations. The soil from the gully bottom can be characterized by having the highest pH, SOC, and Ntot concentrations, which may be largely due to the deposition of eroded fine materials together with organic matter. Higher SOC stocks were associated with the highest microbial biomass, catalase activity (CAT), and CO2 emission. Soils from all gully positions might emit more CO2 at higher moisture levels (12% v/v) in situ, indicating that water availability may be a general limiting factor. The positive relationship between CO2 emissions and CAT indicates that the activity of aerobic soil microbiota was the main source of CO2 emissions. We suggest that in studies on forest ecosystems with a high density of gullies or ravines, the inclusion of such topographic features may reduce the error and improve the estimates of soil CO2 emissions and C sequestration. While the general applicability of these results to other gullies is uncertain, the predominant influence of slope-related movement of water and inorganic/organic materials as an important driver of location-dependent differences suggests that many gullies may share a number of common characteristics. Studies including different soil types and other afforested systems exposed to contrasting environmental conditions will be important to confirm the generality of the observed trends.

Author Contributions

Conceptualization, A.W.; methodology, A.W., P.B., and M.B.; software, A.W. and P.B.; validation, B.O. and M.I.K.; formal analysis, A.W. and P.B.; investigation, A.W. and P.B.; data curation, A.W.; writing—original draft preparation, A.W.; writing—review and editing, B.O. and M.I.K.; visualization, A.W.; supervision, B.O. and M.I.K.; project administration, B.O.; funding acquisition, A.W., M.I.K., and B.O. All authors have read and agreed to the published version of the manuscript.

Funding

The research was partly financed by the Polish National Centre for Research and Development within of ERA-NET CO-FUND ERA-GAS Program (contract number ERA-GAS/I/GHG-MANAGE/01/2018) “GHG-Manage”.

Institutional Review Board Statement

Not applicable.

Informed Consent Statement

Not applicable.

Data Availability Statement

The data presented in this study are available on request from the corresponding author. The data are not publicly available due to privacy.

Conflicts of Interest

The authors declare no conflict of interest. The funders had no role in the design of the study; in the collection, analyses, or interpretation of data; in the writing of the manuscript, or in the decision to publish the results.

Appendix A

Table A1. Correlation coefficients between the CO2 emission and the microbial and physicochemical parameters of soils from the top, mid-slope, and bottom of the forest gully (asterisk indicates significant differences at p < 0.05).
All SamplesCO2
Emission
DHACATBRCmicClaySiltSandpHSOCNtot.C:N
CO2 emission1
DHA0.6301
CAT0.877 *0.4951
BR0.792 *0.5910.4431
Cmic0.851 *0.3170.830 *0.6061
clay−0.089−0.731 *0.169−0.3220.3361
silt−0.224−0.802 *0.043−0.4240.2130.990 *1
sand0.2050.792 *−0.0620.409−0.231−0.993 *−0.999 *1
pH0.991 *0.6450.847 *0.844 *0.852 *−0.101−0.2350.2151
SOC0.854 *0.2160.880 *0.5440.796 *0.3300.203−0.2210.831 *1
Ntot.0.823 *0.1380.836 *0.5600.822 *0.4100.286−0.3040.813 *0.975 *1
C:N−0.4810.160−0.499−0.383−0.680 *−0.596−0.5180.530−0.514−0.643−0.792 *1

References

  1. Canadell, J.G.; Raupach, M.R. Managing forests for climate change mitigation. Science 2008, 320, 1456–1457. [Google Scholar] [CrossRef] [PubMed] [Green Version]
  2. Lal, R. Forest soils and carbon sequestration. For. Ecol. Manag. 2005, 220, 242–258. [Google Scholar] [CrossRef]
  3. Peng, Y.; Thomas, S.C.; Tian, D. Forest management and soil respiration: Implications for carbon sequestration. Environ. Rev. 2008, 16, 93–111. [Google Scholar] [CrossRef]
  4. Meixner, F.X.; Eugster, W. Effects of landscape pattern and topography on emissions and transport. In Integrating Hydrology, Ecosystem Dynamics, and Biogeochemistry in Complex Landscapes; Tenhunen, J.D., Kabat, P., Eds.; John Wiley & Sons Ltd.: Chichester, UK, 1999; Volume 3, pp. 143–175. [Google Scholar]
  5. Brito, L.D.; Marques, J.; Pereira, G.T.; Souza, Z.M.; La Scala, N. Soil CO2 emission of sugarcane fields as affected by topography. Sci. Agric. 2009, 66, 77–83. [Google Scholar] [CrossRef] [Green Version]
  6. Qu, B.; Aho, K.S.; Li, C.; Kang, S.; Sillanpää, M.; Yan, F.; Raymond, P.A. Greenhouse gases emissions in rivers of the Tibetan Plateau. Sci Rep. 2017, 7, 1657. [Google Scholar] [CrossRef] [PubMed] [Green Version]
  7. Oertel, C.; Matschullat, J.; Zurba, K.; Zimmermann, F.; Erasmi, S. Greenhouse gas emissions from soils—A review. Chem. Erde. 2016, 76, 327–352. [Google Scholar] [CrossRef] [Green Version]
  8. Marty, C.; Piquette, J.; Morin, H.; Bussières, D.; Thiffault, N.; Houle, D.; Bradley, R.L.; Simpson, M.J.; Ouimet, R.; Paré, M.C. Nine years of in situ soil warming and topography impact the temperature sensitivity and basal respiration rate of the forest floor in a Canadian boreal forest. PLoS ONE 2019, 14, e0226909. [Google Scholar] [CrossRef] [Green Version]
  9. Arias-Navarro, C.; Díaz-Pinés, E.; Klatt, S.; Brandt, P.; Rufino, M.C.; Butterbach-Bahl, K.; Verchot, L.V. Spatial variability of soil N2O and CO2 fluxes in different topographic positions in a tropical montane forest in Kenya. J. Geophys. Res. Biogeosci. 2017, 122, 514–527. [Google Scholar] [CrossRef]
  10. Dagar, J.C.; Singh, A.K. Ravine Lands: Greening for Livelihood an Environmental Security; Springer Nature Singapore Pte Ltd.: Singapore, 2018; p. 4. [Google Scholar]
  11. Gawrysiak, L.; Harasimiuk, M. Spatial diversity of gully density of the Lublin Upland and Roztocze Hills (SE Poland). Ann. UMCS 2012, 67, 27–43. [Google Scholar] [CrossRef] [Green Version]
  12. Zgłobicki, W.; Poesen, J.; Cohen, M.; Del Monte, M.; García-Ruiz, J.M.; Ionita, I.; Niacsu, L.; Machová, Z.; Martín-Duque, J.F.; Nadal-Romero, E.; et al. The Potential of Permanent Gullies in Europe as Geomorphosites. Geoheritage 2019, 11, 217–239. [Google Scholar] [CrossRef]
  13. Vanwalleghem, T.; Van Den Eeckhaut, M.; Poesen, J.; Deckers, J.; Nachtergaele, J.; Van Oost, K.; Slenters, C. Characteristics and controlling factors of old gullies under forest in a temperate humid climate: A case study from the Meerdaal Forest (Central Belgium). Geomorphology 2003, 56, 15–29. [Google Scholar] [CrossRef]
  14. Baran-Zgłobicka, B.; Zgłobicki, W. Mosaic landscapes of SE Poland: Should we preserve them? Agrofor. Syst. 2012, 85, 351–365. [Google Scholar] [CrossRef] [Green Version]
  15. Langohr, R.; Sanders, J. The Belgium Loessbelt in the last 20,000 years: Evolution of soils andrelief in the Zonien Forest. In Soils and Quaternary Landscape Evolution; Boardman, J., Ed.; Wiley: Chichester, UK, 1985; pp. 359–371. [Google Scholar]
  16. Tsui, C.C.; Chen, Z.S.; Hsieh, C.F. Relationships between soil properties and slope position in a lowland rain forest of southern Taiwan. Geoderma 2004, 123, 131–142. [Google Scholar] [CrossRef]
  17. Hao, Y.; Chang, Q.; Li, L.; Wei, X. Impacts of landform, land use and soil type on soil chemical properties and enzymatic activities in a Loessial Gully watershed. Soil Res. 2014, 52, 453–462. [Google Scholar] [CrossRef]
  18. Shi, W.-Y.; Du, S.; Morina, J.C.; Guan, J.-H.; Wang, K.-B.; Ma, M.-G.; Yamanaka, N.; Tateno, R. Physical and biogeochemical controls on soil respiration along a topographical gradient in a semiarid forest. Agric. For. Meteorol. 2017, 247, 1–11. [Google Scholar] [CrossRef]
  19. Konda, R.; Ohta, S.; Ishizuka, S.; Heriyanto, J.; Wicaksono, A. Seasonal changes in the spatial structures of N2O, CO2, and CH4 fluxes from Acacia mangium plantation soils in Indonesia. Soil Biol. Biochem. 2010, 42, 1512–1522. [Google Scholar] [CrossRef]
  20. Xu, M.; Zhang, J.; Liu, G.B.; Yamanaka, N. Soil properties in natural grassland, Caragana korshinskii planted shrubland, and Robinia pseudoacacia planted forest in gullies on the hilly Loess Plateau, China. Catena 2014, 119, 116–124. [Google Scholar] [CrossRef]
  21. Wolf, K.; Flessa, H.; Veldkamp, E. Atmospheric methane uptake by tropical montane forest soils and the contribution of organic layers. Biogeochemistry 2012, 111, 469–482. [Google Scholar] [CrossRef] [Green Version]
  22. Smith, K.A.; Ball, T.; Conen, F.; Dobbie, K.E.; Massheder, J.; Rey, A. Exchange of greenhouse gases between soil and atmosphere: Interactions of soil physical factors and biological processes. Eur. J. Soil Sci. 2003, 54, 779–791. [Google Scholar] [CrossRef] [Green Version]
  23. Garcia, C.; Hernandez, T.; Costa, F. Potential use of dehydrogenase activity as an index of microbial activity in degraded soils. Commun. Soil Sci. Plant Anal. 1997, 28, 123–134. [Google Scholar] [CrossRef]
  24. Garcia, C.; Hernandez, T. Biological and biochemical indicators in derelict soils subject to erosion. Soil Biol. Biochem. 1997, 29, 171–177. [Google Scholar] [CrossRef]
  25. Błońska, E.; Lasota, J.; Zwydak, M. The relationship between soil properties, enzyme activity and land use. Forest Res. Pap. 2017, 78, 39–44. [Google Scholar] [CrossRef] [Green Version]
  26. Wolińska, A.; Stępniewska, Z. Dehydogenase activity in soil ecosystem. In Dehydrogenases; Canuto, R.A., Ed.; Intech: Rijeka, Croatia, 2012; pp. 183–210. [Google Scholar]
  27. Moeskops, B.; Sukristiyonubowo; Buchan, D.; Sleutel, S.; Herawaty, L.; Husen, E.; Saraswati, R.; Setyorini, D.; De Neve, S. Soil microbial communities and activities under intensive organic and conventional vegetable farming in West Java, Indonesia. Appl. Soil Ecol. 2010, 45, 112–120. [Google Scholar] [CrossRef]
  28. Gu, Y.; Wang, P.; Kong, C. Urease, invertase, dehydrogenase and polyphenoloxidase activities in paddy soils influenced by allelophatic rice variety. Eur. J. Soil Biol. 2009, 45, 436–444. [Google Scholar] [CrossRef]
  29. Trasar-Cepeda, C.; Camiña, F.; Leirós, M.; Gil-Sotres, F. An improved method to measure catalase activity in soils. Soil Boil. Biochem. 1999, 31, 483–485. [Google Scholar] [CrossRef]
  30. Garcıa-Gil, J.C.; Kobza, J.; Soler-Rovira, P.; Javoreková, S.; García-Gil, J.C. Soil microbial and enzyme activities response to pollution near an aluminium smelter. CLEAN Soil Air Water 2013, 41, 485–492. [Google Scholar] [CrossRef] [Green Version]
  31. Anderson, T.-H. Microbial eco-physiological indicators to asses soil quality. Agric. Ecosyst. Environ. 2003, 98, 285–293. [Google Scholar] [CrossRef]
  32. Zhao, F.; Wang, J.; Zhang, L.; Ren, C.; Han, X.; Yang, G.; Doughty, R.; Deng, J. Understory plants regulate soil respiration through changes in soil enzyme activity and microbial C, N, and P stoichiometry following afforestation. Forests 2018, 9, 436. [Google Scholar] [CrossRef] [Green Version]
  33. Wang, C.; Zhang, Y.; Li, Y. Soil type and a labile C addition regime control the temperature sensitivity of soil C and N mineralization more than N addition in wetland soils in China. Atmosphere 2020, 11, 1043. [Google Scholar] [CrossRef]
  34. Krzyżewska, A.; Wereski, S.; Nowosad, M. Thermal variability in the Lublin Region during the frost wave in January 2017. Ann. UMCS Sec. B 2019, 74, 217–229. [Google Scholar] [CrossRef] [Green Version]
  35. Bhat, S.A.; Dar, M.U.D.; Meena, R.S. Soil erosion and management strategies. In Sustainable Management of Soil and Environment, 1st ed.; Meena, R.S., Kumar, S., Bohra, J.S., Jat, M.L., Eds.; Springer Nature Pte Ltd.: Singapore, 2019; p. 91. [Google Scholar]
  36. Bieganowski, A.; Chojecki, T.; Ryżak, M.; Sochan, A.; Lamorski, K. Methodological Aspects of Fractal Dimension Estimation on the Basis of Particle Size Distribution. Vadose Zone J. 2013, 12, 12. [Google Scholar] [CrossRef]
  37. Bieganowski, A.; Ryżak, M.; Sochan, A.; Barna, G.; Hernádi, H.; Beczek, M.; Polakowski, C.; Makó, A. Laser diffractometry in the measurements of soil and sediment particle size distribution. Adv. Agron. 2018, 151, 215–279. [Google Scholar] [CrossRef]
  38. You, G.; Zhang, Z.; Zhang, R. Temperature adaptability of soil respiration in short-term incubation experiments. J. Soil. Sediment. 2019, 19, 557–565. [Google Scholar] [CrossRef]
  39. Walkiewicz, A.; Brzezińska, M.; Bieganowski, A.; Sas-Paszt, L.; Frąc, M. Early response of soil microbial biomass and activity to biofertilizer application in degraded Brunic Arenosol and Abruptic Luvisol of contrasting textures. Agronomy 2020, 10, 1347. [Google Scholar] [CrossRef]
  40. Trevors, J. Rapid gas chromatographic method to measure H2O2 oxidoreductase (catalase) activity in soil. Soil Boil. Biochem. 1984, 16, 525–526. [Google Scholar] [CrossRef]
  41. Walkiewicz, A.; Brzezińska, M. Interactive effects of nitrate and oxygen on methane oxidation in three different soils. Soil Boil. Biochem. 2019, 133, 116–118. [Google Scholar] [CrossRef]
  42. Casida, L.E.; Klein, D.A.; Santoro, T. Soil Dehydrogenase Activity. Soil Sci. 1964, 98, 371–376. [Google Scholar] [CrossRef]
  43. Anderson, J.; Domsch, K. A physiological method for the quantitative measurement of microbial biomass in soils. Soil Boil. Biochem. 1978, 10, 215–221. [Google Scholar] [CrossRef]
  44. Šimek, M.; Kalčík, J. Carbon and nitrate utilization in soils: The effect of long-term fertilization on potential denitrification. Geoderma 1998, 83, 269–280. [Google Scholar] [CrossRef]
  45. Chojnicki, B.H.; Michalak, M.; Acosta, M.; Juszczak, R.; Augustin, J.; Drösler, M.; Olejnik, J. Measurements of carbon dioxide fluxes by chamber method at the Rzecin wetland ecosystem, Poland. Pol. J. Environ. Stud. 2010, 19, 283–291. [Google Scholar]
  46. Flessa, H.; Wild, U.; Klemisch, M.; Pfadenhauer, J. Nitrous oxide and methane fluxes from organic soils under agriculture. Eur. J. Soil Sci. 1998, 49, 327. [Google Scholar]
  47. Patton, N.R.; Lohse, K.A.; Seyfried, M.S.; Godsey, S.E.; Parsons, S.B. Topographic controls of soil organic carbon on soil-mantled landscapes. Sci. Rep. 2019, 9, 6390. [Google Scholar] [CrossRef] [PubMed] [Green Version]
  48. Islam, K.; Anusontpornperm, S.; Kheoruenromne, I.; Thanachit, S. Carbon sequestration in relation to topographic aspects and land use in northeast of Thailand. Int. J. Environ. Clim. Chang. 2018, 8, 118–137. [Google Scholar] [CrossRef]
  49. Hou, G.; Delang, C.O.; Lu, X. Afforestation changes soil organic carbon stocks on sloping land: The role of previous land cover and tree type. Ecol. Eng. 2020, 152, 105860. [Google Scholar] [CrossRef]
  50. Zhang, X.; Adamowski, J.F.; Liu, C.; Zhou, J.; Zhu, G.; Dong, X.; Cao, J.; Feng, Q. Which slope aspect and gradient provides the best afforestation-driven soil carbon sequestration on the China’s Loess Plateau? Ecol. Eng. 2020, 147, 105782. [Google Scholar] [CrossRef]
  51. Feller, C.; Beare, M.H. Physical control of soil organic matter dynamics in the Tropics. Geoderma 1997, 79, 69–116. [Google Scholar] [CrossRef]
  52. Siqueira Neto, M.; Scopel, E.; Corbeels, M.; Nunes Cardoso, A.; Douzet, J.M.; Feller, C.; Piccolo, M.C.; Cerri, C.C.; Bernoux, M. Soil carbon stocks under no-tillage mulch-based cropping systems in the Brazilian Cerrado: An on-farm synchronic assessment. Soil Till. Res. 2010, 110, 187–195. [Google Scholar] [CrossRef]
  53. Sattler, D.; Murray, L.T.; Kirchner, A.; Lindner, A. Influence of soil and topography on aboveground biomass accumulation and carbon stocks of afforested pastures in South East Brazil. Ecol. Eng. 2014, 73, 126–131. [Google Scholar] [CrossRef]
  54. Li, T.; Zhang, H.; Wang, X.; Cheng, S.; Fang, H.; Liu, G.; Yuan, W. Soil erosion affects variations of soil organic carbon and soil respiration along a slope in Northeast China. Ecol. Process 2019, 8, 28. [Google Scholar] [CrossRef] [Green Version]
  55. Churchill, R.R. Aspect-related differences in badlands slope morphology. Ann. Assoc. Am. Geogr. 1981, 71, 374–388. [Google Scholar]
  56. Parsons, A.J. Hillslope Form; Routledge: London, UK, 1988. [Google Scholar]
  57. Regmi, N.R.; McDonald, E.V.; Rasmussen, C. Hillslope response under variable microclimate. Earth Surf. Proc. Land 2019, 44, 2615–2627. [Google Scholar] [CrossRef]
  58. Zhang, Y.; Mu, C.C.; Zheng, T.; Li, N.N. Ecosystem carbon storage of natural secondary birch forests in Xiaoxing’an Mountains of China. J. Beijing For. Univ. 2015, 37, 38–47. [Google Scholar]
  59. Wang, W.; Wang, Y.; Hoch, G.; Wang, Z.; Gu, J. Linkage of root morphology to anatomy with increasing nitrogen availability in six temperate tree species. Plant Soil 2018, 425, 189–200. [Google Scholar] [CrossRef]
  60. Gressel, N.; Inbar, Y.; Singer, A.; Chen, Y. Chemical and spectroscopic properties of leaf litter and decomposed organic matter in the Carmel Range, Israel. Soil Biol. Biochem. 1995, 27, 23–31. [Google Scholar] [CrossRef]
  61. Tsai, S.-H.; Selvam, A.; Yang, S.-S. Microbial diversity of topographical gradient profiles in Fushan forest soils of Taiwan. Ecol. Res. 2007, 22, 814–824. [Google Scholar] [CrossRef]
  62. Schlaghamerský, J.; Devetter, M.; Hánel, L.; Tajkovský, K.; Starý, J.; Tuf, I.H.; Pizl, V. Soil fauna across Central European sandstone ravines with temperature inversion: From cool and shady to dry and hot places. App. Soil Ecol. 2014, 83, 30–38. [Google Scholar] [CrossRef]
  63. Blättermann, M.; Frechen, M.; Gass, A.; Hoelzmann, P.; Parzinger, H.; Schütt, B. Late Holocene landscape reconstruction in the Land of Seven Rivers, Kazakhstan. Quat. Int. 2012, 251, 42–51. [Google Scholar] [CrossRef]
  64. Whitmyer, R.W.; Blake, G.R. Influence of silt and clay on the physical performance of sand-soil mixtures. Agron. J. 1989, 81, 5–12. [Google Scholar] [CrossRef]
  65. Kosheleva, N.E.; Kasimov, N.S.; Vlasow, D.V. Factors of the accumulation of heavy metals and metalloids at geochemical barriers in urban soils. Eurasian Soil Sci. 2015, 48, 476–492. [Google Scholar] [CrossRef]
  66. Quilchano, C.; Marañón, T. Dehydrogenase activity in Mediterranean forest soils. Biol. Fertil. Soils 2002, 35, 102–107. [Google Scholar] [CrossRef]
  67. Moreno-de las Heras, M. Development of soil physical structure and biological functionality in mining spoils affected by soil erosion in a Mediterranean-Continental environment. Geoderma 2009, 149, 249–256. [Google Scholar] [CrossRef]
  68. Alef, K.; Nannipieri, P. Catalase activity. In Methods in Applied Soil Microbiology and Biochemistry; Alef, K., Nannipieri, P., Eds.; Academic Press: London, UK, 1995; pp. 362–363. [Google Scholar]
  69. Wang, B.; Wang, Y.; Wang, L. The effects of erosional topography on soil properties in a Pinus massoniana forest in southern China. J. Soil Water Conserv. 2017, 72, 36–44. [Google Scholar] [CrossRef]
  70. Clay, G.D.; Dixon, S.; Evans, M.G.; Rowson, J.G.; Worrall, F. Carbon dioxide fluxes and DOC concentrations of eroding blanket peat gullies. Earth Surf. Process. Land. 2012, 37, 562–571. [Google Scholar] [CrossRef]
  71. Soosaar, K.; Mander, Ü.; Maddison, M.; Kanal, A.; Kull, A.; Lőhmus, K.; Truu, J.; Augustin, J. Dynamics of gaseous nitrogen and carbon fluxes in riparian alder forests. Ecol. Eng. 2011, 37, 40–53. [Google Scholar] [CrossRef]
  72. Kang, S.; Doh, S.; Lee, D.; Lee, D.; Jin, V.L.; Kimball, J.S. Topographic and climatic controls on soil respiration in six temperate mixed-hardwood forest slopes, Korea. Glob. Change Biol. 2003, 9, 1427–1437. [Google Scholar] [CrossRef] [Green Version]
  73. Oh, N.-H.; Kim, H.-S.; Richter, D.D. What regulates soil CO2 concentrations? A modeling approach to CO2 diffusion in deep soil profiles. Environ. Eng. Sci. 2005, 22, 38–45. [Google Scholar] [CrossRef]
  74. Gliński, J.; Stępniewski, W. Soil Aeration and Its Role for Plants; CRC Press: Boca Raton, FL, USA, 1985. [Google Scholar]
  75. Schaufler, G.; Kitzler, B.; Schindlbacher, A.; Skiba, U.; Sutton, M.A.; Zechmeister-Boltenstern, S. Greenhouse gas emissions from European soils under different land use: Effects of soil moisture and temperature. Eur. J. Soil Sci. 2010, 61, 683–696. [Google Scholar] [CrossRef]
  76. Brzezińska, M.; Stępniewska, Z.; Stępniewski, W. Soil oxygen status and dehydrogenase activity. Soil Biol. Biochem. 1998, 30, 1783–1790. [Google Scholar] [CrossRef]
  77. Cools, N.; Vesterdal, L.; De Vos, B.; Vanguelova, E.; Hansen, K. Tree species is the major factor explaining C:N ratios in European forest soils. Forest Ecol. Manag. 2014, 311, 3–16. [Google Scholar] [CrossRef]
  78. Zhang, J.; Quine, T.A.; Ni, S.; Ge, F. Stocks and dynamics of SOC in relation to soil redistribution by water and tillage erosion. Glob. Change Biol. 2006, 12, 1834–1841. [Google Scholar] [CrossRef]
  79. Li, Z.W.; Liu, C.; Dong, Y.T.; Chang, X.F.; Nie, X.D.; Lin, L.; Xiao, H.B.; Lu, Y.M.; Zeng, G.M. Response of soil organic carbon and nitrogen stocks to soil erosion and land use types in the Loess hilly-gully region of China. Soil Tillage Res. 2017, 166, 1–9. [Google Scholar] [CrossRef]
  80. Li, Z.; Xiao, H.; Tang, Z.; Huang, J.; Nie, X.; Huang, B.; Ma, W.; Lu, Y.; Zeng, G. Microbial responses to erosion-induced soil physico-chemical property changes in the hilly red soil region of southern China. Eur. J. Soil Biol. 2015, 71, 37–44. [Google Scholar] [CrossRef]
  81. Seaton, F.M.; George, P.B.L.; Lebron, I.; Jones, D.L.; Creer, S.; Robinson, D.A. Soil textural heterogeneity impacts bacterial but not fungal diversity. Soil Biol. Biochem. 2020, 144, 107766. [Google Scholar] [CrossRef]
  82. Chau, J.F.; Bagtzoglou, A.C.; Willig, M.R. The effect of soil texture on richness and diversity of bacterial communities. Environ. Forensics 2011, 12, 333–341. [Google Scholar] [CrossRef]
  83. Hemkemeyer, M.; Dohrmann, A.B.; Christensen, B.T.; Tebbe, C.C. Bacterial preferences for specific soil particle size fractions revealed by community analyses. Front. Microbiol. 2018, 9, 149. [Google Scholar] [CrossRef] [Green Version]
  84. Sessitsch, A.; Weilharter, A.; Gerzabek, M.H.; Kirchmann, H.; Kandeler, E. Microbial population structures in soil particle size fractions of a long-term fertilizer field experiment. Appl. Environ. Microbiol. 2001, 67, 4215–4224. [Google Scholar] [CrossRef] [PubMed] [Green Version]
Figure 1. Cumulative CO2 emission in soils from different positions of the forest gully: top, mid-slope, and bottom incubated at (a) higher moisture (12% vol.); (b) lower moisture (9% vol.) (average values ± 95% confidence intervals; n = 3).
Forests 12 00226 g001
Figure 2. Emissions of CO2 from soils collected from the top, mid-slope, and bottom of the gully and incubated at high (12% vol.) and low moisture (9% vol.) contents (average values ± sd; n = 3; the same letter indicates no significant differences; the small letters refer to differences between positions, and the capital letters refer to the differences between moisture conditions; ANOVA, Tukey HSD test, p < 0.05).
Forests 12 00226 g002
Table 1. Physicochemical parameters of soils collected along the topographical gradient of the forest gully: top, mid-slope, and bottom (average values ± sd; n = 3; the same letter indicates no significant difference; ANOVA, Tukey HSD test, p < 0.05).
Tested PositionsTopMid-SlopeBottom
SOC (%)1.28 ± 0.046 (a)1.27 ± 0.036 (a)1.70 ± 0.128 (b)
Ntot (%)0.09 ± 0.003 (a)0.10 ± 0.002 (a)0.13 ± 0.012 (b)
C:N Ratio13.99 ± 0.30 (b)13.40 ± 0.45 (ab)12.70 ± 0.64 (a)
pH5.44 ± 0.06 (b)4.89 ± 0.15 (a)6.17 ± 0.08 (c)
Textureloamy sandsandy loamsandy loam
Clay (%)1.70 ± 0.11 (a)3.51 ± 0.09 (b)3.51 ± 0.41 (b)
Silt (%)19.93 ± 1.14 (a)38.30 ± 1.06 (c)34.07 ± 0.97 (b)
Sand (%)78.37 ± 1.25 (c)58.26 ± 1.08 (a)62.42 ± 1.37 (b)
Silt:Clay Ratio11.72 ± 0.13 (c)10.93 ± 0.10 (b)9.80 ± 0.83 (a)
Table 2. Microbial parameters of soils collected along the topographical gradient of the forest gully: top, mid-slope, and bottom (average values ± sd; n = 3; the same letter indicates no significant difference; ANOVA, Tukey HSD test, p < 0.05).
Tested PositionsTopMid-SlopeBottom
CAT (µmol O2/g/min)10.77 ± 2.09 (a)10.64 ± 0.98 (a)11.26 ± 0.88 (b)
DHA (µg TPF/g/20 h)2.74 ± 0.35 (b)1.00 ± 0.25 (a)2.32 ± 0.43 (b)
BR (µg CO2-C/g/h)6.91 ± 0.82 (ab)5.41 ± 0.79 (a)7.51 ± 0.60 (b)
Cmic (mg C/g)0.97 ± 0.02 (a)0.97 ± 0.01 (a)1.15 ± 0.06 (b)
CAT—catalase activity, DHA—dehydrogenase activity, BR—basal respiration, Cmic—microbial biomass.
Table 3. Multifactor ANOVA with F-ratios and p-values for the factors that affected CO2 emission: position (top, mid-slope, bottom of the gully) and moisture (9% and 12% v/v), and their interaction.
SourceSum of SquaresDegrees of FreedomMean SquareF-Ratiop-Value
Factor
Position239,7172119,85915,472.10.00
Moisture116,8501116,85015,083.80.00
Position × Moisture825924129533.10.00
Error93128
Table 4. Correlation coefficients between the CO2 emission and the microbial and physicochemical parameters of soils from the top, mid-slope, and bottom of the forest gully (asterisk indicates significant differences at p < 0.05).
DHACATBRCmicClaySiltSandpHSOCNtotC:N
CO2 Emission0.630.877 *0.792 *0.851 *−0.089−0.2240.2050.991 *0.854 *0.823 *−0.481
(DHA—dehydrogenase activity, CAT—catalase activity, BR—basal respiration, Cmic—microbial biomass).
Publisher’s Note: MDPI stays neutral with regard to jurisdictional claims in published maps and institutional affiliations.

