Article

Long-Term Soil Fertility and Site Productivity in Stem-Only and Whole-Tree Harvested Stands in Boreal Forest of Quebec (Canada)

Direction de la Recherche Forestière, Ministère des Forêts, de la Faune et des Parcs du Québec, 2700 Einstein Street, Quebec City, QC G1P 3W8, Canada
*
Author to whom correspondence should be addressed.
Submission received: 7 April 2021 / Revised: 28 April 2021 / Accepted: 1 May 2021 / Published: 7 May 2021

Abstract

:
Using residual biomass from forest harvesting to produce energy is viewed increasingly as a means to reduce fossil fuel consumption. However, the impact such practices on soil and future site productivity remains a major concern. We revisited 196 forest plots that were subject to either whole-tree (WTH) or stem-only (SOH) harvesting 30 years ago in the boreal forest in Quebec, Canada. Plots were stratified by four soil regions grouped by so-called ‘soil provinces’. Soil analyses indicated that after 30 years, the forest floor of WTH sites had smaller pools of N (−8%), exchangeable Ca (−6%) and exchangeable Mn (−21%) and a higher C/N ratio (+12%) than that of SOH sites. Mineral soil responses to the two harvesting intensities differed among soil provinces. In the two coarse-textured granitic soil provinces, organic matter, organic carbon, and nitrogen pools over the whole solum (0–60 cm soil depth) were at least 28% smaller after WTH than after SOH. Site productivity indicators followed differences between soils and were lower after WTH than after SOH in the two granitic soil provinces. The study shows that soil characteristics greatly influence a soil’s sensitivity to increased forest biomass harvesting in the long term.

1. Introduction

The development of bioenergy and renewable energy technologies to shift away from the use of high-emission fossil fuels is key to achieving reductions in greenhouse gas emissions. The various transition pathways explored so far to limit the rise of global mean temperature abundantly rely on bioenergy due to its multiple roles in the decarbonization of energy [1]. The bioenergy industry is still in its early stages in North America. For instance, residual biomass generated by forest harvesting in public forests in Quebec amounted to 8779 green Mg in 2018–2019, of which only 8.6% was attributed to users [2]. Nonetheless, forest biomass converted into bioenergy primarily for the targeted substitution of greenhouse gas-intensive materials or energy is part of various scenarios to mitigate the rise of atmospheric CO2, by the Quebec forestry sector for example [3]. Among the methods used to harvest wood, whole-tree harvesting (WTH), which encompasses several methods in which all parts of the tree above the stump are harvested, and stem-only harvesting (SOH) in which only the merchantable stems are harvested, are generally used to analyze the effects of more intense harvesting, such as those for biomass production. However, as high concentrations of nutrients are found in branches, tops, and foliage, harvesting most or all parts of the tree above the stump raises concerns about the maintenance of soil fertility and site productivity over the long term [4].
Many research articles have reported the impacts of WTH on site productivity [5,6,7,8,9]. However, most results are based on short-term analyses over 5 years or less [10]. Literature reviews and meta-analyses have shown that the increase in biomass removal has limited or only short-term effects on soil chemistry or site productivity [5,11,12,13]. Long-term experiments in Sweden showed that WTH led to smaller pools of exchangeable base cations in soils compared to SOH [14,15]. Other studies in Sweden and the United States found no evidence that WTH reduced pools of organic matter, C, or N in soils for up to 30 years after harvesting [7,16,17]. In Canada, Morris et al. [18] found no significant differences in C, N, P, and K pools in the first 20 cm of sandy soils, compared to pre-harvest levels, for SOH and WTH, 20 years after treatment; they also found no evidence of decline in tree growth after the two harvest treatments. Short-term and long-term studies may reveal different responses, since tree nutrient requirements are relatively low during the first decade after regeneration, particularly for conifer species [19].
Soil type, climate, and tree species composition appear to be critical determinants of site sensitivity to biomass harvesting [5,20,21]. A first classification of forest ecological types considered sensitive to WTH, based mainly on the concept of critical load of acidity, was used in Quebec’s state forest sustainability policy framework [22]. Critical loads of acidity depend on the long-term steady-state geochemical budget of base cations, i.e., inputs (atmospheric depositions, soil chemical weathering) vs. outputs (alkaline leaching, exports through biomass harvesting). The critical load model has been successfully used to inform and guide international negotiations aimed at reducing emissions of atmospheric acidifying pollutants across Europe and North America [23]. In the context of biomass harvesting, the critical load thresholds are considered to be exceeded when the long-term nutrient exports by WTH cannot be compensated by the inflows from atmospheric depositions and soil chemical weathering [24,25]. This concept, however, has been criticized for the static nature of its calculation and because it does not address the issue of the internal nutrient cycling of biochemical and biogeochemical ecosystems [26]. So far, the focus has been mainly in the long-term management of base cations and the prevention of soil damage by compaction or erosion. Little attention has been paid to the dynamics of ecosystem element pools, such as soil organic carbon pools [21]. Long-term changes in soil carbon after WTH or SOH are not well characterized, especially in deeper mineral soil horizons. Deeper soil horizons are rarely monitored due to the effort required for sampling, and because it is assumed that mineral soil organic C is old and stable. However, evidence exists that deeper soil layers can respond dramatically to ecosystem disturbances [27,28].
In this study, we revisited 196 forest plots harvested 30 years ago by either WTH or SOH in the boreal forest of Quebec, Canada. Our objective was to study how soil element pools and tree productivity responded to the two harvest treatments. The province of Quebec contains over 27.8 Mha of public-managed forest land, with an allowable annual harvest of 32.7 Mm3·yr−1 [2]. Black spruce (Picea mariana (Mill.) B.S.P.), balsam fir (Abies balsamea (L.) Mill.), and Jack pine (Pinus banksiana Lamb.) are the main commercial tree species in this boreal forest. The following hypotheses were tested:
  • WTH sites have smaller soil element pools than SOH sites;
  • Soil responses to biomass harvesting intensity differ among soil regions;
  • Forest stands grow less following WTH than following SOH.

2. Materials and Method
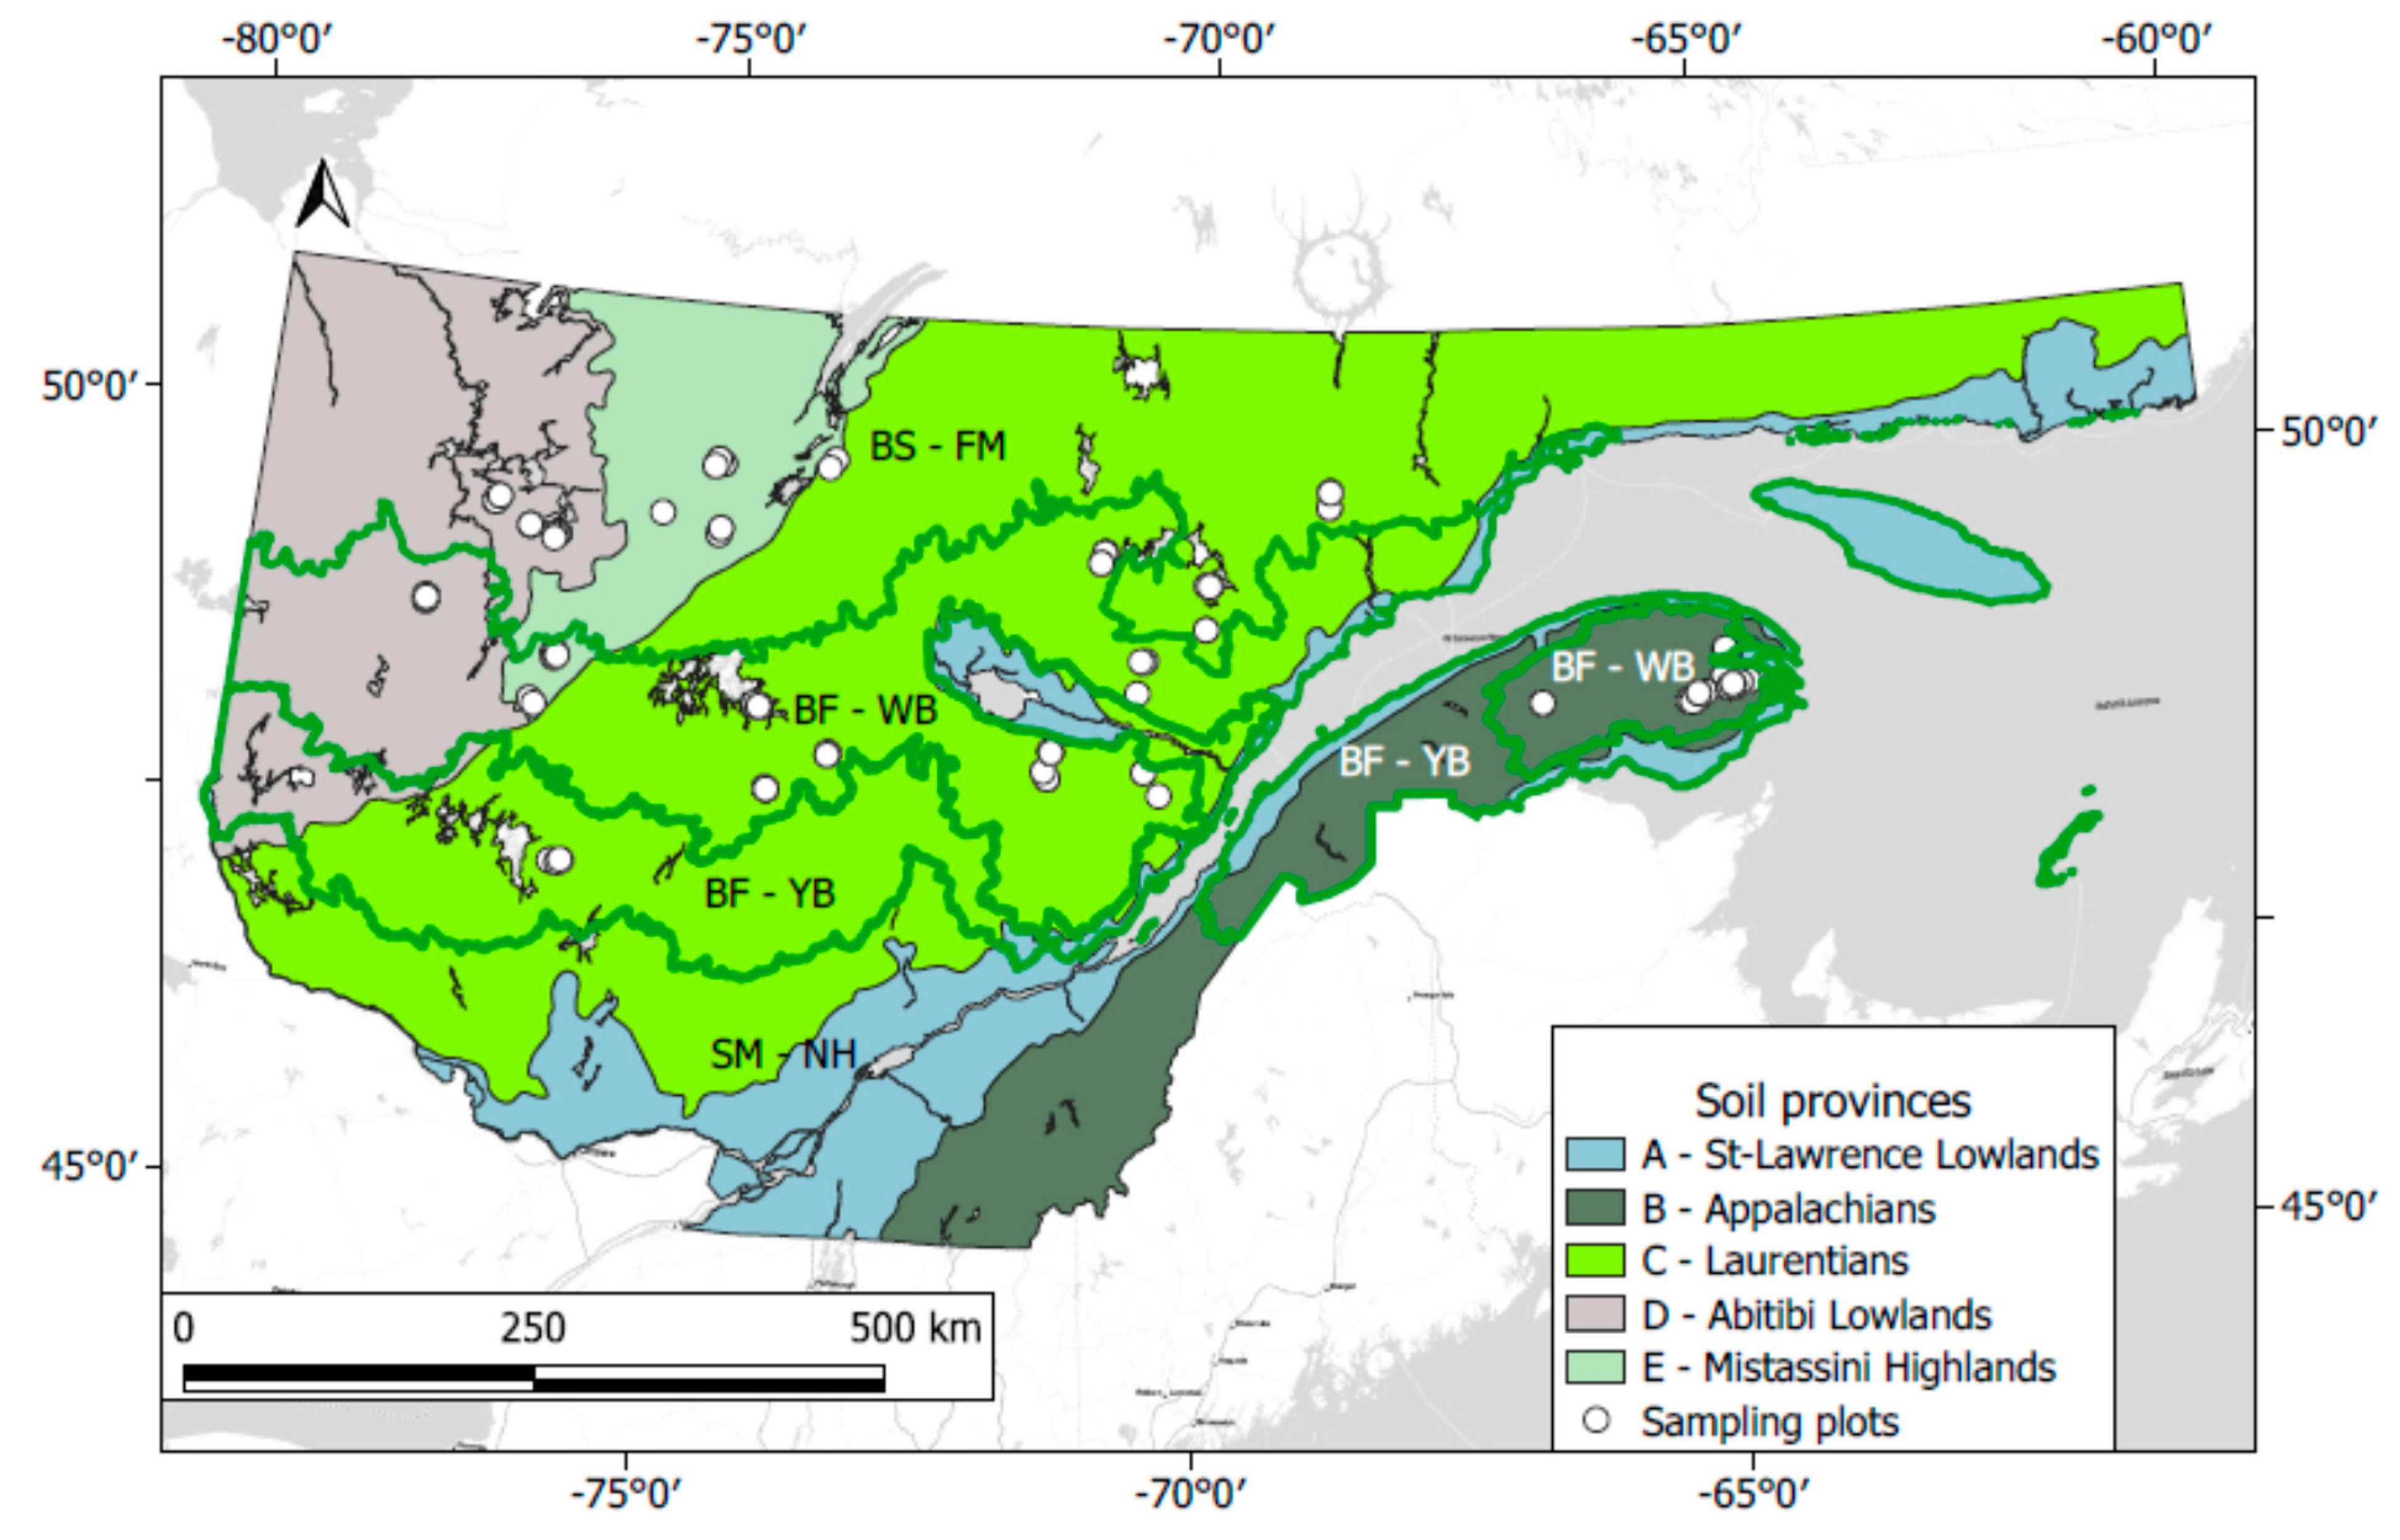
2.1. Study Area

The study area includes mainly the balsam fir–white birch bioclimatic domain and the southern part of the black spruce–feather moss bioclimatic domain, from east to west in the province of Quebec, Canada, between 47° and 50° of latitude N (Figure 1). The study plots were located in four of the five soil provinces recognized in southern Quebec [29]: the Appalachians (B), the Laurentians (C), the Abitibi and James Bay Lowlands (D; hereafter referred to Abitibi Lowlands for concision), and the Mistassini Highlands (E). These soil provinces can be distinguished according to main parent material (geology, geomorphology), altitude (e.g., areas invaded by post-glacial seas), topography (slopes, landforms), soil texture, vegetation, and climate (temperature, rainfall, degree-days; see Table 1). The main types of late-successional vegetation throughout the study area are the balsam fir–white birch forest and black spruce–feather moss forest. Major tree species in the study plots are balsam fir, black spruce, jack pine, white spruce (Picea glauca (Moench) Voss.), and white birch (Betula papyrifera Marshall) (see detailed composition of the stands sampled by soil province in the Supplementary Material, Table S1).

2.2. Experimental Design

From 1982 to 1988, 562 circular plots (0.04 ha each, 11.28 m radius) were established just before clear-cut harvest throughout the boreal forest of Quebec. In 2011, we selected 196 of these plots (sites) based on their accessibility and their similarities regarding pre-harvest stand composition (black spruce–balsam fir stands), surface deposit types and depth, and drainage class among the four soil provinces. Trees were harvested either by WTH (feller-buncher, mechanical harvester and cable skidder, or manual felling and cable skidder) or SOH systems (manual or mechanical felling and delimbing onsite, and cable skidder). No differences in the natural regeneration composition and abundance were observed between WTH and SOH plots up to 10 years after harvesting operations [33].

2.3. Field Sampling and Measurements

Starting 20 years after treatment, plots were measured every five years by staff of Quebec’s Ministère des Forêts, de la Faune et des Parcs. Height measurements were taken on the same 20 trees in each plot. These trees were selected as representative of the observed diameter distribution of each species at the moment of the first plot survey. In all, two to four height measurements per tree were available over the years.
The selected plots were also revisited for tree measurements and soil sampling from 2011 to 2013, a time that represents a median period of 30 years (interquartile range: 2 years). For this survey, five to eight dominant trees in the study plots were measured for their diameter at breast height (DBH) and total height (Supplementary Material Table S2). Two cores per tree were also taken to assess individual tree radial growth and site quality index (SQI). Overall, these trees had a DBH of 12.7 ± 2.7 cm (mean ± SD), a height of 8.7 ± 1.8 m and were 22.4 ± 5.5 years old at DBH height. Soils were also sampled at this time. The forest floor was sampled quantitatively at 12 equidistant points (subsamples every 30 gon, or approximately 5.9 m) around each plot using a bipartite 8 cm volumetric root auger. Mineral soil was also sampled quantitatively at each of the four cardinal points (subsamples every 90 gon, or approximately 16 m) at depth intervals of approximately 15 cm, down to 60 cm. The same root auger was used for all samples, and sampling depth was recorded for each sample. When it was not possible to quantitatively sample a soil layer, we used a standard Edelman auger. We also assessed soil drainage class using provincial standards [34]. In all, 16 plots were classified as having excessive drainage (class 1), 96 as well drained (class 2), 57 as moderately well drained (class 3) and 27 as imperfectly drained (classes 4 and 5).

2.4. Laboratory Analyses

All soils were kept frozen (−18 °C) until preparation for laboratory analysis. Forest floor and soil samples were air-dried for at least four days, after which the quantitative samples were weighed individually. Forest floor samples were passed through a Wiley mill, and the 12 subsamples per plot were mixed thoroughly to form a composite sample for chemical analysis. The air-dried forest floor samples and all mineral soil subsamples were passed through a 2 mm mesh sieve. The fine fraction was analyzed for remaining humidity, organic matter by loss upon ignition, pH (soil:water 1:2 weight/volume), exchangeable cations (Ca, Mg, K, Al, acidity, cation exchange capacity (CEC), base saturation (BS); extraction with NH4Cl 1 N, 12 h). A subsample of the fine fraction was further ground to 250 μm for the determination of total C and N by dry combustion (LECO CR-412, LECO Corporation, St. Joseph, MI, USA). The forest floor samples were further analyzed for total P, K, Ca, and Mg concentrations by digestion in concentrated H2SO4 followed by measurement by inductively coupled plasma emission spectrophotometry (ICP-AES). The fraction >2 mm of the quantitative mineral soil samples was weighed in order to determine the proportion of coarser fragments (f).
Tree cores were dried, glued to wooden holders, and sanded according to the standard procedure [35]. Tree age was determined after detection of ring boundaries under binocular magnification. Ring widths were measured using WinDENDRO ™ software (version 6.1D, Regent Instruments Inc., Quebec City, QC, Canada), and validated using signature rings to assist crossdating [36]. Visual crossdating was done through the recognition of patterns of wide and narrow rings common to sites within a given soil province [37]. Each set of raw tree ring measurements was evaluated using the COFECHA computer program [38] to ensure proper crossdating. Ring width values were converted to basal area increment (BAI, cm2·yr−1) using the bai.out function of the dplR R package [39], version 1.6, in version 3.6.1 of the R software environment [40]. We selected BAI because it better reflects tree volume increment than does diameter increment [41].

2.5. Computations

Biomass and mineralomass (N, P, K, Ca, and Mg) for initial stands, exports, and what remained on the ground (for SOH only, as we assumed no above-ground tree biomass was left with WTH) were estimated from the pre-harvest forest surveys using the stand-scale biomass and nutrients calculator for Canadian forests [42]. The inputs for this calculator are the total and individual tree species basal areas. With respect to soils, organic matter content of the forest floor was calculated using Equation (1)
OM = 100 × M A
where
  • OM is organic matter content (Mg·ha−1),
  • M is oven-dry sample mass (g), and
  • A is core sampling area (50.265 cm2).
Element content in the forest floor was calculated using Equation (2)
Q H = 10 6 × [ x ] × OM
where
  • QH is element content in the forest floor (kg·ha−1), and
  • [x] is element concentration in the forest floor (mg·kg−1).
Element and OM contents in a given mineral soil layer were calculated using Equation (3)
Q m = 0.1 × [ x ] × D b × E e
where
  • Qm is element content in the mineral soil (kg·ha−1),
  • [x] is element concentration (mg·kg−1) on an oven-dry basis,
  • Db is bulk density (g·cm−3), and
  • Ee is effective thickness of the layer (cm), i.e., the corrected thickness of the soil layer without fragments (f).
Effective horizon thickness was calculated using Equation (4)
E e =   E × ( 1 f )
where
  • Ee is effective thickness of the layer (cm),
  • E is measured thickness of the layer (cm), and
  • f is the coarsest fraction of the volumetric sample (>2 mm) (%/100).
We estimated the bulk density of the soil layers that had not been sampled quantitatively (n = 2114) using a quantitative relationship obtained from the measured Db and OM concentrations of the quantitative mineral soil samples (n = 1368) for each great soil texture class (sand, loam, clay) following the methodology of Federer, et al. [43] (Supplementary Material Table S3 and Figure S1). The aqp R package v. 1.17 [44] was used to recalculate all the soil variables at fixed depths of 0–15, 15–30, and 30–60 cm (measured thickness). Element pools in individual layers were summed to represent the first 60 cm of mineral soil. All soil concentrations and pools are reported on an oven-dry mass basis.
Site quality index for each tree species, expressed as the height of the corresponding 50-year-old dominant trees, was determined using the age-height equations of Pothier and Savard [45] for Picea mariana, Abies balsamea, and Pinus banksiana, and those of Prégent, et al. [46] for Picea glauca (see Supplementary Material Figure S2). Average annual height growth (units: cm·yr−1) per species in each plot was also calculated from the plot surveys.

2.6. Statistical Analysis

Soil chemical properties and element pools along mineral soil depths and for the whole 0–60 cm mineral soil depth range were analyzed using a generalized nested linear mixed model. Harvesting treatments (SOH and WTH), soil provinces, soil depth and their third-order interactions were considered as fixed effects. Plots within soil provinces and location of individual soil samples within plots were considered as random effects. Properties, exchangeable and total element pools, forest floor thickness, biomass and mineralomass, as well as tree height growth variables (SQI for each tree species and annual tree height growth) were analyzed with a generalized nested linear mixed model that included harvesting treatments, soil provinces, and their second-order interactions as fixed effects. Tree height growth variables were analyzed separately by tree species. Plots and their associated drainage class within soil provinces and individual tree samples within plots were considered as random effects. Assumptions of homoscedasticity and normality of sample distributions were verified by residual plot analysis. The standardized residuals of these models were then plotted against all independent variables to detect possible heterogeneity in their variances. If present, variance heterogeneity was corrected by allowing for different variances per strata. We selected the models for which the variance function structures had the lowest Akaike Information Criterion (AIC) scores. Adjusted (predicted) means were computed with emmeans R package v. 1.4.2 [47], and statistical comparisons were made using specific a priori contrasts between harvesting treatments within soil provinces. The analyses were performed with the nlme R package v. 3.1-141 [48]. Pearson’s product-moment correlations were also calculated between tree species, average SQI per plot, and all soil chemical properties and element pools.
Tree BAI growth over the period after harvesting was analyzed by generalized additive modeling (GAM) for each soil province, with harvesting treatment and tree species as fixed factors, and time after harvesting and interaction between time and the fixed factors as spline functions. The bam function of the mgcv R package, v. 1.8-31 [49] was used to perform the GAMs with the cubic regression (cr) penalized spline function and the starting basis dimension (knots) equal to 30. A first order (AR1) autoregressive error model was employed to reduce autocorrelations in the residuals. BAI values had to be log-transformed to homogenize the residues. We identified the periods during which the splines differed significantly between the two harvesting treatments (α = 0.05) using the plot_diff function of the itsadug R package v. 2.3 [50]. Simultaneous confidence intervals (95% CI) were computed for this comparison.

3. Results

3.1. Harvested Biomass and Mineralomass

On average, WTH generated 32% more exported biomass than SOH, and 233% (P), 136% (K), 84% (Ca), and 112% (Mg) more mineralomass (Table 2). Differences in N exports amounted to 150 ± 10 kg·ha1 (178%). There were also some similarities among soil provinces. Exported biomass and Ca were similar in both harvesting treatments in the granitic soil provinces (Laurentians (C) and Mistassini Highlands (E), p ≥ 0.062). In addition, in these two soil provinces similar amounts of biomass were harvested, but about half mineralomass (at the exception of Ca) were exported by SOH as compared to WTH. This is due to the larger basal area—and therefore greater bole biomass—in sites subjected to SOH compared to WTH (Supplementary Material Table S1). On average, the estimated quantities of biomass and mineralomass left on the ground (foliage and branches) by the SOH treatment (Supplementary Material Table S4) were very similar to the average calculated difference between WTH and SOH sites shown in Table 2.

3.2. Differences in the Forest Floor after 30 Years

All studied forest floor chemical properties differed among soil provinces in terms of exchangeable and total pools (p ≤ 0.018; Table 3 and Table 4). Also, several differences were observed between harvesting treatments across all soil provinces: (i) the total N pool was 8% smaller in WTH sites (1.32 ± 0.06 Mg·ha−1) than in SOH sites (1.43 ± 0.05 Mg·ha−1, p = 0.046; Figure 2); (ii) the C/N ratio was 12% higher in WTH sites (42.6 ± 1.0) than in SOH sites (38.2 ± 0.8, p < 0.001; Table 3); (iii) the exchangeable Ca pool was marginally smaller in WTH sites (352 ± 34 kg·ha−1) than in SOH sites (374 ± 24 kg·ha−1, p = 0.052); (iv) the exchangeable Mn pool was 21% smaller in WTH sites (14.2 ± 1.3 kg·ha−1) than in SOH sites (17.9 ± 0.9 kg·ha−1, p = 0.026).
Some other differences in the forest floor could also be observed between SOH and WTH sites, depending on the soil province:
-
In the Appalachians soil province (B), the total Mn pool was 26% smaller in WTH sites (p = 0.026; Table 4).
-
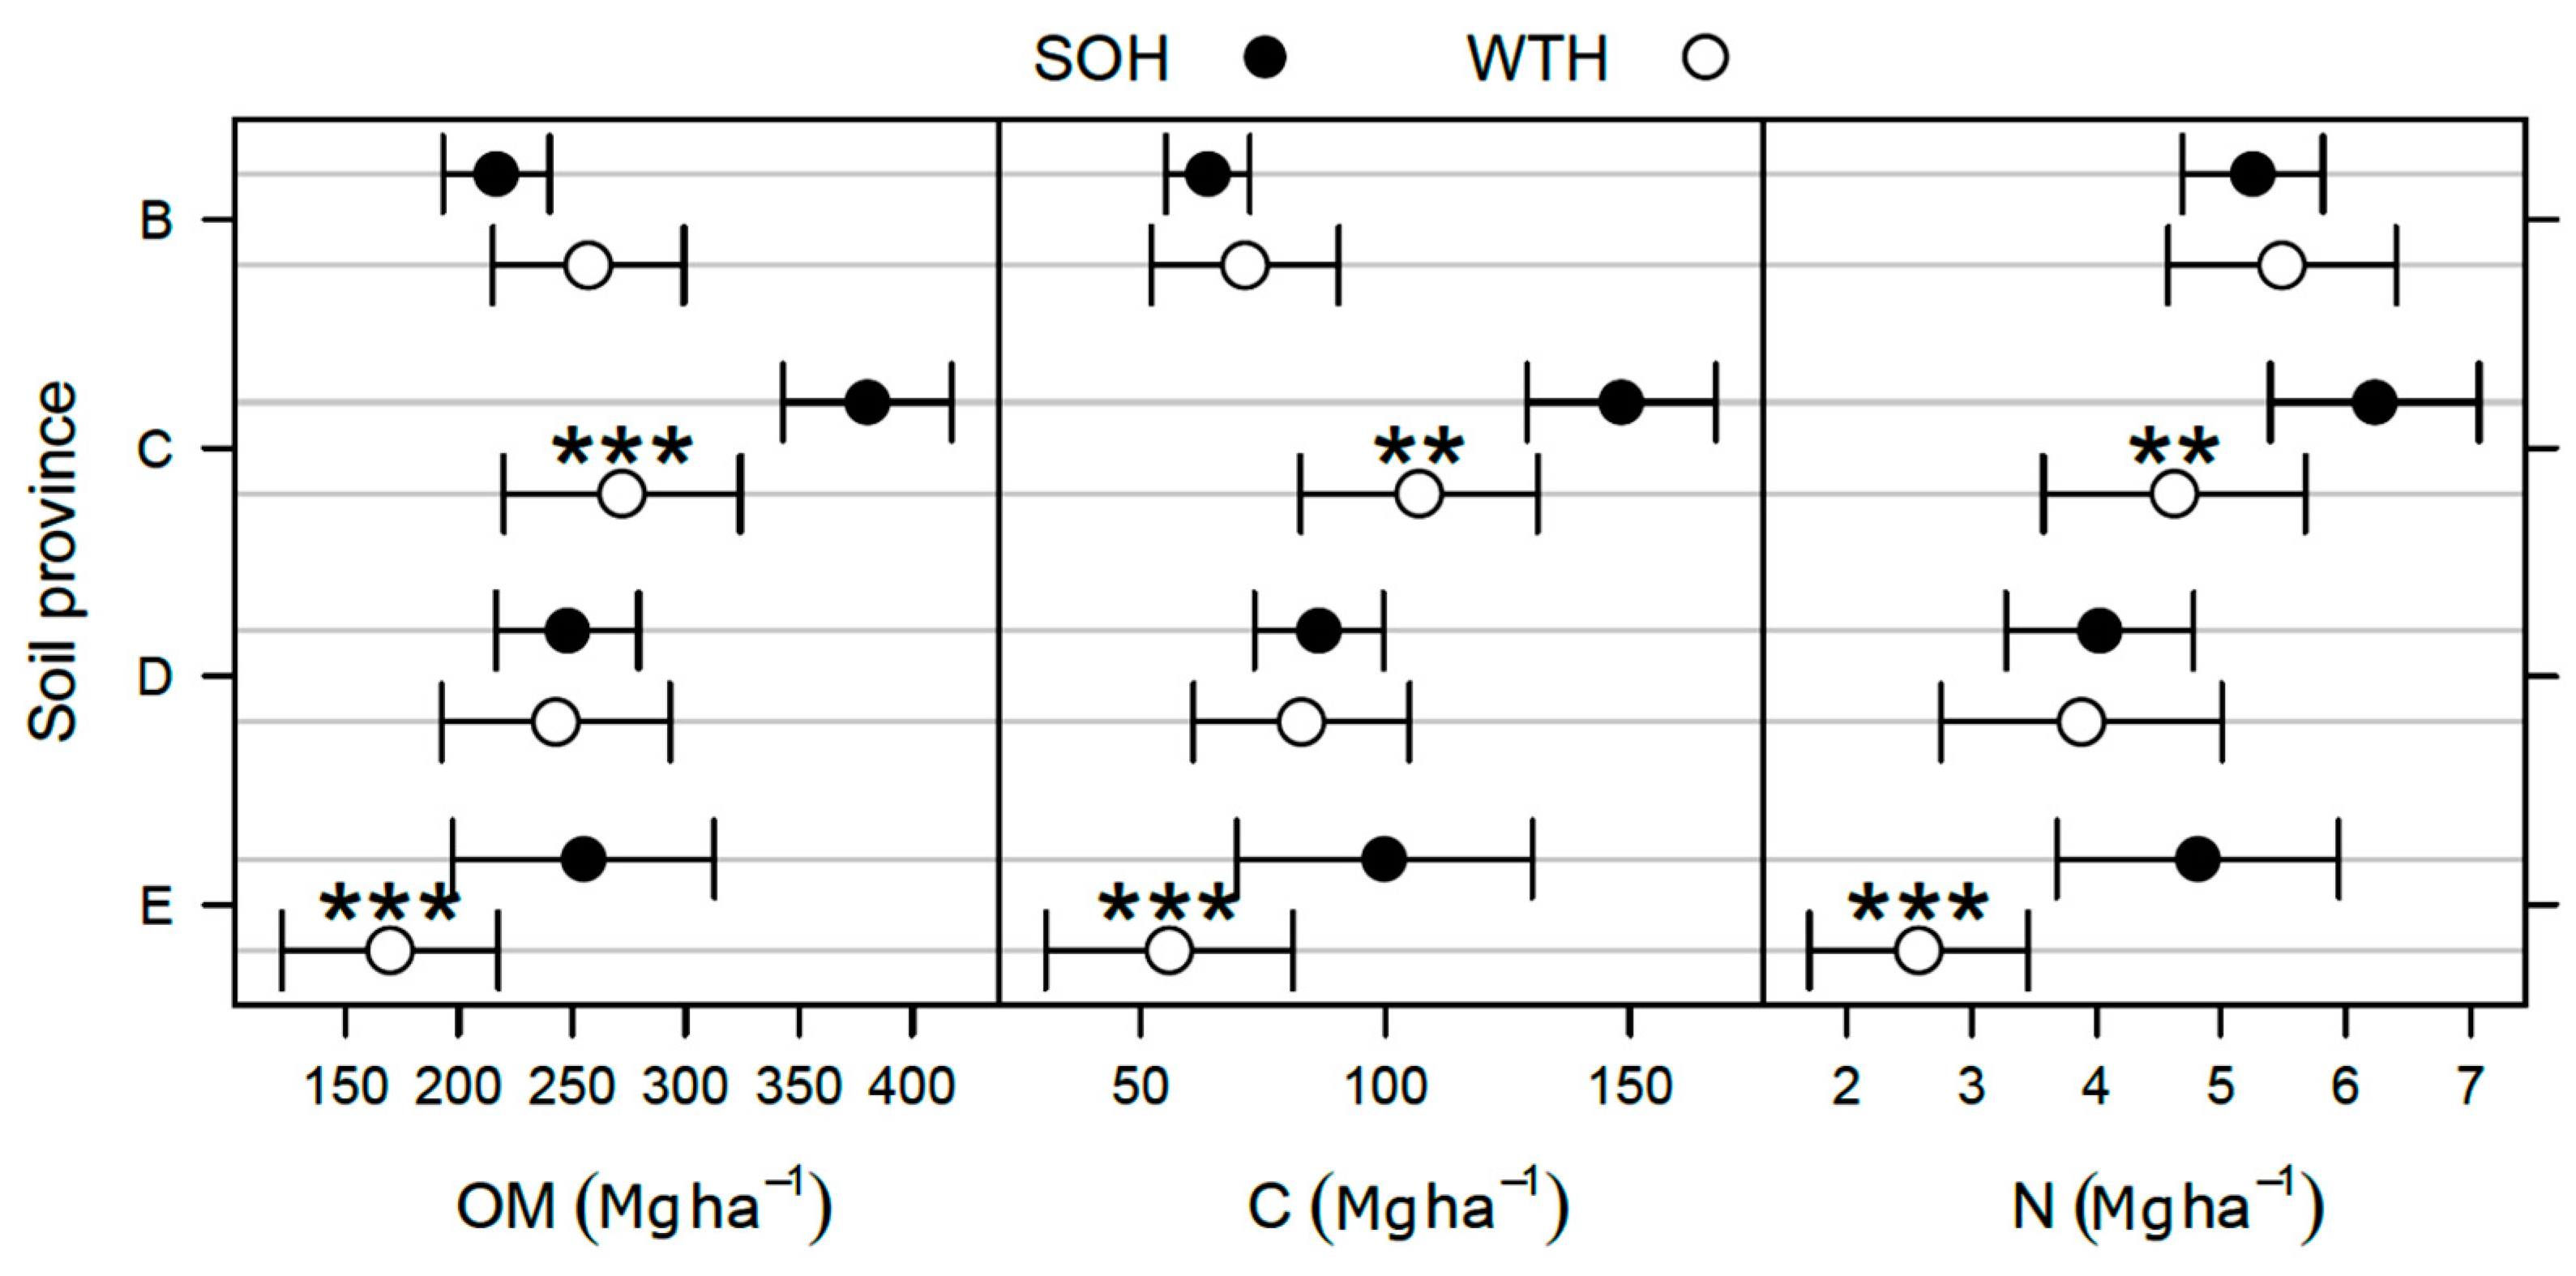
In the Laurentians soil province (C), BS was 16% lower in WTH sites than in SOH sites (p = 0.003; Table 3).
-
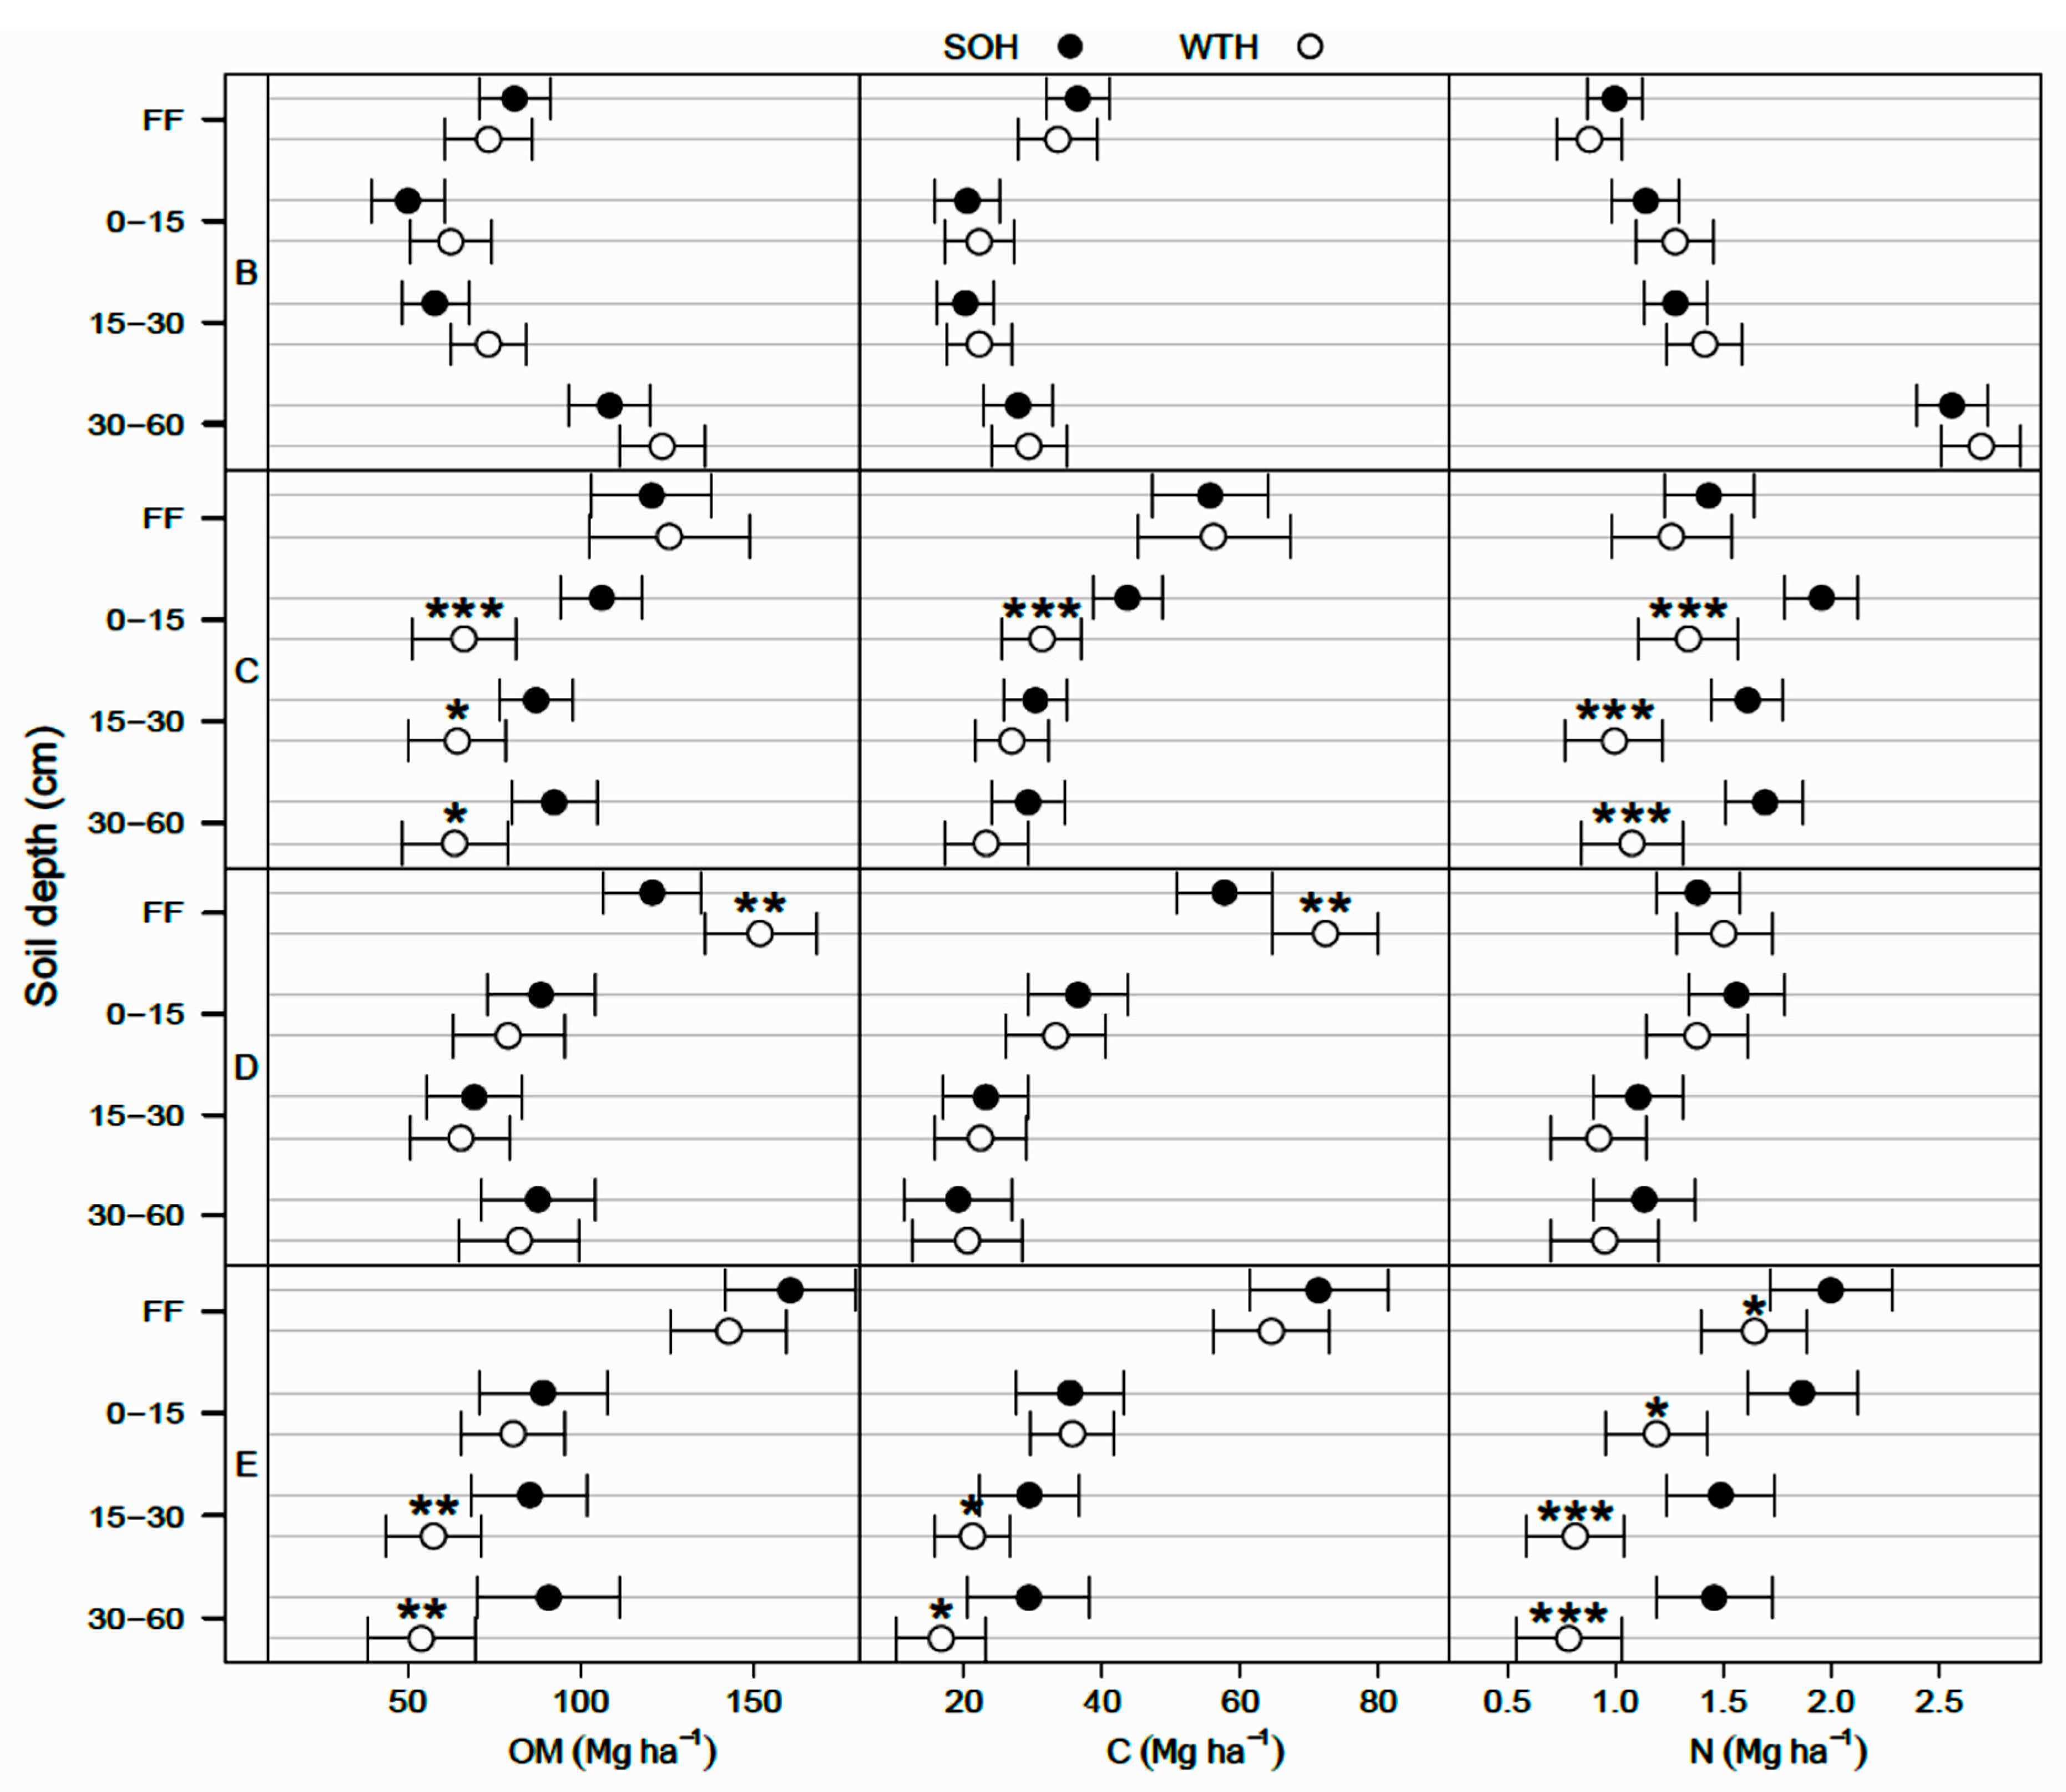
In the Abitibi Lowlands soil province (D), OM and organic C pools were about 25% greater in WTH sites (OM: 152 ± 8 Mg·ha−1; C: 72 ± 4 Mg·ha−1) than in SOH sites (OM: 121 ± 7 Mg·ha−1; C: 58 ± 3 Mg·ha−1; p = 0.004; Figure 2). In the forest floor, total P pool was nearly 20% larger (p = 0.021; Table 4), total Mn pool was 40% smaller (p = 0.026; Table 4), and exchangeable Mg and CEC pools were respectively 41% and 28% larger in WTH sites than in SOH sites (p ≤ 0.007; Table 3). Forest floor acidity status—as expressed by BS, exchangeable Al, exchangeable Fe, and exchangeable acidity pools—was 71% to 118% greater (19% smaller in the case of BS) in WTH sites than in SOH sites (p ≤ 0.014).
-
In the Mistassini Highlands soil province (E), no differences in OM and organic C pools in the forest floor were detected between WTH and SOH sites (p ≥ 0.119), but total N pool was 18% smaller in WTH sites (1.64 ± 0.12 Mg·ha−1) than in SOH sites (2.00 ± 0.14 Mg·ha−1, p = 0.050; Figure 2). Total K pool in the forest floor also was 16% smaller (p = 0.018; Table 4), while total Fe pool was 35% larger in WTH sites than in SOH sites (p = 0.002). This was the only instance where total K and Fe pools in the forest floor differed between harvesting treatments.
Within soil provinces, forest floor thickness was similar in both harvesting treatments after 30 years (10.8 ± 0.6 cm, p = 0.310, Table 4); this was also the case for the pH (4.11 ± 0.03, p = 0.989) and exchangeable K pool (79 ± 2 kg·ha−1, p = 0.068, Table 3).

3.3. Differences in the Mineral Soil after 30 Years

In the mineral soil, large differences were observed among soil provinces for all studied soil chemical properties (p ≤ 0.045; Table 3, Figure 2). In addition, several differences between the two harvesting treatments were observed across all soil provinces: (i) the soil exchangeable Mn pool was 32% and 42% larger in WTH sites (35.6 ± 2.7 kg·ha−1 for the whole soil 0–60 cm layer, and 12.2 ± 0.8 kg·ha−1 on average for a given soil layer) than in SOH sites (27.0 ± 2.1 kg·ha−1 for the whole soil 0–60 cm layer, and 8.6 ± 0.7 kg·ha−1 on average for a given soil layer, p ≤ 0.014), and (ii) the soil exchangeable Fe pool in the whole soil 0–60 cm layer was 15% smaller in WTH sites (94 ± 7 kg·ha−1) than in SOH sites (111 ± 6 kg·ha−1, p = 0.012). Soil BS also differed between harvesting treatments across all soil provinces, but also according to soil depth, with about 33% higher values for WTH sites at depths of 15–30 cm and 30–60 cm (15–30 cm: 47% ± 4%; 30–60 cm: 60% ± 4%) as compared with SOH sites (15–30 cm: 35% ± 3%; 30–60 cm: 44% ± 3%, p ≤ 0.019). Soil BS in the 0–15 cm soil layer was similar for both harvesting treatments when averaged across all soil provinces (24.7% ± 3.1%, p = 0.866). Soil exchangeable Al and exchangeable acidity pools also differed between harvesting treatments and according to soil depth, but also among soil provinces (see below).
Some differences in soil variables could be observed between SOH and WTH sites depending on soil provinces. Major differences in OM, C, and N pools in soils were observed only in the two granitic soil provinces (Laurentians (C) and Mistassini Highlands (E); Figure 2). Over the whole 0–60 cm soil depth, the OM, C, and N pools in the Laurentians were approximately 28% smaller in WTH sites (in Mg·ha−1, OM: 272 ± 26, C: 107 ± 12, N: 4.6 ± 0.5) than in SOH sites (in Mg·ha−1, OM: 380 ± 19, C: 148 ± 10, N: 6.2 ± 0.4, p ≤ 0.004; Figure 3). These smaller pools in WTH sites were apparent at all three mineral soil depths, with the exception of C in the two deepest soil layers in the Laurentians (Figure 2). In the Mistassini Highlands, these pools were 33% (OM), 44% (C), and 46% (N) smaller in WTH sites (in Mg·ha−1, OM: 170 ± 24, C: 56 ± 13, N: 2.6 ± 0.4) than in SOH sites (in Mg·ha−1, OM: 255 ± 29, C: 100 ± 15, N: 4.8 ± 0.6, p ≤ 0.001; Figure 3) over the whole 0–60 cm soil layer. For this soil province, these pools were smaller in WTH sites only at the lower soil depths (15–30 and 30–60 cm, p ≤ 0.048; Figure 2), except for the N pool, which was smaller at all soil depths (p ≤ 0.015). In this regard, the C/N ratio in the mineral soils of Mistassini Highlands was higher in WTH sites (26.8 ± 1.9 on average for a given soil layer) than in SOH sites (19.6 ± 2.1 on average for a given soil layer; p = 0.009) throughout the soil profile. Significantly lower acidity status was also observed between WTH and SOH sites at soil depths of 15–30 cm and 30–60 cm in the Mistassini Highlands. Indeed, in this soil province, BS was 74% higher and exchangeable Al and exchangeable acidity pools were 48% to 61% smaller in WTH sites than in SOH sites at these soil depths (p ≤ 0.033, Table 3). The other granitic soil province, the Laurentians, also showed differences in acidity status; more precisely, pools of exchangeable Al and exchangeable acidity in the top 0–15 cm soil layer were approximately 40% smaller in WTH sites (Al: 252 ± 46 kg·ha−1, exchangeable acidity: 31 ± 5 keq·ha−1) than in SOH sites (Al: 433 ± 36 kg·ha−1, exchangeable acidity: 51 ± 4 keq·ha−1, p ≤ 0.001). In the Appalachians, exchangeable K pools in the 15–30 cm and 30–60 cm soil layers were respectively 30% and 35% larger in WTH sites than in SOH sites (p ≤ 0.047), but K pool was similar for both treatments in the 0–15 cm soil layer (p = 0.086). In contrast, the exchangeable K pool in the Abitibi Lowlands was 41% smaller in the 0–15 cm soil layer of WTH sites (20 ± 8 kg·ha−1) as compared with SOH sites (34 ± 6 kg·ha−1, p = 0.018), but not in the deeper soil layers (p ≥ 0.133). Finally, no practical difference in soil pH and statistical differences in exchangeable Ca and Mg pools could be detected between harvesting treatments in the soil provinces at any soil depth (p ≥ 0.292).

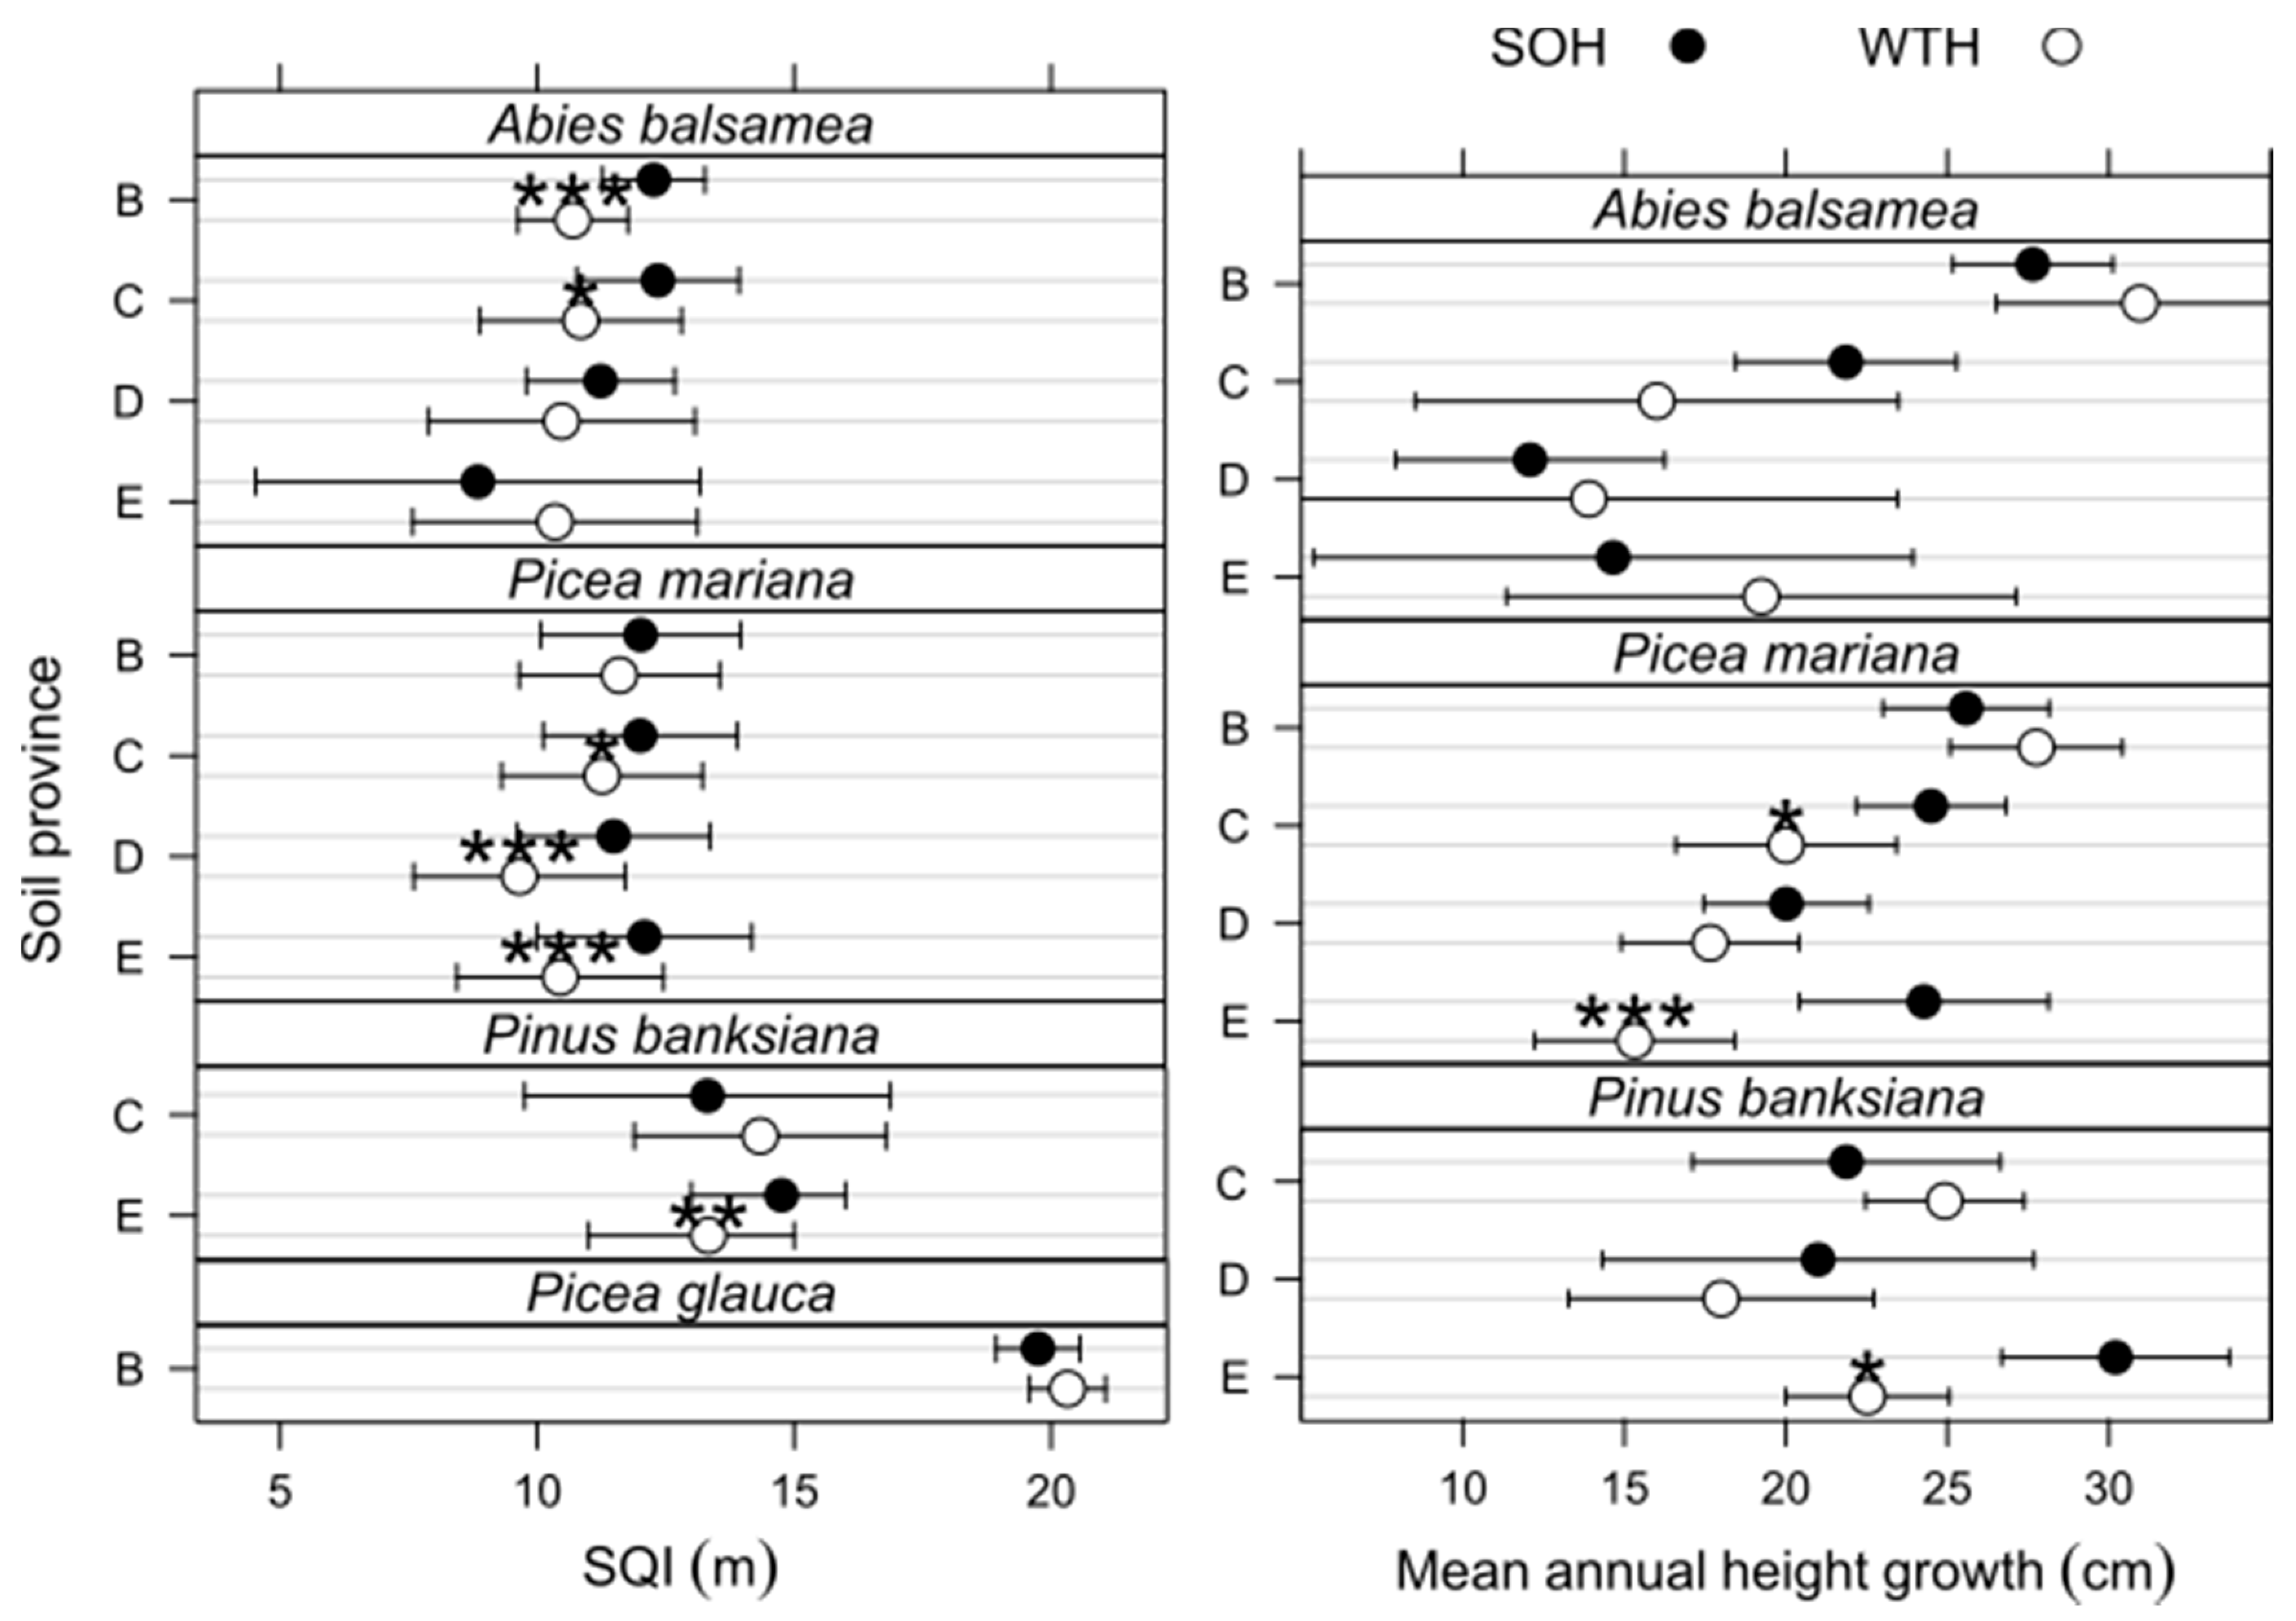
3.4. Site Productivity

The analyses revealed that for most tree species, SQI differed between WTH and SOH sites, but that the differences varied among soil provinces (Figure 4). For Abies balsamea, SQI was 9–20% lower in WTH sites (average: 9.5 ± 0.3 m) than in SOH sites (11.2 ± 0.1 m) in the Appalachians and the Laurentians provinces (p ≤ 0.046), but not in the two others. Picea mariana also had 8% to 22% lower SQIs in WTH sites (average: 10.3 ± 0.3 m) than in SOH sites (12.4 ± 0.1 m) in three of the four soil provinces (Laurentians, Abitibi Lowlands, and Mistassini Highlands; p ≤ 0.014). Picea glauca, which was sampled only in the Appalachians, had similar SQIs in both harvesting treatments (19.9 ± 0.4 m, p = 0.362). For Pinus banksiana, SQI was 14% lower in WTH sites (13.1 ± 0.3 m) than in SOH sites (15.2 ± 0.3 m) in the Mistassini Highlands (p ≤ 0.001), but SQI values were similar for both treatments in the Laurentians soil province (15.1 ± 0.4 m, p = 0.943). Soil C/N ratio was the variable most strongly related to SQI for the three main boreal tree species (Picea mariana, Abies balsamea, and Pinus banksiana) at various soil depths (r = −0.22 to −0.54, p ≤ 0.004; Figure 5). The second soil variable most strongly related to the SQI for Picea mariana and Abies balsamea was the pool of exchangeable acidity in the forest floor (r = −0.28 to −0.32, p ≤ 0.002). None of the studied soil variables were significantly associated with the SQI for Picea glauca at any depth (r ≤ 0.25, p ≥ 0.157).
Mean annual height growth showed greater variability than SQI (Figure 4). For Abies balsamea, despite large variations among and within soil provinces (p = 0.032), no difference was detected between the two harvesting treatments (p = 0.224). For Picea mariana, and only in the two granitic soil provinces (Laurentians and Mistassini Highlands), mean annual height growth was 18 to 37% less in WTH sites than in SOH sites (p ≤ 0.033). For Pinus banksiana, and only in the Mistassini Highlands, mean annual height growth was 25% less in WTH sites (22.5 ± 1.2 m) than in SOH sites (30.2 ± 1.7 m, p = 0.001).
The analysis of BAI also revealed some differences between WTH and SOH sites and among soil provinces (Figure 6). Differences in BAI, all tree species confounded, were only observed in the two granitic soil provinces. Regardless of tree species, BAI growth was less in WTH sites than in SOH sites (p ≤ 0.013), at least after 10 years in the Laurentians, and over the 30-year time span of the study in the Mistassini Highlands. Picea mariana was the main tree species where these differences occurred (see Supplementary Material Figures S4 and S6, p ≤ 0.001). The BAI of Picea mariana and Picea glauca also differed between harvesting treatments in the Appalachians soil province. Tree growth was up to 50% greater for Picea mariana in WTH sites than in SOH sites, and up to 20% less for Picea glauca at some time during the 30 years after harvesting (see Supplementary Material Figure S3, p ≤ 0.003). In the Abitibi Lowlands soil province, BAI growth for Picea mariana seemed less in WTH sites than in SOH sites, but the difference was only marginally significant (see Figure 5 and Supplementary Material Figure S5, p = 0.075). For Abies balsamea, BAI did not differ or was only slightly greater in WTH sites during short periods in all soil provinces (Supplementary Material Figures S3 to S6, p ≥ 0.014).

4. Discussion

4.1. Soil Organic Carbon

Our results showed smaller soil OM and organic C pools in WTH sites as compared to SOH sites, but only in the two granitic soil provinces characterized by a coarser soil texture, even though exported biomass was similar. The differences in OM after 30 years between WTH and SOH sites were apparent both in the top (0–15 cm) and deeper mineral soil layers (15–30 cm and 30–60 cm). Our results are consistent with those in the literature (Achat et al., 2015a). The importance of soil regions with distinct parent materials is highlighted in our analyses as elsewhere [51]. In coarse-textured soils, OM indeed appears to lack protection against decomposition in the mineral soil layers, partly because of their low silt and clay content. Physical protection of OM through microaggregation induced by clay minerals is a major mechanism of OM stabilization in soils [52]. In acidic forest soils such as those found in the two granitic soil provinces, soil OM is associated with minerals mainly by sorption to poorly crystalline Fe and Al oxides [53]. In some WTH sites of Quebec, upper soil layers with a coarse texture were still influenced by harvest treatment after 15 to 20 years, as shown by their lower organic C concentrations compared to SOH sites [54]. Fifteen years after WTH in a northern hardwood stand with a coarse-loamy texture at the Hubbard Brook Experimental Forest in New Hampshire, mineral soil C pools had decreased by 15%, and this decline mostly occurred at depths greater than 10 cm [55]. Ten years after repeated WTH in Finland on a sandy loam soil, total C and N pools in the combined organic and mineral soil layer were smaller than in the SOH treatment [56]. In general, SOH leads to an increase of soil OM pools at mid-soil depth as compared to non-harvested sites, while WTH does the opposite [57]. Therefore, the differences in soil OM and C pools between WTH and SOH sites that we observed in the deeper soil layers of the two granitic soil provinces can be attributed, at least in part, to an increase of these pools in SOH sites and a loss in WTH sites.
In the Appalachians and Abitibi Lowlands soil provinces, soil OM and organic C pools were not related to harvesting treatments. Thus, the fine-textured of soils may have helped to promote OM and C stabilization against disturbances in the mineral layers. However, in the Abitibi Lowlands, forest floor OM and C organic pools were found to be larger in WTH sites than in SOH sites; this seems counterintuitive, given the amount of biomass left on the ground by SOH operations. Our results suggest that WTH operations favored a greater accumulation of OM on the ground by sphagnum mosses than did SOH. This process, known to occur in the cold and humid conditions that are widespread in this flat soil province, favors the accumulation of organic matter over mineral soil after the tree canopy is cleared by harvesting operations or low-severity fires [58]. In this region, forest harvesting may lead to soil moisture saturation that can inhibit decomposition of OM in coniferous forests [59]. Our results also suggest that in all studied soil provinces, the higher C/N ratio (by 12% on average) in the forest floor of WTH sites has a negative impact on the quality of OM in this layer. As well, in the Mistassini Highlands, higher C/N ratios were found in all the mineral soil layers of WTH sites, as compared with SOH. An average increase of 2% of the C/N ratio in the forest floor of WTH sites was reported in a meta-analysis [12]. However, these researchers reported no major effect of WTH on the C/N ratio at various mineral soil depths.

4.2. Soil Nitrogen

Some general trends also emerged from our analysis regarding soil N pools 30 years after harvesting. In the two granitic soil provinces total N pool was smaller by 1.6 to 2.2 Mg·ha−1 (−25 to −45%) in WTH sites as compared with SOH sites. The additional amount of N exported by WTH was estimated at 150 ± 10 kg·ha−1. Therefore, N losses can be attributed not only to the greater N export in the biomass by WTH, but also to leaching as suggested by the smaller mineral soil N pools with WTH in the two granitic soil provinces. The disturbance caused by forest harvesting leads to an increase in soil temperature, OM decomposition, and N mineralization. Sites harvested by WTH 12 years ago showed increased nitrification in the forest floor compared to unharvested sites located on an esker in the boreal forest in Ontario [60]. Nitrate is much more prone to leaching than ammonium in soils. The mineral soil N pool also decreased significantly by 14% over 15 years in a northern hardwood forest on coarse-loamy soil [55], likely due to increased nitrification. These observations all suggest that WTH significantly reduces soil N pool in coarse-textured soils and not on more fine-textured soils.

4.3. Soil Acidification

Signs of acidification were observed 30 years after WTH in some soil provinces. Lower BS and higher levels of exchangeable Al, exchangeable Fe, and exchangeable acidity were measured after WTH in the forest floor of the Abitibi Lowlands, consistent with the levels of mineralomass exports. These results are also consistent with those of Achat, Deleuze, Landmann, Pousse, Ranger, and Augusto [12], who reported lower BS (−8.4%) in the forest floor for WTH sites compared to SOH sites. However, no sign of acidification was found in the mineral soil layers of the Abitibi Lowlands. On the contrary, in the two granitic soil provinces, BS increased and other acidity indicators decreased in the mineral soil after WTH as compared with SOH. The increased soil acidification after SOH may have been caused by accumulated OM and C that migrated as dissolved organic carbon from the decomposing harvesting residues [61]. Base cation pools did not appear to decrease in soils after WTH as compared to SOH, with the exception of the smaller exchangeable K pool in the upper mineral soil layer after WTH in the Abitibi Lowlands. These results contradict another report of lower values of CEC (−9.9%) and BS (−17.4%) in the top mineral soil layers (<20 cm depth) in WTH sites than in SOH sites [12]. Mineral soil base cation pools may have been replenished through soil chemical weathering and conserved through decreased base cation uptake by the slower-growing secondary forest succession following WTH, as suggested by the tree growth analyses.

4.4. Specificity of Stand Response to Increased Biomass Harvesting

The lower site productivity observed after WTH in the two granitic soil provinces (the Laurentians and the Mistassini Highlands) can be attributed at least in part to the smaller N pools and higher C/N ratios 30 years after harvesting. Evidence from the Scandinavian countries showed that WTH could result in growth reductions attributable to N loss from logging residue exports [8,62]. After 31 years, the overall growth of Norway spruce stands in northern Sweden was still negatively affected by WTH compared to SOH, but this growth loss resulted only from a significant but temporary reduction in site productivity on WTH plots over a five-year period (at stand age of 8–12 years) [63]. This temporary reduction was also attributed to the N losses through biomass exportation, which hindered N nutrition for second-rotation trees during the first decade. Impaired N (or P) nutrition on WTH sites has been shown to reduce tree growth for at least 20 years in some stands [5].

4.5. Management and Policy Implications

In this study, we found that soil chemistry, site productivity, and tree growth responded differently to WTH as compared to SOH, and that the responses varied among soil provinces. Although soil base cation pools may have been reduced by WTH, the main soil properties influenced by WTH were OM, C, and N pools and C/N ratio. The current forest sustainability policy framework in Quebec relies only on soil acidification criteria to classify soil sensitivity to biomass harvesting. It targets forest ecological types that correspond to some site attributes found in this study (coarse-textured, thin, or organic soils) [64]. However, it should also take into account the findings obtained in the present study by using regional soil characteristics in a manner that is more specific than soil classification. For instance, WTH did not have the same impact on soil chemistry, site productivity and tree growth in the Appalachians as in the neighboring Laurentians, although both soil provinces have mainly Podzols. Furthermore, contrary to our findings of lower SQIs after 30 years in the two granitic soil provinces with coarser soils, [18] found no evidence after 20 years that more infertile sandy sites in neighboring Ontario were more sensitive to increased biomass exports. Such examples of diverging results call for a better knowledge of forest soils in terms of fertility and resilience to biomass harvesting.
This study shows that 30 years after treatment, the amount of OM varies significantly in the mineral soil down to a depth of 60 cm in the two granitic soil provinces with coarse-textured soils (the Laurentians and the Mistassini Highlands). On average, the difference between WTH and SOH sites regarding OM in these two soil provinces (−96 ± 28 Mg OM ha1) was equivalent to 4.5 times the difference in estimated exported biomass (+21 ± 4 Mg OM ha1). Therefore, the amount of C used as bioenergy from exported OM cannot compensate alone for the loss of C in the mineral soil. Furthermore, the decrease in site productivity in WTH sites should further worsen the situation after 30 years. It is clear that WTH in these two soil provinces is not a winning solution for decarbonizing energy uses. It remains to be seen whether the decreases in SQI and tree growth following WTH, associated with the increase in soil C/N ratio in these soil provinces, are transient or persistent, perhaps even throughout the entire life of the forest stands.
In the two other soil provinces with more fine-textured soils (the Appalachians and Abitibi Lowlands), biomass harvesting may result in an even or positive OM and C balance. Mineral soil OM and C did not appear associated with harvesting methods, and no decrease in mineral C/N ratio was observed. However, the cause of the observed decreases in SQI following WTH for these two soil provinces need further investigation.

5. Conclusions

Forest biomass is becoming more and more available for energy production in eastern North America. The development of this resource requires guidelines to remain sustainable. Our hypothesis that forest stands subjected to whole-tree harvesting in the past now displayed smaller nutrient pools and less desirable soil composition than those subjected to stem-only harvesting is supported. Our study indicates that after 30 years, biomass exportation through whole-tree harvesting had negative impacts mainly on soil OM, C, and N pools and soil C/N ratio from the forest floor down to 60 cm in the mineral soil. Our hypothesis that site productivity was also negatively affected by whole-tree harvesting is supported by our observations. However, the magnitude of these changes strongly varied among soil provinces. Greater effects were observed in the two granitic soil provinces (Laurentians and Mistassini Highlands), which have a coarser soil texture: for these, SQI, height growth, and BAI were all lower in WTH sites than in SOH sites. The Appalachians was the soil province where soils of WTH and SOH sites differed the least, as shown by similar tree growth, particularly for Picea glauca and Picea mariana. In general, SQI was negatively related to the soil C/N ratio. Sensitivity to biomass exportation by WTH was greatest in the two granitic soil provinces, followed by the Abitibi Lowlands and the Appalachians. The specificity of soils must be recognized when developing forest sustainability criteria and policies on forest biomass harvesting and proper silviculture in order to protect soil fertility and to maintain soil carbon reserves.

Supplementary Materials

The following are available online at https://0-www-mdpi-com.brum.beds.ac.uk/article/10.3390/f12050583/s1, Figure S1. Relationship between soil bulk density (Db) and organic matter (OM) concentration according to great soil texture groups. Lines show model predicted values and 95% confidence interval predictions, Figure S2. Expected tree height as a function of tree age (at DBH height) for various site quality index (SQI) values. Data is derived from the models of Pothier and Savard [45] for Picea mariana, Abies balsamea, and Pinus banksiana, and of Prégent [46] for Picea glauca, Figure S3. Left panels: Predicted basal area increment (BAI) of individual regenerating tree species (ABA = Abies balsamea, PIM = Picea mariana, PIG = Picea glauca) over time after harvesting treatment (stem-only harvesting [SOH] and whole-tree harvesting [WTH]) in the soil province B (Appalachians). Data presented are model averages (lines) and simultaneous 95th centile confidence intervals (bands) (95% CI). Numbers of samples are displayed for each treatment. Right panels: Estimated difference in BAI (log values, simultaneous 95% CI) between WTH and SOH (WTH minus SOH) smoothed curves. Periods during which treatments differ significantly are highlighted with a red line on the X axis, Figure S4. Left panels: Predicted basal area increment (BAI) of individual regenerating tree species (ABA = Abies balsamea, PIM = Picea mariana, PIB = Pinus banksiana) over time after harvesting treatment (stem-only harvesting [SOH] and whole-tree harvesting [WTH]) in the soil province C (Laurentians). Data presented are model averages (lines) and simultaneous 95th centile confidence intervals (bands) (95% CI). Numbers of samples are displayed for each treatment. Right panels: Estimated difference in BAI (log values, simultaneous 95% CI) between WTH and SOH (WTH minus SOH) smoothed curves. Periods during which treatments differ significantly are highlighted with a red line on the X axis, Figure S5. Left panels: Predicted basal area increment (BAI) of individual regenerating tree species (ABA = Abies balsamea, PIM Picea mariana) over time after harvesting treatment (stem-only harvesting [SOH] and whole-tree harvesting [WTH]) in the soil province D (Abitibi Lowlands). Data presented are model averages (lines) and simultaneous confidence 95th centile intervals (bands) (95% CI). Numbers of samples are displayed for each treatment. Right panels: Estimated difference in BAI (log values, simultaneous 95% CI) between WTH and SOH (WTH minus SOH) smoothed curves. Periods during which treatments differ significantly are highlighted with a red line on the X axis, Figure S6. Left panels: Predicted basal area increment (BAI) of individual regenerating tree species (ABA = Abies balsamea, PIM = Picea mariana, PIB = Pinus banksiana) over time after harvesting treatment (stem-only harvesting [SOH] and whole-tree harvesting [WTH]) in the soil province E (Mistassini Highlands). Data presented are model averages (lines) and simultaneous 95th centile confidence intervals (bands) (95% CI). Numbers of samples are displayed for each treatment. Right panels: Estimated difference in BAI (log values, 95% CI) between WTH and SOH (WTH minus SOH) smoothed curves. Periods during which treatments differ significantly are highlighted with a red line on the X axis, Table S1. Forest stand average composition in major tree species (percentage of merchantable stand basal area) prior to harvesting, and merchantable basal area (means ± standard deviation [SD]), Table S2. Characteristics of the trees measured for site quality index evaluation at the time of soil sampling. Data presented are means ± SD, Table S3. Parameter estimates of the relationship between soil bulk density (Db) and organic matter (OM) concentration according to great soil texture groups. No significant difference was found between the Sand and the Loam model (F = −1.34, p = 1), so these data were fused. Table S4. Estimated biomass and mineralomass left on the ground after stem-only harvesting (SOH) in the 4 soil provinces, based on tree surveys before harvesting. Data presented are model adjusted means ± standard errors. Within columns, means with the same letters are not different at p = 0.05.

Author Contributions

R.O., L.D. and S.T. conceptualization, methodology; R.O., L.D. and S.T. field data collection; R.O. statistical analyses, preparation of results; R.O. writing—original draft preparation; R.O., L.D. and S.T. writing—review and editing; R.O. supervision, funding acquisition. All authors have read and agreed to the published version of the manuscript.

Funding

This research was funded by the Ministère des Forêts, de la Faune et des Parcs du Québec (projects No. 142332122 and 142332057) as well as by Quebec’s Fonds vert.

Institutional Review Board Statement

Not applicable.

Informed Consent Statement

Not applicable.

Data Availability Statement

The data presented in this study are available on request from the corresponding author.

Acknowledgments

We would like to thank our predecessors who set up the long-term sites; Simon Marcouiller, Jean-Philippe Mottard, Benoît Toussaint, Jacques Martineau, and several summer students who assisted in the field campaigns and sample preparation; the personnel of the inorganic and organic chemical laboratory of the Direction de la recherche forestière; and Denise Tousignant for English editing of the manuscript.

Conflicts of Interest

The authors declare no conflict of interest. The funders had no role in the design of the study or in the collection, analyses, or interpretation of data.

References

  1. Rogelj, J.; Shindell, D.; Jiang, K.; Fifita, S.; Forster, P.; Ginzburg, V.; Handa, C.; Kheshgi, H.; Kobayashi, S.; Kriegler, E.; et al. Mitigation pathways compatible with 1.5 °C in the context of sustainable development. In Global Warming of 1.5 °C. An IPCC Special Report on the Impacts of Global Warming of 1.5 °C Above Pre-Industrial Levels and Related Global Greenhouse Gas Emission Pathways, in the Context of Strengthening the Global Response to the Threat of Climate Change, Sustainable Development, and Efforts to Eradicate Poverty; Masson Delmotte, V., Zhai, P., Pörtner, H.O., Roberts, D., Skea, J., Shukla, P.R., Pirani, A., Eds.; 2018; pp. 93–174. Available online: https://www.ipcc.ch/sr15/chapter/chapter-2/ (accessed on 7 April 2021).
  2. Delisle, J.F. Ressources et Industries Forestières du Québec. Portrait Statistique 2018; Ministère des Forêts, de la Faune et des Parcs: Québec, QC, Canada, 2019; p. 132.
  3. Beauregard, R.; Lavoie, P.; Thiffault, É.; Ménard, I.; Moreau, L.; Boucher, J.; François; Robichaud, F. Rapport du Groupe de Travail sur la Forêt et les Changements Climatiques; Ministère des Forêts, de la Faune et des Parcs: Québec, QC, Canada, 2019; p. 53.
  4. Thiffault, E.; Paré, D.; Brais, S.; Titus, B.D. Intensive biomass removals and site productivity in Canada: A review of relevant issues. For. Chron. 2010, 86, 36–42. [Google Scholar] [CrossRef] [Green Version]
  5. Thiffault, E.; Hannam, K.D.; Paré, D.; Titus, B.D.; Hazlett, P.W.; Maynard, D.G.; Brais, S. Effects of forest biomass harvesting on soil productivity in boreal and temperate forests—A review. Environ. Rev. 2011, 19, 278–309. [Google Scholar] [CrossRef]
  6. Marshall, V.G. Impacts of forest harvesting on biological processes in northern forest soils. For. Ecol. Manag. 2000, 133, 43–60. [Google Scholar] [CrossRef]
  7. Wall, A.; Hytönen, J. The long-term effects of logging residue removal on forest floor nutrient capital, foliar chemistry and growth of a Norway spruce stand. Biomass Bioenergy 2011, 35, 3328–3334. [Google Scholar] [CrossRef]
  8. Helmisaari, H.-S.; Hanssen, K.H.; Jacobson, S.; Kukkola, M.; Luiro, J.; Saarsalmi, A.; Tamminen, P.; Tveite, B. Logging residue removal after thinning in Nordic boreal forests: Long-term impact on tree growth. For. Ecol. Manag. 2011, 261, 1919–1927. [Google Scholar] [CrossRef]
  9. Grigal, D.F. Effects of extensive forest management on soil productivity. Forest Ecol. Manag. 2000, 138, 167–185. [Google Scholar] [CrossRef]
  10. Wall, A. Risk analysis of effects of whole-tree harvesting on site productivity. For. Ecol. Manag. 2012, 282, 175–184. [Google Scholar] [CrossRef]
  11. Jerabkova, L.; Prescott, C.E.; Titus, B.D.; Hope, G.D.; Walters, M.B. A meta-analysis of the effects of clearcut and variable-retention harvesting on soil nitrogen fluxes in boreal and temperate forests. Can. J. For. Res. 2011, 41, 1852–1870. [Google Scholar] [CrossRef]
  12. Achat, D.L.; Deleuze, C.; Landmann, G.; Pousse, N.; Ranger, J.; Augusto, L. Quantifying consequences of removing harvesting residues on forest soils and tree growth-A meta-analysis. For. Ecol. Manag. 2015, 348, 124–141. [Google Scholar] [CrossRef]
  13. Ranius, T.; Hämäläinen, A.; Egnell, G.; Olsson, B.; Eklöf, K.; Stendahl, J.; Rudolphi, J.; Sténs, A.; Felton, A. The effects of logging residue extraction for energy on ecosystem services and biodiversity: A synthesis. J. Environ. Manag. 2018, 209, 409–425. [Google Scholar] [CrossRef]
  14. Brandtberg, P.-O.; Olsson, B.A. Changes in the effects of whole-tree harvesting on soil chemistry during 10years of stand development. For. Ecol. Manag. 2012, 277, 150–162. [Google Scholar] [CrossRef]
  15. Zetterberg, T.; Olsson, B.A.; Löfgren, S.; Hyvönen, R.; Brandtberg, P.O. Long-term soil calcium depletion after conventional and whole-tree harvest. For. Ecol. Manag. 2016, 369, 102–115. [Google Scholar] [CrossRef]
  16. Johnson, C.E.; Johnson, A.H.; Huntington, T.G.; Siccama, T.G. Whole-tree clear-cutting effects on soil horizons and organic-matter pools. Soil Sci. Soc. Am. J. 1991, 55, 497–502. [Google Scholar] [CrossRef]
  17. Olsson, B.A.; Bengtsson, J.; Lundkvist, H. Effects of different forest harvest intensities on the pools of exchangeable cations in coniferous forest soils. For. Ecol. Manag. 1996, 84, 135–147. [Google Scholar] [CrossRef]
  18. Morris, D.M.; Hazlett, P.W.; Fleming, R.L.; Kwiaton, M.M.; Hawdon, L.A.; Leblanc, J.D.; Primavera, M.J.; Weldon, T.P. Effects of biomass removal levels on soil carbon and nutrient reserves in conifer-dominated, coarse-textured sites in Northern Ontario: 20-year results. Soil Sci. Soc. Am. J. 2019, 83, S116–S132. [Google Scholar] [CrossRef] [Green Version]
  19. Tamminen, P.; Saarsalmi, A. Effects of whole-tree harvesting on growth of pine and spruce seedlings in southern Finland. Scand. J. For. Res. 2013, 28, 559–565. [Google Scholar] [CrossRef]
  20. Abbas, D.; Current, D.; Phillips, M.; Rossman, R.; Hoganson, H.; Brooks, K.N. Guidelines for harvesting forest biomass for energy: A synthesis of environmental considerations. Biomass Bioenergy 2011, 35, 4538–4546. [Google Scholar] [CrossRef]
  21. Clarke, N.; Gundersen, P.; Jönsson-Belyazid, U.; Kjønaas, O.J.; Persson, T.; Sigurdsson, B.D.; Stupak, I.; Vesterdal, L. Influence of different tree-harvesting intensities on forest soil carbon stocks in boreal and northern temperate forest ecosystems. For. Ecol. Manag. 2015, 351, 9–19. [Google Scholar] [CrossRef]
  22. MFFP. Guide to the Application of the Regulation Respecting the Sustainable Development of Forest in the Domain of the State; Gouvernement du Québec, Ministère des Forêts, de la Faune et des Parcs: Québec, QC, Canada, 2020; p. 301.
  23. Lisowska Mieszkowska, E. UNECE convention on long-range transboundary air pollution–40 years of action for cleaner air. Ekonomia Środowisko 2020, 1, 168–179. [Google Scholar]
  24. de Oliveira Garcia, W.; Amann, T.; Hartmann, J. Increasing biomass demand enlarges negative forest nutrient budget areas in wood export regions. Sci. Rep. 2018, 8, 5280. [Google Scholar] [CrossRef]
  25. Akselsson, C.; Belyazid, S. Critical biomass harvesting–Applying a new concept for Swedish forest soils. For. Ecol. Manag. 2018, 409, 67–73. [Google Scholar] [CrossRef] [Green Version]
  26. Paré, D.; Thiffault, E. Nutrient budgets in forests under increased biomass harvesting scenarios. Curr. For. Rep. 2016, 2, 81–91. [Google Scholar] [CrossRef] [Green Version]
  27. James, J.; Harrison, R. The effect of harvest on forest soil carbon: A meta-analysis. Forests 2016, 7, 308. [Google Scholar] [CrossRef]
  28. Bowd, E.J.; Banks, S.C.; Strong, C.L.; Lindenmayer, D.B. Long-term impacts of wildfire and logging on forest soils. Nat. Geosci. 2019, 12, 113–118. [Google Scholar] [CrossRef]
  29. Lamontagne, L.; Nolin, M.C. Cadre Pédologique de Référence Pour la Corrélation Des Sols; Équipe pédologique du Québec, Centre de Recherche et de Développement sur les Sols et les Grandes Cultures, Agriculture et Agroalimentaire Canada: Sainte-Foy, QC, Canada, 1997; p. 69. [Google Scholar]
  30. Soil Classification Working Group. The Canadian System of Soil Classification, 3rd ed.; Agriculture and Agri-Food Canada: Ottawa, ON, Canada, 1998; p. 187.
  31. New, M.; Lister, D.; Hulme, M.; Makin, I. A high-resolution data set of surface climate over global land areas. Clim. Res. 2002, 21, 1–25. [Google Scholar] [CrossRef] [Green Version]
  32. Trabucco, A.; Zomer, R. Global Aridity Index and Potential Evapotranspiration (ET0) Climate Database v2; CGIAR-CSI: 2019; Available online: https://cgiarcsi.community/2019/01/24/global-aridity-index-and-potential-evapotranspiration-climate-database-v2 (accessed on 7 April 2021).
  33. Pothier, D. Évolution de la régénération après la coupe de peuplements récoltés selon différents procédés d’exploitation. For. Chron. 1996, 72, 519–527. [Google Scholar] [CrossRef] [Green Version]
  34. Saucier, J.P.; Berger, J.P.; D’Avignon, H.; Racine, P. Le Point D’observation Écologique: Normes Techniques; Service des Inventaires Forestiers, Direction de la Gestion des Stocks Forestiers, Ministère des Ressources Naturelles du Québec: Québec, QC, Canada, 1994; p. 116.
  35. Stokes, M.A.; Smiley, T.L. An Introduction to Tree-Ring Dating; University of Chicago Press: Chicago, IL, USA, 1968; p. 110. [Google Scholar]
  36. Yamaguchi, D.K. A simple method for cross-dating increment cores from living trees. Can. J. For. Res. 1991, 21, 414–416. [Google Scholar] [CrossRef]
  37. Fritts, H.C. Tree Rings and Climate; Blackburn Press: Caldwell, NC, USA, 2001. [Google Scholar]
  38. Grissino Mayer, H.D. Evaluating crossdating accuracy: A manual and tutorial for the computer program COFECHA. Tree Ring Res. 2001, 57, 205–221. [Google Scholar]
  39. Bunn, A.G. A dendrochronology program library in R (dplR). Dendrochronologia 2008, 26, 115–124. [Google Scholar] [CrossRef]
  40. R Core Team. R: A Language and Environment for Statistical Computing; R Foundation for Statistical Computing: Vienna, Austria, 2020. [Google Scholar]
  41. Duchesne, L.; Ouimet, R.; Morneau, C. Assessment of sugar maple health based on basal area growth pattern. Can. J. For. Res. 2003, 33, 2074–2080. [Google Scholar] [CrossRef]
  42. Paré, D.; Bernier, P.; Lafleur, B.; Titus, B.D.; Thiffault, E.; Maynard Doug, G.; Guo, X. Estimating stand-scale biomass, nutrient contents, and associated uncertainties for tree species of Canadian forests. Can. J. For. Res. 2013, 43, 599–608. [Google Scholar] [CrossRef]
  43. Federer, C.A.; Turcotte, D.E.; Smith, C.T. The organic fraction-bulk density relationship and the expression of nutrient content in forest soils. Can. J. For. Res. 1993, 23, 1026–1032. [Google Scholar] [CrossRef]
  44. Beaudette, D.E.; Roudier, P.; O’Geen, A.T. Algorithms for quantitative pedology: A toolkit for soil scientists. Comput. Geosci. 2013, 52, 258–268. [Google Scholar] [CrossRef]
  45. Pothier, D.; Savard, F. Actualisation des Tables de Production Pour les Principales Espèces Forestière du Québec; Gouvernement du Québec. Ministère des Ressources naturelles: Québec, QC, Canada, 1998; p. 183.
  46. Prégent, G.; Picher, G.; Auger, I. Tarif de Cubage, Tables de Rendement et Modèles de Croissance Pour les Plantations D’épinette Blanche au Québec; Mémoire de recherche forestière n° 160; Direction de la Recherche Forestière, Ministère des Ressources et de la Faune du Québec: Québec, QC, Canada, 2010; p. 73.
  47. Lenth, R. Emmeans: Estimated Marginal Means, Aka Least-Squares Means; R Package Version 1.4.2; 2019; Available online: https://CRAN.R-project.org/package=emmeans (accessed on 7 April 2021).
  48. Pinheiro, J.; Bates, D.; DebRoy, S.; Sarkar, D.; R Core Team. Nlme: Linear and Nonlinear Mixed Effects Models; R Package Version 3.1-150; 2020; Available online: https://CRAN.R-project.org/package=nlme (accessed on 7 April 2021).
  49. Wood, S.N. Mgcv: Mixed GAM Computation Vehicle with Automatic Smoothness Estimation (Version 1.8-22); 2017; Available online: https://CRAN.R-project.org/package=mgcv (accessed on 7 April 2021).
  50. Van Rij, J.; Wieling, M.; Baayen, R.H.; Van Rijn, H. Itsadug: Interpreting time series and autocorrelated data using GAMMs. R Package Version 2017, 2. Available online: https://CRAN.R-project.org/package=itsadug (accessed on 7 April 2021).
  51. Pichler, V.; Gömöryová, E.; Leuschner, C.; Homolák, M.; Abrudan, I.V.; Pichlerová, M.; Střelcová, K.; Di Filippo, A.; Sitko, R. Parent material effect on soil organic carbon concentration under primeval european beech forests at a regional scale. Forests 2021, 12, 405. [Google Scholar] [CrossRef]
  52. Hassink, J. The capacity of soils to preserve organic C and N by their association with clay and silt particles. Plant Soil 1997, 191, 77–87. [Google Scholar] [CrossRef]
  53. Spielvogel, S.; Prietzel, J.; Kögel-Knabner, I. Soil organic matter stabilization in acidic forest soils is preferential and soil type-specific. Eur. J. Soil Sci. 2008, 59, 674–692. [Google Scholar] [CrossRef]
  54. Thiffault, E.; Paré, D.; Bélanger, N.; Munson, A.D.; Marquis, F. Harvesting intensity at clear-felling in the boreal forest: Impact on soil and foliar nutrient status. Soil Sci. Soc. Am. J. 2006, 70, 691–701. [Google Scholar] [CrossRef]
  55. Hamburg, S.P.; Vadeboncoeur, M.A.; Johnson, C.E.; Sanderman, J. Losses of mineral soil carbon largely offset biomass accumulation 15 years after whole-tree harvest in a northern hardwood forest. Biogeochemistry 2019, 144, 1–14. [Google Scholar] [CrossRef]
  56. Kaarakka, L.; Tamminen, P.; Saarsalmi, A.; Kukkola, M.; Helmisaari, H.-S.; Burton, A.J. Effects of repeated whole-tree harvesting on soil properties and tree growth in a Norway spruce (Picea abies (L.) Karst.) stand. For. Ecol. Manag. 2014, 313, 180–187. [Google Scholar] [CrossRef]
  57. Achat, D.L.; Fortin, M.; Landmann, G.; Ringeval, B.; Augusto, L. Forest soil carbon is threatened by intensive biomass harvesting. Sci. Rep. 2015, 5, 15991. [Google Scholar] [CrossRef]
  58. Fenton, N.; Lecomte, N.; Légaré, S.; Bergeron, Y. Paludification in black spruce (Picea mariana) forests of eastern Canada: Potential factors and management implications. For. Ecol. Manag. 2005, 213, 151–159. [Google Scholar] [CrossRef]
  59. Prescott, C.; Maynard, D.; Laiho, R. Humus in northern forests: Friend or foe? For. Ecol. Manage 2000, 133, 23–36. [Google Scholar] [CrossRef]
  60. Hazlett, P.W.; Gordon, A.M.; Voroney, R.P.; Sibley, P.K. Impact of harvesting and logging slash on nitrogen and carbon dynamics in soils from upland spruce forests in northeastern Ontario. Soil Biol. Biochem. 2007, 39, 43–57. [Google Scholar] [CrossRef] [Green Version]
  61. Kalbitz, K.; Glaser, B.; Bol, R. Clear-cutting of a Norway spruce stand: Implications for controls on the dynamics of dissolved organic matter in the forest floor. Eur. J. Soil Sci. 2004, 55, 401–413. [Google Scholar] [CrossRef]
  62. Jacobson, S.; Kukkola, M.; Mälkönen, E.; Tveite, B. Impact of whole-tree harvesting and compensatory fertilization on growth of coniferous thinning stands. For. Ecol. Manag. 2000, 129, 41–51. [Google Scholar] [CrossRef]
  63. Egnell, G. Is the productivity decline in Norway spruce following whole-tree harvesting in the final felling in boreal Sweden permanent or temporary? For. Ecol. Manag. 2011, 261, 148–153. [Google Scholar] [CrossRef]
  64. Ouimet, R.; Duchesne, L. Évaluation des Types Écologiques Forestiers Sensibles à L’appauvrissement Des sols en Minéraux par la Récolte de Biomasse; Rapport hors Série; Direction de la Recherche Forestière, Ministère des Ressources Naturelles et de la Faune: Québec, QC, Canada, 2009; p. 25.
Figure 1. Map of sampling plot locations. Colored areas show the soil provinces of Quebec (Canada). Green lines delimit vegetation bioclimatic domains: SM-NH: sugar maple northern hardwoods; BF-YB: balsam fir–yellow birch domain; BF-WB: balsam fir–white birch domain; BS-FM: black spruce–feather moss domain.
Forests 12 00583 g001
Figure 2. Soil organic matter (OM), organic carbon (C), and total nitrogen (N) pools as a function of depth, harvesting treatment (stem-only harvesting (SOH) and whole-tree harvesting (WTH)) in four soil provinces of Quebec: B = Appalachians; C = Laurentians; D = Abitibi Lowlands; E = Mistassini Highlands. FF = forest floor. Data presented are model-adjusted means ± 95% confidence intervals. Asterisks indicate significant differences between harvesting treatments within a given soil province: * p ≤ 0.05, ** p ≤ 0.01, *** p ≤ 0.001.
Forests 12 00583 g002
Figure 3. Organic matter (OM), organic total carbon (C), and total nitrogen (N) pools in the first 60 cm of soil (forest floor excluded) as a function of harvesting treatment (stem-only harvesting (SOH) and whole-tree harvesting (WTH)) in four soil provinces of Quebec: B = Appalachians; C = Laurentians; D = Abitibi Lowlands; E = Mistassini Highlands. Data presented are model-adjusted means ± 95% confidence intervals. Asterisks indicate significant differences between harvesting treatments within a given soil province: * p ≤ 0.05, ** p ≤ 0.01, *** p ≤ 0.001.
Forests 12 00583 g003
Figure 4. Site quality index (SQI) and mean annual height growth of various tree species as a function of harvesting treatment (stem-only harvesting (SOH) and whole-tree harvesting (WTH)) in four soil provinces of Quebec: B = Appalachians; C = Laurentians; D = Abitibi Lowlands; E = Mistassini Highlands. Data presented are model-adjusted means ± 95% confidence intervals. Asterisks indicate significant differences between harvesting treatments within a given soil province: * p ≤ 0.05, ** p ≤ 0.01, *** p ≤ 0.001.
Forests 12 00583 g004
Figure 5. Relationship between site quality index (SQI, height, in m at age 50 years) and the C/N ratio in the forest floor and at various soil depths for Picea mariana (PIM), Abies balsamea (ABA), and Pinus banksiana (PIB). Asterisks indicate significant values of r: * p ≤ 0.05, ** p ≤ 0.01, *** p ≤ 0.001.
Forests 12 00583 g005
Figure 6. Left panels: Predicted basal area increment (BAI) of regenerating trees (all species confounded) over time after harvesting treatment (stem-only harvesting (SOH) and whole-tree harvesting (WTH)) in four soil provinces of Quebec: B = Appalachians; C = Laurentians; D = Abitibi Lowlands; E = Mistassini Highlands. Data presented are model averages (lines) and simultaneous confidence intervals (bands) (± 95 % CI). Right panels: Estimated difference in BAI (log values, simultaneous ± 95% CI) between WTH and SOH (WTH minus SOH) smoothed curves. Periods during which treatments differ significantly are highlighted with a red line on the X axis.
Forests 12 00583 g006
Table 1. Characteristics of the four soil provinces of Quebec included in the study.
PropertiesSoil Province
B (Appalachians)C (Laurentians)D (Abitibi Lowlands)E (Mistassini Highlands)
Main parent materialGlacial till or regolith made of sedimentary and metamorphic rockGlacial till made of igneous and metamorphic rocks of the Canadian ShieldExtensive glaciolacustrine clay deposit, glaciofluvial sand, and gravel deposits over clayGlacial till made of igneous, metamorphic, and volcanic rock
GeologySandstone, siltstone, shale, slateGranite, gneissInterlayered claysGranite, gneiss
Soils *Brunisols to PodzolsPodzolsGleysoils, Gleyic Podzols to PodzolsPodzols
Soil textureMedium (loam)Coarse (sand to sandy loam)Fine
(clay or silt)
Coarse
(sand to sandy loam)
Altitude (m)180–1300180–120030–525300–600
TopographyAlternating ridgelines and valleysRounded mountains, overgrown valleysLow-shield terraneRounded hills and valleys
January temperature
(IQR, °C)
−2.9–−14.1−16.0–−18.4−17.3–−18.6−17.8–−18.5
July temperature
(IQR, °C)
16.1–17.215.8–16.816.3–16.816.2–16.5
Annual precipitations
(IQR, mm)
1054–1113964–1067891–919913–952
Degree-days (IQR)1180–1350950–12901030–1190990–1110
Aridity index
(IQR)
1.41–1.641.34–1.521.19–1.261.27–1.33
Nb. frost-free days (d)150140140142
VegetationMixed forest to balsam fir–white birch forestBalsam fir–white birch to black spruce–feather moss forestBalsam fir–white birch to black spruce–feather moss forestBlack spruce–feather moss forest
* Soil orders according to the Canadian System of Soil Classification [30]. 1961–1990 annual interquartile range (IQR) or average between 47° and 50° of latitude computed from New, et al. [31]. 1970–2000 aridity index interquartile range (IQR) between 47° and 50° of latitude computed from Trabucco and Zomer [32].
Table 2. Estimated exported biomass and mineralomass, by harvesting treatment (SOH: stem-only harvesting, WTH: whole-tree harvesting) in four soil provinces of Quebec. Data presented are model-adjusted means ± standard errors. Values in bold italics indicate cases where there is NO significant difference between SOH and WTH within a given soil province (p > 0.05). In all other cases, values for SOH and WTH within a given soil province are significantly different from one another (p ≤ 0.05).
Soil
Province *
Harvesting TreatmentnBiomassNPKCaMg
(Mg·ha−1)(kg·ha−1)
BSOH3982 ± 5112 ± 1012 ± 183 ± 6167 ± 1521 ± 2
WTH25138 ± 6399 ± 1350 ± 2228 ± 8472 ± 1962 ± 2
CSOH3970 ± 594 ± 1011 ± 163 ± 6182 ± 1520 ± 2
WTH3073 ± 5181 ± 1222 ± 195 ± 7185 ± 1726 ± 2
DSOH2140 ± 644 ± 145 ± 226 ± 998 ± 219 ± 2
WTH1271 ± 8173 ± 1823 ± 298 ± 11206 ± 2727 ± 3
ESOH1177 ± 687 ± 199 ± 247 ± 12129 ± 2816 ± 3
WTH1981 ± 8184 ± 1523 ± 299 ± 9196 ± 2227 ± 3
Global meanSOH11068 ± 384 ± 79 ± 155 ± 4144 ± 1117 ± 1
WTH8690 ± 3234 ± 730 ± 1130 ± 4265 ± 1036 ± 1
DifferenceWTH—SOH 21 ± 4150 ± 1020 ± 175 ± 6121 ± 1519 ± 2
* Soil provinces: B = Appalachians, C = Laurentians, D = Abitibi Lowlands, E = Mistassini Highlands.
Table 3. Effect of harvesting treatment (SOH: stem-only harvesting, WTH: whole-tree harvesting) on soil exchangeable element pools and properties, by soil province. Values are model-adjusted means ± standard errors. Values in bold indicate a significant difference (p ≤ 0.05) between harvesting treatments within a given soil province.
Soil Province *Harvesting TreatmentpHC/NCaMgKMnAlFeExch. AcidityCECBS
Exchangeable Pool (kg·ha1)(keq·ha1)(%)
Forest Floor
BSOH4.32 ± 0.0637.5 ± 1.2307 ± 3237 ± 380 ± 331 ± 27 ± 27 ± 21.8 ± 0.325 ± 288 ± 1
WTH4.31 ± 0.0640.3 ± 1.7285 ± 3937 ± 476 ± 326 ± 215 ± 58 ± 32.1 ± 0.826 ± 390 ± 2
CSOH4.07 ± 0.0638.7 ± 1.5352 ± 3549 ± 475 ± 415 ± 251 ± 617 ± 210.1 ± 1.138 ± 370 ± 2
WTH4.05 ± 0.0642.9 ± 2.2329 ± 4347 ± 571 ± 411 ± 260 ± 722 ± 410.1 ± 1.332 ± 459 ± 3
DSOH4.13 ± 0.0440.5 ± 1.6412 ± 3749 ± 590 ± 322 ± 262 ± 1121 ± 39.4 ± 1.440 ± 372 ± 3
WTH4.12 ± 0.0648.5 ± 2.4390 ± 4769 ± 685 ± 310 ± 2135 ± 1336 ± 318.6 ± 1.951 ± 358 ± 4
ESOH4.08 ± 0.0635.4 ± 2.0425 ± 4165 ± 587 ± 44 ± 285 ± 1417 ± 315.5 ± 1.946 ± 460 ± 4
WTH4.06 ± 0.0640.8 ± 1.9403 ± 4560 ± 483 ± 410 ± 181 ± 1022 ± 313.7 ± 1.547 ± 466 ± 3
P(Soil province)0.0060.0180.015<0.0010.002<0.001<0.001<0.001<0.001<0.001<0.001
P(Harvesting treatment)0.676<0.0010.0520.8830.1040.0260.0700.1470.0530.7680.423
P(Soil prov. × Harvesting)0.9890.1310.3600.0400.068<0.0010.0030.0500.0020.045<0.001
Mineral soil 0–15 cm
BSOH4.20 ± 0.0718.7 ± 0.6695 ± 17139 ± 432 ± 615.9 ± 2.0656 ± 5965 ± 375 ± 693 ± 825 ± 4
WTH4.24 ± 0.0816.9 ± 0.8775 ± 23437 ± 539 ± 619.5 ± 2.1752 ± 7257 ± 487 ± 790 ± 815 ± 5
CSOH4.89 ± 0.0621.6 ± 1.2767 ± 16138 ± 625 ± 65.7 ± 0.8433 ± 3667 ± 451 ± 453 ± 425 ± 4
WTH4.93 ± 0.0724.4 ± 1.6847 ± 22937 ± 628 ± 69.3 ± 0.8252 ± 4659 ± 431 ± 550 ± 532 ± 7
DSOH4.81 ± 0.0923.2 ± 1.0724 ± 17118 ± 1234 ± 610.1 ± 2.0488 ± 6870 ± 457 ± 667 ± 1728 ± 5
WTH4.86 ± 0.1024.7 ± 1.3805 ± 23616 ± 1320 ± 813.7 ± 2.1599 ± 8763 ± 569 ± 863 ± 1722 ± 7
ESOH4.69 ± 0.0720.6 ± 1.9655 ± 16428 ± 530 ± 73.8 ± 0.8417 ± 4356 ± 449 ± 449 ± 621 ± 5
WTH4.73 ± 0.0827.5 ± 1.7736 ± 23227 ± 521 ± 77.4 ± 0.7372 ± 4049 ± 443 ± 446 ± 623 ± 7
Mineral soil 15–30 cm
BSOH4.63 ± 0.0715.9 ± 0.6668 ± 17135 ± 433 ± 89.8 ± 1.4462 ± 4227 ± 352 ± 659 ± 922 ± 4
WTH4.64 ± 0.0815.1 ± 0.9749 ± 23433 ± 543 ± 813.4 ± 1.5446 ± 5220 ± 351 ± 762 ± 921 ± 6
CSOH5.32 ± 0.0620.8 ± 1.4745 ± 16134 ± 57 ± 85.4 ± 0.8236 ± 2929 ± 328 ± 430 ± 546 ± 4
WTH5.33 ± 0.0723.3 ± 1.8826 ± 22932 ± 614 ± 89.0 ± 0.8180 ± 4022 ± 421 ± 533 ± 658 ± 7
DSOH5.25 ± 0.0921.1 ± 1.1800 ± 17113 ± 1237 ± 96.7 ± 1.3314 ± 4833 ± 335 ± 769 ± 1844 ± 5
WTH5.25 ± 0.1021.5 ± 1.5881 ± 23612 ± 1327 ± 1010.3 ± 1.5341 ± 6125 ± 439 ± 872 ± 1847 ± 8
ESOH5.12 ± 0.0819.9 ± 2.3688 ± 16524 ± 416 ± 93.9 ± 0.7234 ± 3319 ± 327 ± 422 ± 734 ± 6
WTH5.13 ± 0.0826.3 ± 2.0769 ± 23122 ± 511 ± 97.5 ± 0.6120 ± 3312 ± 314 ± 425 ± 759 ± 7
Mineral soil 30–60 cm
BSOH4.85 ± 0.0712.0 ± 0.8890 ± 17143 ± 596 ± 1922.7 ± 2.2713 ± 5320 ± 379 ± 689 ± 2924 ± 4
WTH4.87 ± 0.0811.0 ± 1.1970 ± 23541 ± 6130 ± 2026.3 ± 2.2604 ± 6413 ± 368 ± 793 ± 3033 ± 7
CSOH5.55 ± 0.0618.1 ± 1.8841 ± 16142 ± 77 ± 196.4 ± 0.9235 ± 3322 ± 327 ± 425 ± 1456 ± 5
WTH5.56 ± 0.0720.3 ± 2.2921 ± 22940 ± 824 ± 2010.0 ± 0.9175 ± 4314 ± 420 ± 530 ± 1769 ± 8
DSOH5.47 ± 0.0919.9 ± 1.51212 ± 17221 ± 1395 ± 248.8 ± 2.2238 ± 6025 ± 326 ± 7164 ± 6163 ± 6
WTH5.48 ± 0.1018.1 ± 1.91293 ± 23720 ± 14109 ± 2612.4 ± 2.3209 ± 7618 ± 423 ± 8169 ± 6266 ± 9
ESOH5.34 ± 0.0818.2 ± 3.0809 ± 16532 ± 63 ± 244.4 ± 0.8270 ± 4012 ± 331 ± 49 ± 2142 ± 7
WTH5.36 ± 0.0826.5 ± 2.5890 ± 23130 ± 715 ± 248.0 ± 0.7111 ± 374 ± 312 ± 414 ± 2274 ± 8
P(Depth)<0.001<0.0010.039<0.001<0.001<0.001<0.001<0.001<0.001<0.001<0.001
P(Soil province)<0.001<0.0010.0450.001<0.001<0.001<0.0010.034<0.001<0.0010.005
P(Harvesting treatment)0.0360.4380.7890.6830.2370.0140.0180.0120.0250.3060.015
P(Depth × Soil prov.)<0.0010.1030.0010.636<0.0010.001<0.0010.455<0.001<0.001<0.001
P(Soil prov. × Harvesting)0.7630.0350.8850.8180.4370.5310.3600.8920.3070.6260.249
P(Depth × Harvesting)0.2000.3130.2920.4650.1950.6940.0340.9560.0250.4490.003
P(Depth × Soil prov. × Harvesting)0.1410.0090.3520.6260.5630.430<0.0010.665<0.0010.1380.102
* Soil provinces: B = Appalachians, C = Laurentians, D = Abitibi Lowlands, E = Mistassini Highlands.
Table 4. Effect of harvesting treatment (SOH: stem-only harvesting, WTH: whole-tree harvesting) on thickness and total element pools in the forest floor, by soil province. Values are model-adjusted means ± standard errors. Values in bold indicate a significant difference (p ≤ 0.05) between harvesting treatments within a given soil province.
Soil Province *Harvesting TreatmentThicknessPCaMgKMnAlFe
(cm)(Total, kg·ha1)
BSOH6.1 ± 0.688 ± 4352 ± 4157 ± 5140 ± 754 ± 4166 ± 16110 ± 13
WTH5.5 ± 0.777 ± 6327 ± 4860 ± 6144 ± 940 ± 5152 ± 20111 ± 17
CSOH9.9 ± 1.499 ± 6470 ± 4276 ± 7131 ± 921 ± 3283 ± 23275 ± 23
WTH14.7 ± 1.885 ± 8341 ± 4180 ± 9139 ± 1120 ± 3225 ± 31247 ± 33
DSOH17.2 ± 1.997 ± 5568 ± 8168 ± 7171 ± 925 ± 3182 ± 14125 ± 10
WTH17.1 ± 2.1116 ± 6491 ± 3799 ± 8195 ± 1115 ± 3171 ± 18108 ± 13
ESOH13.6 ± 1.7109 ± 8461 ± 2674 ± 5190 ± 1112 ± 2298 ± 24175 ± 15
WTH11.9 ± 1.399 ± 7554 ± 5982 ± 5160 ± 1014 ± 2292 ± 23237 ± 16
P(Soil province)<0.001<0.001<0.001<0.001<0.001<0.001<0.001<0.001
P(Harvesting treatment)0.3100.4010.8720.6420.6790.0240.9190.952
P(Soil prov. × Harvesting)0.0930.0080.3040.1430.0260.0260.6820.012
* Soil provinces: B = Appalachians, C = Laurentians, D = Abitibi Lowlands, E = Mistassini Highlands.
Publisher’s Note: MDPI stays neutral with regard to jurisdictional claims in published maps and institutional affiliations.

