
Spatio-Temporal Patterns of Tree Diversity and Distribution in Urban Resettlement Areas for Displaced Farmers


1
College of Coastal Agricultural Sciences, Guangdong Ocean University, Zhanjiang 524088, China
2
Department of Social Sciences, Education University of Hong Kong, Tai Po, Hong Kong 999077, China
3
College of Biology and the Environment, Nanjing Forestry University, Nanjing 210037, China
4
Key Laboratory for Forensic Technology of Wildlife, State Forestry Administration, Nanjing Forest Police College, Nanjing 210023, China
*
Author to whom correspondence should be addressed.
Forests 2021, 12(6), 766; https://0-doi-org.brum.beds.ac.uk/10.3390/f12060766
Submission received: 21 April 2021
/
Revised: 7 June 2021
/
Accepted: 7 June 2021
/
Published: 10 June 2021
(This article belongs to the Special Issue Landscape and Urban Planning-Sustainable Forest Development)
Abstract
:Resettlement residential areas (RRAs) are a unique product of China’s urbanisation process. Their greening environment is critical to the quality of life and liveable green neighbourhood of the displaced farmers. Our study aimed to (1) interpret the species composition of the landscape trees and their contributions to urban biodiversity in RRAs, and (2) elucidate the structural changes in the tree composition in the last 20 years. Twenty selected RRAs in Changzhou, Jiangsu Province, China, were divided into three categories by completion year. We assessed tree species composition, floristic diversity, tree dimensions, importance value, RRA characteristics, and greening management. The sampled sites accommodated 741 stems and 52 species belonging to 25 families. The three most abundant species were Cinnamomum camphora, Osmanthus fragrans, and Magnolia grandiflora, constituting 45.75% of all trees. The importance values revealed a changing tree planting pattern over time, with persistent domination by a few species. The oldest sites did not harbour the largest trees due to long-term mismanagement and mistreatment by residents. Compared with other housing types and cities, the tree count, importance value, and diversity in RRAs were low. The species diversity was not correlated with RRA completion time, distance from the city centre, and RRA area. The trees were in poor shape with limited trunk diameter and tree height and suffered from frequent and drastic pruning. Residents with lingering farmer mentality commonly exploited the vegetation and green spaces indiscriminately as natural resources. The greenery management could be overhauled by increasing tree number, native species, species diversity, and tree-care quality and engaging residents in a collaborative and participatory mode for a joint maintenance endeavour. The findings offer a scientific basis to improve or design RRA green spaces.
1. Introduction
Residential areas provides the most basic living ambience for urban residents to partake in a high level of outdoor activities. A good greening environment in residential areas serves as an important surrogate indicator to measure the quality of life and the environment in general. The quantity and quality of green spaces and greenery are pertinent factors of sustainable urban development and ecological well-being [1]. The green components in residential land use play crucial roles in environmental protection and improvement, such as cooling by shading and evapotranspiration, increasing infiltration and groundwater recharge, improving wastewater filtration and cleansing, reducing energy consumption, ameliorating air pollution, sequestering carbon, and enhancing and conserving urban biodiversity [2].
In the social dimension, some studies have indicated that a well-greened environment could promote neighbourhood harmony [3], enhance the aesthetics of urban neighbourhoods [4], and benefit physical and psychological health [5]. Children with more contacts with high-calibre nature in their formative years tend to have better concentration on studying, lower incidence of attention deficit disorder, fewer behavioural problems, higher scholastic achievement, and generally better intellectual development [6,7]. Adults living in a green area are more likely to participate in wholesome outdoor activities to bring health benefits and reduce obesity [8]. Pregnant women with more visits to pleasant natural sites have a higher probability of having full-term babies with a larger head circumference and higher birth weight [9]. Moreover, a green residential area can reduce crime rates and the fear of crime, improve the life quality of residents, and increase the value of housing [10,11]. On the contrary, cities losing a large proportion of trees have suffered from a notable rise in morbidity and mortality [12]. Therefore, building a comfortable green environment in residential areas can contribute significantly to the happiness, health, and achievements of urban residents and promote social cohesion, concord, and development.
The importance of greening in residential land use has attracted the attention of many scholars [13,14,15]. The green areas of many Chinese cities, such as Shanghai [16], Beijing [2,17], Fuzhou [18,19], Nanjing [20,21], Urumqi [22], and Changchun [23], have been studied in detail. The findings have exposed grave limitations and problems of vegetation growth in residential areas. Firstly, the urban greenery is beset by low species diversity, poor landscape quality, and monotonous planting patterns. Secondly, it commonly suffers from poor management and maintenance characterised by “planting but not preserving”, bringing serious degradation and destruction of trees. Thirdly, the type of housing exerts an influence on greening traits. The greening effect (measured by species diversity, greening coverage ratio, per capita provision of public green space, etc.) and patterns of commercial housing are significantly better than those of government housing [18,24]. The latter have been built by the government to resettle people whose original homes or farmlands have been engulfed by urban developments, and to help accommodate low-income groups. They include three categories, namely resettlement residential areas (RRAs), affordable housing communities, and low-rental housing communities.
RRAs have been instituted since the 1980s to assist farmers who lost their land in China due to urban and infrastructural developments. The rapid economic development brought by the reform and opening-up introduced in 1978 by the Chinese government considerably accelerated the pace of urbanisation (horizontal spread and vertical intensification of the urban land cover associated with population increase). In particular, the demand for construction land has increased sharply, often met by sprawling into agricultural land. The notable increase in displaced farmers called for official intervention. The state responded by formulating a policy of centralised resettlement of the disenfranchised land-deprived farmers [25].
The mode of residential areas’ development in China has been drastically transformed in the last 50 years or so in conjunction with sweeping changes in the economy and culture [26]. The early stereotype and collective neighbourhood living model from the 1950s to 1970s gave way to the gradual development of commercial housing and government RRAs for land-deprived farmers or low-income groups. The archetype vernacular abode of a single house or single courtyard house of the traditional Chinese farming culture, having lingered for thousands of years, has been radically revamped. With rapid urbanisation and earnest promotion of the “urbanisation strategy”, China’s urbanisation level increased notably from 17.9% in 1978 to 58.5% in 2017 [27]. The significant expansion in urban areas has been accompanied by the creation of a large cohort of land-deprived farmers. The RRA housing type was introduced as one of the most important ways to solve their residence problem [28].
Unfortunately, the official RRAs share common problems, including insufficient investment, low-quality housing, inadequate estate management, and a monotonous landscape design beset with insufficient and substandard greenery, contrasting sharply with commercial housing [29]. Dominated by displaced farmers, the population of the RRAs is relatively uniform in composition. Their lifestyle, thinking, attitude, and habits were greatly impacted as they metamorphosed from villagers to townsfolk and from scattered dwellings to concentrated settlements. It will be difficult for these displaced people rooted in rural areas to adapt to urban livelihood. The affected people have suffered from the quadruple jeopardy of losing their original land, detaching from nature, severing from their traditional means of livelihood, and translocating to an alien place.
Green is the ingrained colour of agrarian life. The green spaces in RRAs are important ecological infrastructures and a place for residents to assemble, communicate, and socialise. Some studies have indicated that the resettled residents have low satisfaction levels with the greening of RRAs. The main cause of the problem is the adoption of a conventional landscape design without considering the particularity of the embedded needs and expectations of the uprooted rural people [30]. Unfortunately, this biocultural incongruity, if not a pitfall, has not attracted sufficient attention from scholars, landscape designers, and administrators. It should be stressed that the green spaces of RRAs provide a crucial medium for reshaping residents’ sense of belonging, which has important research and practical values [30].
Changzhou is crucial to the economy of southern Jiangsu Province in East China. The city has eased the strained supply of urban land by demolishing and rebuilding old neighbourhoods. In recent years, the relocation of displaced villages to create new homes in organised resettlement schemes has promoted urban development and enhancements [31]. The greening in RRAs has a bearing on the environmental well-being and sustainability of Changzhou.
This study of RRA greening aimed to fill a knowledge gap (lack of understanding of the factors and dynamics of the changing tree composition and diversity in RRAs) and serve as a scientific guide to inform future greening designs by related government departments. Our study addressed two research topics regarding the plant diversity of Changzhou’s RRAs: (1) interpreting the species composition of the landscape trees and their contributions to urban biodiversity, and (2) elucidating the structural changes in the tree composition in RRAs in the last 20 years. The results could guide management decisions on greening in RRAs and other cities facing similar challenges.
2. Materials and Methods
2.1. Study Area
This study was conducted in the main built-up portion of Changzhou (about 31° N and 119° E) in the southern part of Jiangsu Province in East China. Changzhou has implemented some pioneering development activities to meet the goals of an ecological green city with promising outcomes. It has earned several national awards, including China’s Comprehensive Human Settlement Award and the National Forest City Award [32]. The RRAs, as a component of Changzhou’s residential sector, are critical to improving the happiness index of displaced farmers and the city’s overall well-being [33].
The municipal administration chose 20 RRAs for a green space improvement project, and these sites were adopted as our study area (Figure 1). The study area occupying the city core included four districts (Wujin, Tianning, Zhonglou, and Xinbei), covering ca. 1862 km2 (Table 1 and Figure 2). Occupying the hinterland of the Yangtze River Delta, Changzhou has a northern subtropical monsoonal climate with cool winters and hot and humid summers. The average annual temperature is 17.5 °C, with a wide annual range stretching from the coldest month of January (approx. 3.2 °C) to the hottest month of July (approx. 31.1 °C). The annual frost-free period lasts more than 200 days, and the annual precipitation reaches 1071.5 mm [34].
Similar to other industrial cities in China, especially in the Yangtze River Delta, Changzhou has undergone rapid urbanisation over the past few decades. Its population grew from 3.41 million in 2000 to 4.72 million in 2018 [35]. Many agricultural lands have been adapted for industrial and residential use, and many displaced farmers became industrial workers and moved into government-built RRAs. Changzhou has a total urban green area of 10,477.86 ha, denoting a current green coverage rate of 43.12% in the built-up area and 15.11 m2 of green park space per capita in the urban area [36]. However, the limited allocation of land for RRAs and the negligence of urban planners and estate managers have reduced the provision of green spaces.
2.2. Sampling and Investigating
To compare the changes in greening in RRAs in recent years, 20 RRAs were divided into three chronological categories according to the building completion year: Group A (before 2004), Group B (2005–2010), and Group C (2011–2016) (Table 1). These three groups represent three RRA development phases in Changzhou. The total area of the 20 RRAs is 360 ha, with an average area of 18 ha. The largest is Songtao Yuan (41 ha), and the smallest is Ziyun Yuan (10.9 ha).
The Changzhou Resettlement Areas Green Space Reconstruction Project selected some representative RRAs for detailed assessment. They were adopted as our field survey plots instead of a random sample approach [37]. The selected RRAs were largely representative of the whole group in terms of the following: (1) different completion times, from 1998 to 2016; (2) different locations from the city centre and to the suburban township; and (3) different size.
Ten plots (each ca. 100 m2) of green space in each RRA were demarcated according to the site conditions. Due to the irregular shape of some green sites, the plot shapes ranged from square to rectangular or triangular rather than the standard square or circular configuration of sampling quadrats [38]. A total of 200 plots with 20,000 m2 were sampled. Trees were defined as having a diameter at breast height (DBH) measured at 1.4 m from the ground level ≥2 cm. The DBH and height of all trees in each plot were measured. For multiple-stemmed trees, the aggregate DBH was calculated by the square root of the sum of the squared DBHs of individual stems [15]. As most trees were heavily pruned, the tree canopy characteristics were not recorded in the study. Furthermore, the tree species name, tree origin (spontaneous and cultivated), and tree count were recorded. Tree species identification and nomenclature followed the Flora of Jiangsu [39]. Plant assessment in urban areas, especially residential land use, was sometimes hampered by restrictions due to limited access to non-residents [2].
2.3. Data Analysis
To evaluate the tree species diversity in each RRA, the Simpson (D) [40], Shannon (H) [41], Pielou (J) [42], and Margalef (R) [43] indices were calculated together with the species richness. The indices were calculated as follows:
where S is the number of species and N is the total number of trees in each RRA.
J = H/lnS
R = (S − 1)/lnN
The species importance value (IV) was calculated using the relative abundance (RA), relative frequency (RF), and relative dominance (RD) [15,44]:
where RA = the number of individuals of a single tree species/total number of trees in the study area, RF = number of RRAs for each species/total number of RRAs in the study area, and RD = basal area at breast height in each species/total basal area in the study area [45].
IV = (RA+ RF+ RD)/3
The Pearson correlation test gauged the significance and magnitude of the associations among the tree diversity, completion year, RRA area, and distance from the town centre.
3. Results
3.1. Tree Species Composition
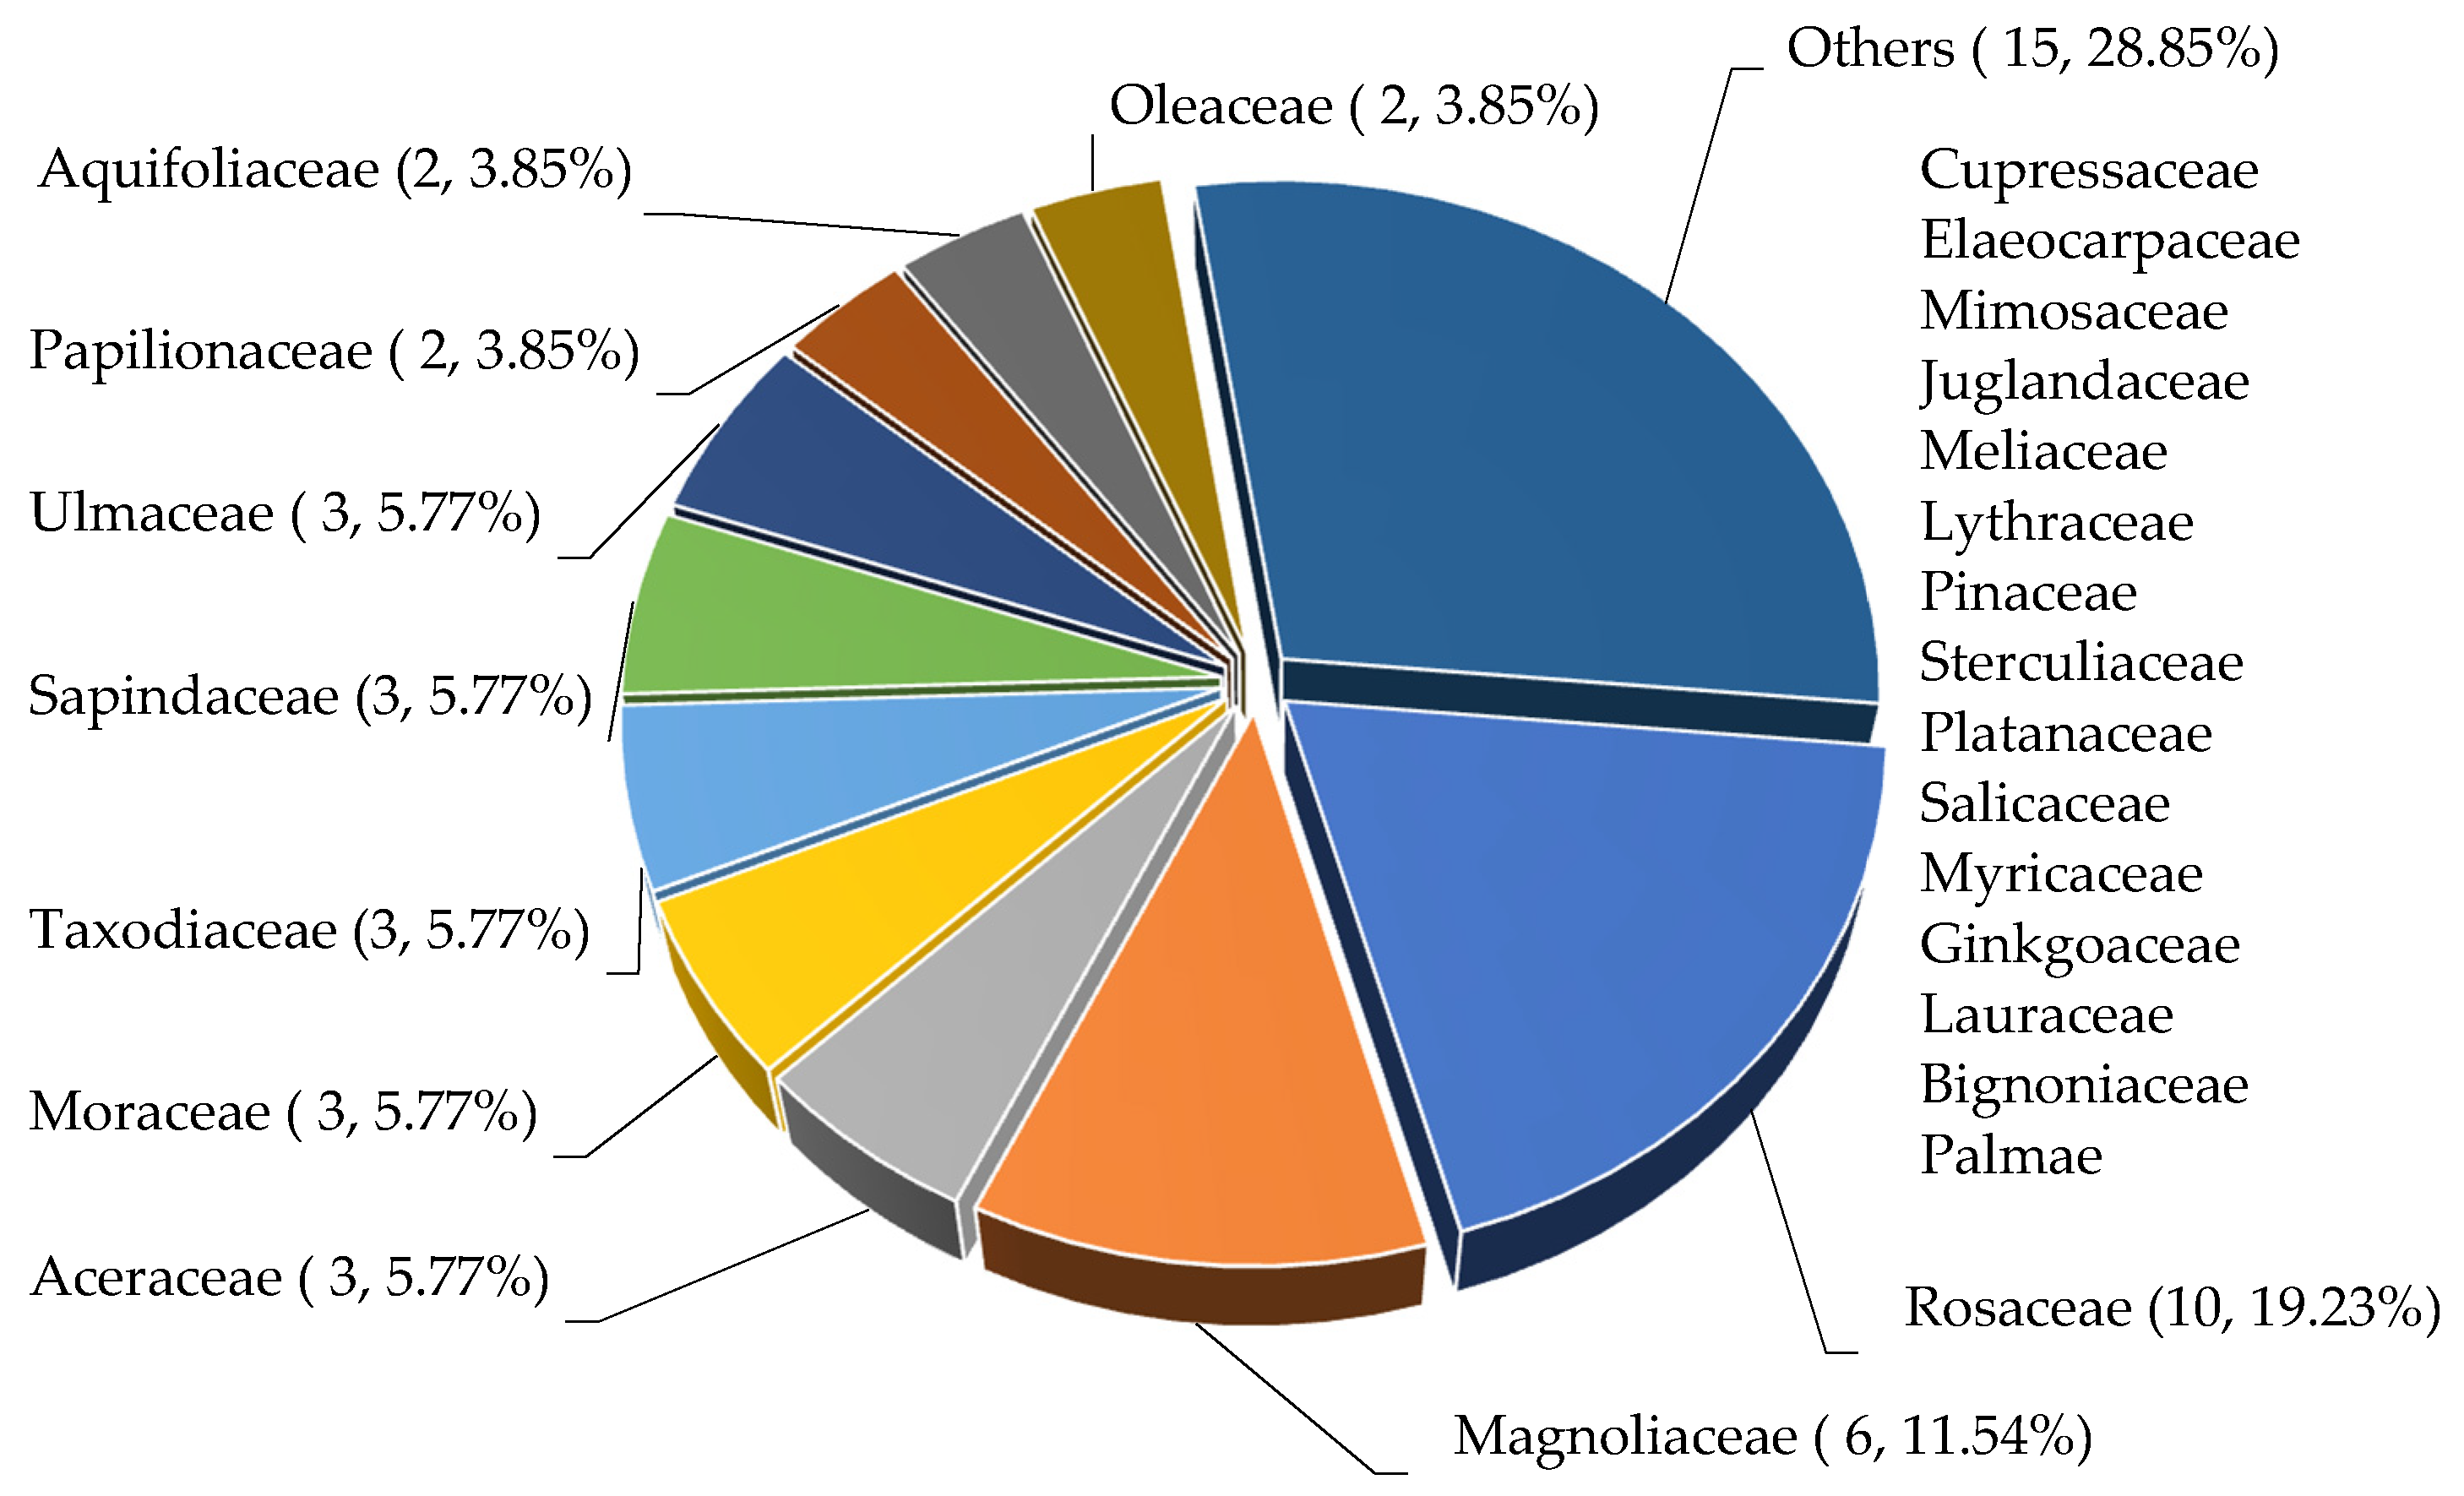
A total of 741 stems and 52 tree species belonging to 25 families were detected among the 20 RRAs of Changzhou surveyed within an area of 3.6 × 10⁶ m2 (Table 1). The predominant families Rosaceae and Magnoliaceae had the largest numbers of species at 10 and 6, respectively, collectively contributing 30.77% of all species (Figure 3). They were followed by Aceraceae, Moraceae, Toxodiaceae, Sapindaceae, and Ulmaceae with three species each. Both Papilionaceae and Aquifoliaceae had two species each. The remaining 15 families, including Cupressaceae, Lauraceae, Ginkgoaceae, and Palmae, contained only one species each.
Two species had over 100 trees each (Table 2). The most abundant species, Cinnamomum camphora, had 169 trees (22.81% of the RA), followed by Osmanthus fragrans (103 trees, 13.90%). The next three species, namely, Magnolia grandiflora, Elaeocarpus glabripetalus, and Amygdalus persica, had around 60 trees each. These five species accounted for 62.89% of all trees. Eleven species, including Koelreuteria bipinnata, Trachycarpus fortune, and Acer palmatum, had 10‒40 trees each, constituting 26.86% of all trees. Generally, the 16 top-ranked species each had over ten trees, denoting a prominent presence in the RRAs (close to 90% of the RA). The remaining 36 species accounted for a small proportion of the trees, with little landscape and ecological impact (76 trees, 10.26%).
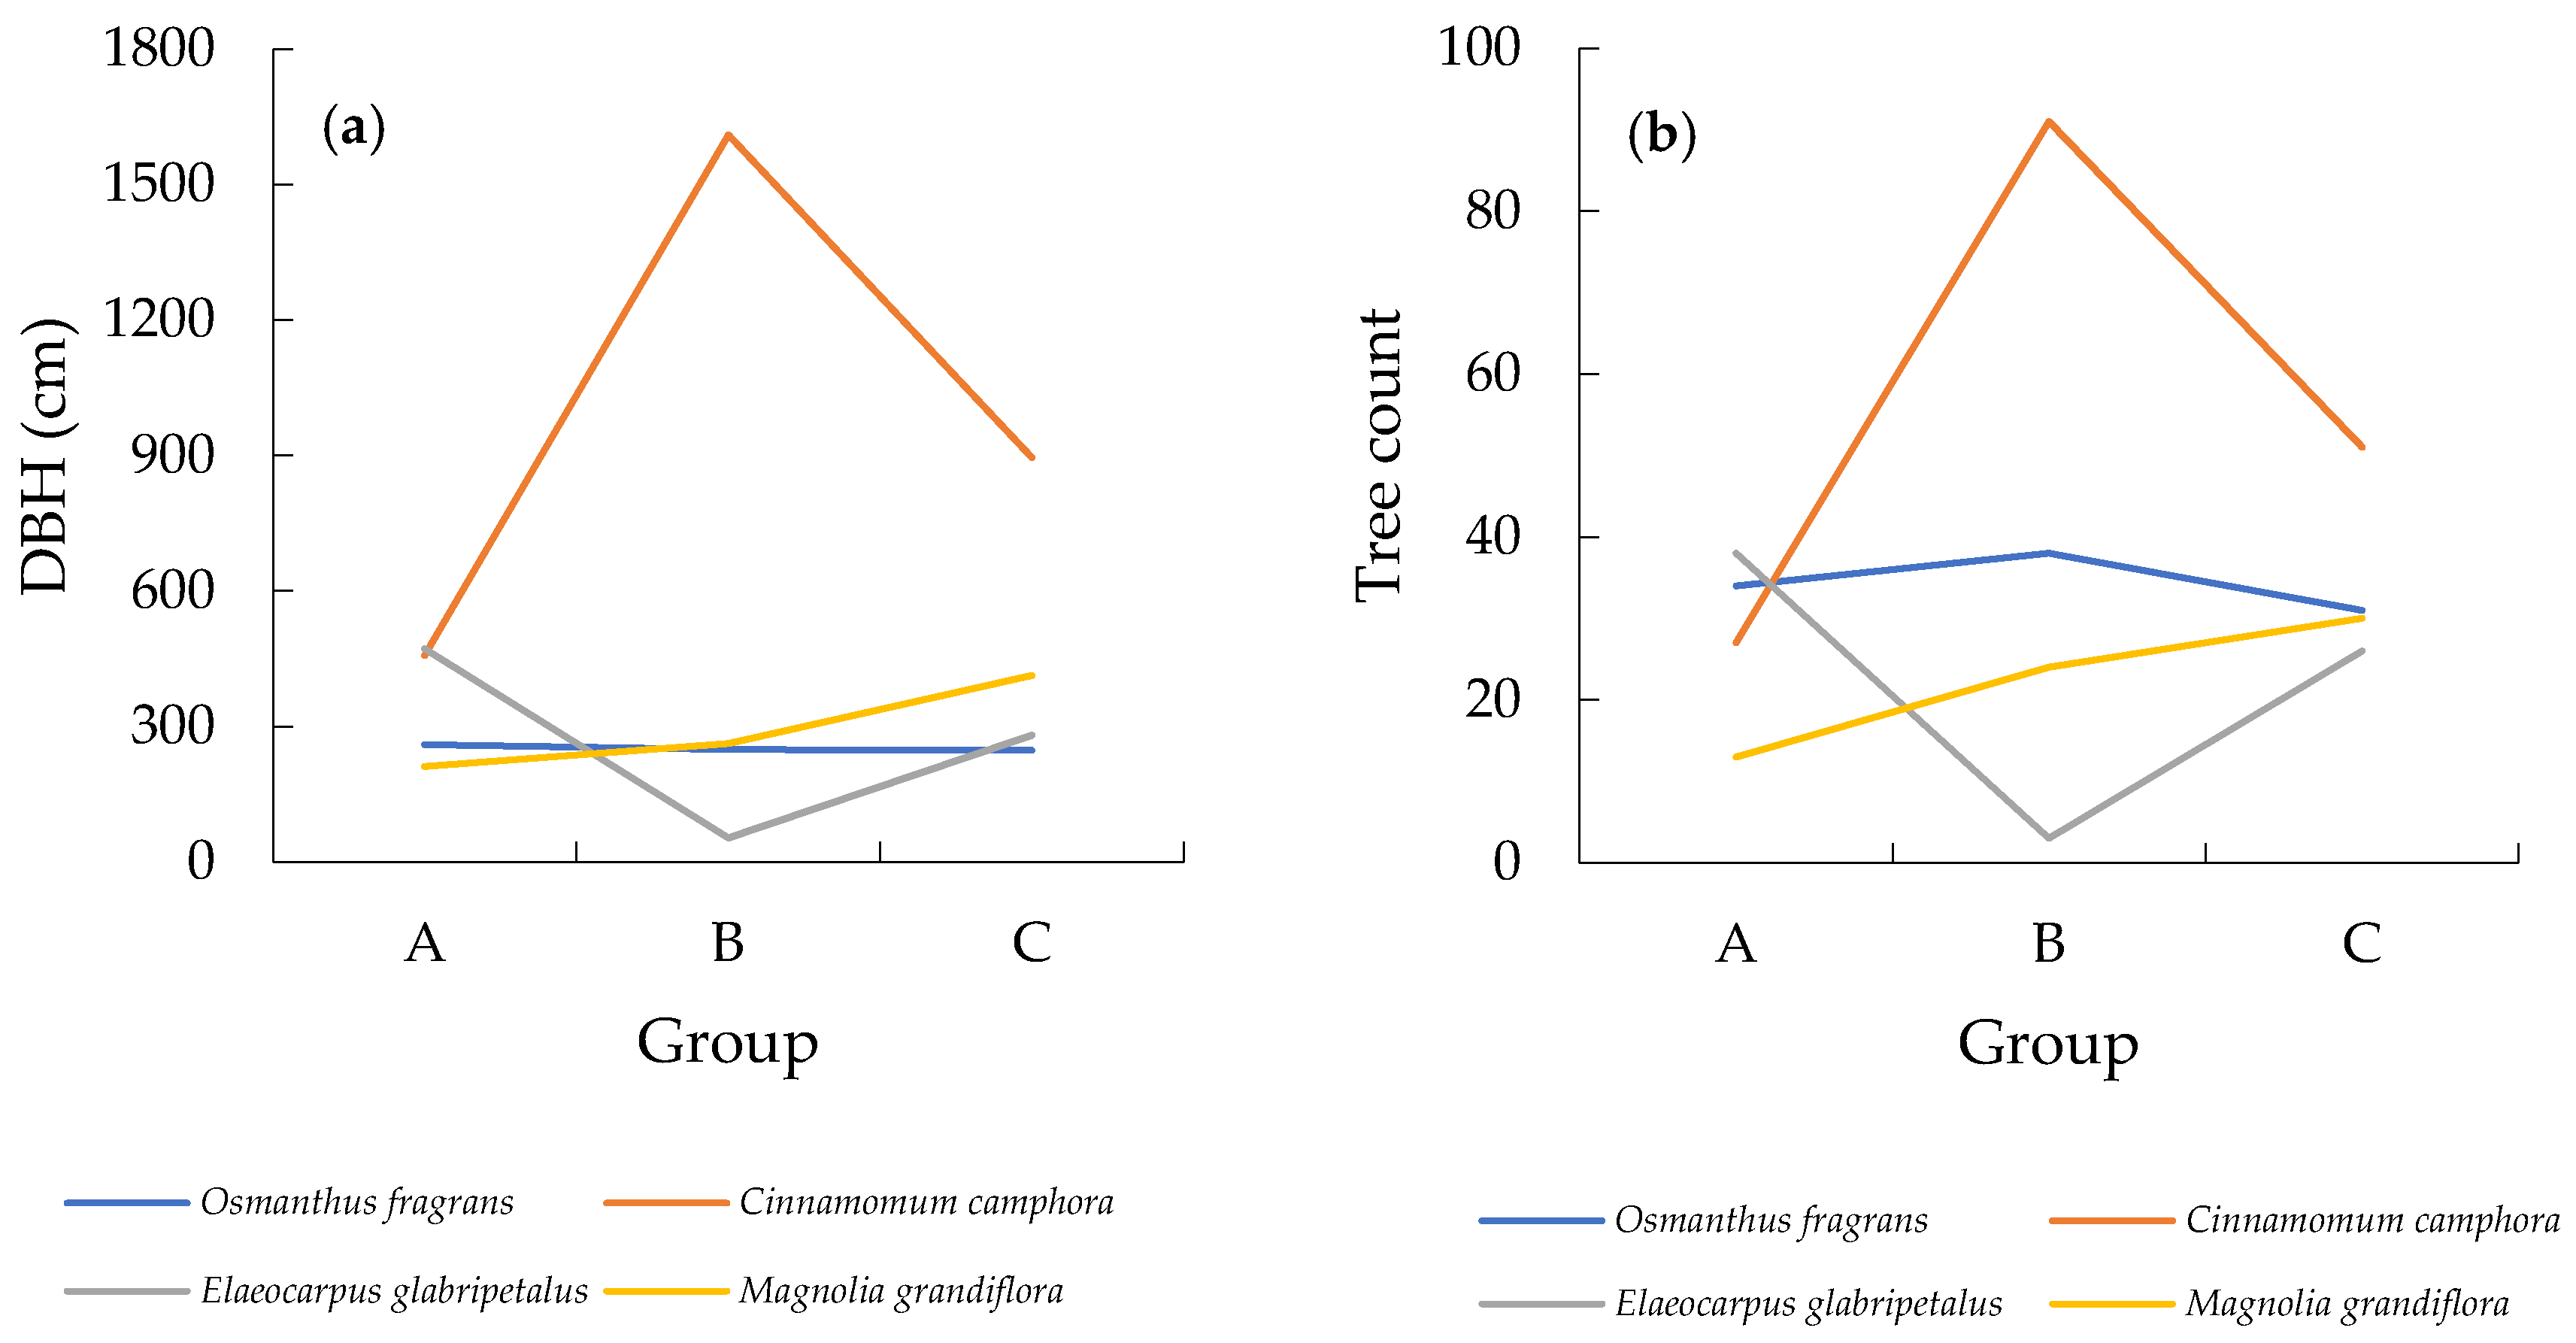
Eight tree species were recorded in all three RRA groups (periods denoted by Groups A, B, and C), including C. camphora, O. fragrans, M. grandiflora, E. glabripetalus, A. persica, A. palmatum, K. bipinnata, and Ulmus pumila (Table 2). This result indicated that these species had a long planting history, and they formed the main biomass structure in the RRAs. The distribution of the cumulative DBH and tree count of four dominant species in the three RRA groups are depicted in Figure 4. By DBH (Figure 4a), the inter-specific difference followed the descending sequence of Group B > C > A. Amongst the four species, C. camphora was the most prominent in all groups, displaying a low value in the early period (Group A) and a medium value in the latest period (Group C). It was heavily planted in Group B, exceeding the amounts in A and C by several orders of magnitude. Despite an evident decline from Groups B to C, the species still maintained a rather dominant status in Group C. The remaining three species showed a rather stable adoption level through the three periods, with E. glabripetalus experiencing a small decline in Group B and staying at a low level despite a small rise towards Group C. O. fragrans stood out as it remained at the same low level of adoption throughout the three periods. M. grandiflora underwent a very gentle and continuous increase throughout the three periods. In terms of tree count (Figure 4b), the changes in the three periods followed the same pattern as DBH (Figure 4a). The relatively wider difference between species reflected the differential tree size of the four species.
3.2. Importance Value
The top five tree species had importance values (IVs) exceeding 5.00. C. camphora predominated with a hefty margin at 22.60, followed by O. fragrans with an IV of 11.18 (Table 2). The other three dominant species, M. grandiflora, E. glabripetalus, and A. persica, had IVs of 8.49, 7.40, and 6.56, respectively. Thirteen species had an IV between 1.00 and 5.00, and the remaining 34 species were <1.00. In total, a few tree species constituted a large proportion of the total IV.
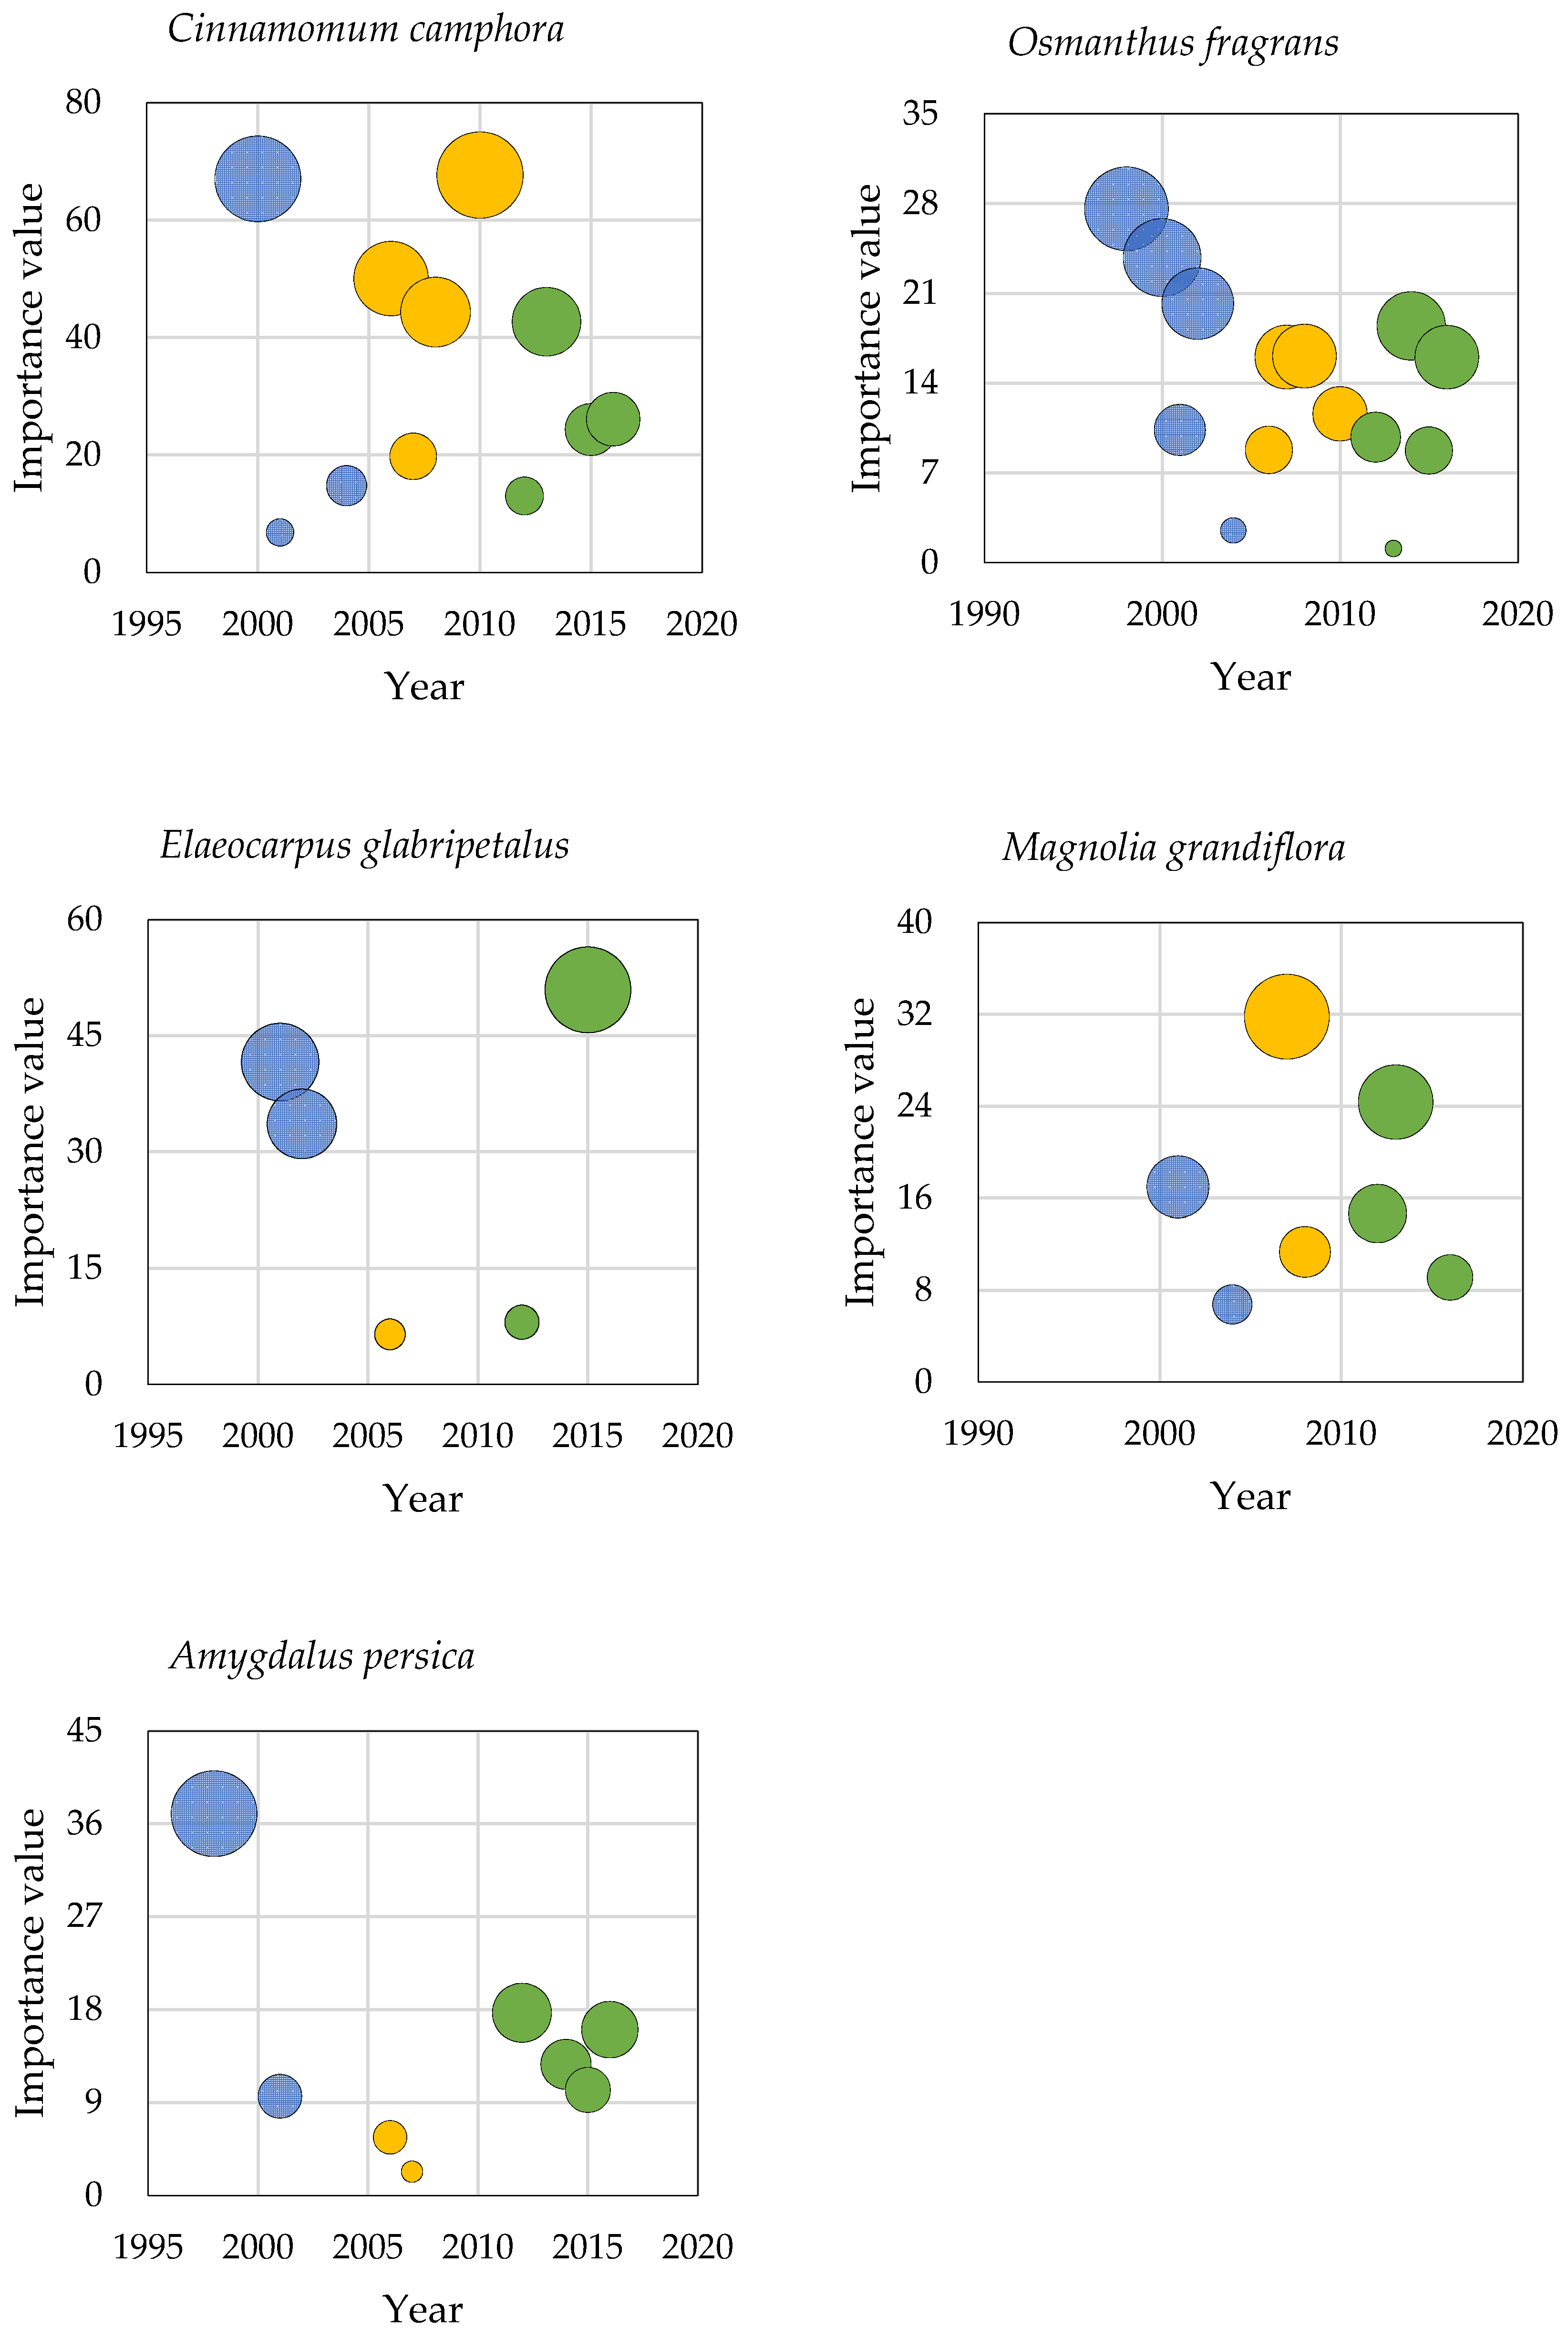
In terms of RRA groups, the dominant and common tree species and their IVs changed considerably over time (Table 2). In Group A, the top three species were E. glabripetalus (12.85), O. fragrans (12.22), and C. camphora (11.91). In Group B, the top three species were C. camphora (37.47), O. fragrans (12.30), and M. grandiflora (8.45). However, in Group C, C. camphora (19.10) also ranked first, followed by A. persica (10.53) and M. grandiflora (10.00). Figure 5 depicts the IV distribution of five dominant species, which fluctuated greatly in the three periods. In the early period (Group A), C. camphora, O. fragrans, and A. persica displayed sizeable IVs. In the medium-aged period (Group B), C. camphora maintained its dominance, while M. grandiflora began to emerge. However, the IVs of A. persica, O. fragrans, and E. glabripetalus were weak in this period. In the latest period (Group C), the IVs of E. glabripetalus and M. grandiflora were relatively large, that of O. fragrans was similar to Group B, and that of A. persica remained low. Overall, the dominance of C. camphora reflected by its IV was expressed both spatially and temporally, and the IV of M. grandiflora demonstrated a gradual increase through time.
3.3. Tree Diversity
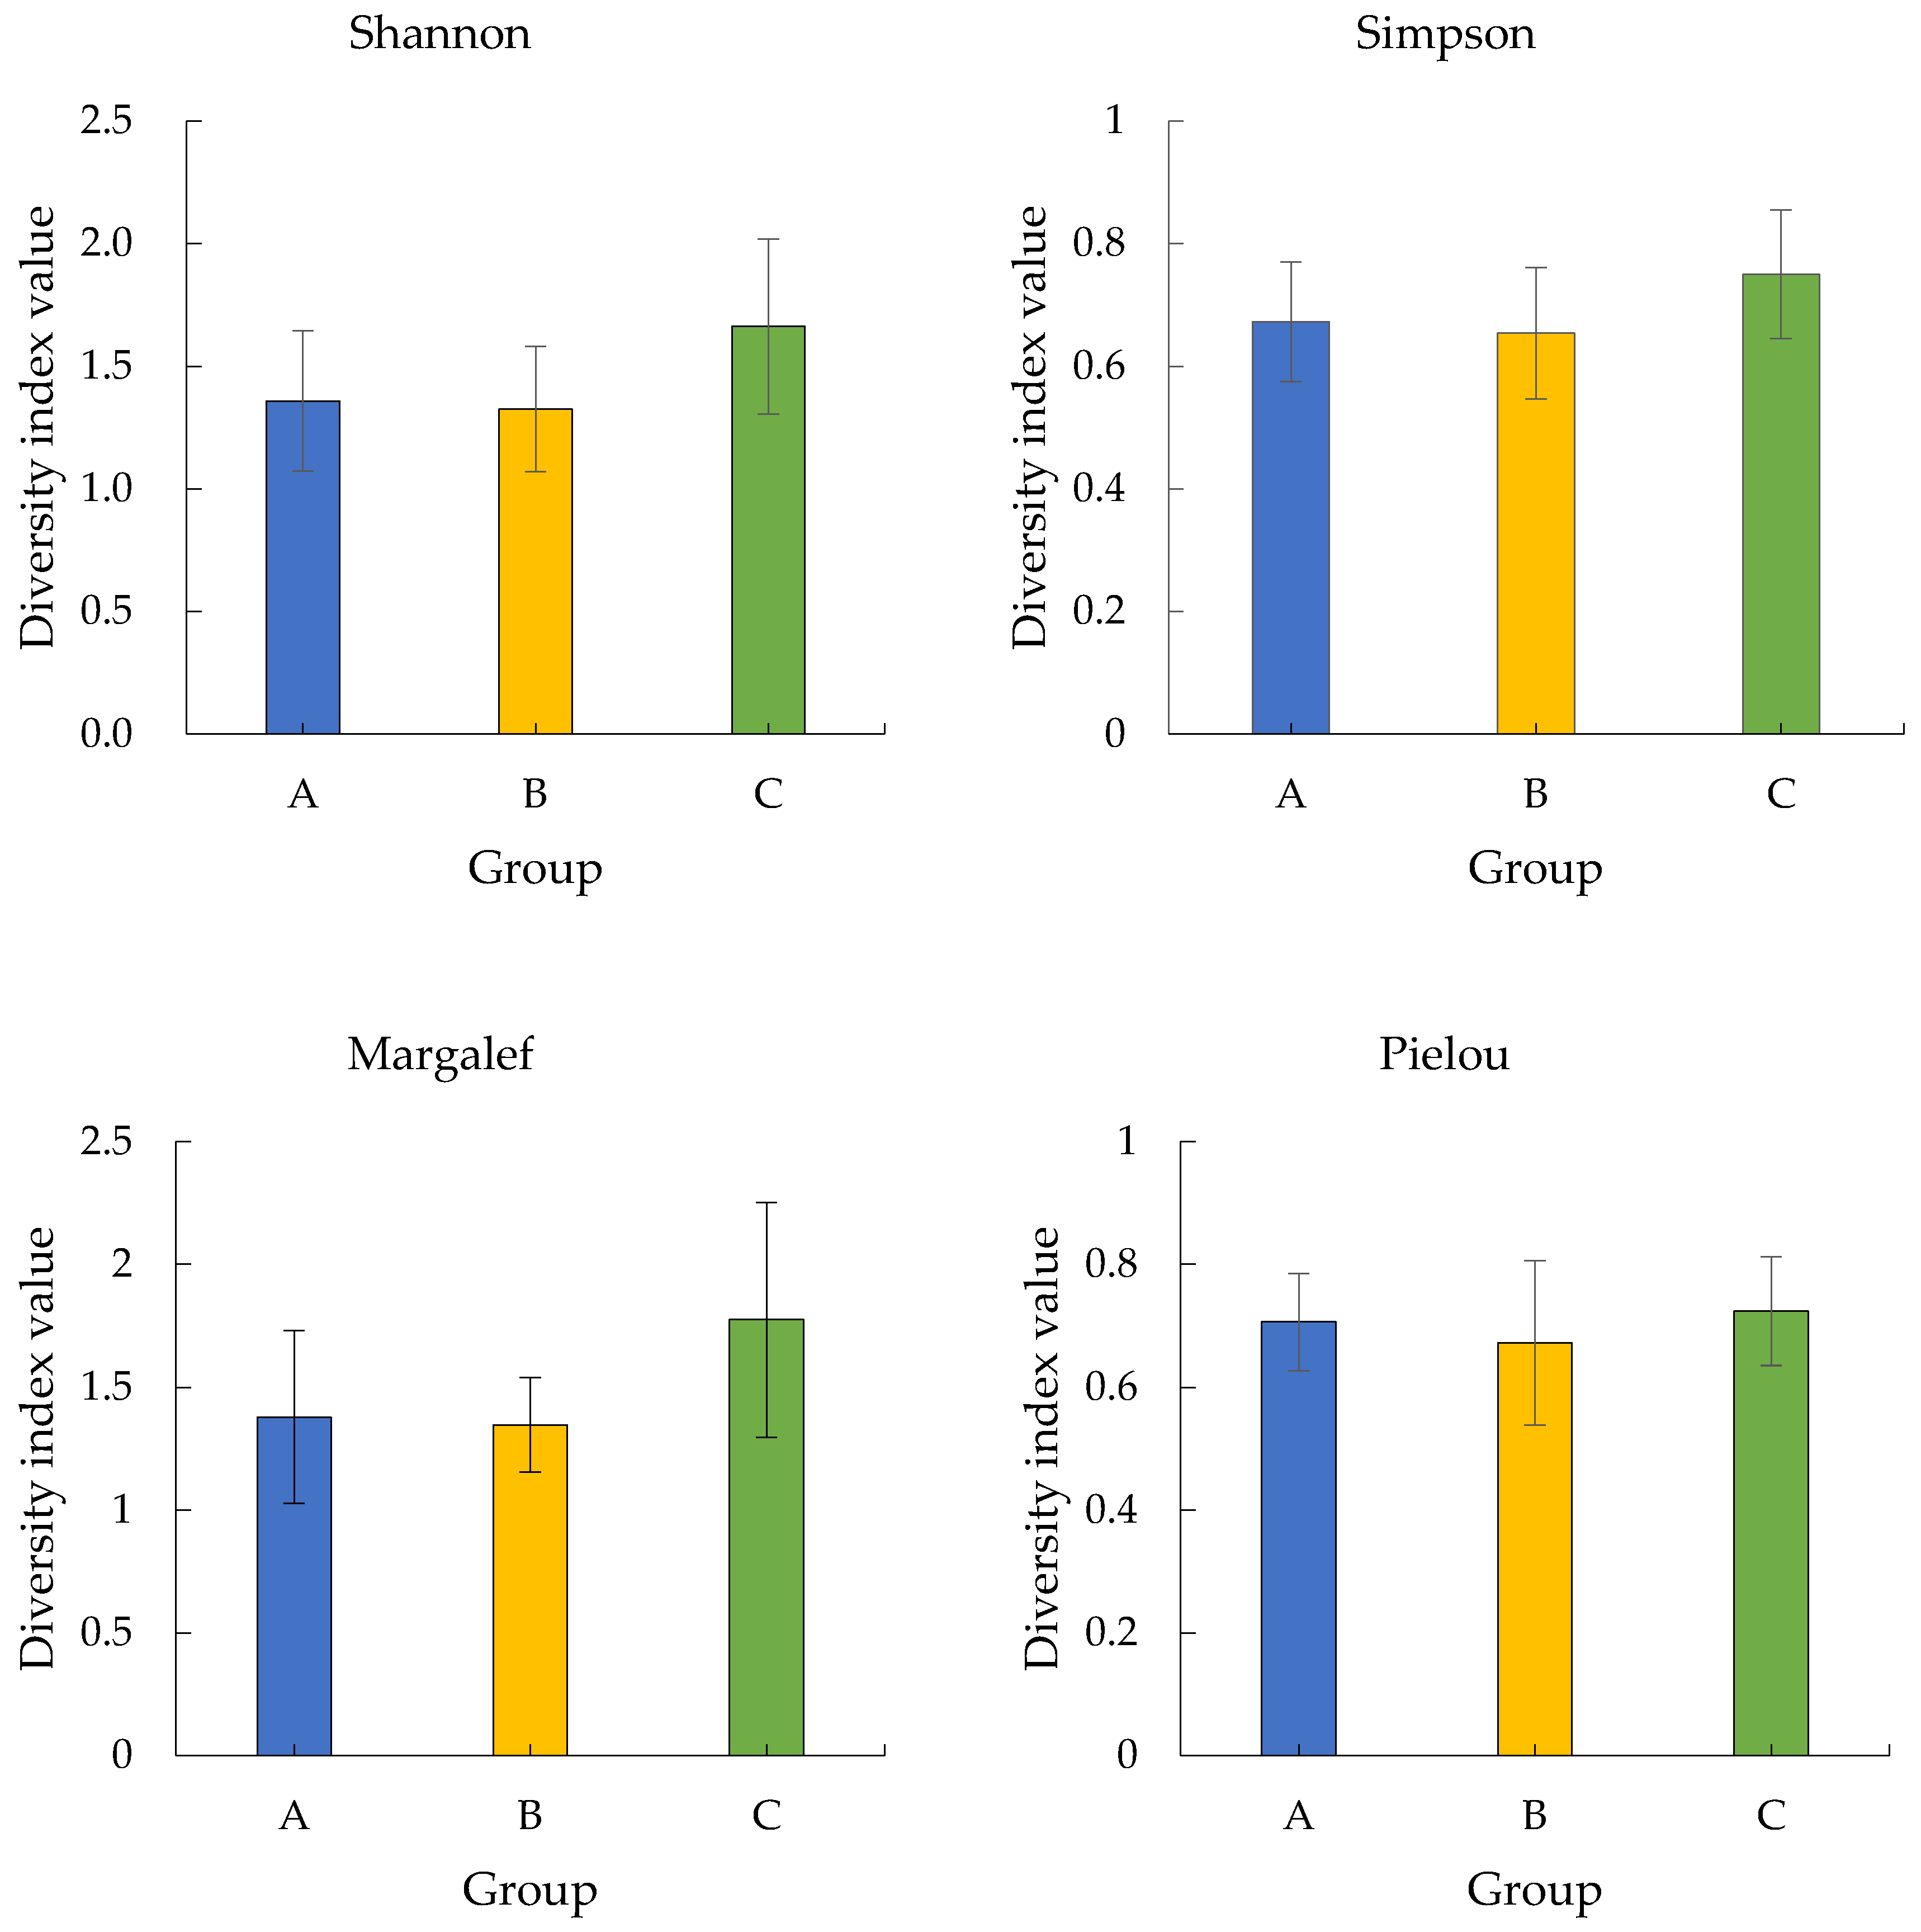
The Shannon, Simpson, Margalef, and Pielou indices for trees were the highest in Group C RRAs (i.e., 1.66 ± 0.37, 0.75 ± 0.10, 1.77 ± 0.48, and 0.72 ± 0.09, respectively), followed by Group A (1.36 ± 0.28, 0.67 ± 0.09, 1.38 ± 0.35, and 0.71 ± 0.08, respectively) and Group B (1.35 ± 0.26, 0.65 ± 0.11, 1.35 ± 0.19, and 0.67 ± 0.13, respectively) (Figure 6). Overall, each RRA had, on average, only six tree species. The highest number of species was in Qinglong Yuan and Yunhe Huayuan, with ten species each. The lowest was in Jiangnan Chunxiao, Linjiang Huayuan, and Xinyuan Huayuan, with four tree species each (Table 1). Furthermore, no significant correlation was found between the diversity indices and three RRA attributes (Table 3).
3.4. Tree Characteristics
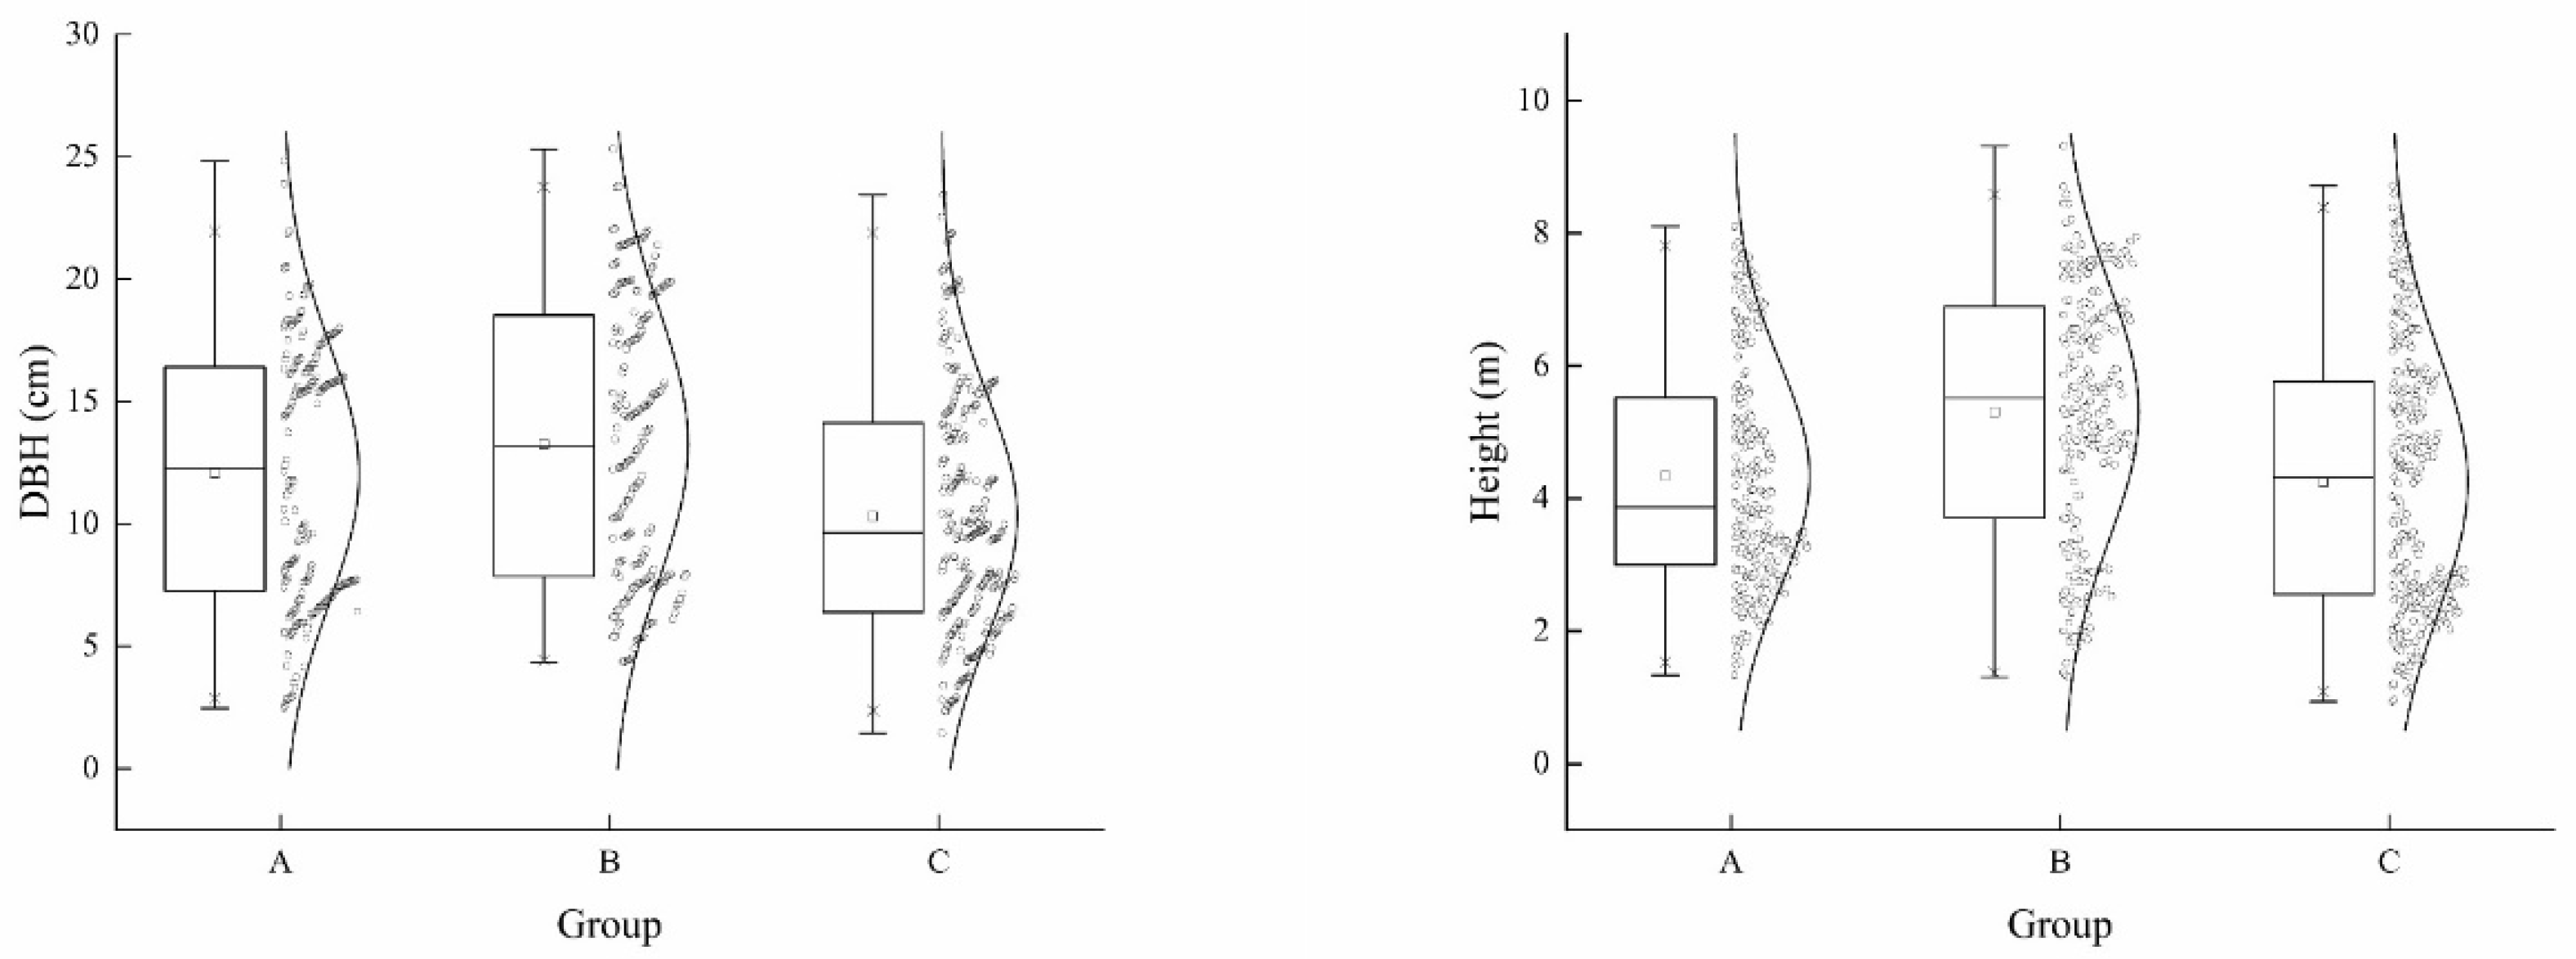
Regarding the average DBH distribution pattern in RRAs (Figure 7), the medium-aged Group B had the largest DBH, indicated in the descending sequence of Group B (13.25 ± 5.60) > Group A (12.06 ± 5.28) > Group C (10.31 ± 4.91). The upper and lower quartiles of DBH also followed the same sequence of Group B (7.85–18.53) > Group A (7.25–16.43) > Group C (6.39–14.13). The DBH of the youngest Group C was expectedly the smallest, but the largest was unexpectedly that of Group B rather than Group A. The tree height results displayed a pattern similar to that of DBH (Figure 7). Group B again had the largest tree height, with 5.31 ± 1.93 (mean value) and 3.71–6.89 (upper and lower quartiles), followed closely by Group C (4.25 ± 1.98, 2.55–5.76) and Group A (4.34 ± 1.71, 2.98–5.54). Generally, the tree dimensions in Group B were higher than those in Groups A and C.
4. Discussion
4.1. Cultural and Historical Roots of Changing Species Choice
In terms of the dominant family structure, most dominant families contained only one to three species, each with a few individuals. The distribution pattern of the family structure differed slightly by RRA group (Figure 3). A total of 230 (27 species in 17 families), 223 (15 families and 24 species), and 288 (17 families and 29 species) trees were recorded in Groups A, B, and C, respectively. Each RRA group had around 25 species, but Group C’s number was 25.22% and 29.15% greater than that of Groups A and B (Table 2), respectively. Regarding the species composition, a few main species were dominant, such as C. camphora, O. fragrans, M. grandiflora, E. glabripetalus, and K. bipinnata, regardless of the RRA age (Figure 5).
Two main reasons could explain their popular adoption in urban greening. Firstly, these species are more adaptable to the urban environment, and they can tolerate prolonged impacts of minimal, improper, or poor management. Through a long period of trial and error, the vast amount of candidate species mined from nature were assessed and winnowed for their performance. The suitable ones were adopted for planting in the rather novel urban habitats. As a typical example, C. camphora can withstand various environmental stresses and does not have strict soil and temperature requirements. The species is distributed naturally in the southern Yangtze River basin and has become the main landscape tree species in many Chinese cities since historical times in the warm temperate to subtropical zones [46]. The inertia to plant the species adopted by the predecessors has been a common human behaviour. It would be natural for landscape designers to plant them in the new RRAs, just as they would be widely planted in other urban areas.
Secondly, the regional culture and customs have influenced horticultural preferences and fashion over the years. O. fragrans, for many centuries, has been one of the top ten traditional flowers in China [47]. The love and lore of its ethereal fragrance and form have captured the inner sanctum of many gardening and artistic sages. The widely respected species has been commonly planted in gardens stretching from the temperate Qinling Mountains in the north to the subtropical Nanling Mountains in the south. From the private garden enclaves of the aristocracy and landed gentry, it has spread to public gardens and parks in modern times. The species occupies an important status in people’s lives for its renowned ornamental, medicinal, and culinary functions [48]. In addition, the importance values of M. grandiflora at 6.92, 8.45, and 10.00 from Group A to Group C, respectively, signified an evident upward trend. As an outstanding ornamental species well recognised since ancient days, the species has been listed as the city tree of Changzhou and is actively promoted in garden planting. Its adoption in RRAs echoed the long-standing landscape-tree fad that has been faithfully followed for centuries in the region.
Excluding the dominant species, other associated species had undergone certain changes in the RRAs. Sophora japonica, Morus alba, Prunus salicina, Armeniaca mume, and Myrica rubra were all present only in Group A. They are typical Chinese rural native plants [49,50,51]. Their early cultivation in Group A RRAs indicated an alignment of the landscape design with the traditional rural planting practice. The desire to fulfil the horticultural wishes of the displaced farmers has been expressed. There was at least the intention to modify the otherwise rather routine urban tree species palette by incorporating some rural species into the planting scheme. However, their absence in Groups B and C signified the abandonment of this initial eclectic, if not altruistic, selection mentality. The progressive dilution of nature’s representatives of rurality could denote a detachment of the displaced farmers from their natural roots in their home villages. Such a policy and management shift would go against the enlightened creation of a token connection to fulfil their nostalgic craving.
However, in Group C, exotic or more ornamental tree species, such as Cedrus deodara, Ficus carica, Magnolia × soulangeana, and Magnolia denudate, began to appear (Table 2). The native tree species mentioned in Group A were gradually phased out. This change in the composition of tree species was strongly influenced by the greening guidelines of the government at different periods. In a way, the recent development of a landscape fashion has been steered if not dictated by the official guidelines. The adherence to such authoritative recommendations has induced uniformity in landscape planting in a mode not dissimilar, although not so extreme, to the monocultural practice in agriculture. One consequence of such standardisation is the inadvertent suppression of local and idiosyncratic species choices that are essential for biological and cultural diversity. The regrettable decline in the homesick species would have eroded the meagre sentimental linkage of the displaced farmers to their old homelands.
In addition, the rate of C. camphora planting in different periods went through a “low–high–low” change pattern (Figure 4), reaching a peak in Group B (2005–2010). In the early period, both species diversity and the number of trees were low. Meanwhile, a small number of other species were introduced from the ancestral villages by the displaced farmers, which diluted the importance of C. camphora. However, since the greening of RRAs was gradually incorporated into the overall urban planning, the government-favoured landscape trees (mainly C. camphora) began to acquire dominance. The main advantage of the single dominant species planting model was its relatively easy and cost-effective management. The disadvantage was the reduction in tree diversity with negative impacts on local ecology. After the second period, the greening management realised the problem, so the proportion of C. camphora planted in the RRAs began to decline in the third period after the 2010s.
4.2. Exceptionally Low Species Diversity
The tree species diversity was quite low in all RRA groups in Changzhou, with only 52 tree species. Moreover, most trees contributed merely six species, such as C. camphora, O. fragrans, and M. grandiflora. The six top-ranking species accounted for approximately 70% of all trees (Table 2). As a result, the few dominant species have almost monopolised the arboreal landscape of the RRA green spaces (Figure 4). Furthermore, the distribution pattern of the dominant species among the RRAs converged pronouncedly. This issue of greening homogeneity has become prevalent in China [52,53], echoing the overwhelming control of landscape planting by some imposing guidelines. The recent prevalence of this domineering horticultural trend has undoubtedly deprived RRAs of the chance to enhance their nostalgic greenery.
Although the plant communities in residential areas were created artificially, the species diversity indicators can still reflect the richness, structure, and stability of urban greening communities and their relationship with the surrounding environment [54]. The Shannon index values of the RRAs in different periods were 1.36, 1.35, and 1.66, respectively (Figure 6). Compared with other residential areas in Changchun (tree diversity index: 2.72) [23], Beijing (3.0 to 3.5) [17], Kunming (2.19) [55], and Fuzhou (3.00) [18], the tree diversity of the RRAs in Changzhou was distinctly low. In particular, it was lower than in the northern cities such as Changchun and Beijing, with far more trying climatic conditions for plant growth.
Thus, the evident arboreal pauperisation in RRAs was inconsistent with the better, if not enabling, natural environmental conditions of the northern subtropical geographic location. We suggest that this deficiency was mainly related to the government’s insufficient investment in the early greening stage [18,56]. The shortcoming could be attributed to the lack of resources to hire competent landscape designers, purchase planting materials, and plant and maintain the cultivated trees. In the interest of social equity and environmental justice, it may not be fair treatment to lower the greening standard in RRAs in terms of quality and quantity compared to other residential areas in Changzhou. As displaced farmers lost their land and agricultural livelihood and relocated to urban areas, their living precincts could be accorded a comparable greening level.
In general, plant diversity was positively correlated with the size of a residential area and the establishment age [2,15]. However, our results (Table 3) indicated that the tree diversity of the RRAs in Changzhou was not significantly correlated with these factors. This unexpected outcome could be linked to the inadequate planning of the green spaces in RRAs. Due to the stringency of investment costs and other limiting factors, the RRA developers mainly planted turf and shrubs [57], with only a few trees at prominent positions. In addition, the vehicle parking demands in the RRAs were fulfilled by usurping part of the green space situated between houses, resulting in the reduction in and fragmentation of the green space [25].
The plight of low species diversity in cities has taught humankind profound lessons, as exemplified by the massive impacts on human and ecological well-being of the Dutch elm disease [58]. Although the planting of a single dominant tree species in cities is convenient for management and maintenance, the serious damage caused by this monotonous model has been criticised by scholars [59,60]. Compared with the natural environment, the heat island effect, light pollution, green space fragmentation, human interference, and other issues have caused major changes in the phenology and habits of urban organisms. The urban environment also provides a breeding ground for the outbreak of pests and diseases [61]. Therefore, enhancing the tree diversity in RRAs is important not only for improving the urban ecological environment but also for enriching the urban landscape and promoting the sustainable development of the regional environment [62]. The impoverished species richness in the Changzhou RRAs, in conjunction with the low tree count and coverage, substantially trims the ecosystem services that urban forests could otherwise offer. The RRA residents will suffer from long-term deficits in the natural moderating benefits of trees, with consequences on environmental quality, health, and quality of life.
4.3. Cramped Growth Sites and Frequent Pruning
The DBH and heights of the trees were generally small in the RRAs of Changzhou (Figure 7). Regardless of the time period, the DBH of most trees was only approximately 10 cm. The unusually low DBH for some trees planted in the 1990s in Group A sites indicated long-term inadequate tree management. Notably, the massive pruning of most trees signified unprofessional tree-care skills that could have weakened the trees, created many wounds for invasion by wood-decaying fungi and other natural enemies, and stifled tree growth. Under natural growth conditions, the trees should have had larger DBHs and tree heights in Group A after over 20 years of growth.
Nevertheless, both the DBH and tree height values in Group A were surpassed by those in Group B. This anomaly could be explained by the seriously insufficient greening investment in the early RRAs. The education level of the residents of the Group A RRAs was lower than that of Group B and C residents [63], and vandalism and other inadvertent or advertent damage to the trees in the early RRAs were more serious. During field investigations, we found that most trees in Group A were replanted after serious degradation and demise of the initially planted trees.
Most trees had a limited tree height. Trees that reached a certain height would have affected the power and telephone cables and had to be pruned often and quite drastically on a regular basis. In addition, most RRA buildings were 5–6 storeys high. Many trees were planted near the buildings due to the limited and cramped planting spaces. Trees that grew too tall would block the natural light and ventilation of a notable proportion of the apartments, thus calling for frequent pruning to alleviate such a perceived nuisance. As the tree canopy was frequently pruned, its dimensions and biomass structure was not evaluated in this study. However, the drastic reduction in the tree canopy would suppress its photosynthetic capacity with consequences on tree vitality, defence against natural enemies, tolerance of stress, productivity, and growth rate. Such cramped growth space and frequent pruning harm tree health and reduce ecological benefits [20].
4.4. Landscape Design with a Human Dimension
The landscape design in the RRAs of Changzhou was rated as poor. It generally suffered from dull plant configurations, monotonous colour range and little seasonal colour change, lack of a hierarchical organisation, and low species diversity. A sophisticated landscape design was not adopted to address the simple and overwhelming greening requirements of the “shrub–grass” layout with some scattered trees. The resulting design was beset by problems such as random configurations, simple community structures, low stability, and scarce consideration of the biological and ecological contributions of a diverse assemblage of tree species. Due to the generally cramped planting sites, some plants were located too close to the buildings and obstructed natural lighting and ventilation. Besides asking the estate management to prune the trees, some residents would remove or destroy them, thus degrading the inherently poor landscape.
To break out of this ingrained if not intractable trap, it is necessary to overhaul the landscape regime from the cradle to the grave. The greening work in RRAs could be adjusted to follow people-oriented and ecologically prioritised overarching principles. It may be helpful to realise the biodiversity enhancement goal, assess the cost–benefit of management, and optimise the visual landscape in relation to the built-up ambience. It will be necessary to consider the human dimension regarding convenience, freedom from perceived nuisance, and cultural or nostalgic sentiments. Incorporating visual, olfactory, audio, and tactile domains in RRA greening could reinforce the sense of well-being among the residents.
The inclusion of native plants could be increased in the planning and renovation of RRA greening. Changzhou is rich in indigenous plant resources. Some native tree species have the potential to be planted in urban areas by matching their innate ecological amplitudes to local sites’ conditions. These include Acer buergerianum, Quercus acutissima, Celtis sinensis, Euscaphis japonica, and Dalbergia hupeana [50]. These species can adapt well to a wide range of environmental conditions and reflect and partly reconstruct the local natural landscape characteristics. In addition, the maintenance costs of native tree species are relatively low, and the ecological safety is generally good, with the capability to minimise the outbreak of pests and diseases.
4.5. Engaging Residents in Greenery Management and Protection
The results indicated that the RRA trees in Changzhou lacked proper management, and the residents lacked awareness of the multiple benefits of urban greenery. The residents of the RRAs were mainly land-deprived farmers who harboured a deeply ingrained “farmer mentality” despite dwelling in new urban settlements. Notably, they continued to treat cultivated plants and non-built-up lands in their RRAs as natural resources that can be tapped to meet their needs. Our field investigations revealed that the trees in the 20 RRAs suffered from damage and improper management. Firstly, residents commonly trimmed branches to make supports and build sheds for drying. Secondly, large areas of lawns with shrubs and sometimes trees were cleared to cultivate fruits and vegetables. Although the RRA residents had been displaced from their villages and were no longer farmers, their inherent agrarian habits are unlikely to change in the near future [64,65].
To tackle these undesirable resident habits and behaviours, developing an alternative management style tailor-made to resolve the local issues is necessary. Besides reinforcing greening management to prevent mistreatment of amenity vegetation, it will be helpful to actively engage RRA residents in maintenance tasks. The management could attempt to understand the preferences and needs of residents by consulting them and seeking their opinions and inputs. Cultivating a strong sense of ownership of the greenery amongst the residents would go a long way to avoid indiscriminate damage. Managers could work collaboratively with the residents to develop dedicated and demarcated community farms in the form of allotment gardens to satisfy the innate demands of the displaced farmers [66,67].
5. Conclusions
Understanding the current tree stock is important for effective tree planting and maintenance. Twenty RRAs in Changzhou were comprehensively assessed using plant diversity indices and importance values. The number of trees in the RRAs of Changzhou was low, and the tree diversity was significantly lower than that in other residential areas. The RRAs were dominated by a few species such as C. camphora, O. fragrans, M. grandiflora, and E. glabripetalus. Despite certain differences in species composition and diversity among the RRAs completed in various periods, none were considered notable or significant. Additionally, the tree diversity in the three groups of RRAs was not correlated with the distance from the city centre or the size of the RRA. This unexpected relationship could be attributed to RRA development mode and history, mainly due to the lack of capital investment at the time of establishment, low-cost and simplistic landscape design, poor management after completion, and residents’ low education level and civic-mindedness.
To improve greening management and planning in the future, we suggest optimizing landscape design and management. The needs of local ecology and residents could be factored into a revamped management regime. First, more native species with local landscape and cultural characteristics can dilute the present domination by a small number of species. In particular, the excessive use of C. camphora and O. fragrans should be reduced. In contrast, other native species should be increased to redress the gross imbalance and increase the biodiversity. Second, measures could be taken to increase the number of trees and improve the landscape aesthetics. The distribution of trees in green spaces could be optimised according to site size, in situ condition, and challenges of the environs. Third, the residents’ undesirable behaviours of using trees and green spaces as productive resources could be managed. The management could engage residents in a collaborative and participatory mode to take joint care of the greenery.
Author Contributions
Conceptualisation, C.X. and C.Y.J.; formal analysis, C.X. and D.L.; data curation, C.X., D.L. and X.Y.; writing—original draft preparation, C.X., X.Y. and C.Y.J.; writing—review and editing, C.X. and C.Y.J.; investigation, C.X., D.L., X.Y. and X.G. All authors have read and agreed to the published version of the manuscript.
Funding
This research was funded by the Green Jiangsu Special Fund (2130205).
Data Availability Statement
The data presented in this study are available on request from the corresponding author.
Acknowledgments
We would like to thank the staff members from the Changzhou Forest Bureau who went into the field with us.
Conflicts of Interest
The authors declare no conflict of interest.
References
- Li, R.Y.; Xu, D.W. Investigation and analysis of residential area green plants present situation in Dalian. North. Hortic. 2014, 38, 86–88. [Google Scholar]
- Wang, H.F.; Qureshi, S.; Knapp, S.; Friedman, C.R.; Hubacek, K. A basic assessment of residential plant diversity and its ecosystem services and disservices in Beijing, China. Appl. Geogr. 2015, 64, 121–131. [Google Scholar] [CrossRef]
- Qureshi, S.; Breuste, J.H.; Jim, C.Y. Differential community and the perception of urban green spaces and their contents in the megacity of Karachi, Pakistan. Urban Ecosyst. 2013, 16, 853–870. [Google Scholar] [CrossRef]
- Vogt, J.M.; Watkins, S.L.; Mincey, S.K.; Patterson, M.S.; Fischer, B.C. Explaining planted-tree survival and growth in urban neighborhoods: A social-ecological approach to studying recently-planted trees in Indianapolis. Landsc. Urban Plan. 2015, 136, 130–143. [Google Scholar] [CrossRef] [Green Version]
- Jiang, B.; Zhang, T.; Sullivan, W.C. Healthy cities: Mechanisms and research questions regarding the impacts of urban green landscapes on public health and well-being. Landsc. Archit. Front. 2015, 3, 24–36. [Google Scholar] [CrossRef]
- Bakir-Demir, T.; Berument, S.K.; Sahin-Acar, B. The relationship between greenery and self-regulation of children: The mediation role of nature connectedness. J. Environ. Psychol. 2019, 65, 101327. [Google Scholar] [CrossRef]
- Hodson, C.B.; Sander, H.A. Relationships between vegetation in student environments and academic achievement across the continental US. Landsc. Urban Plan. 2019, 189, 212–224. [Google Scholar] [CrossRef]
- Astell-Burt, T.; Feng, X. Association of urban green space with mental health and general health among adults in Australia. JAMA Netw. Open 2019, 2, e198209. [Google Scholar] [CrossRef] [Green Version]
- Laurent, O.; Benmarhnia, T.; Milesi, C.; Hu, J.; Kleeman, M.J.; Cockburn, M.; Wu, J. Relationships between greenness and low birth weight: Investigating the interaction and mediation effects of air pollution. Environ. Res. 2019, 175, 124–132. [Google Scholar] [CrossRef]
- Hussain, M.R.M.; Tukiman, I.; Zen, I.H.; Shahli, F.M. The impact of landscape design on house prices and values in residential development in urban areas. APCBEE Procedia 2014, 10, 316–320. [Google Scholar] [CrossRef] [Green Version]
- Bogar, S.; Beyer, K.M. Green space, violence, and crime: A systematic review. Trauma Violence Abus. 2016, 17, 160–171. [Google Scholar] [CrossRef]
- Donovan, G.H.; Butry, D.T.; Michael, Y.L.; Prestemon, J.P.; Liebhold, A.M.; Gatziolis, D.; Mao, M.Y. The relationship between trees and human health: Evidence from the spread of the emerald ash borer. Am. J. Prev. Med. 2013, 44, 139–145. [Google Scholar] [CrossRef] [PubMed]
- Vila-Ruiz, C.P.; Melendez-Ackerman, E.; Santiago-Bartolomei, R.; Garcia-Montiel, D.; Lastra, L.; Figuerola, C.E.; Fumero-Caban, J. Plant species richness and abundance in residential yards across a tropical watershed: Implications for urban sustainability. Ecol. Soc. 2014, 19. [Google Scholar] [CrossRef] [Green Version]
- Suyundukova, G.Y.; Shaikhislamova, E.F.; Khusainov, A.F. Ecological trends of flora formation in rural residential areas of the Bashkir Transural region. Russ. J. Ecol. 2007, 38, 289–291. [Google Scholar] [CrossRef]
- Zhang, H.; Jim, C.Y. Contributions of landscape trees in public housing estates to urban biodiversity in Hong Kong. Urban For. Urban Gree 2014, 13, 272–284. [Google Scholar] [CrossRef]
- Wang, H.B.; Qin, J.; Bin, Z.; Chen, J.K.; Dong, L.; Hu, Y.H. Spatiotemporal dynamics of plant diversity in response to farmers’ evolved settlements in Shanghai. Urban For. Urban Gree 2017, 22, 64–73. [Google Scholar] [CrossRef]
- Lang, J.D.; Liu, Y.H.; Meng, F.G. Study on plant composition and species diversity of residential greenbelt in Beijing City. For. Inventory Plan. 2007, 32, 17–21. [Google Scholar] [CrossRef]
- Fan, Y.; Huang, Q.T. Biodiversity of landscape trees in Fuzhou housing estates. Subtrop. Plant Sci. 2016, 45, 71–76. [Google Scholar] [CrossRef]
- Zheng, X.Q.; Lai, Z.X. Analysis of plant community characteristics and configuration modes in the residential area of Fuzhou City. J. Agric. 2015, 5, 65–74. [Google Scholar]
- Bian, F.Y.; Chen, S. The change of trees structure in urban residential area of Nanjing City in the recent 15 years. J. Nanjing For. Univ. Nat. Sci. Ed. 2018, 42, 127–133. [Google Scholar] [CrossRef]
- Tong, L.L.; Song, F.; Xu, X.G.; Tang, G.G. Community structure analysis & optimization strategies of plantations in residential areas of Nanjing. China For. Sci. Technol. 2009, 23, 91–95. [Google Scholar] [CrossRef]
- Li, F.; Huang, J.H.; Zhu, J. Investigation and study on species diversity of woody plants in residential areas of Urumqi. Chin. Landsc. Archit. 2012, 28, 90–94. [Google Scholar] [CrossRef]
- Wang, Q.F. Survey of woody plant species diversity in residential areas of Changchun. J. Zhejiang Agric. Sci. 2014, 1556–1559. [Google Scholar] [CrossRef]
- McConnachie, M.M.; Shackleton, C.M. Public green space inequality in small towns in South Africa. Habitat Int. 2010, 34, 244–248. [Google Scholar] [CrossRef] [Green Version]
- Feng, X.Q.; Zhou, C.; Xia, Y.; Liu, D. Research on the present situation of green landscapes and its solution in the land-lost farmers’ resettlement community. J. Hunan Agric. Univ. Nat. Sci. 2012, 38, 140–141. [Google Scholar]
- Zhang, Y.L. China and its neighbourhood: Transformation, challenges and grand strategy. Int. Aff. 2016, 92, 835–848. [Google Scholar] [CrossRef]
- Cai, Z.Y.; Liu, Q.; Cao, S.X. Real estate supports rapid development of China’s urbanisation. Land Use Policy 2020, 95, 104582. [Google Scholar] [CrossRef]
- Kong, Q.L. The practice of housing placement and commercial housing“homogenization”—Brief introduction of the Jiangyin Puhui court 9th resettlement residential area. Urban. Archit. 2013, 292. [Google Scholar] [CrossRef]
- Ma, T.T.; Yu, X.W.; Gu, K. The user-friendly landscape design for resettlement community. Archit. Cult. 2016, 220–221. [Google Scholar] [CrossRef]
- Gao, K.; Fu, H. Strategy of planning and design for green space in residential areas of demolition and resettlement developed from villages: A case study of Linqu, Shandong Province. Mod. Urban Res. 2015, 82–86. [Google Scholar] [CrossRef]
- Jiang, Y. Exploration of property management in Changzhou demolition and relocation district. Sci. Technol. Consult. Her. 2007, 7, 201. [Google Scholar] [CrossRef]
- Zhang, Z.H.; Ji, J.; Xie, X.A.; QI, W.P. Practice and discussion on the construction of national ecological garden city in Changzhou. Mod. Hortic. 2019, 9, 168–170. [Google Scholar] [CrossRef]
- Li, T.; Tang, L.L.; Ni, G.; Yu, X.P. Discussion on the construction of urban forest in Changzhou. Agric. Technol. 2015, 35, 67–68. [Google Scholar] [CrossRef]
- Zhao, W.H.; Hang, W.; Xu, L.; Yang, G.; Huang, J.; Fang, Y. Research on the application of color foliage tree species of urban roads in Changzhou. South. Hortic. 2019, 30, 40–44. [Google Scholar] [CrossRef]
- Cao, Z.P. Changes in Changzhou’s Population and Household Registration System in 40 Years; Changzhou Daily: Changzhou, China, 26 September 2018; p. A02. [Google Scholar]
- Wang, Y.X. Master Planning for National Forest City of Changzhou, Jiangsu Province; Beijing Forestry University: Beijing, China, 2016. [Google Scholar]
- Zhao, J.J.; Ouyang, Z.Y.; Zheng, H.; Xu, W.H.; Wang, X.K.; Ni, Y.M. Proposed procedure in designing and planning stratified random selection investigation of urban vegetation. Chin. J. Ecol. 2009, 28, 1430–1436. [Google Scholar] [CrossRef]
- Meng, X.S.; Ouyang, Z.Y.; Cui, G.F.; Li, W.F.; Zheng, H. Composition of plant species and their distribution patterns in Beijing urban ecosystem. Acta Ecol. Sin. 2004, 24, 2200–2206. [Google Scholar] [CrossRef]
- Jiangsu, I.B. Flora of Jiangsu (Volume II); Jiangsu Science and Technology Press: Nanjing, China, 1982. [Google Scholar]
- Simpson, E.H. Measurement of diversity. Nature 1949, 163, 688. [Google Scholar] [CrossRef]
- Grunewald, R.; Schubert, H. The definition of a new plant diversity index “H′dune” for assessing human damage on coastal dunes—Derived from the Shannon index of entropy H′. Ecol. Indic. 2007, 7, 1–21. [Google Scholar] [CrossRef]
- Pielou, E.C. The measurement of diversity in different types of biological collections. J. Theor. Biol. 1966, 13, 131–144. [Google Scholar] [CrossRef]
- Magurran, A.E. Ecological Diversity and Its Measurement; Princeton University Press: New York, NY, USA, 1988. [Google Scholar]
- Ellenberg, D.; Mueller-Dombois, D. Aims and Methods of Vegetation Ecology; Wiley: New York, NY, USA, 1974. [Google Scholar]
- Welch, J.M. Street and park trees of Boston: A comparison of urban forest structure. Landsc. Urban Plan. 1994, 29, 131–143. [Google Scholar] [CrossRef]
- Wang, W.X.; Jia, D.H. Application of Cinnamomum camphora (Linn) Presl in Garden Greening. North Hortic. 2007, 31, 144–145. [Google Scholar] [CrossRef]
- Xiang, Q.B.; Liu, Y.L. The Present and Development Strategy of Production, Development, Popularization and Utilization of Sweet Osmanthus. J. Nanjing For. Univ. Nat. Sci. Ed. 2004, 28, 104–108. [Google Scholar] [CrossRef]
- Fu, L.; Ran, Q.G. Summary of Osmanthus fragrans and its cultural meaning. Biol. Teach. 2017, 42, 65–66. [Google Scholar] [CrossRef]
- Liu, Y.X.; Fang, W.; Ma, L.H.; Huang, S.Y. Investigation and evaluation of native tree species resources for urban forest in Chongqing. J. Chongqing Norm. Univ. Nat. Sci. 2013, 30, 63–68. [Google Scholar] [CrossRef]
- Xie, C.P.; Fang, Y.; Liu, D.W.; Nan, C.H. Evaluation of native trees species in Ningzhen mountains of Jiangsu province by analytic hierarchy process. Subtrop. Plant Sci. 2019, 48, 161–168. [Google Scholar] [CrossRef]
- Xie, C.P.; Tian, T.; Yi, X.G.; Liu, D.W. Analysis of woody species diversity of public green space in Xianlin college town, Nanjing city. J. Yunnan Agric. Univ. 2018, 33, 993–1002. [Google Scholar] [CrossRef]
- Qian, S.H.; Qi, M.; Huang, L.; Zhao, L.; Lin, D.M.; Yang, Y.C. Biotic homogenization of China’s urban greening: A meta-analysis on woody species. Urban For. Urban Gree 2016, 18, 25–33. [Google Scholar] [CrossRef]
- Wang, G.M.; Zuo, J.C.; Li, X.R.; Liu, Y.H.; Yu, J.B.; Shao, H.B.; Li, Y.Z. Low plant diversity and floristic homogenization in fast-urbanizing towns in Shandong Peninsular, China: Effects of urban greening at regional scale for ecological engineering. Ecol. Eng. 2014, 64, 179–185. [Google Scholar] [CrossRef]
- Zhang, Y.L.; Li, Z.Y.; Yang, J.; Hu, Y.W.; Zhang, Z.Y.; Ye, B. Community structure and species diversity of urban green space in Hangzhou, China. J. Northeast. For. Univ. 2013, 41, 25–30. [Google Scholar] [CrossRef]
- Zeng, S.B.; Zhang, L.; Zhu, Y. Analysis and evaluation on the diversity of garden plant communities in new residential districts of Kunming. J. Anhui Agric. Sci. 2008, 36, 11719–11720. [Google Scholar] [CrossRef]
- Peng, J.X.; Peng, R.S.; Su, Q.S. Some problems and solutions on the environment of green space in demolishing and constructing communities. J. Xinyang Teach. Coll. Nat. Sci. Ed. 2001, 14, 479–481. [Google Scholar] [CrossRef]
- Feng, J.; Long, D.C. A study on planning practice of resettlement residential area:a case of Beilun District, Ningbo. Urban Probl. 2006, 99–102. [Google Scholar] [CrossRef]
- Kendal, D.; Dobbs, C.; Lohr, V.I. Global patterns of diversity in the urban forest: Is there evidence to support the 10/20/30 rule? Urban For. Urban Gree 2014, 13, 411–417. [Google Scholar] [CrossRef]
- Sjoman, H.; Ostberg, J.; Buhler, O. Diversity and distribution of the urban tree population in ten major Nordic cities. Urban For. Urban Gree 2012, 11, 31–39. [Google Scholar] [CrossRef] [Green Version]
- Zainudin, S.; Mustafa, K.; Austin, D.; Helmy, J.; Lingkeu, D. Urban trees diversity in Kuching North City and UNIMAS, Kota Samarahan, Sarawak. Pertanika J. Trop. Agric. Sci. 2012, 35, 27–32. [Google Scholar]
- Tubby, K.V.; Webber, J.F. Pests and diseases threatening urban trees under a changing climate. Forestry 2010, 83, 451–459. [Google Scholar] [CrossRef] [Green Version]
- Jiang, X.L.; Wang, X.D.; Cui, Q.Y.; Sheng, C.J. Plant community diversity of the city parks of Hangzhou. J. Zhejiang For. Coll. 2011, 28, 416–421. [Google Scholar] [CrossRef]
- Huang, X.S.; Xu, Y.F.; Chen, P.K. An review on the living conditions of residents in resettlement communities in recent years. Rural Econ. Sci. Technol. 2015, 26, 198–200. [Google Scholar] [CrossRef]
- Li, J.; Wang, F.; Wuzhati, S.; Wen, B. Urban or village residents? A case study of the spontaneous space transformation of the forced upstairs farmers’ community in Beijing. Habitat Int. 2016, 56, 136–146. [Google Scholar] [CrossRef]
- Zhao, W.X.; Zou, Y.H. Un-gating the gated community: The spatial restructuring of a resettlement neighborhood in Nanjing. Cities 2017, 62, 78–87. [Google Scholar] [CrossRef]
- Algert, S.J.; Baameur, A.; Renvall, M.J. Vegetable Output and Cost Savings of Community Gardens in San Jose, California. J. Acad. Nutr. Diet. 2014, 114, 1072–1076. [Google Scholar] [CrossRef] [PubMed]
- Martin, G.; Clift, R.; Christie, I.; Druckman, A. The sustainability contributions of urban agriculture: Exploring a community garden and a community farm. In Proceedings of the 9th International Conference on Life Cycle Assessment in the Agri-Food Sector (LCA Food 2014), San Francisco, CA, USA, 8–10 October 2014; pp. 752–760. [Google Scholar]
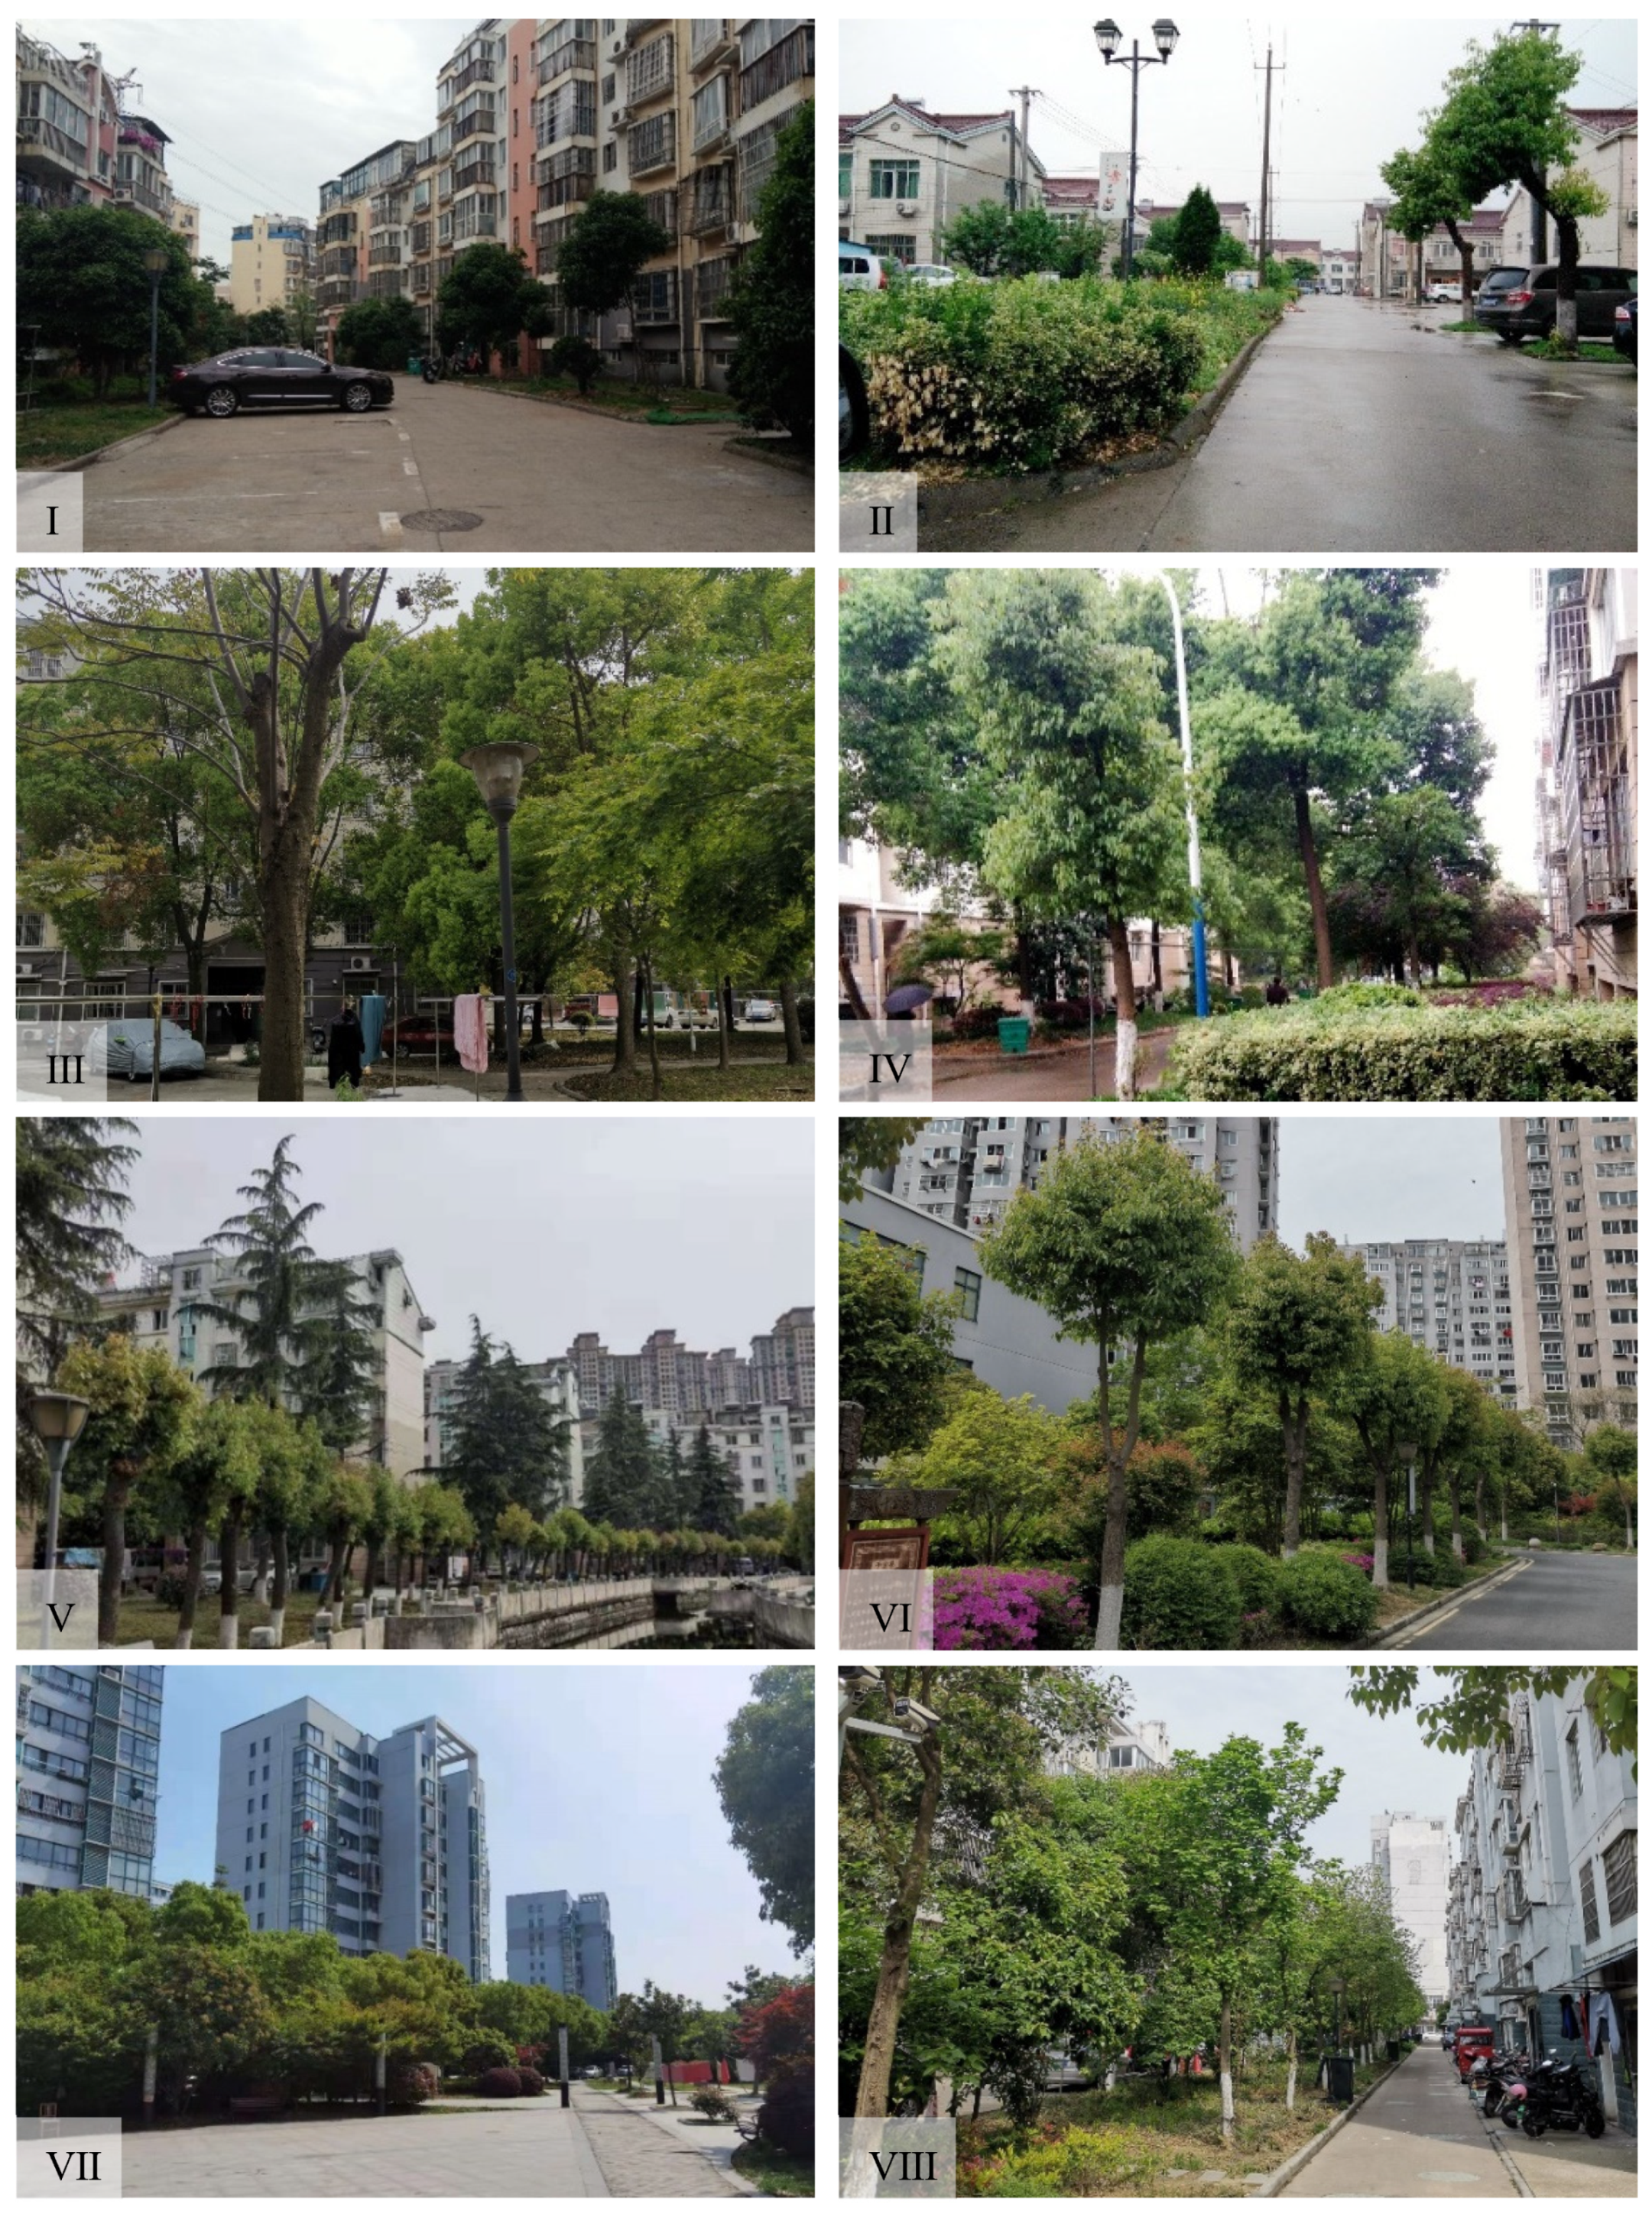
Figure 1.
Images of selected resettlement residential areas (RRAs) in Changzhou, including Group A ((I): Jiangnan Chunxiao; (II): Weitang Wucun; (III): Taishan Huayuan), Group B ((IV): Baixin Yuan; (V): Qianqiao Xiaoqu; (VI): Xinfeng Yuan), and Group C ((VII): Ziyun Yuan; (VIII): Qinglong Yuan).
Figure 1.
Images of selected resettlement residential areas (RRAs) in Changzhou, including Group A ((I): Jiangnan Chunxiao; (II): Weitang Wucun; (III): Taishan Huayuan), Group B ((IV): Baixin Yuan; (V): Qianqiao Xiaoqu; (VI): Xinfeng Yuan), and Group C ((VII): Ziyun Yuan; (VIII): Qinglong Yuan).

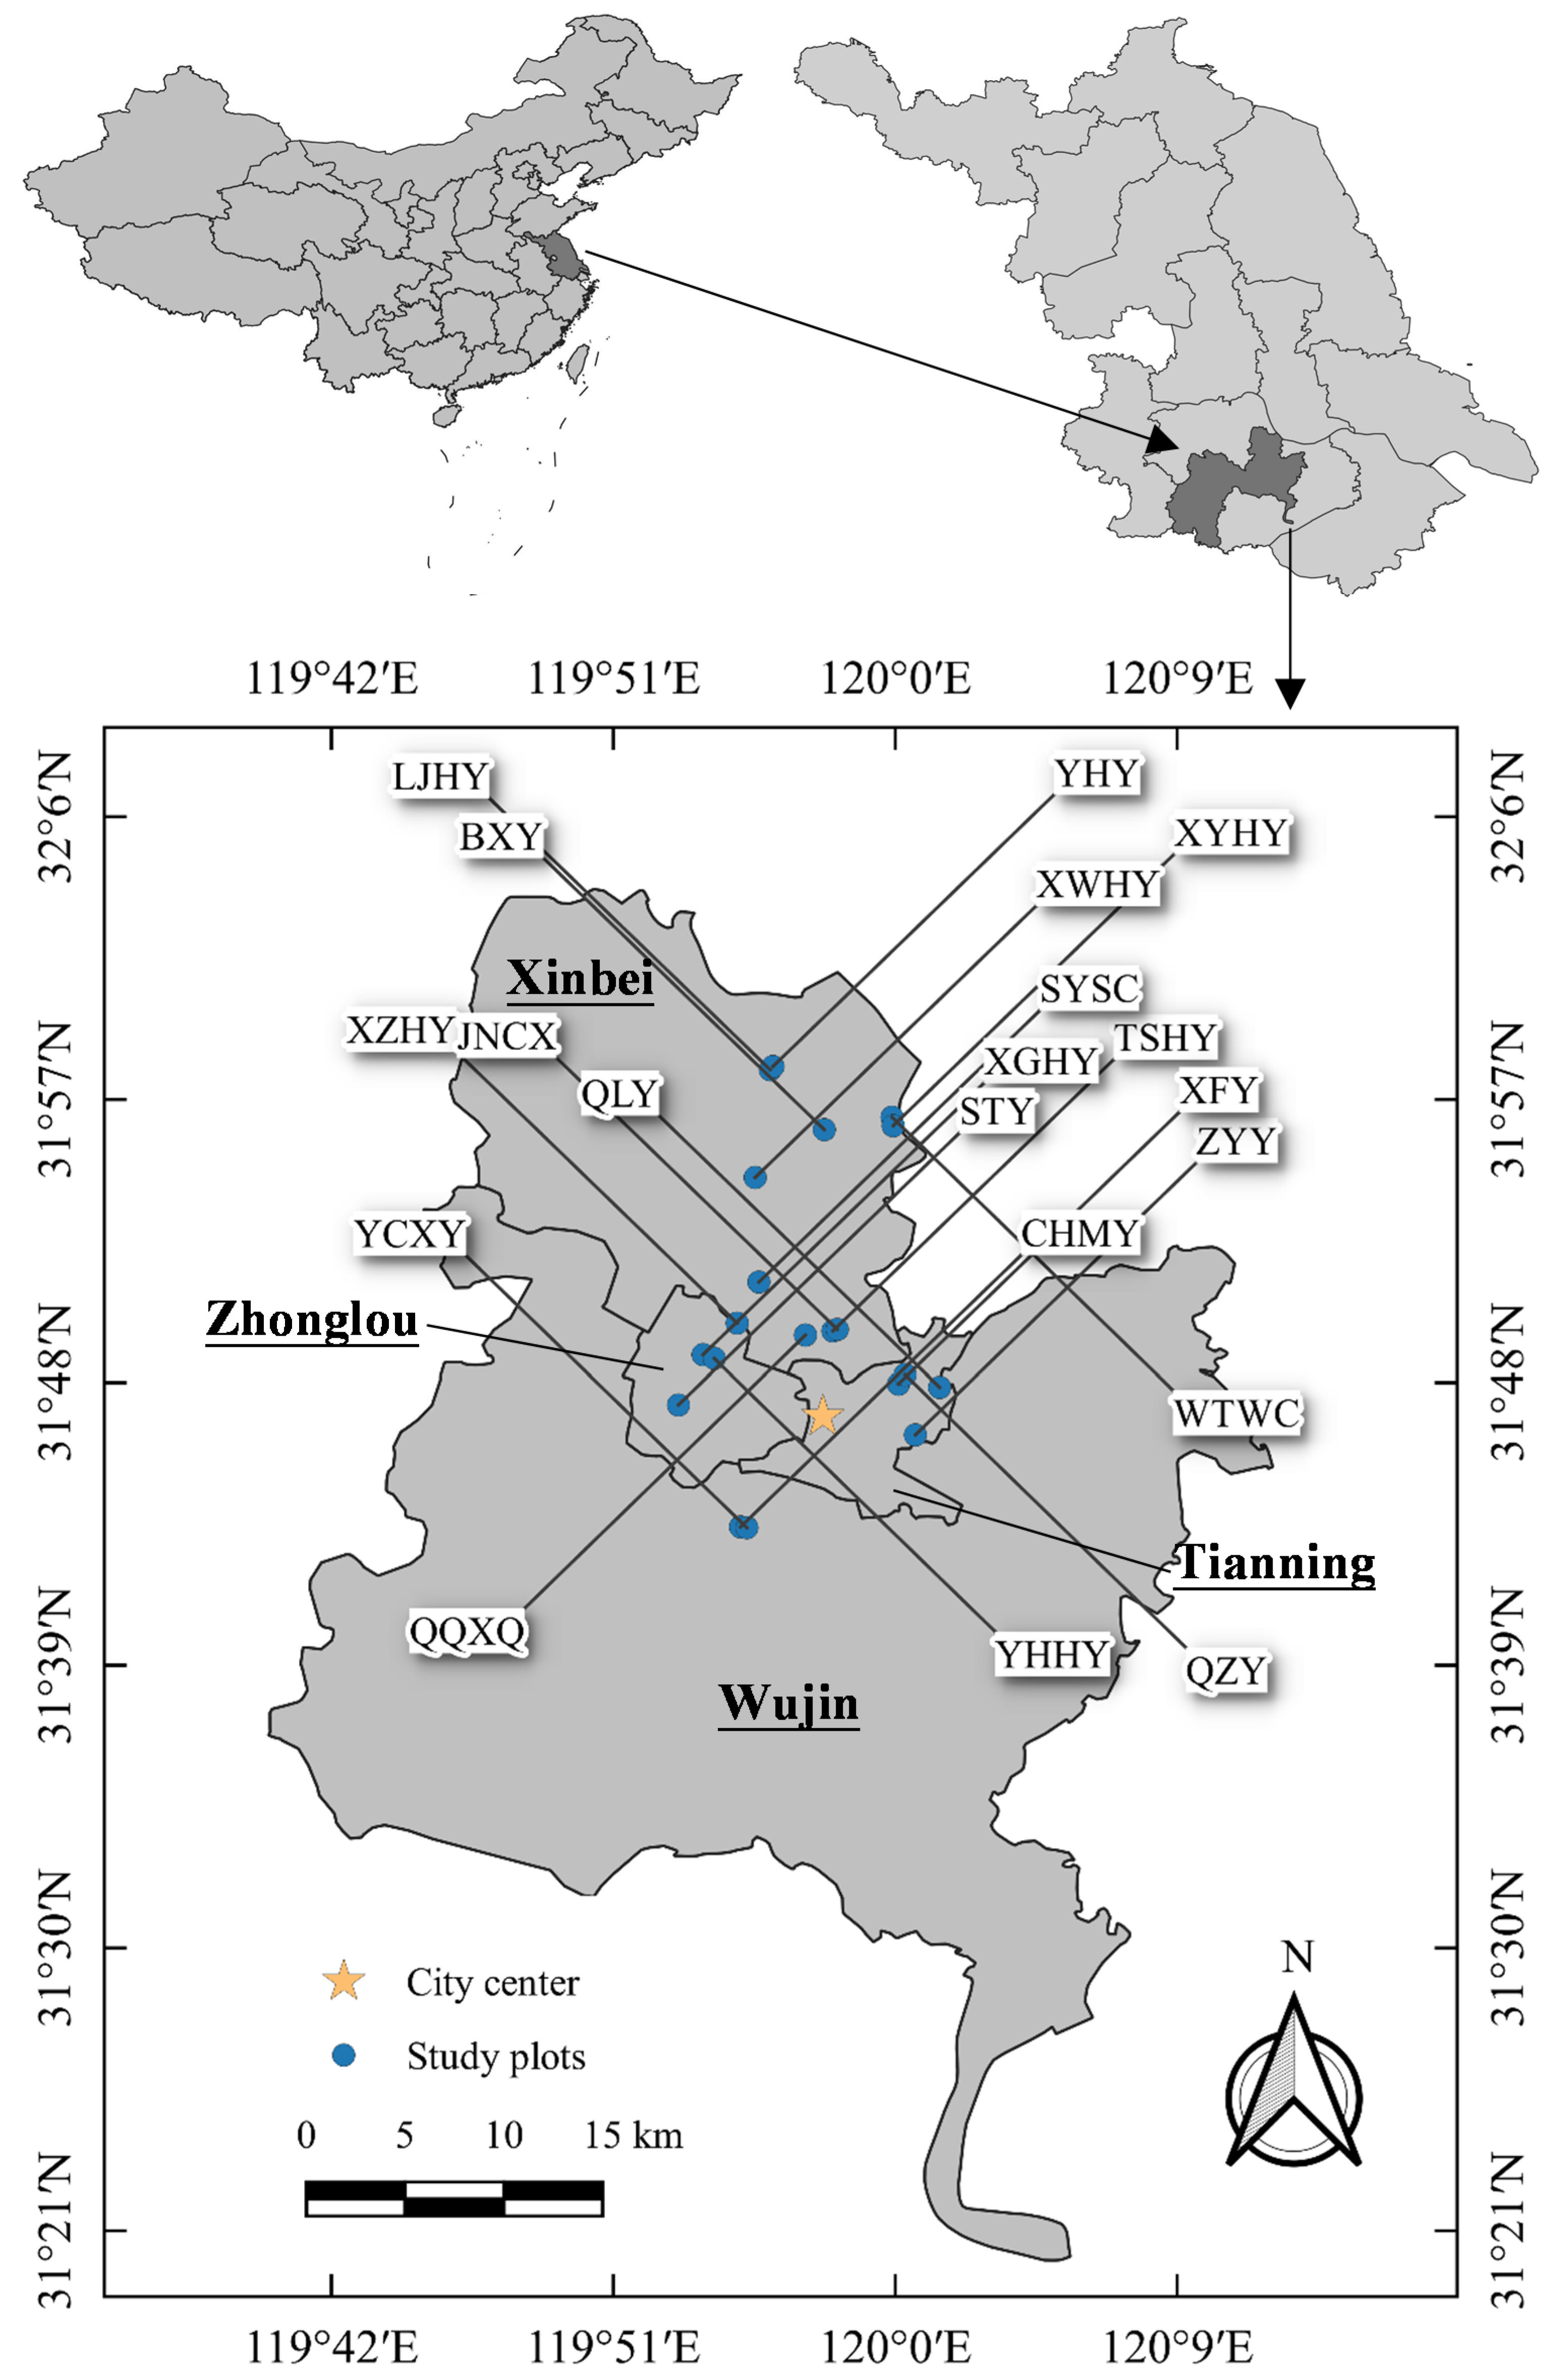
Figure 2.
Locations of the 20 sampled resettlement residential areas (RRAs) of Changzhou. Refer to Table 1 for the full names of the RRAs.
Figure 2.
Locations of the 20 sampled resettlement residential areas (RRAs) of Changzhou. Refer to Table 1 for the full names of the RRAs.

Figure 3.
Distribution of the tree species by botanical families in the resettlement residential areas of Changzhou. The numbers in brackets denote the number of species and the respective percentage of species out of the total number of species in each family.
Figure 3.
Distribution of the tree species by botanical families in the resettlement residential areas of Changzhou. The numbers in brackets denote the number of species and the respective percentage of species out of the total number of species in each family.

Figure 4.
Distribution of four dominant trees species by (a) cumulative DBH and (b) tree count in three chronological groups of resettlement residential areas (RRAs) in Changzhou.
Figure 4.
Distribution of four dominant trees species by (a) cumulative DBH and (b) tree count in three chronological groups of resettlement residential areas (RRAs) in Changzhou.

Figure 5.
Distribution of importance values of five dominant tree species from 1998 to 2016 in the resettlement residential areas (RRAs) of Changzhou. In the graphs, the blue, yellow, and green circles represent chronological Groups A, B, and C RRAs in Changzhou from early to recent periods, as explained in Table 1. The circle size denotes the magnitude of the importance value.

Figure 6.
The Shannon, Simpson, Margalef, and Pielou indices for tree species diversity in the three groups of resettlement residential areas in Changzhou.
Figure 6.
The Shannon, Simpson, Margalef, and Pielou indices for tree species diversity in the three groups of resettlement residential areas in Changzhou.

Figure 7.
Distribution pattern of tree DBH and height in the three groups of resettlement residential areas in Changzhou.
Figure 7.
Distribution pattern of tree DBH and height in the three groups of resettlement residential areas in Changzhou.


Table 1.
Basic information of the 20 sampled resettlement residential areas (RRAs) of Changzhou arranged in chronological order of completion year.
Table 1.
Basic information of the 20 sampled resettlement residential areas (RRAs) of Changzhou arranged in chronological order of completion year.
| No. | Name of RRA | Abbreviation | Group 1 | Completion Year | Distance from Downtown | District | Area/m2 × 105 | Number of Tree Species |
|---|---|---|---|---|---|---|---|---|
| 1 | Weitang Wucun | WTWC | A | 1998 | 18.6 | Xinbei | 1.6 | 7 |
| 2 | Jiangnan Chunxiao | JNCX | A | 2000 | 5.1 | Xinbei | 1.71 | 4 |
| 3 | Linjiang Huayuan | LJHY | A | 2001 | 21.2 | Xinbei | 1.35 | 4 |
| 4 | Yangtze Huayuan | YHY | A | 2001 | 20.5 | Xinbei | 1.63 | 6 |
| 5 | Xinggang Huayuan | XGHY | A | 2002 | 7.0 | Zhonglou | 1.22 | 6 |
| 6 | Shunyuan Sancun | SYSC | A | 2004 | 8.6 | Xinbei | 1.76 | 8 |
| 7 | Taishan Huayuan | TSHY | A | 2004 | 4.7 | Xinbei | 1.37 | 5 |
| 8 | Xinwei Huayuan | XWHY | B | 2006 | 14.3 | Xinbei | 2.03 | 7 |
| 9 | Xinyuan Huayuan | XYHY | B | 2007 | 17.3 | Xinbei | 2.88 | 4 |
| 10 | Xinza Huayuan | XZHY | B | 2007 | 7.0 | Zhonglou | 1.63 | 7 |
| 11 | Baixin Yuan | BXY | B | 2008 | 17.9 | Xinbei | 1.58 | 6 |
| 12 | Qianqiao Xiaoqu | QQXQ | B | 2010 | 4.8 | Xinbei | 1.75 | 6 |
| 13 | Xinfeng Yuan | XFY | B | 2010 | 4.2 | Tianning | 1.8 | 5 |
| 14 | Qionglong Yuan | QLY | C | 2012 | 6.2 | Tianning | 3.56 | 10 |
| 15 | Yancheng Xinyuan | YCXY | C | 2012 | 7.8 | Wujin | 1.14 | 8 |
| 16 | Changhong Mingyuan | CHMY | C | 2013 | 7.9 | Wujin | 1.14 | 6 |
| 17 | Ziyun Yuan | ZYY | C | 2013 | 4.7 | Tianning | 1.09 | 5 |
| 18 | Yunhe Huayuan | YHHY | C | 2014 | 6.3 | Zhonglou | 1.3 | 10 |
| 19 | Qiongzu Yuan | QZY | C | 2015 | 4.8 | Tianning | 1.24 | 6 |
| 20 | Songtao Yuan | STY | C | 2016 | 7.3 | Zhonglou | 4.1 | 8 |
1 A, B, and C denote building completion year before 2004, 2005–2010, and 2011–2016, respectively.
Table 2.
Cumulative relative abundance (RA) and importance value (IV) of individual species by three RRA groups and all sampled plots of resettlement residential areas in Changzhou.
Table 2.
Cumulative relative abundance (RA) and importance value (IV) of individual species by three RRA groups and all sampled plots of resettlement residential areas in Changzhou.
| Species | Family | Group IV | Integrated RA and IV | |||
|---|---|---|---|---|---|---|
| A | B | C | Cumulative RA | Total IV | ||
| Cinnamomum camphora | Lauraceae | 11.91 | 37.47 | 19.10 | 22.81 | 22.60 |
| Osmanthus fragrans | Oleaceae | 12.22 | 12.30 | 9.51 | 36.71 | 11.18 |
| Magnolia grandiflora | Magnoliaceae | 6.92 | 8.45 | 10.00 | 45.75 | 8.49 |
| Elaeocarpus glabripetalus | Elaeocarpaceae | 12.85 | 2.00 | 7.42 | 54.79 | 7.40 |
| Amygdalus persica | Rosaceae | 5.14 | 3.16 | 10.53 | 62.89 | 6.56 |
| Koelreuteria bipinnata | Sapindaceae | 8.00 | 2.19 | 3.94 | 68.02 | 4.63 |
| Trachycarpus fortunei | Palmae | 3.16 | 7.63 | - | 70.99 | 3.37 |
| Acer palmatum | Aceraceae | 1.69 | 1.86 | 4.86 | 73.82 | 2.99 |
| Eriobotrya japonica | Rosaceae | 4.57 | - | 2.06 | 75.98 | 2.23 |
| Prunus cerasifera f. atropurpurea | Rosaceae | 4.76 | 2.18 | - | 78.95 | 2.14 |
| Michelia maudiae | Magnoliaceae | 6.38 | - | - | 81.11 | 2.01 |
| Ulmus pumila | Ulmaceae | 1.10 | 1.90 | 2.69 | 82.86 | 1.96 |
| Zelkova schneideriana | Ulmaceae | - | - | 4.49 | 85.02 | 1.71 |
| Albizia julibrissin | Mimosaceae | 2.90 | - | 1.22 | 86.10 | 1.38 |
| Ligustrum lucidum | Oleaceae | - | 2.63 | 1.40 | 87.58 | 1.33 |
| Liriodendron chinense | Magnoliaceae | - | - | 3.35 | 88.80 | 1.28 |
| Lagerstroemia indica | Lythraceae | - | - | 3.19 | 90.42 | 1.24 |
| Metasequoia glyptostroboides | Taxodiaceae | 2.67 | - | 0.92 | 92.04 | 1.20 |
| Cedrus deodara | Pinaceae | 1.55 | 1.66 | - | 92.58 | 0.98 |
| Ginkgo biloba | Ginkgoaceae | - | - | 2.05 | 92.98 | 0.81 |
| Acer pictum subsp. Mono | Aceraceae | 1.16 | 1.42 | - | 93.39 | 0.77 |
| Taxodium distichum | Taxodiaceae | - | - | 1.89 | 93.79 | 0.75 |
| Ficus carica | Moraceae | 1.26 | 1.21 | - | 94.20 | 0.74 |
| Robinia pseudoacacia | Papilionaceae | - | 1.30 | 0.91 | 94.47 | 0.73 |
| Ulmus parvifolia | Ulmaceae | - | 1.29 | 0.90 | 94.74 | 0.73 |
| Broussonetia papyrifera | Moraceae | - | 1.23 | 0.88 | 95.01 | 0.70 |
| Magnolia denudata | Magnoliaceae | - | 2.08 | - | 95.68 | 0.61 |
| Sapindus saponaria | Sapindaceae | - | 1.56 | - | 95.95 | 0.46 |
| Melia azedarach | Meliaceae | - | - | 1.16 | 96.22 | 0.45 |
| Cerasus yedoensis | Rosaceae | - | - | 1.13 | 96.49 | 0.44 |
| Magnolia biondii | Magnoliaceae | 1.41 | - | - | 96.76 | 0.44 |
| Juniperus chinensis | Cupressaceae | 1.35 | - | - | 97.03 | 0.42 |
| Cerasus serrulata var. lannesiana | Rosaceae | - | - | 1.03 | 97.30 | 0.41 |
| Ilex cornuta | Aquifoliaceae | - | - | 1.02 | 97.57 | 0.40 |
| Populus sp. | Salicaceae | - | 1.34 | - | 97.71 | 0.39 |
| Pterocarya stenoptera | Juglandaceae | - | 1.33 | - | 97.84 | 0.38 |
| Pyrus calleryana | Rosaceae | 1.18 | - | - | 97.98 | 0.37 |
| Platanus × acerifolia | Platanaceae | 1.18 | - | - | 98.11 | 0.37 |
| Photinia serratifolia | Rosaceae | 1.18 | - | - | 98.25 | 0.37 |
| Armeniaca vulgaris | Rosaceae | - | 1.27 | - | 98.38 | 0.36 |
| Koelreuteria paniculata | Sapindaceae | - | - | 0.92 | 98.52 | 0.36 |
| Catalpa bungei | Bignoniaceae | - | - | 0.91 | 98.65 | 0.36 |
| Firmiana simplex | Sterculiaceae | - | 1.27 | - | 98.79 | 0.36 |
| Magnolia × soulangeana | Magnoliaceae | - | 1.27 | - | 98.92 | 0.36 |
| Taxodium distichum var. imbricatum | Taxodiaceae | - | - | 0.90 | 99.06 | 0.36 |
| Sophora japonica | Papilionaceae | 1.11 | - | - | 99.19 | 0.35 |
| Morus alba | Moraceae | 1.11 | - | - | 99.33 | 0.35 |
| Prunus salicina | Rosaceae | 1.10 | - | - | 99.46 | 0.34 |
| Armeniaca mume | Rosaceae | 1.09 | - | - | 99.60 | 0.34 |
| Myrica rubra | Myricaceae | 1.06 | - | - | 99.73 | 0.33 |
| Acer buergerianum | Aceraceae | - | - | 0.82 | 99.87 | 0.33 |
| Ilex chinensis | Aquifoliaceae | - | - | 0.81 | 100.00 | 0.33 |
Table 3.
Pearson’s correlation among tree species diversity indices and three attributes of resettlement residential area in Changzhou.
Table 3.
Pearson’s correlation among tree species diversity indices and three attributes of resettlement residential area in Changzhou.
| Diversity Index | Completion Year | Area | Distance from Downtown |
|---|---|---|---|
| S | −0.408 | 0.304 | −0.211 |
| Individuals | −0.378 | 0.121 | −0.394 |
| Simpson | −0.206 | 0.285 | 0.138 |
| Shannon | −0.297 | 0.308 | 0.017 |
| Pielou | 0.026 | 0.243 | 0.395 |
| Margalef | −0.307 | 0.311 | −0.084 |
Publisher’s Note: MDPI stays neutral with regard to jurisdictional claims in published maps and institutional affiliations. |
© 2021 by the authors. Licensee MDPI, Basel, Switzerland. This article is an open access article distributed under the terms and conditions of the Creative Commons Attribution (CC BY) license (https://creativecommons.org/licenses/by/4.0/).
Share and Cite
MDPI and ACS Style
Xie, C.; Jim, C.Y.; Yi, X.; Liu, D.; Guo, X. Spatio-Temporal Patterns of Tree Diversity and Distribution in Urban Resettlement Areas for Displaced Farmers. Forests 2021, 12, 766. https://0-doi-org.brum.beds.ac.uk/10.3390/f12060766
AMA Style
Xie C, Jim CY, Yi X, Liu D, Guo X. Spatio-Temporal Patterns of Tree Diversity and Distribution in Urban Resettlement Areas for Displaced Farmers. Forests. 2021; 12(6):766. https://0-doi-org.brum.beds.ac.uk/10.3390/f12060766
Chicago/Turabian StyleXie, Chunping, C. Y. Jim, Xiangui Yi, Dawei Liu, and Xu Guo. 2021. "Spatio-Temporal Patterns of Tree Diversity and Distribution in Urban Resettlement Areas for Displaced Farmers" Forests 12, no. 6: 766. https://0-doi-org.brum.beds.ac.uk/10.3390/f12060766
Note that from the first issue of 2016, this journal uses article numbers instead of page numbers. See further details here.