
Assessing the Ecological Value of an Urban Forest Park: A Case Study of Sinhua Forest Park in Taiwan


1
Innovation and Development Center of Sustainable Agriculture, Department of Forestry, National Chung Hsing University, 145 Xingda Rd., South Dist., Taichung City 40227, Taiwan
2
International Bachelor Program of Agribusiness, National Chung Hsing University, Taichung City 40227, Taiwan
*
Author to whom correspondence should be addressed.
Forests 2021, 12(6), 806; https://0-doi-org.brum.beds.ac.uk/10.3390/f12060806
Submission received: 11 May 2021
/
Revised: 11 June 2021
/
Accepted: 15 June 2021
/
Published: 18 June 2021
(This article belongs to the Special Issue Nature-Based Solutions in Urban Forestry Planning and Management)
Abstract
:Urban forests offer multiple functions: they can balance negative effects from the environment and provide the public with a place for leisure and recreation. Hence, urban forests are crucial to urban ecology and have been widely studied. In addition, relevant study results were applied for policymaking in urban development and forest park management. This study evaluated the ecological value of the Sinhua Forest Park and examined whether the socioeconomic background of participants influences their willingness to pay (WTP) for ecological conservation. Questionnaires were distributed to visitors in the Sinhua Forest Park in Tainan, Taiwan, and the payment card format of the contingent valuation method was employed to evaluate the ecological value. The results showed that the visitors had an annual WTP of $22.01 per person. However, when samples with protest responses were excluded, the WTP rose to $24.58. By considering the total number of visitors of a year, the total ecological value was $1,426,964.14/year and reached $1,593,257.31/year after excluding the protest samples. This study also analyzed participants’ within-variable socioeconomic background (e.g., gender and education) and discovered that male participants who are aged 60 years or older, with an education level of senior/vocational high school, and those who visited green spaces two to three times per week presented a high WTP score on average. A Tobit regression model was employed for examination, and the results indicated that participants’ education and frequency of visiting green spaces significantly influenced their WTP for the ecological conservation of the Sinhua Forest Park.
1. Introduction
Urban green spaces have been critical green elements in the metropolitan areas [1,2,3] and have been widely studied to allow the public to understand their functions and services. Lin and Lee [4] defined urban forests as suburban forests, urban parks, green spaces, and street trees in urban districts. An urban forest is usually a natural space next to a city [5]. Moreover, Kao [6] and McPherson et al. [7] proposed that urban forests have four major functions: climate regulation, engineering, architectural, and aesthetic benefits. Studies have assessed the benefits of urban forests, including reducing air pollution, purifying water, and providing landscape facilities and leisure areas [8,9,10]. Urban forests can be considered an essential environmental resource for improving the living environment, enabling residents to engage in outdoor recreation and connect with others [11,12]. Accordingly, urban forest planning and management should consider the value of urban forests and visitors’ preferences. Kabisch et al. [13] extensively studied the ecological importance of urban forests, but the relationship between urban residents and green spaces remains unclear and requires further studies. Visitors from different regions also have diverse preferences for forests [14]. For instance, biodiversity is the most influential factor in urban forest recreation choices for South Korean urban residents [14]. In Fuzhou, China, urban residents’ satisfaction with the facilities and services of urban forests significantly influences their willingness to visit [15].
The evaluation of urban forest recreational usage and facilities provides valuable information in urban development and forest park management [16,17,18]. Regarding the ecological value, many studies examine the ecological value of natural resources. For example, Ballesteros [19] discovered that corals are an indispensable factor for maintaining biodiversity and allow humans to obtain economic value from ecosystem services. Croitoru [20] analyzed the direct use value (e.g., wood and honey) and indirect use value (e.g., river basin protection and carbon sequestration) regarding forests in the Mediterranean region. Iranah et al. [21] investigated visitors’ WTP for maintaining biodiversity and forest protection for forests. Liu et al. [22] analyzed the economic value of an iconic urban heritage tree in Central Taiwan. With the development of urbanization, the ecological value of urban forests, which improve urban environmental quality and maintain urban biodiversity, have become important. Rosenberger et al. [23] conducted a survey on visitors’ attitudes and WTP for urban forest recreational fees in Corvallis in the United States of America. The contingent valuation method (CVM) is the most commonly used method for estimating the prices of nonmarket goods (e.g., wildlife and urban green spaces) [24] because intangible goods without a market price gain value from participants’ WTP and willingness to accept (WTA). In recent years, the CVM has been employed in environmental science. After being adopted by Davis [25], the CVM method has been used to evaluate the value of ecosystem services. For example, the economic value of urban forest amenities was evaluated by Tyrväinen et al. [26] through the CV method. The CV method was also adopted by Tian et al. [27] to access the urban green space conservation value.
The ecological value of the urban forest, which identifies the participants’ WTP in maintaining the urban forest area, has become important, but has not been explored in Taiwan. In this study, we conducted a study on accessing the ecological value of the urban forest in Taiwan. The Sinhua Forest Park was selected as the research site for two reasons. First, the Sinhua Forest Park is close to a water source protection area [28]. Its ecological value is more important than a normal urban forest. Second, the Sinhua Forest Park possesses the largest Swietenia macropnylla King forest in Taiwan. The strong carbon sequestration capability of this broadleaf forest makes the Sinhua Forest Park even more important under Taiwan’s CO2 emission reduction policy [28]. The socioeconomic backgrounds of participants were analyzed to evaluate the influences on their WTP for ecological conservation. The payment card format of the CVM was employed to evaluate the ecological value. Our main objectives were to (i) investigate the WTP for urban forest conservation of one of Taiwan’s important forest park, and (ii) examine the possible influencing factors of WTP. The results of this study would be beneficial to related authorities in forest maintenance and management.
2. Material and Methods
2.1. Research Area
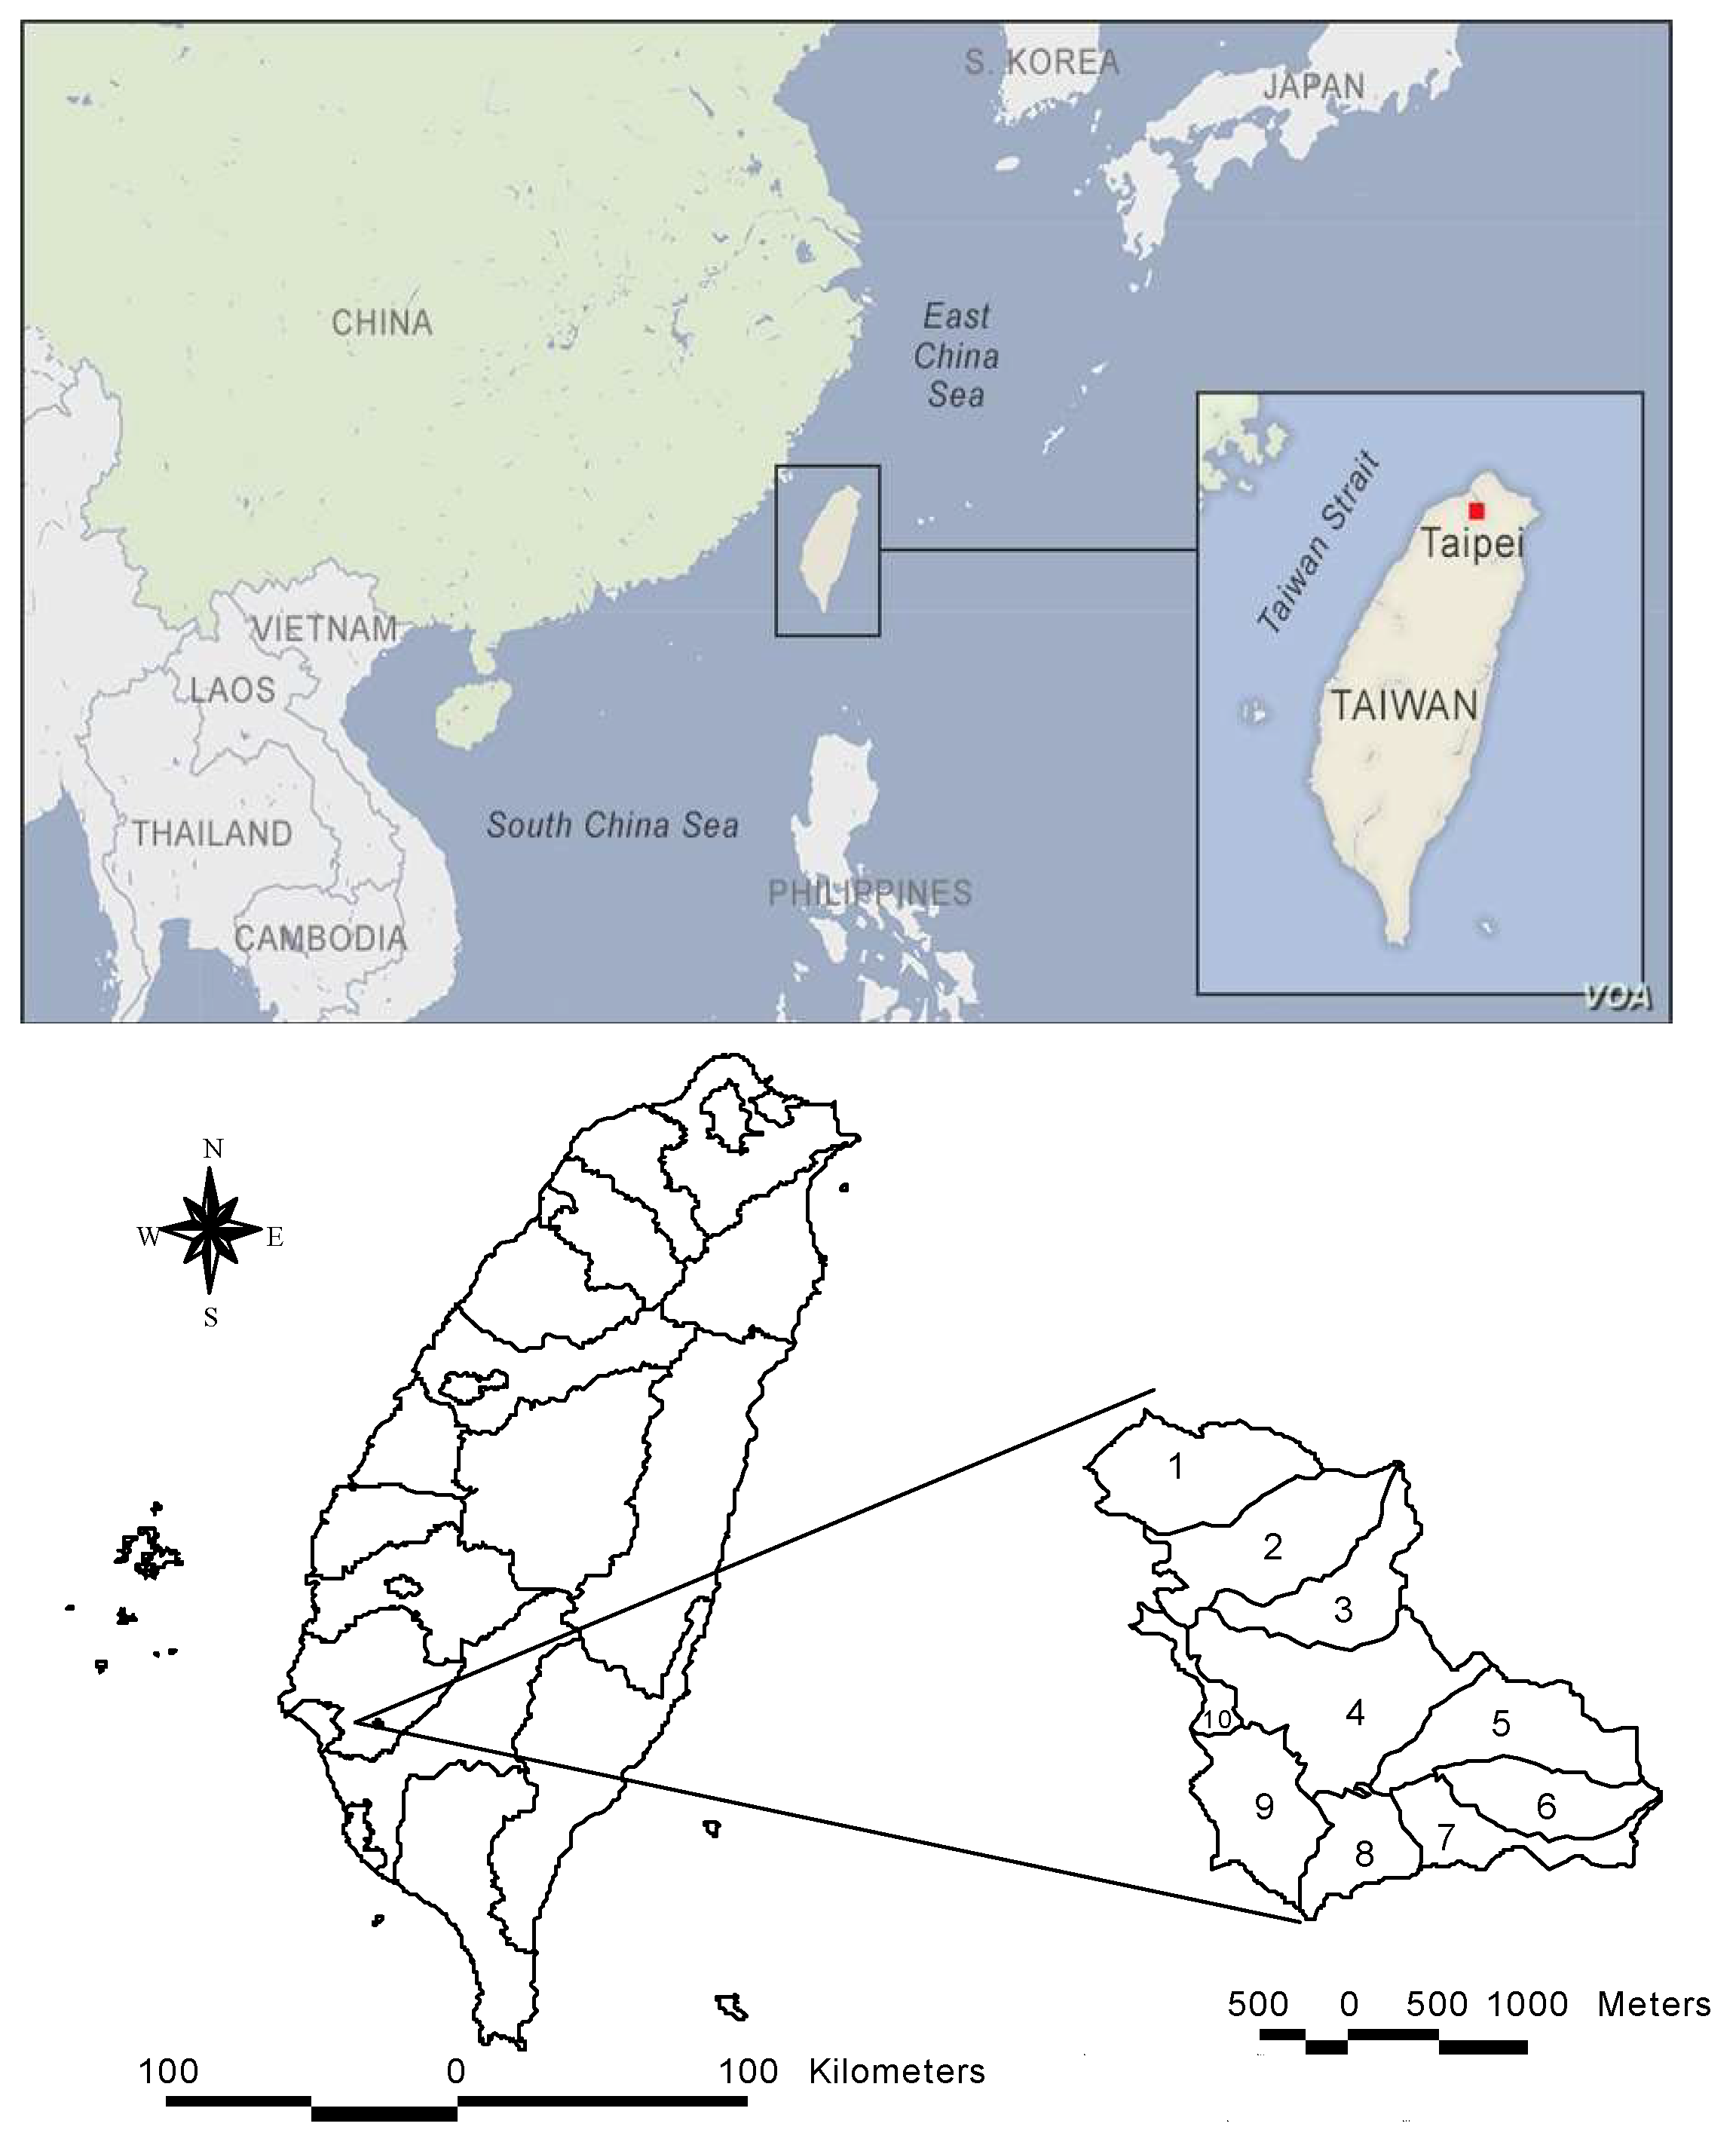
This study selected the Sinhua Forest Park in Tainan city, Taiwan as the research area. In February 2017, its official name changed from Sinhua National Botanical Garden to the Sinhua Forest Park of National Chung Hsing University. The forest park ranges from 120°21′39″ E to 120°23″ E and 23°1′54″ N to 23° N. It has a land area of 374 hectares and possesses the largest Swietenia macropnylla King forest in Taiwan. The region has a subtropical climate and distinct wet and dry seasons, with an annual mean temperature of approximately 23.3 °C and maximum temperature above 35 °C. From April to October, the temperature typically exceeds 30 °C, rainfall occurs for 80 to 90 days annually, and the annual rainfall is 1780 mm. The summer and winter are the rainy and dry seasons, respectively. Rainfall, which is mostly thunderstorms and typhoon rain, occurs between June and August; accordingly, rainfall in the region is distributed unevenly and is influenced by the seasons. Within the forest area, the lowest altitude is 35 m, and the highest ridge is Guanyin Mountain (153 m) in the seventh compartment. The overall area has a relatively flat hill terrain, except for several spots with steep slopes [28].
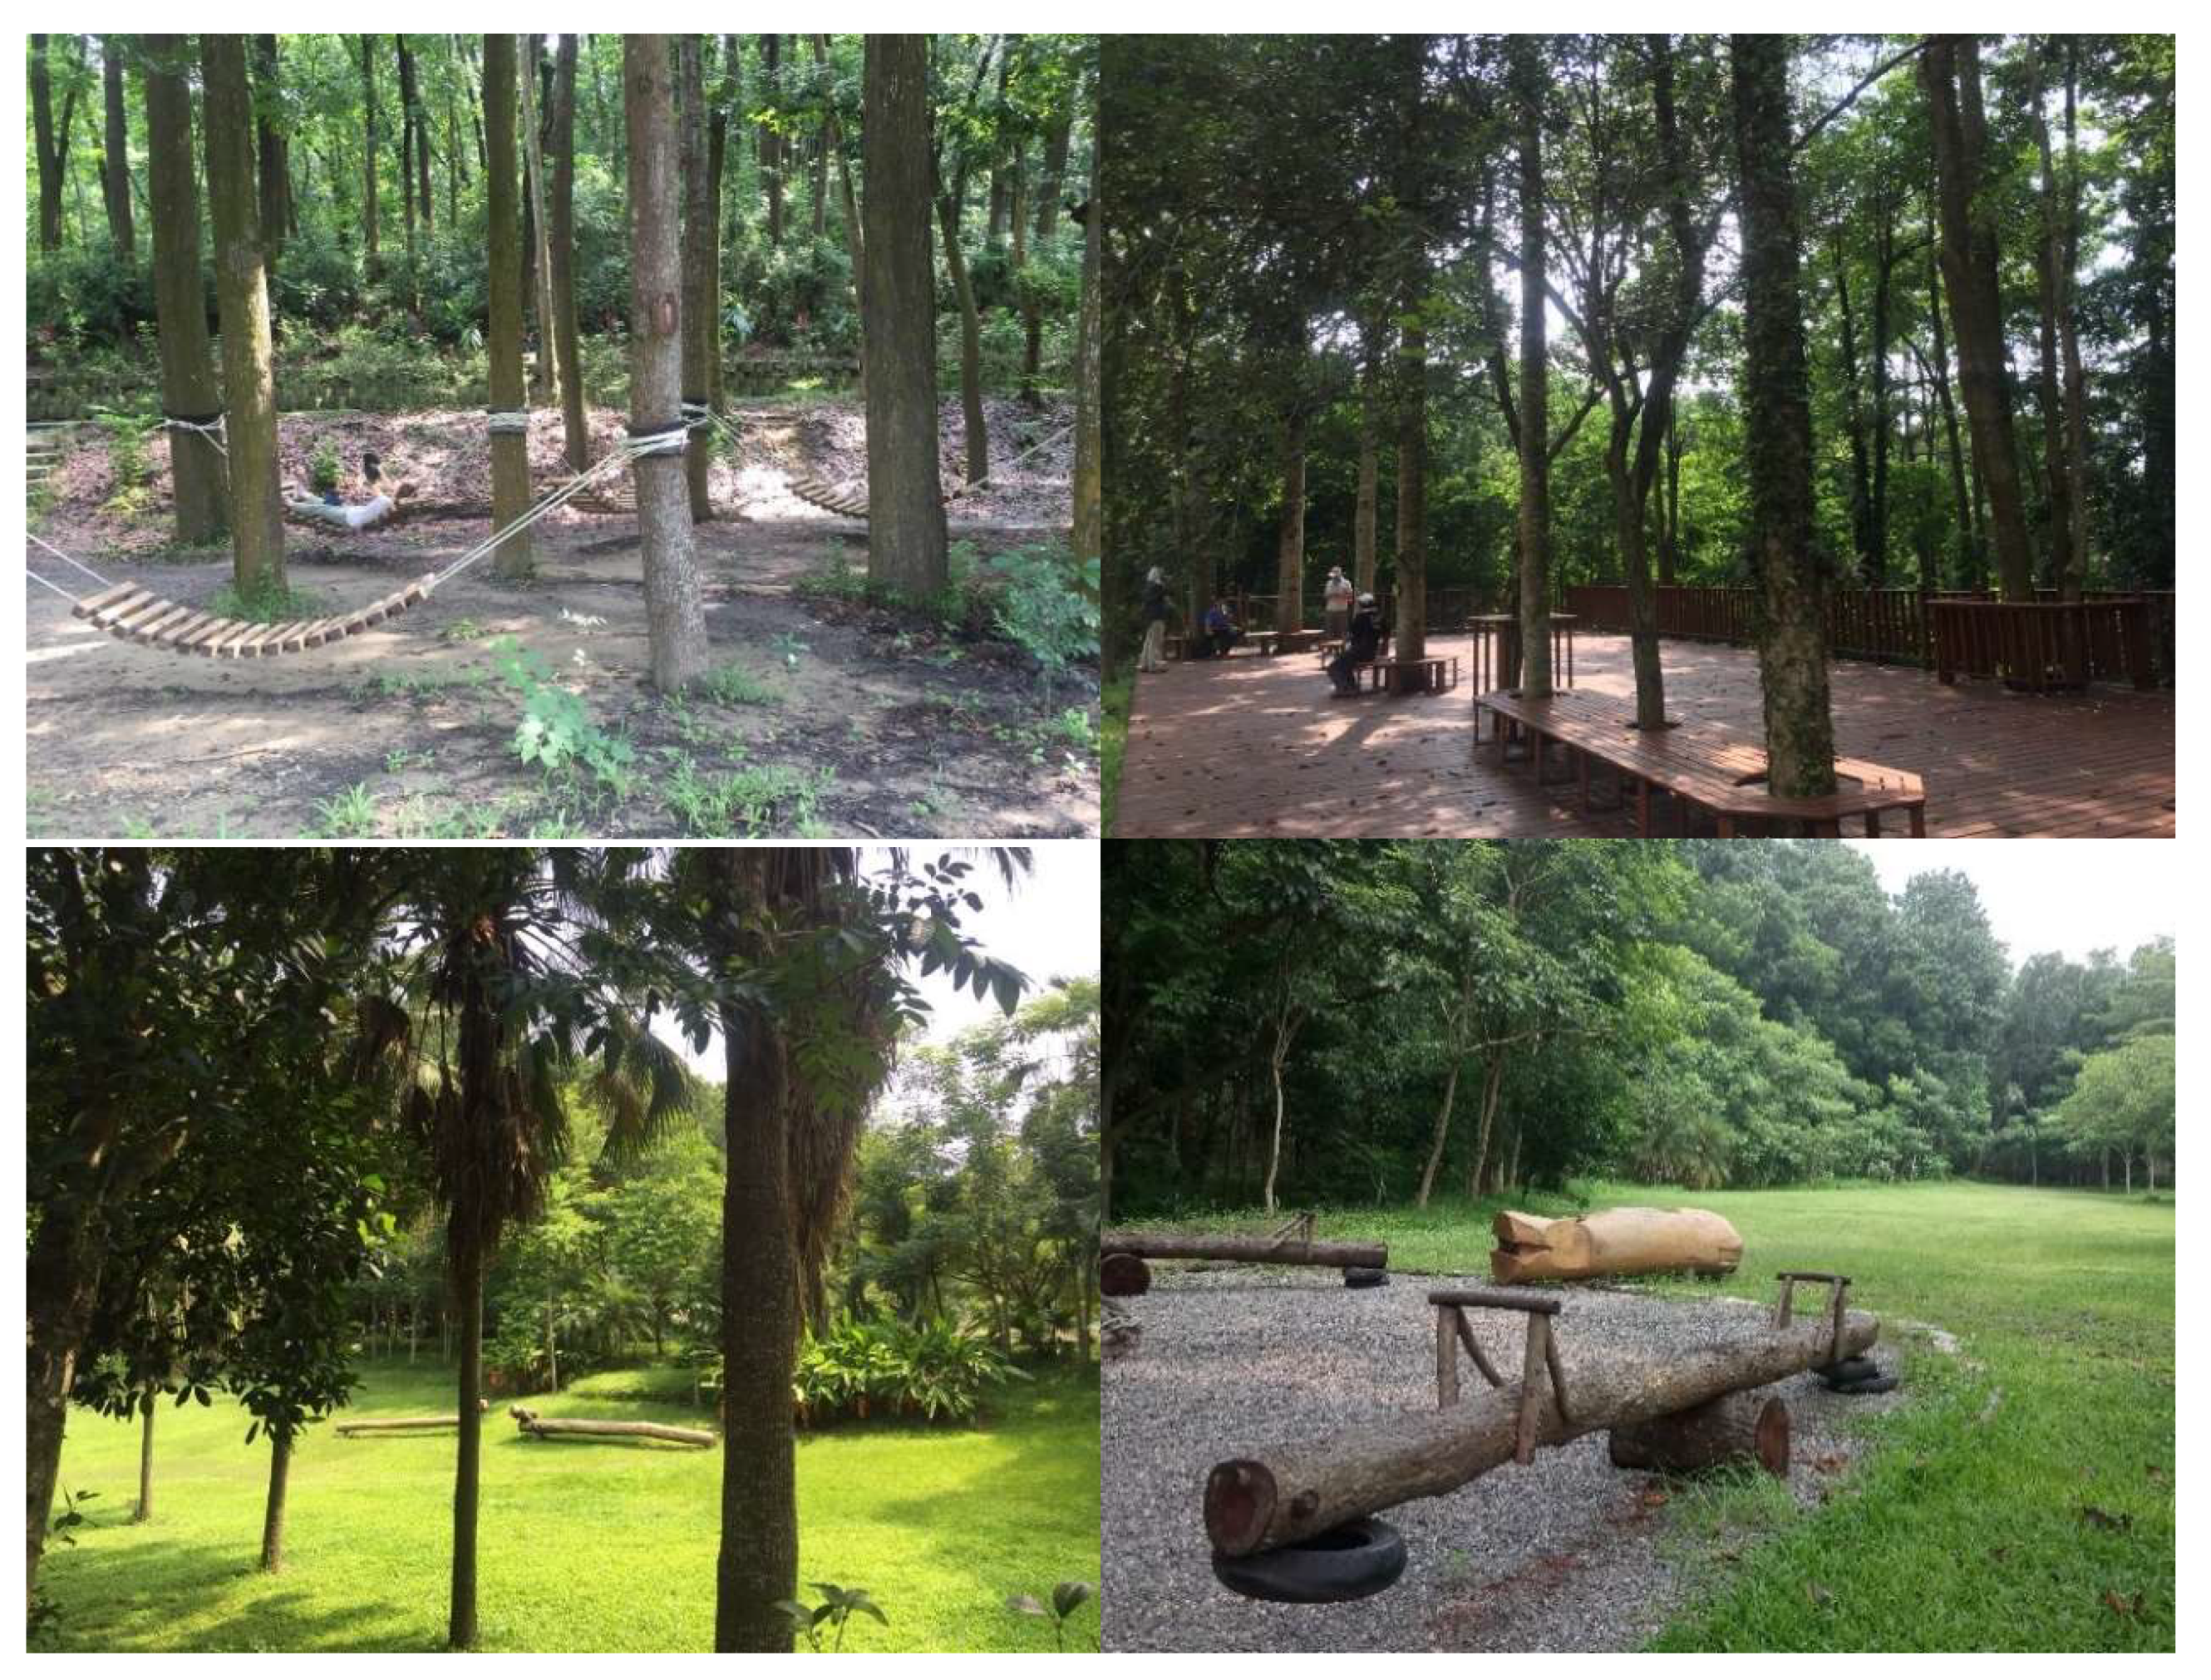
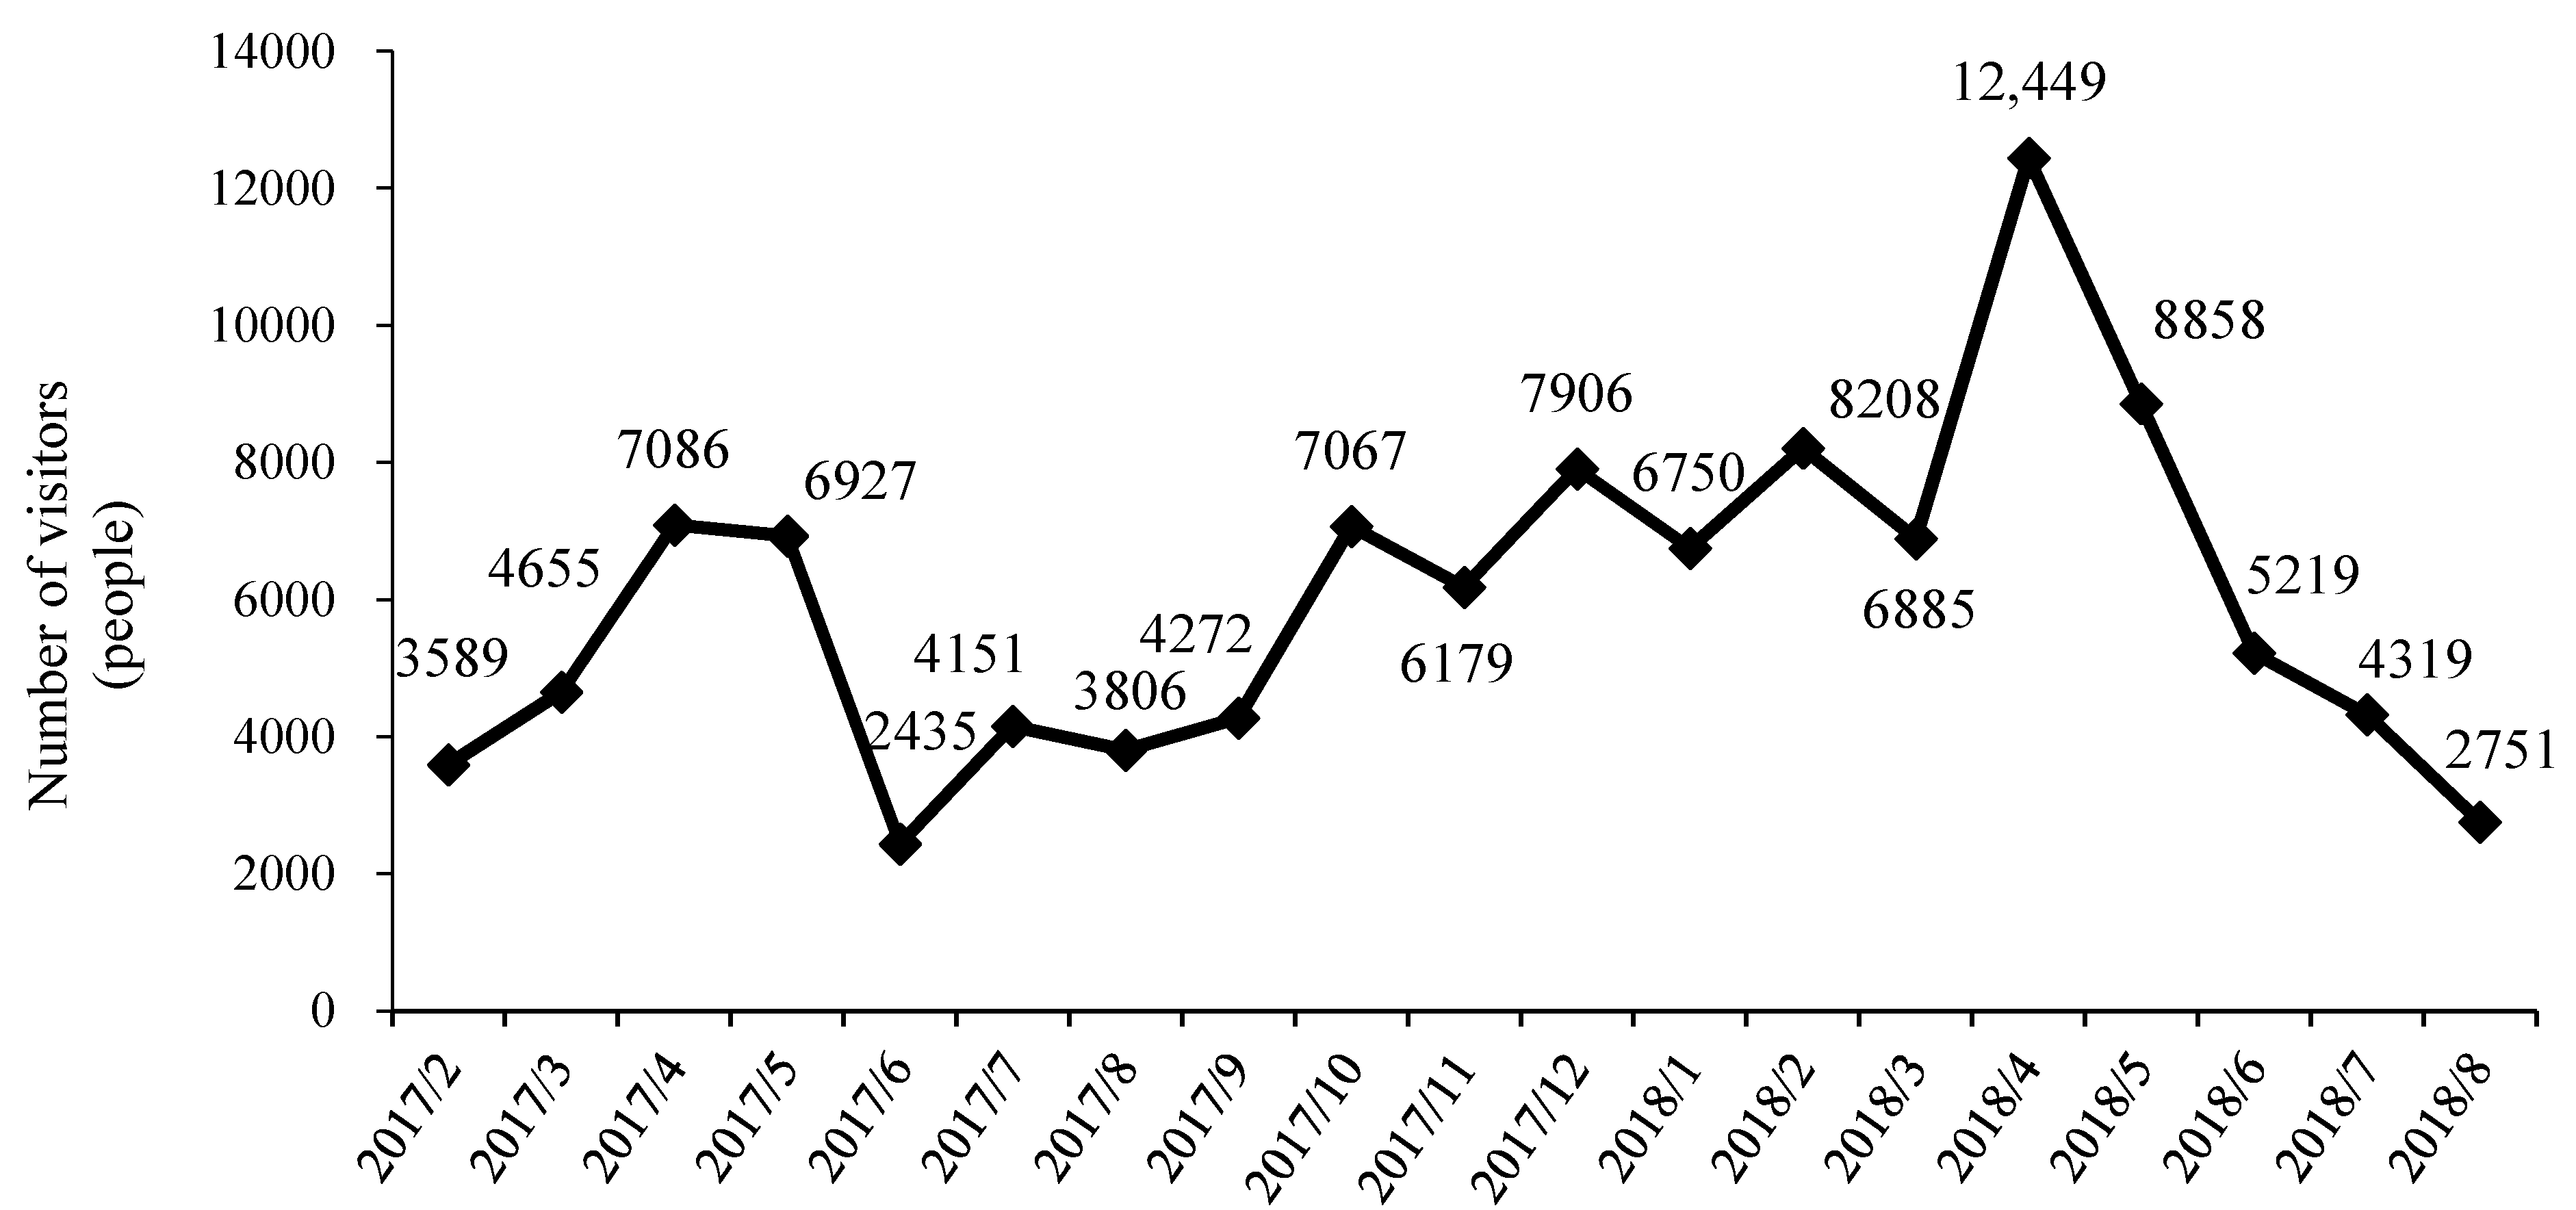
Figure 1 shows the position map of the Sinhua Forest Park including ten forestry compartments [29]. The Sinhua Forest Park is located in the Sinhua District of Tainan, which is close to the downtown area of Tainan with only a 10-min drive. This makes the Sinhua Forest Park a popular recreational place for city residents. Figure 2 shows the scenery of the Sinhua Forest Park. The park possesses a wide range of plants, such as S. macropnylla King, Tectona grandis, and Koelreuteria elegans, a litchi garden, and coffee plantations. The moderate tree density and quiet and comfortable environment make it favorable for recreation and bird watching activities in Tainan. Birds including Taiwan barbets, scops owls, and even crested serpent eagles can be spotted. With its diverse insect ecology, visitors can view fireflies during the firefly season in April. The Sinhua Forest Park has high ecological value and is suitable for ecological observation and teaching activities. Figure 3 presents the number of visitors to the Sinhua Forest Park from 15 February 2017 to 31 August 2018. The average annual and monthly visitors were 64,823 people and 5,974 people, respectively. More than 10,000 people visited in April 2018 because of forest road running and firefly viewing activities. Fewer people visited on average in July and August because of heavy rains in the rainy season.
2.2. Research Methods
The value of environmental resources, such as fresh air and natural landscapes, cannot be estimated through market information because they are not traded in the market. However, the CVM [30] can be applied to estimate nonmarket goods by: (1) selecting appropriate payment, inquiry, and survey methods in a hypothetical market; (2) asking participants their WTP for improving environmental benefits and protecting environmental assets through questionnaires; and (3) asking participants their WTA declining environmental benefits and damage to environmental assets. By conducting such a questionnaire survey, the participants were directly asked their WTP for increasing natural resources. The CVM has four categories: bidding game, open-ended, payment card, and closed-ended methods. When binary selection is applied, questions concerning “multiple bids” are likely to confuse participants and weaken their concentration on relevant questions [16]. The payment card method lists hypothetical questions, means of payment, and the amount of payment instead. It requires participants to select their WTP from the provided options. It also allows to efficiently estimate a small sample size and prevents participants from answering just “yes” or “no”, so participants can still estimate unfamiliar goods [31]. Therefore, the payment card method is preferred in this study.
After participants’ WTP was obtained, a Tobit censored regression model was employed to analyze factors influencing the ecological value of the Sinhua Forest Park. The Tobit model proposed by Tobit [32] is a limited dependent variable model developed by combining a Probit model and multiple-regression model. As the value of ecological conservation is a nonmarket good, participants may find it difficult to quantify the WTP with an exact value and subsequently mark their WTP as zero. The Tobit model has been widely applied to interpret zero values within the observation data [33,34,35,36].
This study implemented a descriptive statistical analysis on the NEP (new ecological paradigm) in the first part of the questionnaire (environmental conservation attitude and awareness). A five-point Likert scale, with 1 being strongly disagree and 5 being strongly agree, is utilized. The total score is between 15 and 75 points, with participants with high scores possessing a positive environmental attitude [37].
2.3. Questionnaire Design
Visitors to the Sinhua Forest Park were selected as participants. Questionnaires were distributed through the convenience sampling method [38]. Visitors under the age of 18 years were excluded to avoid invalid questionnaires. Table 1 shows the questionnaire design. The questionnaire consisted of four parts in the order of “environmental conservation attitude and awareness,” “WTP for ecological conservation,” “reasons for marking 0 for willingness to pay for ecological conservation,” and “participants’ socioeconomic background information.” Part I (environmental conservation attitude and awareness) applied a scale adapted from the NEP proposed by Dunlap [37]. Part II (WTP for ecological conservation) investigated participants’ WTP for the ecological conservation of the Sinhua Forest Park annually; specifically, the payment card format was adopted to identify the participants’ maximum WTP in maintaining the forest area. Part III (reasons for marking 0 for willingness to pay for ecological conservation) asked for their reasons with the following options for analysis of the protest samples: (1) the government should cover expenses through taxes; (2) my current financial status cannot afford the expense; (3) maintaining the ecological environment of the Sinhua Forest Park is irrelevant to me; (4) I do not trust the operators who maintain the ecological environment of the Sinhua Forest Park; (5) the information in the questionnaire is insufficient for me to decide; (6) I have no way of knowing whether the funds are used effectively; and (7) there are more important concerns than maintaining the ecological environment of the Sinhua Forest Park. Part IV (participants’ socioeconomic background information) contained questions concerning participants’ gender, age, education, income, occupation, marital status, region of residence, and frequency of visiting green spaces.
Table 2 shows the variable settings that follow the questionnaire. Four types of variables are used in this study, including the environmental conservation attitude and awareness, the WTP for ecological conservation, and the socioeconomic background. The five-point Likert scale is adopted for “the environmental conservation attitude and awareness.” The WTP is evaluated by USD. Regarding the socioeconomic background, dummy variables are applied to identify the personal information, such as gender and age.
3. Results and Discussion
3.1. Participants’ Socioeconomic Background
This study retrieved and analyzed 182 valid questionnaires, 140 of which were distributed on site. Table 3 shows the participants’ socioeconomic backgrounds and statistics. Participants aged 60 to 69 years (24.2%) with a university education level or above (75.3%) and a monthly income of less than $649.36 (44.5%) accounted for the most participants. In addition, only 3.8% of participants had joined environmental organizations.
Regarding the region of residence and marital status, the results of this study were similar to those of investigations conducted by Kao et al. [44] and Chang and Yen [45]. Visitors mostly lived in Tainan and were married (67%). Moreover, the urban forest research by Chen et al. [15] suggested that nearly all participants were locals, and this corresponded to the social economic results of this study in which 89% of visitors were local residents.
3.2. New Ecological Paradigm for Visitors
Table 4 shows the mean value of the NEP (for each item of part I in the questionnaire) with respect to the socioeconomic variable. The mean score of the NEP regarding visitors to the Sinhua Forest Park was 53.86. The standard deviations of a single question were 3.59, which was similar to the survey results of Yu et al. [39]. The results of this study indicated that visitors to the Sinhua Forest Park had a positive environmental attitude.
Environmental attitude indicates favorable and unfavorable feelings for the environment, which is often used for research regarding landscape preference and ecological value. It was applied to the current NEP by increasing the number of questions from 12 to 15 for modern life [46]. The questions were categorized into five dimensions: the reality of limits to growth, anti-anthropocentrism, the fragility of the natural balance, the rejection of exceptionalism, and the possibility of an ecocrisis.
3.3. WTP for the Ecological Conservation of the Sinhua Forest Park
Table 5 shows the WTP for ecological conservation with respect to the socioeconomic variable. The male participants aged 60 to 69 years with a monthly income below $649.36 and with an education level of senior high school and below had a high WTP score. In addition, those who were married and lived in Tainan presented higher WTP for ecological conservation than those who were single and lived in other regions. Visitors who participated in environmental organizations and visited green spaces one to three times per week also had a high mean WTP. Furthermore, more protest samples were identified among male participants and non-students, and this corresponded to the results of Yu and Abier’s [47] research in which male participants and non-students were likely to present protest ideas. This study collected 19 protest samples, which comprised 10.43% of total samples. Protest responses of “the government should cover expenses with taxes,” and “I have no way of knowing whether the funds are used effectively” accounted for the highest and second highest percentages, respectively. This was consistent with the research by Song et al. [24], in which the fundamental reason for protest ideas was derived from participants’ disbelief in the government. Afterwards, participants’ WTP for ecological conservation was taken as a dependent variable, and eight variables (gender, age, education, monthly income, marital status, region of residence, environmental organization participation, and frequency of visiting green spaces) were set as independent variables for an independent sample t-test and one-way analysis of variance (ANOVA) to detect the significant differences between variables. The analysis results revealed the significant effects of age (one-way ANOVA) and education (t-test) on WTP (p < 0.05) for the ecological conservation of the Sinhua Forest Park. However, the results of individual income were nonsignificant, which were inconsistent with the findings of Jim et al. [16], in which the WTP for urban space was significantly correlated with individual income.
This study evaluated the ecological value of the Sinhua Forest Park from participants’ WTP for ecological landscapes (e.g., tree-line trails, ecological pool, and S. macropnylla King forest), as listed in Table 5. The mean WTP of the overall participants was $22.01/year/person. Among the samples, 19 participants marked 0 for WTP because of protest ideas, including “the government should cover expenses with taxes” and “I have no way of knowing whether the funds are used effectively.” When the protest samples were excluded, the mean WTP per person increased to $24.58. According to the total visitors to the Sinhua Forest Park in 2017 (64,832 visitors), this study estimated that the ecological value of the Sinhua Forest Park totaled $1,426,964.14/year and reached $1,593,257.31/year when protest samples were excluded.
3.4. Tobit Regression Analysis on Ecological Value
This study defined participants’ WTP for ecological conservation as dependent variables and their socioeconomic background as independent variables for Tobit regression model analysis. The variables (gender, age, education, marital status, occupation, monthly income, region of residence, environmental organization participation, and frequency of visiting green spaces) were set as categorical variables; hence, additional dummy variables were selected. Table 6 shows the Tobit regression analysis results of ecological value regarding visitors to the Sinhua Forest Park. We divide environmental attitude (NEP) into five dimensions. The results revealed that education, frequency of visiting green spaces, and dimension 2 for environmental attitude (NEP) were significant. Among these variables, the education and ecological value of the Sinhua Forest Park presented a negative correlation: participants with an education level of university and above had a low WTP for ecological conservation. Moreover, the frequency of visiting green spaces (one to three times per month and two to three times per week) and dimension 2 of environmental attitude (NEP) were positively correlated with ecological value, and the significance increased after protest samples were excluded. This was similar to study the results of Song et al. [16] on WTP for green space protection in Jinan, China, in which the WTP was positively correlated with the frequency of visiting green spaces; the WTP increased as the frequency of visiting green spaces increased.
According to this, the ecological value of the Sinhua Forest Park was estimated to be $22.01 per person annually, and the total ecological conservation price was evaluated to be $1,426,964.14 per year based on the mean annual total visitors (i.e., 64,832 visitors) to the Sinhua Forest Park. Among the survey samples, the WTP of 19 samples was marked as 0. After examining the reasons, the 10 samples were determined to be protest samples in which participants believed that the ecological conservation of the Sinhua Forest Park is valuable but were unwilling to pay for conservation expenses. The protest samples mostly presented distrust in the government because of protest ideas, including “the government should cover expenses with taxes” and “I have no way of knowing whether the funds are used effectively.” The total ecological value of the Sinhua Forest Park reached $1,593,257.31 per year after the protest samples were excluded.
4. Discussion
Several findings drawn based on the results are discussed below. Frist, this study employed the NEP to inspect the attitudes of visitors to the Sinhua Forest Park, and the results revealed that the mean score of the paradigm was 53.86 and that of a single question was 3.59, which indicated that visitors to the Sinhua Forest Park had a positive environmental attitude. This implies that the managers or planners of the Sinhua Forest Park could promote forest recreation with environmental concern and environmental responsible behavior as a means of preserving green spaces, thus attracting new or returning visitors in the future as suggested by Høyem (2020) [48]. Second, the results show that age and frequency of visiting green spaces had a positive influence on visitors’ WTP for ecological conservation. The Sinhua Forest Park could target senior citizens and promote tour and lodging packages based on their frequency of visiting green spaces (two to three times per month and once per week) which in turn reinforces the visitors’ experiences and builds their loyalty. Lastly, consistent with previous literature on ecological value as presented in Table 7, this study also supports that the main ecological value constitutes the ecosystem services and biodiversity. Specifically, the ecological conservation value from this study was evaluated to be $22.01 per person per year, which was a similar value to Jim and Chen (2006) [16], Chen and Qi (2018) [15], etc.
5. Conclusions
This study also provided suggestions for future management planning or policy establishment besides the above discussion: (1) it is suggested to provide an ecological explanation guide. The Sinhua Forest Park possesses abundant natural resources, such as bird and insect species. However, visitors mostly go there for hiking or forest bathing activities. The forest area should offer guided services to introduce tree resources, insects, birds, and animals of the Sinhua Forest Park. (2) It is suggested to organize recreational activities in the fall. This study discovered that most visitors preferred to visit the Sinhua Forest Park during the fall; in addition, the forest area reached its highest number of visitors in April, 2018, when forest road running and firefly viewing activities were held. Hence, this study suggested that the forest area should launch a recreational activity combining ecological observation activities in the fall. (3) It is suggested to organize recreational activities depending on the characteristics of customer groups at different ages, such as holding parent–child activities to attract family visitors and planning camp activities to attract young people. (4) Follow-up studies should also include more variables, including the purpose of visiting the forest area, the length of stay, and mean annual visits to explore more significant factors. (5) Since Xinhua Forest Farm was taken over by the National Chung Hsing University in 2017, the number of tourists cannot currently be large (but it is growing year by year), so our number of questionnaires in 2018 is small. It is recommended that follow-up research increases the number of questionnaires to increase the credibility of the analysis.
Author Contributions
Three co-authors contributed to the completion of this article together. W.-Y.L. was the first author and contributed to conceptualizing the research framework, data analysis, the results and conclusions, and draft reviewing and editing; Y.-Z.L. mainly contributed to the conduction of research investigation, data analysis, and results and conclusions; C.-M.H. acted as a corresponding author on their behalf throughout the review, editing, and submission process. All authors have read and agreed to the published version of the manuscript.
Funding
This research was funded by Taiwan Ministry of Science and Technology, Reference No. MOST 108-2410-H-005-045-MY2, and MOST 107-2410-H-005-043-MY2.
Informed Consent Statement
Informed consent was obtained from all subjects involved in the study.
Data Availability Statement
The data presented in this study are available on request from the corresponding author. The data are not publicly available due to containing information that could compromise the privacy of research participants.
Conflicts of Interest
The authors declare no conflict of interest.
References
- Fornal-Pieniak, B.; Ollik, M.; Schwerk, A. Vascular flora of urban forests in a medium-sized city in Poland: Comparison with nature reserves in the city’s surrounding. Landsc. Res. 2020, 46, 246–260. [Google Scholar] [CrossRef]
- Fornal-Pieniak, B.; Ollik, M.; Schwerk, A. Impact of different levels of anthropogenic pressure on the plant species composition in woodland sites. Urban For. Urban Green. 2019, 38, 295–304. [Google Scholar] [CrossRef]
- Cameron, G.N.; Culley, T.M.; Kolbe, S.E.; Miller, A.I.; Matter, S.F. Effects of urbanization on herbaceous forest vegetation: The relative impacts of soil, geography, forest composition, human access, and an invasive shrub. Urban Ecosyst. 2015, 18, 1051–1069. [Google Scholar] [CrossRef]
- Lin, J.C.; Lee, K.C. Urban forest’s contribution to reducing carbon dioxide. Taiwan For. J. 2005, 31, 10–14. [Google Scholar]
- Konijnendijk, C.C. The Forest and the City-the Cultural Landscape of Urban Woodland; Springer: Berlin/Heidelberg, Germany, 2008; p. 245. [Google Scholar]
- Kao, C. Urban Forestry; Huaxiangyuan Publishing House: Taipei, Taiwan, 1989. [Google Scholar]
- McPherson, E.G.; Xiao, Q.; Doorn, N.S.; Goede, J.; Bjorkman, J.; Hollander, A.; Boynton, R.M.; Quinn, J.F.; Thorne, J.H. The structure, function and value of urban forests in California communities. Urban For. Urban Green. 2017, 28, 43–53. [Google Scholar] [CrossRef]
- Escobedo, F.; Kroeger, T.; Wagner, J.E. Urban forests and pollution mitigation: Analyzing ecosystem services and disservices. Environ. Pollut. 2011, 159, 2078–2087. [Google Scholar] [CrossRef] [PubMed]
- Konijnendijk, C.C. A decade of urban forestry in Europe. For. Policy Econ. 2003, 5, 173–186. [Google Scholar] [CrossRef]
- Konijnendijk, C.C.; Annerstedt, M.; Busse Nielsen, A.; Maruthaveeran, S. Benefits of Urban Parks, A Systematic Review; International Federation of Parks and Recreation Administration (IFPRA): Copenhagen, Denmark; Alnarp, Sweden, 2013. [Google Scholar]
- Marjo, N.; Tuija, S.; Susan, T.; Terhi, K. Access to green areas and the frequency of visits—A case study in Helsinki. Urban For. Urban Green. 2007, 6, 235–247. [Google Scholar]
- Zhang, H.; Chen, B.; Sun, Z.; Bao, Z.Y. Landscape perception and recreation needs in urban green spaces in Fuyang, Hangzhou, China. Urban For. Urban Green. 2013, 12, 44–52. [Google Scholar] [CrossRef]
- Kabisch, N.; Qureshi, S.; Haase, D. Human environment interactions in urban green spaces-a systematic review of contemporary issues and prospects for future research. Environ. Impact Assess. Rev. 2015, 50, 25–34. [Google Scholar] [CrossRef]
- Koo, J.C.; Park, M.S.; Youn, Y.C. Preferences of urban dwellers on urban forest recreational services in South Korea. Urban For. Urban Green. 2013, 12, 200–210. [Google Scholar] [CrossRef]
- Chen, B.; Qi, X. Protest response and contingent valuation of an urban forest park in Fuzhou City, China. Urban For. Urban Green. 2018, 29, 68–76. [Google Scholar] [CrossRef]
- Jim, C.Y.; Chen, W.Y. Recreation-amenity use and contingent valuation of urban greenspaces in Guangchou. Landsc. Urban Plan. 2006, 75, 81–96. [Google Scholar] [CrossRef]
- Kong, F.; Yin, H.; Nakagoshi, N. Using GIS and landscape metrics in the hedonic modeling of the amenity value of urban green space: A case study in Jinan City, China. Landsc. Urban Plan. 2007, 79, 240–252. [Google Scholar] [CrossRef]
- Lo, A.; Jim, J.Y. Willingness of residents to pay and motives for conservation of urban green spaces in the compact city of Hong Kong. Landsc. Urban Plan. 2010, 9, 113–120. [Google Scholar] [CrossRef] [Green Version]
- Ballesteros, E. Mediterranean coralligenous assemblages: A synthesis of present knowledge. Oceanogr. Mar. Biol. 2006, 44, 123–195. [Google Scholar]
- Croitoru, L. Valuing the non-timber forest products in the Mediterranean region. Ecol. Econ. 2007, 63, 768–775. [Google Scholar] [CrossRef]
- Iranah, P.; Lal, P.; Wolde, B.T.; Burli, P. Valuing visitor access to forested areas and exploring willingness to pay for forest conservation and restoration finance: The case of small island developing state of Mauritius. J. Environ. Manag. 2018, 223, 868–877. [Google Scholar] [CrossRef] [PubMed]
- Liu, W.Y.; Lin, H.W.; Chuang, Y.C. Assessing the economic value of an iconic urban heritage tree. For. Policy Econ. 2020, 118, 102216. [Google Scholar]
- Rosenberger, R.S.; Needham, M.D.; Morzillo, A.T.; Moehrke, C. Attitudes, willingness to pay, and stated values for recreation use fees at an urban proximate forest. J. For. Econ. 2012, 18, 271–281. [Google Scholar] [CrossRef]
- Song, X.; Lv, X.; Li, C. Willingness and motivation of residents to pay for conservation of urban green spaces in Jinan, China. Acta Ecol. Sin. 2015, 35, 89–94. [Google Scholar] [CrossRef]
- Davis, R.K. The Value of Outdoor Recreation: An Economic Study of the Maine Woods. Ph.D. Dissertation, Harvard University, Cambridge, MA, USA, 1963. [Google Scholar]
- Tyrväinen, L.; Väänänen, H. The economic value of urban forest amenities: An application of the contingent valuation method. Landsc. Urban Plan. 2018, 43, 105–118. [Google Scholar] [CrossRef]
- Tian, Y.; Wu, H.; Zhang, G.; Wang, L.; Zheng, D.; Li, S. Perceptions of ecosystem services, disservices and willingness-to-pay for urban green space conservation. J. Environ. Manag. 2020, 260, 110140. [Google Scholar] [CrossRef] [PubMed]
- Sinhua Forest Park. Climate and Soil. Available online: http://www.forest76.com.tw/html/page/index.aspx?pid=2&id=40 (accessed on 21 August 2019).
- Chang, J.Y.; Feng, F.L. A case study on landscape change of Shinhua Forest experimental station. Taiwan J. For. Sci. 2008, 30, 69–81. [Google Scholar]
- Ciriacy-Wantrup, S.V. Resource Conservation, Economics and Policies; Univesity of California Press: Berkeley, CA, USA, 1952. [Google Scholar]
- Boyle, K.J. Contingent valuation in practice. Primer Nonmarket Valuat. 2003, 576, 111–169. [Google Scholar]
- Tobin, J. Estimation of Relationships for Limited Dependent Variables. Econometrica 1958, 26, 24–36. [Google Scholar] [CrossRef] [Green Version]
- Chu, M.C.; Huang, I.P. Valuation of Ecosystem Services from Paddy Rice Field-Case Study from Yunlin, Chiayi, Tainan; Chinese Association of Agricultural Economics; National Chung Hsing University: Taichung, Taiwan, 2011; 25 p. [Google Scholar]
- Lin, Y.S. An Economic Evaluation of Ecosystem Service on Ilan Fishery Resource Conservation Zones. Master’s Thesis, National Taiwan Ocean University Institute of Marine Affairs and Resource Management, Ilan, Taiwan, 2013; 79 p. [Google Scholar]
- Wu, P.I.; Cheng, W.F.; Su, M.T. Model of multiple-hurdle with decision process: A possible resolution of protest responses in contingent valuation questions. Agric. Econ. 2004, 32, 29–69. [Google Scholar]
- Wu, P.I.; Deng, F.C. Examining of the relationship between citizen participation and willingness to pay for the ecotourism program design for the black-faced spoonbill protected area in Taiwan. J. Outdoor Recreat. Study 2003, 16, 41–70. [Google Scholar]
- Dunlap, R.E.; Van Liere, K.D.; Mertig, A.G.; Jones, R.E. New trends in measuring environmental attitudes: Measuring endorsement of the new ecological paradigm: A revised NEP scale. J. Soc. Issues 2000, 56, 425–442. [Google Scholar] [CrossRef]
- Scheaffer, R.L.; Mendenhall, W.; Ott, R.L.; Gerow, K.G. Elementary Survey Sampling, 7th ed.; Brooks/Cole: Boston, MA, USA, 2012. [Google Scholar]
- Yu, C.P.; Hsieh, L.P.; Chen, H.T. A study of willingness to pay (WTP) for conservation of natural resource at Erziping, Yangmingshan national park. J. Tour. Leis. Manag. 2017, 5, 13–32. [Google Scholar]
- Liu, W.Y.; Chen, P.Z.; Hsieh, C.M. Assessing the recreational value of national forest park from ecotourists’ perspective in Taiwan. Sustainability 2018, 11, 4083. [Google Scholar] [CrossRef] [Green Version]
- Liu, W.Y.; Lin, Y.Y.; Chen, H.S.; Hsieh, C.M. Assessing the amenity value of forest ecosystem services: Perspectives from the use of sustainable green spaces. Sustainability 2019, 11, 4500. [Google Scholar] [CrossRef] [Green Version]
- Chiang, C.H. Valuing Recreational Benefits of Tengjhih National Forest Recreation Area with Contingent Valuation Method; Department of Tropical Agriculture and International Cooperation: Neipu, Taiwan, 2010. [Google Scholar]
- Chen, W.Y.; Hua, J. Citizens’ distrust of government and their protest responses in a contingent valuation study of urban heritage trees in Guangzhou, China. J. Environ. Manag. 2015, 155, 40–48. [Google Scholar] [CrossRef] [PubMed]
- Kao, C.H.; Lee, J.S.; Peng, Y.C.; Tsai, W.J. A study on visitors’ satisfaction in national Shinhua arboretum. Q. J. For. Res. 2009, 31, 55–63. [Google Scholar]
- Chang, W.Y.; Yen, T.M. A comparison of visitors’ cognition on forest issues and environmental attitudes in different recreation areas: The case of Hsin-Hua and Hui-Sun forest stations. Q. J. For. Res. 2014, 36, 285–300. [Google Scholar]
- Dunlap, R.E. The new environmental paradigm scale: From marginality to worldwide use. J. Environ. Educ. 2008, 40, 3–18. [Google Scholar] [CrossRef]
- Yu, X.; Abler, D. Incorporating zero and missing responses into CVM with open ended bidding: Willingness to pay for blue skies in Beijing. Environ. Dev. Econ. 2010, 15, 535–556. [Google Scholar] [CrossRef]
- Høyem, J. Outdoor recreation and environmentally responsible behavior. J. Outdoor Recreat. Tour. 2020, 31, 100317. [Google Scholar] [CrossRef]
- Peterson, G. An Evaluation on Economic Benefit of Taroko National Park Ecological Resources Conservation. 2005. Available online: https://www.taroko.gov.tw (accessed on 8 February 2020).
- Kamri, T. Willingness to Pay for Conservation of Natural Resources in the Gunung Gading National Park, Sarawak. Procedia Soc. Behav. Sci. 2013, 101, 506–515. [Google Scholar] [CrossRef] [Green Version]
- Tamayo, N.C.A.; Anticamara, J.A.; Acosta-Michlik, L. National Estimates of Values of Philippine Reefs’ Ecosystem Services. Ecol. Econ. 2018, 146, 633–644. [Google Scholar] [CrossRef]
- Cook, D.; Eiríksdóttir, K.; Davíðsdóttir, B.; Kristófersson, D.M. The contingent valuation study of Heiðmörk, Iceland–Willingness to pay for its preservation. J. Environ. Manag. 2018, 209, 126–138. [Google Scholar] [CrossRef] [PubMed]
- Cook, D.; Davíðsdóttir, B.; Kristófersson, D.M. Willingness to pay for the preservation of geothermal areas in Iceland–The contingent valuation studies of Eldvörp and Hverahlíð. Renew. Energy 2018, 116, 97–108. [Google Scholar] [CrossRef]
Figure 1.
The position map of the Sinhua Forest Park in Taiwan. Source: Chang and Feng (2008) [29].
Figure 1.
The position map of the Sinhua Forest Park in Taiwan. Source: Chang and Feng (2008) [29].

Figure 2.
Landscapes of the Sinhua Forest Park.

Figure 3.
Monthly visitors to the Sinhua Forest Park Source: Sinhua Forest Park [29].
Figure 3.
Monthly visitors to the Sinhua Forest Park Source: Sinhua Forest Park [29].


Table 1.
Questionnaire design.
| Question | References | |
|---|---|---|
| Part I: Environmental attitudes (New ecological paradigm) | The current global population has reached the limit that Earth’s resources can sustain. Human intelligence will ensure that we do not make Earth uninhabitable. Animals and plants have the same right to live as do humans. The so-called “ecological crisis” that humans are facing has been exaggerated. The balance mechanism of nature is fragile and can be easily disturbed. Earth is like a spaceship with limited space and resources. Humans will eventually understand the mechanisms of nature and learn to control them. Humans have the right to change the natural environment for their own needs. Humans are seriously damaging the environment. The balance mechanism of nature can withstand the environmental impact of industrialized countries. If we know how to use resources properly, natural resources on Earth will remain sufficient. Although humans can change nature, we are still subject to its laws. Humans have the right to dominate any resource on Earth. If we continue with current practices, we will soon encounter a severe ecological catastrophe. When humans overly interfere with the environment, disastrous consequences often occur. | Dunlap et al. [37] Yu et al. [39] |
| Part II: WTP for ecological conservation | If the government established an ecology conservation fund for maintaining the ecological environment in the Sinhua Forest Park, how much would you be willing to pay or donate each year? (You do not have to pay the amount now.) | Chen et al. [15] Liu et al. [40] Liu et al. [41] |
| Part III: Reasons for marking 0 for willingness to pay for ecological conservation | The government should cover expenses with taxes. My current financial status cannot afford the expense. Maintaining the ecological environment of the Sinhua Forest Park is irrelevant to me. I do not trust the operators who maintain the ecological environment of the Sinhua Forest Park. The information in the questionnaire is insufficient for me to decide. I have no way of knowing whether the funds are used effectively. There are more important concerns than maintaining the ecological environment of the Sinhua Forest Park. | Chiang [42] Chen and Hua [43] Chen et al. [15] |
| Part IV: Participants’ socioeconomic background information | Gender Age Education Personal monthly income Occupation Marital status Region of residence Do you join organizations such as environmental protection groups or tree protection associations? How often do you go to natural environments (e.g., green spaces, parks, and forests) for leisure activities? | Jim and Chen [16] Kao et al. [44] Zhang et al. [12] |
Table 2.
Variable setting.
| Type | Variable | Code | Definition |
|---|---|---|---|
| Environmental conservation attitude and awareness | New ecological paradigm (15 questions) | QUESTIONS 1–15 | Five-point Likert scale (Strongly disagree = 1, Disagree = 2, Neutral = 3, Agree = 4, Strongly agree = 5) |
| WTP for ecological conservation | Willingness to pay | WTP | Continuous variable (USD) |
| Socioeconomic background | Gender | GENDER | Dummy variable (male = 1, female = 0) |
| Age | AGE | Continuous variable (age) | |
| Education | EDU | Dummy variable (university or above = 1, others = 0) | |
| Marital status | MARRIAGE | Dummy variable (married = 1, single = 0) | |
| Region of residence | AREA | Dummy variable (Tainan = 1, other regions = 0) | |
| Environmental organization participation | ORG | Dummy variable (yes = 1, no = 0) | |
| Frequency of visiting green spaces | GREENSPACE | Dummy variable (less than once per month = 1, one to three times per month = 2, once per week = 3, two to three times per week = 4, more than four to six times per week = 5) |
Table 3.
Participants’ socioeconomic statistics.
| Variable | Category | Number of People | Percentage (%) |
|---|---|---|---|
| Gender | Female | 95 | 52.2 |
| Male | 87 | 47.8 | |
| Age | 18 to 29 years | 43 | 23.6 |
| 30 to 39 years | 25 | 13.7 | |
| 40 to 49 years | 22 | 12.1 | |
| 50 to 59 years | 43 | 23.6 | |
| 60 to 69 years | 44 | 24.2 | |
| 70 years or older | 5 | 2.7 | |
| Education | University and above | 137 | 75.3 |
| Others | 45 | 24.7 | |
| Individual income per month (USD) | Less than 649.36 | 81 | 44.5 |
| 649.36 to 1,298.73 | 44 | 24.2 | |
| 1,298.73 to 1,948.09 | 33 | 18.1 | |
| 1,948.09 to 2,597.45 | 15 | 8.2 | |
| 2,597.45 to 3,246.82 | 7 | 3.8 | |
| More than 3,246.82 | 2 | 1.1 | |
| Occupation | Student | 30 | 16.6 |
| Military personnel, civil servants, and teachers | 10 | 5.5 | |
| Industry worker | 17 | 9.3 | |
| Businessperson | 17 | 9.3 | |
| Service industry worker | 38 | 20.9 | |
| Freelancer | 8 | 4.4 | |
| Agricultural, forestry, fishery, and animal husbandry worker | 3 | 1.6 | |
| Unemployed person | 3 | 1.6 | |
| Retiree | 47 | 25.8 | |
| Others | 9 | 4.9 | |
| Marital status | Single | 60 | 33.0 |
| Married | 122 | 67.0 | |
| Region of residence | Tainan | 162 | 89.0 |
| Other regions | 20 | 11.0 | |
| Environmental organization participation | No | 175 | 96.2 |
| Yes | 7 | 3.8 | |
| Frequency of visiting green spaces | Less than once a month | 60 | 33 |
| One to three times per month | 46 | 25.3 | |
| Once per month | 16 | 8.8 | |
| Two to three times per week | 20 | 11.0 | |
| Four to six times per week | 40 | 22.0 | |
| Favorite season to visit | Spring | 42 | 23.1 |
| Summer | 19 | 10.4 | |
| Fall | 73 | 40.1 | |
| Winter | 48 | 26.4 |
Note: The gray-highlighted parts are the highest of their corresponding variables.
Table 4.
Mean value of the NEP (for each item of part I in the questionnaire).
| Variable | Q1 | Q2 | Q3 | Q4 | Q5 | Q6 | Q7 | Q8 | Q9 | Q10 | Q11 | Q12 | Q13 | Q14 | Q15 | Total Score | |
|---|---|---|---|---|---|---|---|---|---|---|---|---|---|---|---|---|---|
| Gender | Female | 4.18 | 2.77 | 4.49 | 2.25 | 4.21 | 4.18 | 3.02 | 2.44 | 4.52 | 2.27 | 3.94 | 4.41 | 2.10 | 4.43 | 4.47 | 53.68 |
| Male | 4.34 | 3.01 | 4.39 | 2.22 | 4.27 | 4.21 | 2.93 | 2.54 | 4.52 | 2.19 | 4.12 | 4.42 | 2.13 | 4.33 | 4.47 | 54.09 | |
| Age | 18 to 29 years | 4.16 | 2.90 | 4.46 | 2.20 | 3.81 | 4.20 | 2.86 | 2.30 | 4.39 | 2.32 | 3.95 | 4.32 | 2.09 | 4.32 | 4.37 | 52.65 |
| 30 to 39 years | 4.24 | 3.72 | 4.44 | 2.20 | 4.20 | 4.16 | 3.24 | 2.60 | 4.64 | 2.44 | 4.20 | 4.20 | 2.12 | 4.44 | 4.44 | 55.28 | |
| 40 to 49 years | 4.00 | 2.81 | 4.36 | 2.27 | 4.22 | 4.18 | 3.22 | 2.09 | 4.40 | 2.27 | 3.68 | 4.13 | 1.90 | 4.09 | 4.31 | 51.93 | |
| 50 to 59 years | 4.27 | 2.69 | 4.48 | 2.53 | 4.39 | 4.25 | 3.20 | 2.48 | 4.51 | 2.27 | 4.04 | 4.53 | 2.20 | 4.51 | 4.55 | 54.90 | |
| 60 to 69 years | 4.45 | 2.59 | 4.45 | 2.00 | 4.50 | 4.18 | 2.54 | 2.86 | 4.70 | 2.00 | 4.15 | 4.61 | 2.18 | 4.38 | 4.45 | 54.04 | |
| 70 years or older | 4.60 | 3.20 | 4.20 | 2.20 | 4.60 | 4.20 | 3.40 | 2.00 | 4.20 | 2.00 | 4.20 | 4.80 | 2.00 | 4.80 | 5.00 | 55.40 | |
| Individual monthly income (USD) | Less than $649.36 | 4.29 | 2.64 | 4.45 | 2.07 | 4.23 | 4.20 | 2.72 | 2.53 | 4.49 | 2.17 | 4.01 | 4.48 | 2.04 | 4.38 | 4.40 | 53.10 |
| $649.36 to $1298.72 | 4.34 | 3.11 | 4.47 | 2.15 | 4.31 | 4.18 | 3.06 | 2.63 | 4.68 | 2.18 | 4.02 | 4.50 | 2.15 | 4.52 | 4.61 | 54.91 | |
| $1298.73 to $1948.09 | 4.15 | 3.06 | 4.45 | 2.33 | 4.12 | 4.06 | 3.18 | 2.57 | 4.3 | 2.24 | 4.12 | 4.24 | 2.21 | 4.27 | 4.39 | 53.69 | |
| $1948.10 to $2597.45 | 4.33 | 3.33 | 4.40 | 2.93 | 4.26 | 4.33 | 3.53 | 2.00 | 4.46 | 2.73 | 3.86 | 4.46 | 2.60 | 4.20 | 4.46 | 55.88 | |
| $2597.46 to $3246.82 | 3.71 | 2.71 | 4.14 | 2.85 | 4.42 | 4.42 | 3.42 | 2.00 | 4.57 | 2.28 | 4.28 | 3.85 | 1.42 | 4.71 | 4.71 | 53.49 | |
| More than $3246.82 | 4.50 | 2.50 | 4.50 | 2.00 | 4.00 | 5.00 | 2.00 | 1.50 | 5.00 | 2.00 | 4.00 | 4.50 | 1.50 | 3.50 | 3.00 | 49.50 | |
| Education | Senior/vocational high school and below | 4.46 | 3.00 | 4.53 | 2.15 | 4.35 | 4.35 | 3.08 | 2.55 | 4.55 | 2.20 | 4.17 | 4.64 | 2.22 | 4.44 | 4.46 | 55.15 |
| University and above | 4.19 | 2.85 | 4.41 | 2.27 | 4.20 | 4.15 | 2.94 | 2.46 | 4.51 | 2.24 | 3.98 | 4.34 | 2.08 | 4.36 | 4.45 | 53.43 | |
| Marital status | Single | 4.16 | 3.01 | 4.43 | 2.21 | 3.93 | 4.21 | 2.91 | 2.26 | 4.40 | 2.28 | 3.96 | 4.36 | 2.10 | 4.26 | 4.33 | 52.81 |
| Married | 4.31 | 2.82 | 4.45 | 2.25 | 4.39 | 4.19 | 3.00 | 2.59 | 4.59 | 2.21 | 4.06 | 4.44 | 2.13 | 4.44 | 4.51 | 54.38 | |
| Region of residence | Tainan | 4.30 | 2.88 | 4.41 | 2.18 | 4.26 | 4.19 | 2.96 | 2.48 | 4.55 | 2.14 | 4.03 | 4.42 | 2.10 | 4.40 | 4.48 | 53.78 |
| Others | 3.90 | 2.95 | 4.65 | 2.70 | 4.05 | 4.25 | 3.05 | 2.55 | 4.30 | 2.95 | 4.05 | 4.35 | 2.25 | 4.20 | 4.25 | 54.45 | |
| Environmental organization participation | No | 4.24 | 2.88 | 4.42 | 2.22 | 4.24 | 4.19 | 2.95 | 2.47 | 4.52 | 2.22 | 4.02 | 4.40 | 2.13 | 4.37 | 4.45 | 53.72 |
| Yes | 4.71 | 3.00 | 4.85 | 2.57 | 4.14 | 4.42 | 3.57 | 2.85 | 4.71 | 2.42 | 4.14 | 4.71 | 1.71 | 4.14 | 4.42 | 56.36 | |
| Frequency of visiting green spaces | Less than once per month | 4.15 | 2.88 | 4.33 | 2.40 | 4.05 | 4.18 | 3.01 | 2.28 | 4.41 | 2.13 | 3.93 | 4.30 | 2.08 | 4.41 | 4.48 | 53.02 |
| One to three times per month | 4.23 | 3.06 | 4.52 | 2.47 | 4.17 | 4.17 | 3.23 | 2.58 | 4.52 | 2.58 | 4.08 | 4.43 | 2.15 | 4.41 | 4.43 | 55.03 | |
| Once per week | 4.31 | 3.00 | 4.62 | 2.18 | 3.87 | 4.25 | 2.68 | 2.06 | 4.68 | 2.25 | 3.81 | 4.12 | 2.25 | 4.06 | 4.37 | 52.51 | |
| Two to three times per week | 4.25 | 2.35 | 4.65 | 2.00 | 4.45 | 4.60 | 2.15 | 2.25 | 4.60 | 2.05 | 4.10 | 4.70 | 1.80 | 4.45 | 4.40 | 52.80 | |
| Four to six times per week | 4.45 | 2.92 | 4.35 | 1.87 | 4.65 | 4.05 | 3.15 | 2.97 | 4.60 | 2.07 | 4.17 | 4.55 | 2.25 | 4.40 | 4.50 | 54.95 | |
| Sample | Total samples | 4.26 | 2.89 | 4.44 | 2.24 | 4.24 | 4.20 | 2.97 | 2.48 | 4.52 | 2.23 | 4.03 | 4.41 | 2.12 | 4.38 | 4.45 | 53.86 |
| Samples without protest responses | 4.28 | 2.85 | 4.42 | 2.18 | 4.28 | 4.22 | 2.92 | 2.48 | 4.53 | 2.22 | 4.04 | 4.42 | 2.08 | 4.40 | 4.47 | 53.79 |
Table 5.
WTP for ecological conservation with respect to socioeconomic variable.
| Total Samples | Samples without Protest Responses | Significance | ||||
|---|---|---|---|---|---|---|
| Sample Size | Willingness to Pay (USD/Person) | Sample Size | Willingness to Pay (USD/Person) | |||
| Gender | Female | 95 | 21.12 | 88 | 22.80 | 0.221 |
| Male | 87 | 22.98 | 75 | 26.65 | ||
| Age | 18 to 29 years | 43 | 16.14 | 41 | 16.92 | 0.014 * |
| 30 to 39 years | 24 | 18.06 | 22 | 20.14 | ||
| 40 to 49 years | 22 | 17.86 | 22 | 19.64 | ||
| 50 to 59 years | 42 | 19.98 | 34 | 24.68 | ||
| 60 to 69 years | 44 | 34.83 | 41 | 37.77 | ||
| 70 years or older | 5 | 17.53 | 5 | 17.53 | ||
| Individual monthly income(USD) | Less than $649.36 | 81 | 26.60 | 76 | 28.35 | 0.630 |
| $649.36 to $1298.72 | 44 | 15.35 | 39 | 18.39 | ||
| $1298.73 to $1948.09 | 33 | 21.74 | 27 | 26.58 | ||
| $1948.10 to $2597.45 | 15 | 18.40 | 12 | 23.00 | ||
| $2597.46 to $3246.82 | 7 | 24.12 | 7 | 24.12 | ||
| More than $3246.82 | 2 | 6.49 | 2 | 6.49 | ||
| Education | Senior/vocational high school and below | 45 | 35.79 | 42 | 38.34 | 0.004 ** |
| University and above | 137 | 17.48 | 121 | 19.79 | ||
| Marital status | Single | 60 | 15.87 | 55 | 17.31 | 0.117 |
| Married | 122 | 25.03 | 108 | 28.27 | ||
| Region of residence | Others | 20 | 14.69 | 16 | 18.36 | 0.186 |
| Tainan | 162 | 22.91 | 147 | 25.25 | ||
| Environmental organization participation | No | 175 | 21.87 | 157 | 24.38 | 0.117 |
| Yes | 7 | 25.51 | 6 | 29.76 | ||
| Frequency of visiting green spaces | Less than once per month | 60 | 18.25 | 55 | 19.91 | 1.403 |
| One to three times per month | 46 | 21.92 | 40 | 25.20 | ||
| Once per week | 16 | 28.31 | 14 | 32.35 | ||
| Two to three times per week | 20 | 34.42 | 18 | 38.24 | ||
| Four to six times per week | 40 | 19.03 | 40 | 21.15 | ||
| Total | 182 | 22.01 | 163 | 24.58 | - | |
Note: The gray-highlighted values are the highest of their corresponding variables. * indicates significance: * p < 0.05, and ** p < 0.01.
Table 6.
Tobit regression analysis results of ecological value regarding visitors to the Sinhua Forest Park.
Table 6.
Tobit regression analysis results of ecological value regarding visitors to the Sinhua Forest Park.
| Dimension | Total Samples | Samples without Protest Responses | |||
|---|---|---|---|---|---|
| Coefficient | Significance | Coefficient | Significance | ||
| Social economic background | Gender | −33.06 | 0.851 | 17.24 | 0.921 |
| Age | 3.40 | 0.719 | 9.423 | 0.330 | |
| Education | −731.20 | 0.001 ** | −610.22 | 0.005 ** | |
| Marital status | −34.06 | 0.484 | −35.13 | 0.459 | |
| Region of residence | 163.40 | 0.580 | 111.80 | 0.712 | |
| Environmental organization participation | 305.70 | 0.289 | 113.64 | 0.702 | |
| Individual monthly income | −54.02 | 0.907 | 28.71 | 0.951 | |
| Frequency of visiting green spaces | Once per month (GREEN 1) | 424.10 | 0.134 | 396.88 | 0.157 |
| Two to three times per month (GREEN 2) | 653.80 | 0.031 * | 722.83 | 0.016 * | |
| Once per week (GREEN 3) | 836.50 | 0.035 * | 958.02 | 0.018 * | |
| Two to three times per week (GREEN 4) | 310.70 | 0.352 | 443.22 | 0.176 | |
| Environmental attitude (New ecological paradigm) | Dimension 1 (Q1–Q3) | −140.60 | 0.518 | −239.47 | 0.266 |
| Dimension 2 (Q4–Q6) | 310.40 | 0.036 * | 251.86 | 0.088 | |
| Dimension 3 (Q7–Q9) | 67.03 | 0.659 | 97.45 | 0.533 | |
| Dimension 4 (Q10–Q12) | −58.22 | 0.735 | −138.87 | 0.449 | |
| Dimension 5 (Q13–Q15) | 264.00 | 0.149 | 260.22 | 0.157 | |
| a. Dependent variable: willingness to pay | |||||
Note: The gray-highlighted values are significant variables; * p < 0.05, and ** p < 0.01.
Table 7.
Studies on ecological value.
| Author (Year) | Research Area | Research Method | Ecological Value |
|---|---|---|---|
| Peterson et al. (2005) [49] | Taroko National Park, Taiwan | Contingent valuation method | 1283 (NTD/household) |
| Jim and Chen. (2006) [16] | Urban spaces in Guangzhou, China | Contingent valuation method | 17.40 (RMB/person/month) |
| Kamri (2013) [50] | Gunung Gading National Park, Malaysia | Contingent valuation method | 16.14 (MYR/person) |
| Song et al. (2015) [24] | Urban green spaces in Jinan, China | Contingent valuation method; payment card format | 81.81 (RMB/person/year) |
| Yu et al. (2017) [39] | Erziping Recreation Area, Yangmingshan National Park, Taiwan | Contingent valuation method | 55.2 (NTD/person) |
| Chen and Qi (2018) [15] | Fuzhou National Forest Park, China | Contingent valuation method | 13.79 (RMB/person) |
| Tamayo et al. (2018) [51] | Coral reefs and coastal marine resources in the Philippines | Travel cost method; estimation of willingness to pay for biodiversity | 140,000 (USD/km2/year) |
| Cook et al. (2018a) [52] | Heiðmörk, Iceland | Contingent valuation method | 17,039–24,790 (ISK/person) |
| Cook et al. (2018b) [53] | Eldvörp, Iceland Hverahlíð, Iceland | Contingent valuation method | 2.1 billion (ISK/year) 17.7 billion (ISK/year) |
| Iranah et al. (2018) [21] | Republic of Mauritius in East Africa | Contingent valuation method | Foreign visitors: $7.73 (person) Domestic visitors: $3.74 (person) |
Source: this study.
Publisher’s Note: MDPI stays neutral with regard to jurisdictional claims in published maps and institutional affiliations. |
© 2021 by the authors. Licensee MDPI, Basel, Switzerland. This article is an open access article distributed under the terms and conditions of the Creative Commons Attribution (CC BY) license (https://creativecommons.org/licenses/by/4.0/).
Share and Cite
MDPI and ACS Style
Liu, W.-Y.; Lin, Y.-Z.; Hsieh, C.-M. Assessing the Ecological Value of an Urban Forest Park: A Case Study of Sinhua Forest Park in Taiwan. Forests 2021, 12, 806. https://0-doi-org.brum.beds.ac.uk/10.3390/f12060806
AMA Style
Liu W-Y, Lin Y-Z, Hsieh C-M. Assessing the Ecological Value of an Urban Forest Park: A Case Study of Sinhua Forest Park in Taiwan. Forests. 2021; 12(6):806. https://0-doi-org.brum.beds.ac.uk/10.3390/f12060806
Chicago/Turabian StyleLiu, Wan-Yu, Yo-Zheng Lin, and Chi-Ming Hsieh. 2021. "Assessing the Ecological Value of an Urban Forest Park: A Case Study of Sinhua Forest Park in Taiwan" Forests 12, no. 6: 806. https://0-doi-org.brum.beds.ac.uk/10.3390/f12060806
Note that from the first issue of 2016, this journal uses article numbers instead of page numbers. See further details here.