
Regeneration Dynamics on Treefall Mounds and Pits for 10 Years after a Windfall in a Natural Mixed Forest


Nayoro Forest Office, Field Science Center for Northern Biosphere, Hokkaido University, Sapporo 096-0014, Hokkaido, Japan
Forests 2021, 12(8), 1064; https://0-doi-org.brum.beds.ac.uk/10.3390/f12081064
Submission received: 30 June 2021
/
Revised: 6 August 2021
/
Accepted: 6 August 2021
/
Published: 10 August 2021
(This article belongs to the Special Issue Ecophysiology of Forest Succession under Changing Environment)
Abstract
:The treefall mounds and pits resulting from uprooting caused by strong winds is an indispensable microtopography for the regeneration of many tree species through improved light conditions and mineral soil exposure. These microtopographies are expected to become more important because global warming is predicted to increase windstorm frequency. This study aimed to clarify the characteristics of mounds and pits that contribute to the early establishment of major tree species in a natural mixed forest of northern Japan. The 39 tip-up mounds caused simultaneously by a strong typhoon in September 2004 were selected. In 2006, light intensity and soil moisture contents were measured in each mound and pit. Seedlings of all tree species were counted, and in 2014, the height of saplings was measured. The initial seedling density, regardless of tree species, was significantly higher in the pits than on the mound, but the density at the 10-th growing season decreased significantly in the pits and was comparable between the two locations. Intense light conditions favor regeneration of Betula sp. (Betula platyphylla and B. ermanii). In contrast, for Abies sachalinensis and Picea glehnii, the light intensity had a negative effect, so it was concluded that regeneration of conifers would be limited under the condition where strong winds form large gaps.
1. Introduction
In forest ecosystems, natural disturbances drive the dynamics of forest communities and populations [1]. For example, strong winds, one of the major natural disturbance events, bring treefalls, including trunk breakage and uprooting. In particular, tip-up mounds formed by uprooting provide important new microtopography for tree regeneration by significantly changing the environmental characteristics of the forest floor, such as improved light conditions and exposure of mineral soils [2]. In general, it is well known that this microtopography promotes the colonization of pioneer species with small seed sizes [3,4,5].
Many previous studies have focused on differences between microtopographies [6]. For example, the land undulations due to uprooting affect light and soil characteristics greatly, and the resources supplied differ greatly between convex mounds and concave pits [7,8]. In general, light intensity is higher than pits on spatially elevated mounds, and soil moisture content is higher in pits than mounds [9,10,11].
However, it should also be noted that such general trends always involve large variability [12]. For example, environments in pits vary widely depending on the scale of uprooting, topographical location [6,7], and the direction of the treefall [12]. In addition, the arrangement of remaining overstory trees around the microtopography also contributes to the variation [9]. Probably because of these differences, the tendency to compare mounds and pits is not always consistent among existing studies; in forests in eastern North America, Peterson and Pickett [13] reported high germination rates of yellow birch in pits, while Kern et al. [5] and Carlton and Bazzaz [12] showed that the density of this species in the pits was lower. Similarly, Peterson et al. [14], Kuuluvainen and Juntunen [15] and Ilisson et al. [16] took the pits positively as a regeneration microtopography, while Barker Plotkin [8], Clinton and Baker [10], and Harrington and Bluhm [17] emphasized its disadvantages. In other words, if the conditions change, the microtopographies suitable for regeneration also could be different. Therefore, it is necessary to analyze natural regeneration dynamics in relation to the micro-environment and resources.
The major natural disturbance agent in the forests of northern Japan is windstorms, especially caused by typhoons [18,19,20]. Tip-up mounds and fallen logs function as a tree colonization microtopography in conifer-broadleaved mixed forests [21]. It was shown that many tree species, such as birch (Betula platyphylla var. japonica Hara, B. ermanii Cham.), fir (Abies sachalinensis (Fr. Schm.)), and spruce (Picea glehnii Masters, P. jezoensis Carr.) were frequently found in these locations. However, regeneration of these tree species on the undisturbed forest floor is generally limited because of the predominance of dwarf-bamboos in the understory [21] and pathogens in the leaf-litter layer [22,23]. Considering the prediction that the frequency of large typhoons will increase due to climate change [24], it is expected that the importance of such microtopography as regeneration substrates will increase in the future.
The purpose of this study was to clarify the resources (light and soil moisture) conditions that contribute to the initial regeneration process at treefall microtopographies. Furthermore, regeneration for 10 years on 39 tip-up mounds caused by a large typhoon in September 2004 in a mixed forest was investigated. In particular, attention is paid to the contribution of the microtopography to conifer species, which have been suggested to decrease due to global warming [25].
2. Materials and Methods
2.1. Study Site
Field surveys were performed in the Uryu Experimental Forest of Hokkaido University (44°22′ N, 142°12′ E, 280 m above sea level). The mean annual temperature and precipitation observed at the research station (2 km from the study site) was 4.2 °C and 1390 mm, respectively (Uryu Experimental Forest, unpublished). Snow cover occurs from November to May to a maximum depth of more than 200 cm. The study stand was set in a primary natural mixed forest, a representative natural vegetation type of Hokkaido. The area’s geology is Tertiary andesite, and the main soil type is acid brown forest soil. The stand was dominated by A. sachalinensis, followed by P. glehnii, Quercus crispula Blume, and B. ermanii (Table 1) [20]. The understory was densely covered with dwarf bamboo Sasa senanensis (Franchet et Savatier) Rehder.
2.2. Field Methods
In a 3-ha study plot set during the spring of 2002, diameter at breast height (DBH) and the position (XY coordinates) of trees with DBH ≥ 10 cm were measured. In September 2004, a typhoon with very strong winds landed on Hokkaido and caused windfalls within the forest. The tree assessment conducted immediately after the disturbance demonstrated that 10.6% (in terms of basal area at breast height) of trees died, and 78.3% of them were associated with uprooting (Table 1) [20].
All treefall tip-up mounds (39 locations) identified within the 3-ha stand and its surrounding (totally 4.6-ha) were targeted in this study. These locations were caused by the uprooting of trees with DBH 20–80 cm. The study area was set to completely include the mounds and pits at each location, respectively defined as the part higher and lower than the surrounding ground surface. The height or depth from the ground surface was level-measured at all intersections that divide the area into 1.0 × 0.5 m by horizontal projection (perpendicular × horizontal with respect to the fallen stem) twice in September 2006 and 2007, and the volume of mound and pit were calculated. In September 2006, two years after the windfall, seedlings of all tree species (except the current year seedlings) were counted, and their heights were measured. At this time, seedling measurements were also made for the undisturbed area of 4 m2 areas adjacent to each of the 39 locations. In September 2014, 10 years after the windfall, regenerated trees’ count and height measurements were again conducted on the mounds and pits.
Light and soil conditions were measured at every 1 m2 of the horizontal projected area at each of 39 locations of microtopographies; the sample size varied depending on the area, and was 147, 120, and 39 respectively for the mounds, pits, and undisturbed ground. In August 2007, photosensitive paper (OptoLeaf R-2D; Taisei Fine Chemical Co., Ltd., Tokyo, Japan) was placed horizontally at each point and left for 10 days. Based on the values measured in the adjacent open area, the relative value was used as an index of light intensity. In addition, soil up to a depth of 5 cm from the surface was sampled using an auger and dried at 105 °C for 48 h to calculate soil moisture content.
In 2006, a 0.24-ha (120 × 20 m) subplot was set up on the flat area in the 3-ha stand to examine the dependence on microtopographies in older regenerated trees. The microtopographies (undisturbed ground, mounds, pits, and fallen logs) were recorded at all (2400) points at 1 m intervals to calculate their area proportions. At the same time, all the saplings with height 20–130 cm in the subplot were recorded, with their growing microtopography.
2.3. Analyses
The statistical differences in light intensity, soil moisture, and regeneration density among the microtopographies were tested with a generalized liner model (GLM), and subsequently by Tukey’s test. The GLM was also applied to clarify contributing factors on the regeneration density of major tree species at the 2-nd growing season after the windfall and the change in the density during the 2-nd and 10-th growing seasons. The Poisson distribution with log link function for the regeneration density was assumed. The explanatory variables were light intensity, soil moisture content, and their interactions. For the density at the 2-nd growing season, the amount of surrounding conspecific trees that could be the seed source was considered as an explanatory variable; the sum of basal area (m2) at breast height of trees with DBH 10 cm or more within a radius of 20 m from each tip-up mound (the seed fall best explained by Yoshida et al., unpublished) was calculated. For the model explaining the change in the density until 10-th growing season, the density at the 2-nd growing season was used as the offset term. The model with the lowest AIC value was selected, and the significance of the variables was evaluated by the Wald test. R 3.1.2 [26] was used for the analyses.
The Ivlev electivity index (Ei) [27] was calculated to indicate preference of saplings for the microtopography within the 0.24 ha subplot.
where ri is the relative appearance of saplings on a microtopography i and Pi is the relative area of the microtopography i in the subplot. Ei is scaled so that Ei = −1 corresponds to total avoidance, Ei = 0 represents non-selective appearance, and Ei = 1 shows total preference.
Ei = (ri − Pi)/(ri + Pi)
3. Results
The average volumes of the 39 mounds and pits surveyed were respectively 2.6 m3 and 1.7 m3, with 1.4 m height and 0.6 m depth (Table 2). The horizontal projected area was 5.9 m2 for the mounds and 3.5 m2 for the pits. During the 2-nd to 3-rd years after the windfall, the mound volume decreased by about 4% on average, and the pit volume decreased by about 9%. Light intensity was significantly higher in the mounds than pits, while soil moisture content was higher on pits than mounds (Table 2). Light intensity was significantly higher in the pits, but there was no significant difference in soil moisture content comparing the values in the pits with the undisturbed ground.
At the end of the 2-nd growing season after the windfall, the average seedling density was significantly higher in the pits for most tree species, reaching a total of 17.3 seedlings/m2 (Table 3). The dominant species were P. glehnii and Betula sp. On the other hand, the average density on the mound was 3.9 seedlings/m2, and there were many A. sachalinensis in addition to the above two tree species. The appearance of seedlings on the undisturbed ground was limited (0.8 seedlings/m2).
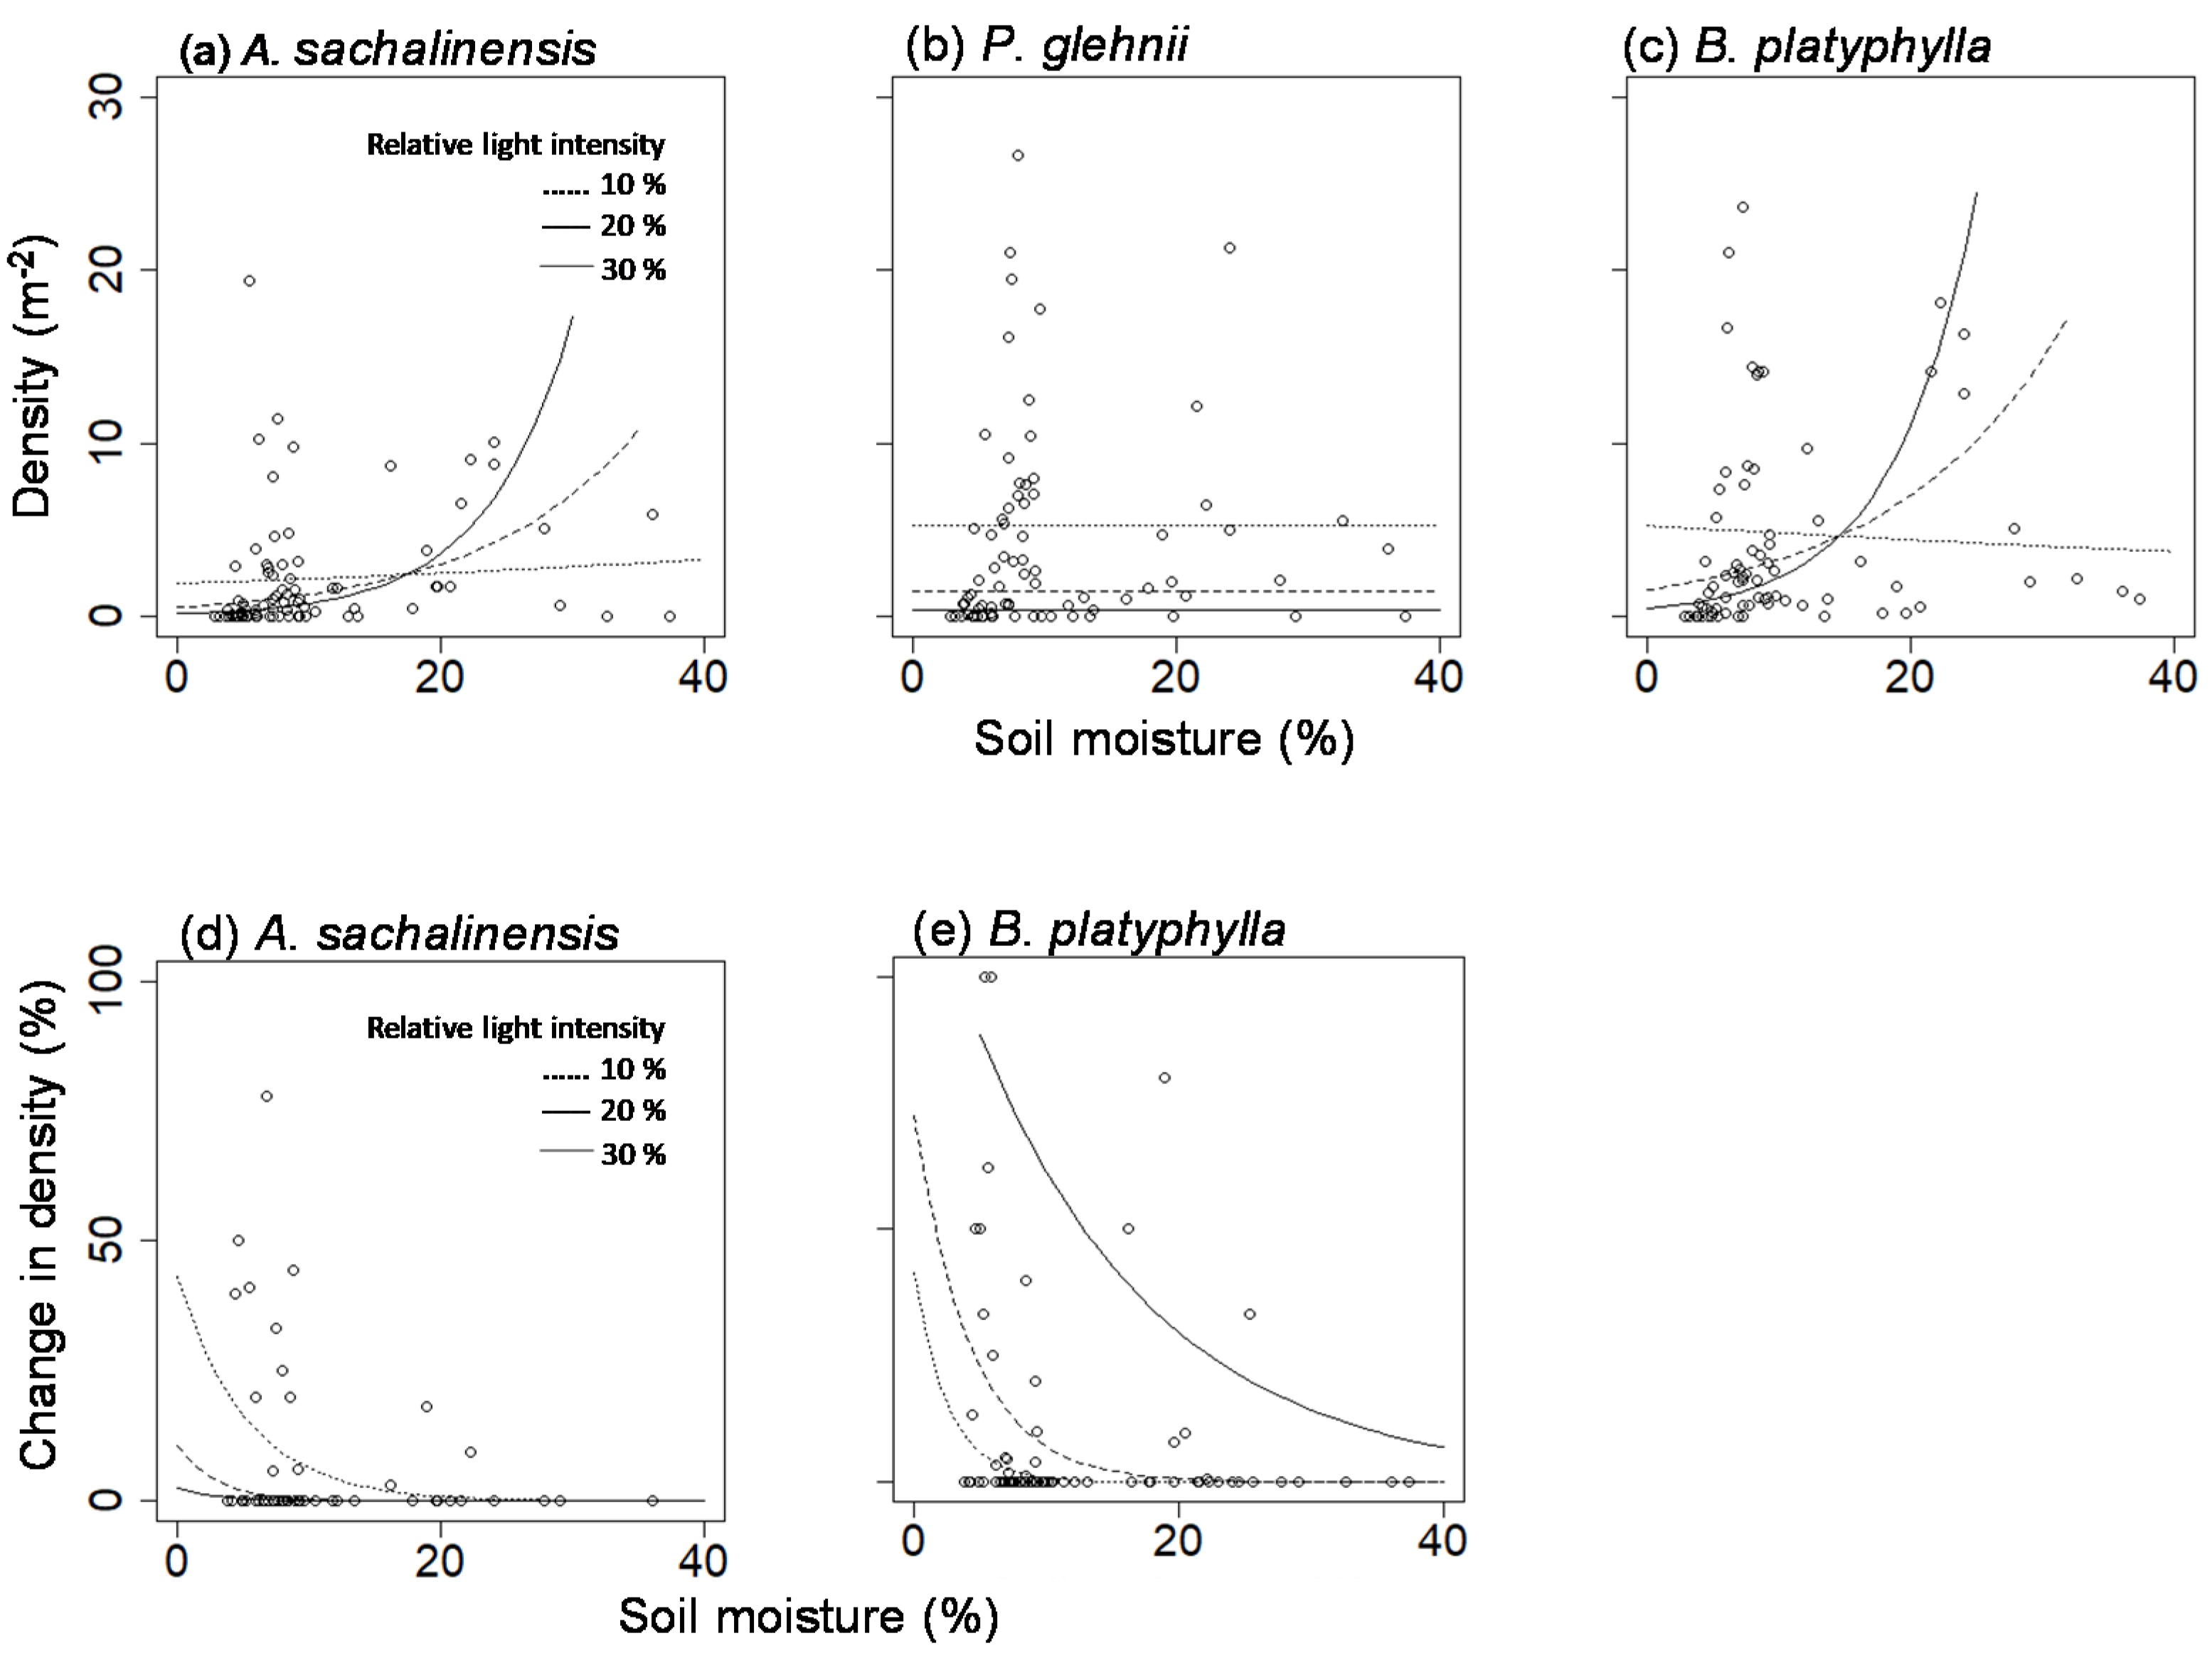
Regarding the contributing factors that affect the density of the major tree species in the 2-nd growing season after the windfall, the sum of basal area of conspecific overstory trees had a positive effect and was significant for. sachalinensis and P. glehnii (Table 4). In addition, the effect of light intensity was negative and significant in P. glehnii (Figure 1). In A. sachalinensis and Betula sp., there was an interaction between the light intensity and soil moisture content (Table 4), and it was shown that the effect of light intensity was negative in low soil moisture conditions, while the density was large when both factors were high (Figure 1). Note that none of the explanatory variables were significant for Q. crispula and P. amurense (Table 4).
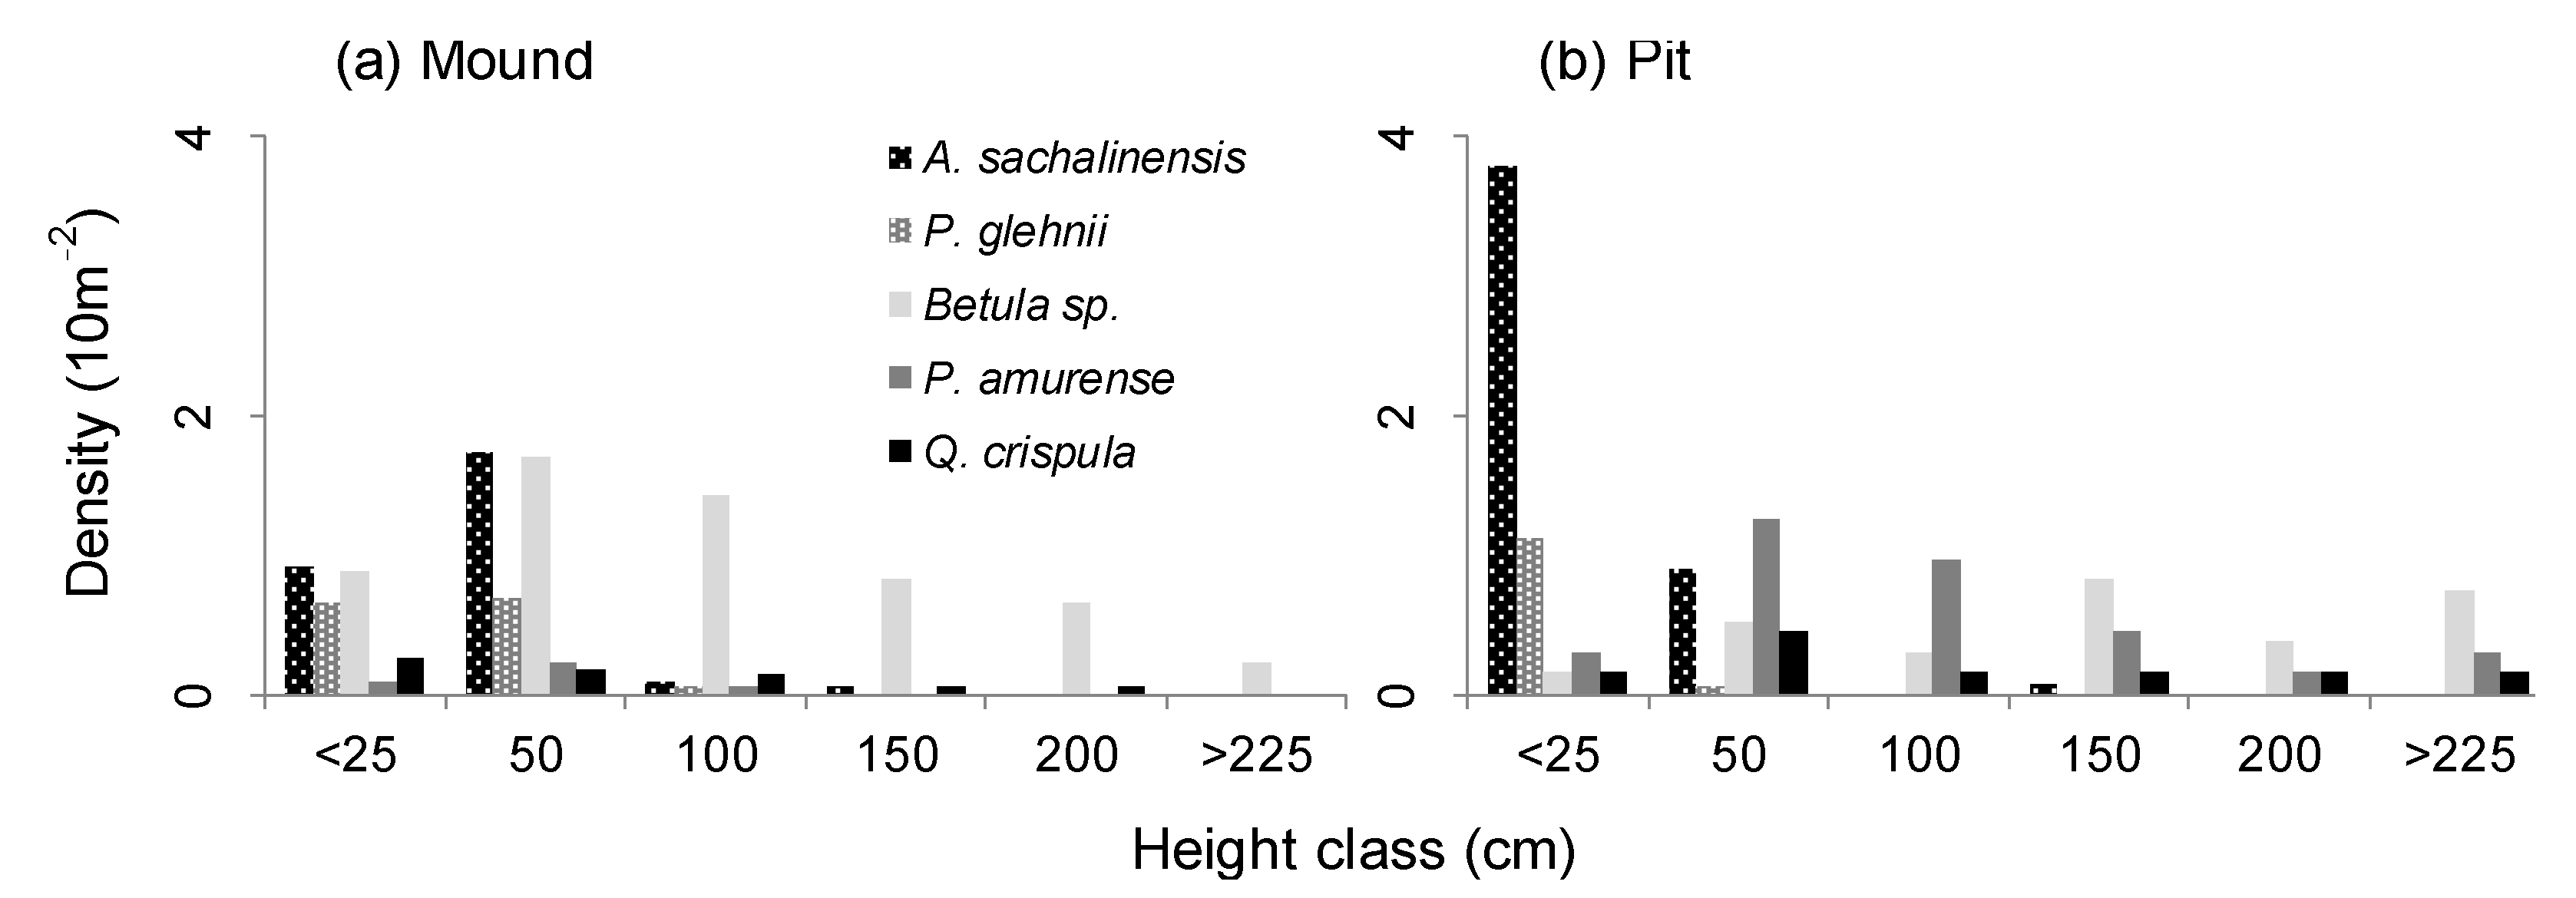
In the 10-th growing season after the windfall, the difference in the average density of the mounds (1.8 saplings/m2) and the pits (2.0 saplings/m2) was comparable. There were both tree species with more saplings in the pits (A. sachalinensis, P. amurense, Q. crispula), and with more saplings in the mounds (P. glehnii and Betula sp.) (Table 3). Compared to the 2-nd growing season, the total density decreased significantly, and the decrease of Betula sp. in the pits was particularly remarkable. On the other hand, the change in the density of Betula sp. on the mounds and Q. crispula was small. The frequency distribution of tree height (Figure 2) shows that Betula sp. was evenly distributed from the small to large classes (up to over 200 cm), with the mode 50 and 150 cm respectively in the mounds and the pits. A. sachalinensis and P. glehnii were concentrated respectively in the 0–25 and 25–50 cm classes, with few larger individuals. In these two species, the appearance of 50 cm class saplings was more frequent on the mounds. P. amurense and Q. crispula in the pits were scattered with large individuals, including the largest class.
Regarding the contributing factors on the change in the regeneration density, the interaction between the light intensity and the soil moisture content was significant in Betula sp. (Table 4), and the relative density was high in a less soil moisture condition with more intense light (Figure 1). In contrast, the density of A. sachalinensis was limited in high soil moisture conditions and high in places where both the soil moisture content and the light intensity were low (Figure 1). No significant explanatory variables were found in the model for P. glehnii, Q. crispula, and P. amurense (Table 4).
In the 0.24 ha subplot, the mounds accounted for 9%, and the pits accounted for 1% of the total area (Table 5). In contrast, the saplings of the major tree species grew preferably on the mounds and fallen logs, with higher electivity index.
4. Discussion
This study demonstrated the regeneration dynamics of 10 years after the windfall. Although longer-term observation is required, the initial colonization pattern of tall-tree species according to the micro-environmental conditions on the tip-up mounds was clarified. As shown in existing studies, the undisturbed grounds had lower seedling densities in the forest [21], where the floors were densely covered with understory vegetation. Together with the accumulation of litter, the low light condition limited the germination of tree species with light seeds [5]. In addition, pathogenic fungi inhabited the undisturbed ground causing dark snow-blight disease to seeds and seedlings [22,23]. Therefore, it was confirmed that the microtopographies provided by the tip-up mounds that can avoid these negative effects is an important regeneration site for the natural mixed forests.
Considering that the rate of volume decreases of pits reached 9%/year and the limited appearance within the 0.24 area (only about 1%), it was estimated that the pits would be filled relatively early [8]. On the other hand, the mound shared 9.4% within the 0.24 ha area, suggesting that they will remain prominent for quite some time [8].
In the 2-nd growing season after the windfall, the major tree species with high seedling densities on the tip-up mounds were A. sachalinensis, P. glehnii, and Betula sp. The predominance of these species dispersed with light seeds has been reported in many studies [5,8,28]. Therefore, the two coniferous species dominated the overstory of the study stand, and the resultant abundance of seed sources was reflected in the high seedling densities. In contrast, for Betula sp., the influence of the seed sources was not statistically significant. This result was expected, considering Betula sp. has the higher seed dispersal ability with especially light seeds.
The initial seedling densities in the pits were 2–6 times higher than on the mounds, depending on tree species. There are several possible causes for the relative advantages of the pits. First, the pits generally have more seed dispersal than the mounds [11]. It is expected that the trapping ability was particularly large in Q. crispula, which produce large acorns, but its difference in seedling density was not so high in comparison with the species with lighter seeds. It is also related to the lower light intensity and higher soil moisture content in the pits [9,10,11]. In fact, negative effects of intense light and desiccations on small seedlings in a site where mineral soil is exposed have widely been reported [23,29]. In this study, the lower the light intensity, the higher the initial density of P. glehnii. This is also seen in A. sachalinensis and Betula sp. The interaction between the light intensity and the soil moisture content was observed; intense light had a positive effect only when the soil moisture content was high.
In the pits, the density of Betula sp. showed a remarkable decrease during the study period (by 87%), but the largest size class saplings were more in the pits than in the mounds. Thus, the fast-growing individuals could be faster than the rate of disappearance of the pits. This may also be the case with fast-growing Q. crispula and P. amurense, which also had relatively large saplings, especially in the pits. On the other hand, A. sachalinensis and P. glehnii had only a few large saplings. Thus, the remarkable decrease in the density during the study period may have been affected largely by the saplings’ being buried in sediment movements [11].
Although initially negatively impacted, on a 10-year time scale, given the small decrease in the density on the mounds, intense light conditions favor regeneration of Betula sp. A similar effect can be exerted on Q. crispula [30]. In contrast, it was demonstrated that A. sachalinensis on tip-up mounds is advantageous under limited conditions; its regeneration is promoted under conditions where there is a shade of surrounding canopies, and the soil moisture content is not too high. On the other hand, tip-up mounds did not provide a suitable micro-environment for P. glehnii. At the 2-nd growing season, P. glehnii showed the highest seedling density in the pits, but it was only temporary, and the density decline reached only 0.05% at the 10-th growing season. In addition to the possibility mentioned above that the saplings had been buried, it is also possible that deaths caused by the dark snow-blight disease increased due to the accumulation of litter in the pits [22,23].
However, this is inconsistent because 43% of the P. glehnii saplings were found on the mounds in the 0.24 ha subplot. Thus, although the density has decreased significantly during the study period, the higher density compared with the undisturbed ground suggests that the tip-up mounds may play an important role, albeit with a lower probability. Conversely, 50% of Betula sp. emerged from the undisturbed grounds due to the already collapsed mounds or pits, given the small density of seedlings on the undisturbed grounds at the 2-nd growing season.
This study also confirmed the importance of fallen logs in tree regeneration [21]; the highest positive Ivlev electivity index was achieved by P. glehnii for this microtopography. Like the tip-up mounds, fallen logs are thought to be less susceptible to the negative effects caused by understory competitive vegetation and soil-dwelling pathogens, leading to higher sapling densities [22,23]. However, longer-term monitoring is required because almost no seedlings were found even 10 years after the windfall (Yoshida, T. personal observation) on fallen logs attached to the tip-up mounds targeted in the current study.
5. Conclusions
This study clarified that the regeneration of tall-tree species on tip-up mounds varies greatly depending on micro-environmental conditions. In addition to the difference in the surrounding environment (e.g., the abundance of seed sources, topographic location) at each tip-up mound, the direction of windfall and the size of the fallen trees determine the micro-environmental conditions after disturbance [6,7,9,12]. For instance, the windfall at this study site in 2004 often fell to the northeast because the main wind direction was southwest, and even the pits were in relatively intense light conditions. This seems to have led to the overall high regeneration density of Betula sp. at the 10-th growing season after the windfall in this study. Therefore, a contrasting discussion of the relative advantages of mounds and pits in existing studies [6,12] may be due to the difference in the range of variables representing such micro-environmental conditions.
Studies are indicating the increase of intense tropical cyclones in the near future [24]. The formation of large gaps by stronger winds and the subsequent gap expansion [20] will favor the early establishment of Betula sp., rather than A. sachalinensis and P. glehnii, on tip-up mounds. This may spur the projected reduction in conifer species [25] in this type of mixed forest. However, it is necessary to clarify long-term regeneration dynamics on all microtopographies, including fallen logs and undisturbed ground, for a comprehensive evaluation.
Funding
This research received no external funding.
Data Availability Statement
Not applicable.
Acknowledgments
The author gratefully acknowledges Akane Harada for her great contributions to this work. Thanks are extended to Hisashi Miya, Keiichi Aoyama, and members of the Uryu Experimental Forest for their support to this study.
Conflicts of Interest
The authors declare no conflict of interest.
References
- Pickett, S.T.A.; White, P.S. The Ecology of Natural Disturbance and Patch Dynamics; Academic Press: San Diego, CA, USA, 1985. [Google Scholar]
- Vodde, J.F.; Jögiste, K.; Kubota, Y.; Kuuluvainen, T.; Köster, K.; Lukjanova, A.; Metslaid, M.; Yoshida, T. The influence of storm-induced microsites to tree regeneration patterns in boreal and hemiboreal forest. J. For. Res. 2011, 16, 155–167. [Google Scholar] [CrossRef]
- Putz, F.E. Treefall pits and mounds, buried seeds, and the importance of soil disturbance to pioneer trees on barro Colorado island, Panama. Ecology 1983, 64, 1069–1074. [Google Scholar] [CrossRef]
- Nakashizuka, T.; Iida, S. Composition, dynamics and disturbance regime of temperate deciduous forests in Monsoon Asia. Vegetatio 1995, 121, 23–30. [Google Scholar] [CrossRef]
- Kern, C.C.; Schwarzmann, J.; Kabrick, J.; Gerndt, K.; Boyden, S.; Stanovick, J.S. Mounds facilitate regeneration of light-seeded and browse-sensitive tree species after moderate-severity wind disturbance. For. Ecol. Manag. 2019, 437, 139–147. [Google Scholar] [CrossRef]
- Peterson, C.J.; Pickett, S.T.A. Microsite and elevational influences on early forest regeneration after catastrophic windthrow. J. Veg. Sci. 1990, 1, 657–662. [Google Scholar] [CrossRef]
- Beatty, S.W.; Stone, E.L. The variety of soil microsites created by tree falls. Can. J. For. Res. 1996, 16, 539–548. [Google Scholar] [CrossRef]
- Barker Plotkin, A.; Schoonmaker, P.; Leon, B.; Foster, D. Microtopography and ecology of pit-mound structures in second-growth versus old-growth forests. For. Ecol. Manag. 2017, 404, 14–23. [Google Scholar] [CrossRef]
- Beatty, S.W. Influence of microtopography and canopy spatial patterns of forest understory plants. Ecology 1984, 65, 1406–1419. [Google Scholar] [CrossRef]
- Clinton, B.D.; Baker, C.R. Catastrophic windthrow in the southern Appalachians: Characteristics of pits and mounds and initial vegetation responses. For. Ecol. Manag. 2000, 126, 51–60. [Google Scholar] [CrossRef] [Green Version]
- Simon, A.; Gratzer, G.; Sieghardt, M. The influence of windthrow microsites on tree regeneration and establishment in an old growth mountain forest. For. Ecol. Manag. 2011, 262, 1289–1297. [Google Scholar] [CrossRef]
- Carlton, G.C.; Bazzaz, F.A. Regeneration of three sympatric birch species on experimental hurricane blowdown microsites. Ecol. Monogr. 1998, 68, 99–120. [Google Scholar] [CrossRef]
- Peterson, C.J.; Pickett, S.T.A. Patch type influences on regeneration in a western Pennsylvania, USA, catastrophic windthrow. Oikos 2000, 90, 489–500. [Google Scholar] [CrossRef]
- Peterson, C.J.; Walter, P.C.; McCarthy, B.C.; Pickett, S.T.A. Microsite variation and soil dynamics within newly created treefall pits and mounds. Oikos 1990, 58, 39–46. [Google Scholar] [CrossRef]
- Kuuluvainen, T.; Juntunen, P. Seedling establishment in relation to microhabitat variation in a windthrow gap in a boreal Pinus sylvestris forest. J. Veg. Sci. 1998, 9, 551–562. [Google Scholar] [CrossRef]
- Ilisson, T.; Köster, K.; Vodde, F.; Jögiste, K. Regeneration development 4–5 years after a storm in Norway spruce dominated forests, Estonia. For. Ecol. Manag. 2007, 250, 17–24. [Google Scholar] [CrossRef]
- Harrington, T.B.; Bluhm, A.A. Tree regeneration responses to microsite characteristics following a severe tornado in the Georgia Piedmont, USA. For. Ecol. Manag. 2001, 140, 265–275. [Google Scholar] [CrossRef]
- Nakashizuka, T. Role of uprooting in composition and dynamics of an old-growth forest in Japan. Ecology 1989, 70, 1273–1278. [Google Scholar] [CrossRef]
- Yoshida, T.; Noguchi, M. Vulnerability to strong winds for major tree species in a northern Japanese mixed forest: Analyses of historical data. Ecol. Res. 2009, 24, 909–919. [Google Scholar] [CrossRef]
- Sato, T.; Yamazaki, H.; Yoshida, T. Extending effect of a wind disturbance: Mortality of Abies sachalinensis following a strong typhoon in a natural mixed forest. J. For. Res. 2009, 22, 336–342. [Google Scholar] [CrossRef]
- Noguchi, M.; Yoshida, T. Tree regeneration in partially cut conifer-hardwood mixed forests in northern Japan: Roles of establishment substrate and dwarf bamboo. For. Ecol. Manag. 2004, 190, 335–344. [Google Scholar] [CrossRef]
- Sakamoto, Y.; Miyamoto, T. Racodium snow blight in Japan. For. Pathol. 2005, 35, 1–7. [Google Scholar] [CrossRef]
- Suzuki, N.; Yoshida, T.; Miyamoto, T.; Fukuzawa, K.; Taniguchi, T.; Yamazaki, H. Early establishment of spruce (Picea glehnii [Fr. Schm.] Masters) seedlings on disturbed soil with the aim of assisted natural regeneration. Scand. J. For. Res. 2021, 36, 126–134. [Google Scholar] [CrossRef]
- Knutson, T.R.; McBride, J.L.; Chan, J.; Emanuel, K.; Holland, G.; Landsea, C.; Held, I.; Kossin, J.P.; Srivastava, A.K.; Sugi, M. Tropical cyclones and climate change. Nat. Geosci. 2010, 3, 157–163. [Google Scholar] [CrossRef] [Green Version]
- Hiura, T.; Sato, G.; Iijima, H. Long-term forest dynamics in response to climate change in northern mixed forests in Japan: A 38-year individual-based approach. For. Ecol. Manag. 2019, 449, 117469. [Google Scholar] [CrossRef]
- R Core Team. R: A Language and Environment for Statistical Computing; R Foundation for Statistical Computing: Vienna, Austria, 2020; Available online: https://www.R-project.org/ (accessed on 6 August 2021).
- Ivlev, V.S. Experimental Ecology of the Feeding of Fishes; Yale University Press: New Haven, CT, USA, 1961. [Google Scholar]
- Vodde, J.F.; Jögiste, K.; Gruson, L.; Ilisson, T.; Köster, K.; Stanturf, J.A. Regeneration in windthrow areas in hemiboreal forests: The influence of microsite on the height growths of different tree species. J. For. Res. 2010, 15, 55–64. [Google Scholar] [CrossRef]
- Yoshida, T.; Iga, Y.; Ozawa, M.; Noguchi, M.; Shibata, H. Factors influencing early vegetation establishment following soil scarification in a mixed forest in northern Japan. Can. J. For. Res. 2005, 35, 175–188. [Google Scholar] [CrossRef] [Green Version]
- Asada, I.; Yamazaki, H.; Yoshida, T. Spatial patterns of oak (Quercus crispula) regeneration on scarification site around a conspecific overstory tree. For. Ecol. Manag. 2017, 393, 81–88. [Google Scholar] [CrossRef]
Figure 1.
Seedling density at the 2-nd growing season(a–c), and change in the density during 2-nd and 10-th growing seasons (d,e) in relation to the light intensity and the soil moisture content. The lines are drown based on the results of the generalized linear models (Table 4).
Figure 1.
Seedling density at the 2-nd growing season(a–c), and change in the density during 2-nd and 10-th growing seasons (d,e) in relation to the light intensity and the soil moisture content. The lines are drown based on the results of the generalized linear models (Table 4).

Figure 2.
Height-class distribution of the major tree species grown on the microtopographies ((a): mounds; (b): pits) at the 10th growing season.
Figure 2.
Height-class distribution of the major tree species grown on the microtopographies ((a): mounds; (b): pits) at the 10th growing season.


Table 1.
Tree species composition and the damage caused by the strong wind in the 3-ha study stand.
| Species | Before the Disturbance | Death from the Disturbance | ||||
|---|---|---|---|---|---|---|
| Density ha−1 | Basal Area m2 ha−1 | Density ha−1 | Basal Area m2 | |||
| Total (Uprooted in Parentheses) | ||||||
| Abies sachalinensis | 115.3 | 10.8 | 12.0 | (8.3) | 2.2 | (1.7) |
| Picea glehnii | 50.3 | 8.4 | 1.3 | (1.3) | 0.4 | (0.4) |
| Quercus crispula | 20.7 | 2.3 | 0.3 | (0.3) | 0.0 | (0.0) |
| Betula ermanii | 28.0 | 1.5 | 0.3 | (0.3) | 0.0 | (0.0) |
| Other broadleaved sp. | 97.3 | 4.3 | 7.7 | (6.7) | 0.3 | (0.2) |
| Total | 311.7 | 27.3 | 21.7 | (17.0) | 2.9 | (2.3) |
Tree individuals with dbh equal to or greater than 10 cm were considered.
Table 2.
Properties of the 39 microtopographic locations (mounds and pits) induced by the strong wind, and the undisturbed ground. The averages and standard deviations measured in the 2-nd growing season are shown.
Table 2.
Properties of the 39 microtopographic locations (mounds and pits) induced by the strong wind, and the undisturbed ground. The averages and standard deviations measured in the 2-nd growing season are shown.
| Mounds | Pits | Undisturbed Ground | |
|---|---|---|---|
| Height or Depth (m) | 1.4 ± 0.5 | 0.5 ± 0.3 | |
| Horizontal projection area (m2) | 5.9 ± 3.8 | 3.5 ± 2.3 | |
| Volume (m3) | 2.6 ± 2.3 | 1.6 ± 1.5 | |
| Volume change (%) * | 96 ± 6 | 91 ± 6 | |
| Relative light intensity (%) | 20.1 ± 7.9 a | 11.8 ± 5.0 b | 7.9 ± 2.4 c |
| Soil moisture (%) | 7.8 ± 5.4 b | 12.8 ± 9.3 a | 15.3 ± 9.2 a |
Different letters in a row indicate significant difference among the locations. * Percentage of the volume measured in 2007 to that in 2006.
Table 3.
Seedling density (m−2) of the major tree species in the 39 microtopographies (mounds and pits) induced by the strong wind, and the undisturbed ground. The averages and standard deviations measured in the 2-nd and 10-th growing seasons are shown.
Table 3.
Seedling density (m−2) of the major tree species in the 39 microtopographies (mounds and pits) induced by the strong wind, and the undisturbed ground. The averages and standard deviations measured in the 2-nd and 10-th growing seasons are shown.
| 2-nd Growing Season | |||
| Mounds | Pits | Undisturbed ground | |
| A. sachalinensis | 0.94 ± 2.28 b | 3.04 ± 3.56 a | 0.67 ± 0.02 c |
| P. glehnii | 1.03 ± 1.93 b | 6.41 ± 6.49 a | 0.02 ± 0.09 c |
| Betula sp. | 1.18 ± 1.79 b | 6.15 ± 6.55 a | 0.06 ± 0.17 c |
| P. amurense | 0.51 ± 0.79 a | 1.01 ± 1.46 a | 0.15 ± 0.55 c |
| Q. crispula | 0.14 ± 0.32 b | 0.32 ± 0.50 a | 0.01 ± 0.04 c |
| Total | 3.90 ± 5.03 b | 17.28 ± 13.71 a | 0.80 ± 1.94 c |
| 10-th Growing Season | |||
| Mounds | Pits | ||
| A. sachalinensis | 0.19 ± 0.88 b | 0.26 ± 0.79 a | |
| P. glehnii | 0.06 ± 0.34 a | 0.03 ± 0.10 b | |
| Betula sp. | 1.10 ± 2.08 a | 0.80 ± 1.48 b | |
| P. amurense | 0.08 ± 0.28 b | 0.57 ± 1.24 a | |
| Q. crispula | 0.13 ± 0.44 b | 0.27 ± 0.85 a | |
| Total | 1.77 ± 3.32 b | 1.99 ± 3.22 a | |
Different letters in a row indicate significant difference (p < 0.05) among the locations.
Table 4.
Summary of the generalized linear model to examine seedling density at 2-nd growing season and change in the density during 2-nd and 10-th growing seasons of the five major tree species grown on the microtopographies. The coefficients for the variables selected in the model are shown.
Table 4.
Summary of the generalized linear model to examine seedling density at 2-nd growing season and change in the density during 2-nd and 10-th growing seasons of the five major tree species grown on the microtopographies. The coefficients for the variables selected in the model are shown.
| Seedling Density (m−2) at the 2-nd Growing Season | |||||
| A. sachalinensis | P. glehnii | B. platyphylla | P. amurense | Q. crispula | |
| Relative light intensity (L) | −0.12 * | −0.09 * | −0.12 * | ns | ns |
| Soil moisture (M) | −0.06 | ns | −0.09 | 0.04 | ns |
| L × M | 0.01 * | ns | 0.01 * | ns | ns |
| Amount of seed sources | 0.79 * | 0.49 * | 0.69 | ns | ns |
| Intercept | 0.72 | 1.87 * | 2.62 * | −0.33 | −1.38 |
| AIC | 423.2 | 509.1 | 542.9 | 346.7 | 203.3 |
| Change in seedling density (m−2/m−2) during 2-nd and 10-th growing seasons | |||||
| A. sachalinensis | P. glehnii | Betula sp. | P. amurense | Q. crispula | |
| Relative light intensity (L) | −0.14 | ns | 0.06 | ns | ns |
| Soil moisture (M) | −0.33 * | ns | −0.55 * | ns | −0.15 |
| L × M | 0.01 | ns | 0.02 * | ns | ns |
| Intercept | 0.57 | −3.55 | −1.45 | −0.82 | 0.14 |
| AIC | 131.0 | 99.8 | 230.5 | 183.2 | 129.5 |
“ns” indicate the variables not selected in the model, and the asterisks indicate statistical significance (p < 0.05).
Table 5.
Area proportion of microtopographies in the 0.24 ha subplot, and the proportion of number of saplings that appeared by microtopography. The Ivlev electivity index (−1 corresponds to total avoidance, and 1 shows total preference) are shown in parentheses.
Table 5.
Area proportion of microtopographies in the 0.24 ha subplot, and the proportion of number of saplings that appeared by microtopography. The Ivlev electivity index (−1 corresponds to total avoidance, and 1 shows total preference) are shown in parentheses.
| Mounds | Pits | Fallen Logs | Undisturbed Ground | |||||
|---|---|---|---|---|---|---|---|---|
| Microtopographies proportion | 0.09 | 0.01 | 0.05 | 0.85 | ||||
| A. sachalinensis (n = 296) | 0.40 | (0.62) | 0.00 | (−1.00) | 0.26 | (0.70) | 0.34 | (−0.43) |
| P. glehnii (n = 58) | 0.43 | (0.64) | 0.00 | (−1.00) | 0.43 | (0.80) | 0.14 | (−0.72) |
| Betula sp. (n = 18) | 0.39 | (0.61) | 0.00 | (−1.00) | 0.11 | (0.41) | 0.50 | (−0.26) |
Publisher’s Note: MDPI stays neutral with regard to jurisdictional claims in published maps and institutional affiliations. |
© 2021 by the author. Licensee MDPI, Basel, Switzerland. This article is an open access article distributed under the terms and conditions of the Creative Commons Attribution (CC BY) license (https://creativecommons.org/licenses/by/4.0/).
Share and Cite
MDPI and ACS Style
Yoshida, T. Regeneration Dynamics on Treefall Mounds and Pits for 10 Years after a Windfall in a Natural Mixed Forest. Forests 2021, 12, 1064. https://0-doi-org.brum.beds.ac.uk/10.3390/f12081064
AMA Style
Yoshida T. Regeneration Dynamics on Treefall Mounds and Pits for 10 Years after a Windfall in a Natural Mixed Forest. Forests. 2021; 12(8):1064. https://0-doi-org.brum.beds.ac.uk/10.3390/f12081064
Chicago/Turabian StyleYoshida, Toshiya. 2021. "Regeneration Dynamics on Treefall Mounds and Pits for 10 Years after a Windfall in a Natural Mixed Forest" Forests 12, no. 8: 1064. https://0-doi-org.brum.beds.ac.uk/10.3390/f12081064
Note that from the first issue of 2016, this journal uses article numbers instead of page numbers. See further details here.