
The Physiological Restorative Role of Soundscape in Different Forest Structures
by
 , ,
, ,
Xin-Chen Hong
1,2,† ,
,
Shi Cheng
1,†,
Jiang Liu
2 ,
,
Emily Dang
3,
Jia-Bing Wang
2 and
Yuning Cheng
1,* 1
School of Architecture, Southeast University, Nanjing 210096, China
2
School of Architecture and Urban-Rural Planning, Fuzhou University, Fuzhou 350025, China
3
Department of Forest Resources Management, University of British Columbia, Vancouver, BC V6T 1Z4, Canada
*
Author to whom correspondence should be addressed.
†
These authors contributed equally to this work.
Forests 2022, 13(11), 1920; https://0-doi-org.brum.beds.ac.uk/10.3390/f13111920
Submission received: 28 September 2022
/
Revised: 11 November 2022
/
Accepted: 14 November 2022
/
Published: 15 November 2022
(This article belongs to the Special Issue Soundscape in Urban Forests)
Abstract
:Natural soundscape is considered a dominant type of hearing in forested areas and contributes to health and recovery effects from exposure to the biophilic outdoor environment. This study focuses on the different forest structures, and aims to explore the relationship between perceived soundscape and acoustical parameters, observe physiological indicators, and model the physiological restorative role of soundscape. Questionnaires and measuring equipment were used to gather psychophysical and physiological information at 20 observation sites in urban forested areas. Back-propagation neural network techniques were conducted to determine the forecasting model from psychophysical to physiological parameters. Our results suggested that LAeq and L10 are important factors that influence questionnaire responses. Our findings also showed that electromyogram (EMG) signals were the most obvious and sensitive in physiological parameters. Additionally, we found that L10–90 played the most important role among all physical parameters in the physiological restorativeness soundscape model. This can facilitate the understanding of the physiological restorative role of soundscape in different forest structures when proposing suitable forest-based health care strategies.
1. Introduction
In 2020, the public found themselves in an unprecedented situation. With COVID-19 spreading, lockdowns were enforced, and outdoor activities subsequently declined. This led to a rise in both psychological stress and mortality by suicide [1]. There has been a growing demand by the public, especially in high-density cities, for relaxation and entertainment. This public demand contributes to an important effect for public health and work efficiency, and thus the public pays increasing attention to this issue [2,3]. Fortunately, urban forested areas, which are an important part of the urban green infrastructure, are natural places that provide relaxation, entertainment and perceived restoration to the public [4,5,6]. Furthermore, forest landscapes contribute ecosystem services to the public [7].
Urban forested areas potentially play a key role in the construction of healthy cities [8]. The World Health Organization (WHO) announced goals for healthy cities, which aim to continuously improve the health and quality of life of city dwellers [9]. Various studies have explored physiological and psychological relationships, including taste [10], touch [11], smell [12], vision [13], hearing [14] and other senses [15,16]. In general, vision is considered the most important driver for sensory and cognition effects in environmental exposure. However, the second important driver, hearing, also plays a key role in cognition and behavior. This includes tracking functions, such as spatial cognition without visuals [17]; positioning and connecting functions, such as judging sound sources and audiovisual relationships [18]; and focusing and memory functions, such as understanding of the environment combining visual information [19]. Thus, hearing potentially occupies an important position in the perception of urban forested areas.
Soundscape is described in the ISO as ‘acoustic environment as perceived or experienced and/or understood by a person or people, in context’ [20]. In urban forested areas, natural soundscape is considered a dominant type as it performs in natural sound occurrences [21], perceived geophony and biophony [22], and birdsong identification [23]. Exposure to the biophilic outdoor environment contributes to health and recovery, and is applied especially in forest-based health care [24]. Previous studies used questionnaire responses to explore the perception of forest soundscape in national parks [25], urban parks [18], and forest parks [26]. The Perceived Restorativeness Soundscape Scale (PRSS) was developed and tested to assess a soundscape’s potential to provide psychological restoration [27]. The PRSS focuses on the dimensions of psychological restoration, such as curiosity, interest, concentration, and demand for soundscape in context. However, the dimensions of physiological restoration for forest soundscapes are lacking, especially in different forest structures. Another potential research gap is how to simulate advanced mental processes that elicit physiological responses and contribute to the modelling of psychophysical parameters to physiological parameters in forested areas.
This study was conducted to fill these gaps and aims to: (1) explore the relationship between perceived soundscape and acoustical parameters in different forest structures; (2) observe physiological indicators in different forest structures; and (3) model the physiological restorative role of soundscapes in forested areas.
2. Methodology
2.1. Study Area
Our study was conducted in the arboretum (8,469,323 m2) of Fuzhou National Forest Park (57,439,074 m2) in Fuzhou, Fujian, China. Fuzhou National Forest Park is located to the north of downtown Fuzhou. It has a subtropical oceanic monsoon climate with an average annual rainfall of about 1438.5 mm. The average wind speed is 1.8 m/s, relative humidity is 75%, and average annual sunshine is 1848 h. The arboretum consists of well-maintained paths, various tree species, and high forest coverage (65.54%). We found that the arboretum was a suitable site for soundscape research as it contains potential sources of both natural sounds and man-made sounds.
Based on different forest structures and previous research [28,29], 20 observation sites were chosen in the arboretum (see Figure 1), comprising five in bamboo forests, five in broad-leaved forests, five in coniferous forests, and five in coniferous/broad-leaved mixed forests. The acoustic environmental conditions at each site were measured for 5 min, and included LAeq, L10, L90 and L10-L90. The measured LAeq ranged from 43.9 dBA to 76.8 dBA, L10 from 47.7 dBA to 78.6 dBA, L90 from 41.8 dBA to 63.1 dBA, and L10-L90 from 1.9 dBA to 22.1 dBA.
2.2. Physiological and Soundscape Information
2.2.1. Physiological Parameters
To observe participant responses to stress inducement, we examined the variations in the physiological parameters between baseline value (BL) with eye mask and earmuffs, and pre-test value (Pr) after stress inducement. Pr-BL represented the variation in physiological parameters contributed by stress inducement.
Previous studies have shown that four physiological parameters potentially reflect the role of physiological restoration [30,31,32]. The first parameter is electromyogram (EMG) and is influenced by frontal muscle activity. Frontal muscle activity decrease when participants are exposed to positive influences from environmental scenes, and increase when exposed to negative influences [33]. This influences EMG levels. The second parameter is electrodermal activity (EDA), a representative measure for mood changes in biometrics research [34]. EDA is affected by exocrine sweat gland activity based on the sympathetic nervous system increasing secretion from sweat glands [35]. The third parameter is photoplethysmography (PPG), which uses low-intensity infrared (IR) light to detect blood volume changes in the microvascular bed of tissue [36]. The fourth parameter is respiration (RESP), the movement of respiratory gases (such as oxygen and carbon dioxide) into and out of the lungs [37].
Physiological parameters were measured using ErgoLAB [38,39], a wearable polygraph with 2048 Hz sampling rate, 16-bit resolution and a wireless communication frequency of 2.4 GHz. We found that each of the physiological parameters had different signal accuracies: 0.183 μV for EMG with 16-bit resolution, 0.01 μs for EDA, 1% for PPG, and 1 rpm for RESP.
To observe the role of physiological restoration in different forest structures, we gathered the pre-test value (Pr) for physiological parameters in bamboo forests, broad-leaved forests, coniferous forests, and coniferous/broad-leaved mixed forests. We then gathered the post-test value (Po) in the same forest structures. The absolute value of Pr-Po reflected how relaxed the participants were and the degree of physiological experienced restoration. Pr-Po was represented by ΔEMG, ΔEDA, ΔPPG, and ΔRESP, respectively.
Five scales were selected to represent the degree to which soundscapes affect physiological restorative role (PRR) [40]. These included ‘extremely restorative’, ‘very restorative’, ‘moderately restorative’, ‘slightly restorative’, and ‘not restorative at all’. To match the five scales, the intervals of ΔEMG, ΔEDA, ΔPPG, and ΔRESP were derived. In green space, EMG, EDA and RESP values are the same order of magnitude, with maximum around or less than 10 [41]. PPG value is another order of magnitude with maximum around or less than 40. Then, the maximum values were split into twenty parts to observe the variation of parameters. The interval length of ΔEMG, ΔEDA, and ΔRESP was 0.5, and that of ΔPPG was 2. The value of EMG, EDA and RESP dropped gradually without stress inducement in general [42]. For PPG, due to be affected by factors other than stress inducement, we took a symmetric interval distribution. Thus, the scales corresponding to the intervals of ΔEMG, ΔEDA, and ΔRESP were [−∞, −1.5), [−1.5, −1.0), [−1.0, −0.5), [−0.5, 0.0), and [0.0, +∞]. ΔPPG was [−∞, −3.0), [−3.0, −1.0), [−1.0, 1.0), [1.0, 3.0), and [3.0, +∞].
2.2.2. Soundscape Parameters
In this study, questionnaires and measuring equipment were used to gather soundscape parameters in different forest structures [43]. Questionnaires were conducted to inquire about the pleasantness of perceived soundscape (PL): not pleasant at all (+1), slightly pleasant (+2), moderately pleasant (+3), very pleasant (+4), and extremely pleasant (+5).
Soundscape parameters were collected via measurements from Type-1 sound level meters (AWA 6228+) at 1.5 m height. This included measuring LAeq, L10, L90, and L10-L90. LAeq was the A-weighted equivalent sound pressure level. L10 and L90 were statistical levels that represented the levels that exceeded 10% and 90%, respectively. L10-L90 measured temporal variability and represented the difference between L10 and L90.
2.2.3. Stress Inducement
Stress inducement came mainly through mathematical calculations for participants and consisted of two parts. The first part involved asking participants to add two three-digit random numbers. The results were a four-digit number, such as ‘571 + 815 = 1386’. The second part involved asking them to multiply a two-digit and a one-digit random number. The results were a three-digit number, such as ’89 × 5 = 445′. There were ten sets in total, with five sets in each part.
2.3. Physiological Restorativeness Soundscape Modeling
To simulate psychophysical processes that elicited physiological responses, a back-propagation neural network was created to determine the forecasting model from psychophysical parameters to physiological parameters [44]. For the back-propagation neural network, LAeq, L10 L90, L10-L90, and PL were selected as input variables, while ΔEMG, ΔEDA, ΔPPG, ΔRESP, and PRR were selected as output variables.
There were two hidden layers in the physiological restorativeness soundscape model (PRS model), which included 5 neurons and 4 neurons in the first and second hidden layers, respectively. Hyperbolic tangent functions were used for all neurons in each hidden layer.
2.4. Procedure
2.4.1. Participants and Equipment Measuring
Physiological and soundscape information were gathered on weekdays with sunny weather between 9:00 and 17:00 in the months of February and March 2020. Young adults make up the majority of urban forest visitors [45]. Thus, we randomly recruited staff and graduate students from local universities in Fuzhou. A total of 48 participants (male = 25, female = 23, average 29.5 ± 5.1) with normal hearing abilities were recruited to respond to questionnaires and gather physiological information in a sitting position. Before the test began, all participants were required to sign a consent form outlining the details of the study, including content, purpose and methodology. Furthermore, participants could quit the study at any point if they felt uncomfortable during the process.
In this study, the measuring process included five steps with a total duration of 15 min (See Figure 2). Due to the limited number of ErgoLAB devices (24 sets), all participants were divided into two groups and required to complete the measuring process separately by single group. In the group, half of the participants were tested at the same time.
Step 1: Preparatory work. We spent 2 min on participants putting on ErgoLAB and placing acoustical equipment at an observation site.
Step 2: Peaceful statement. Participants spent 2 min on maintaining a peaceful state, wearing eye masks and earmuffs. Meanwhile, we used ErgoLAB to gather their BL values in this step.
Step 3: Stress inducement. We spent 5 min on inducing stress in participants. Meanwhile, we used ErgoLAB to gather their Pr values in this step. Participants were required to wear earmuffs before soundscape exposure (Step 4). This contributed to a reduction in auditory short-term memory effects resulting from non-experimental procedures.
Step 4: Soundscape exposure. Participants were exposed to the soundscape at an observation site for 5 min. Meanwhile, we used ErgoLAB to gather their Po values, and used sound-level meters to gather acoustical information. To focus on the physiological restorative role of soundscape, participants were required to wear eye masks during soundscape exposure. This contributed to a reduction in memory attenuation caused by visual distraction, and an increase in the level of their auditory attention [46].
Step 5: Questionnaire process. Participants wearing earmuffs spent 1 min on filling out questionnaires. We gathered the values of perceived soundscape in this step.
After this, we conducted tests to analyze reliability and validity for physiological and psychological parameters. Our results suggested that Cronbach’s alpha of physiological and psychological parameters was 0.87, and Cronbach’s alpha of each parameter ranged from 0.71 to 0.93. Then, we found that KMO of physiological and psychological parameters was more than 0.75, suggesting an acceptable reliability and validity [28].
2.4.2. Statistical Analyses
To explore the physiological restorative role of soundscape in different forest structures, various statistical analyses were used. Pearson’s correlation was conducted to analyze the relationship between acoustic parameters and perceived soundscape. T-test was conducted to analyze: (1) EMG, EDA, PPG, and RESP at tranquility and stress-inducement state; and (2) EMG, EDA, PPG, and RESP during pre-test and post-test in different forest structures. Principal components analysis (PCA) was used to determine the different contents of PRR in psychophysical and physiological parameters. The statistical analysis was carried out in SPSS 26.0. To forecast psychophysical parameters to physiological parameters, a back-propagation neural network was conducted using Matlab R2021a.
3. Results
3.1. Relationship between Perceived Soundscape and Acoustical Parameters
Figure 3 shows the distribution of soundscape pleasantness degree (PL) and acoustical parameters, as well as L10, L90, L10-L90 and LAeq, at the study sites. Figure 3a shows that L10 was distributed during interval [51.1, 62.2] dBA, and the distribution of PL was concentrated at response 4 (‘very pleasant’). As L10 further increased, the distribution of PL fluctuated from response 2 to 4 (‘slightly pleasant’ to ‘very pleasant’). Figure 3b shows that L90 was distributed during interval [43.0, 54.8] dBA, and the distribution of PL was during interval [3, 4]. As L90 further increased, the distribution of PL fluctuated from response 2 to 3 (‘slightly pleasant’ to ‘moderately pleasant’). Figure 3c shows that L10-L90 was distributed during interval [5.3, 14.7] dBA, and the distribution of PL was concentrated at response 4 (‘very pleasant’). As L90 further increased, the distribution of PL fluctuated during interval [2, 3]. Furthermore, Figure 3d shows that LAeq was distributed during interval [44.7, 55.9] dBA, and the distribution of PL was concentrated at response 4 (‘very pleasant’). The distribution of PL decreased from [3, 4] to [2, 3] as LAeq increased from [55.9, 62.9] dBA to more than 62.9 dBA.
In general, there was a negative tendency between PL and acoustical parameters. We conducted the Pearson correlation analysis to explore the different relationships between these parameters in different forest structures (See Table 1). Based on a total of 960 sets of data, our results showed that the value of perceived soundscape significantly correlated with all acoustical parameters in bamboo forests, and with L10, L90 and L10-L90 in other forest structures.
3.2. Physiological Indicators in Different Forest Structures
3.2.1. Effect of Stress Inducement for Physiological Indicators
Table 2 shows the variations of electromyography (EMG), electrodermal activity (EDA), photoplethysmography (PPG) and respiration (RESP) at tranquility and stress inducement. Our results showed that the values of EMG, EDA, PPG, and RESP rose at stress inducement based on the difference between Pr and BL. This suggested that the process of stress inducement increased physiological activity such as prefrontal muscle contraction, vigorous activity of exocrine sweat glands, accelerated pulse, and shortness of breath. Furthermore, results of paired-sample t-tests showed significant changes for all physiological indicators, which suggested that the process of stress inducement was effective for physiological indicators in this study.
3.2.2. Variation Degree of Physiological Indicators
We conducted t-tests of EMG, EDA, PPG, and RESP in different forest structures based on stress inducement (see Table 3) during pre-test and post-test conditions. For EMG, EDA, and RESP, there were negative tendencies in different forest structures. These physiological indicators showed the most obvious drop in values while in bamboo forests. The decline of EMG and EDA were not obvious in broad-leaved forests. Furthermore, for the PPG of participants, results showed a negative tendency in bamboo forests.
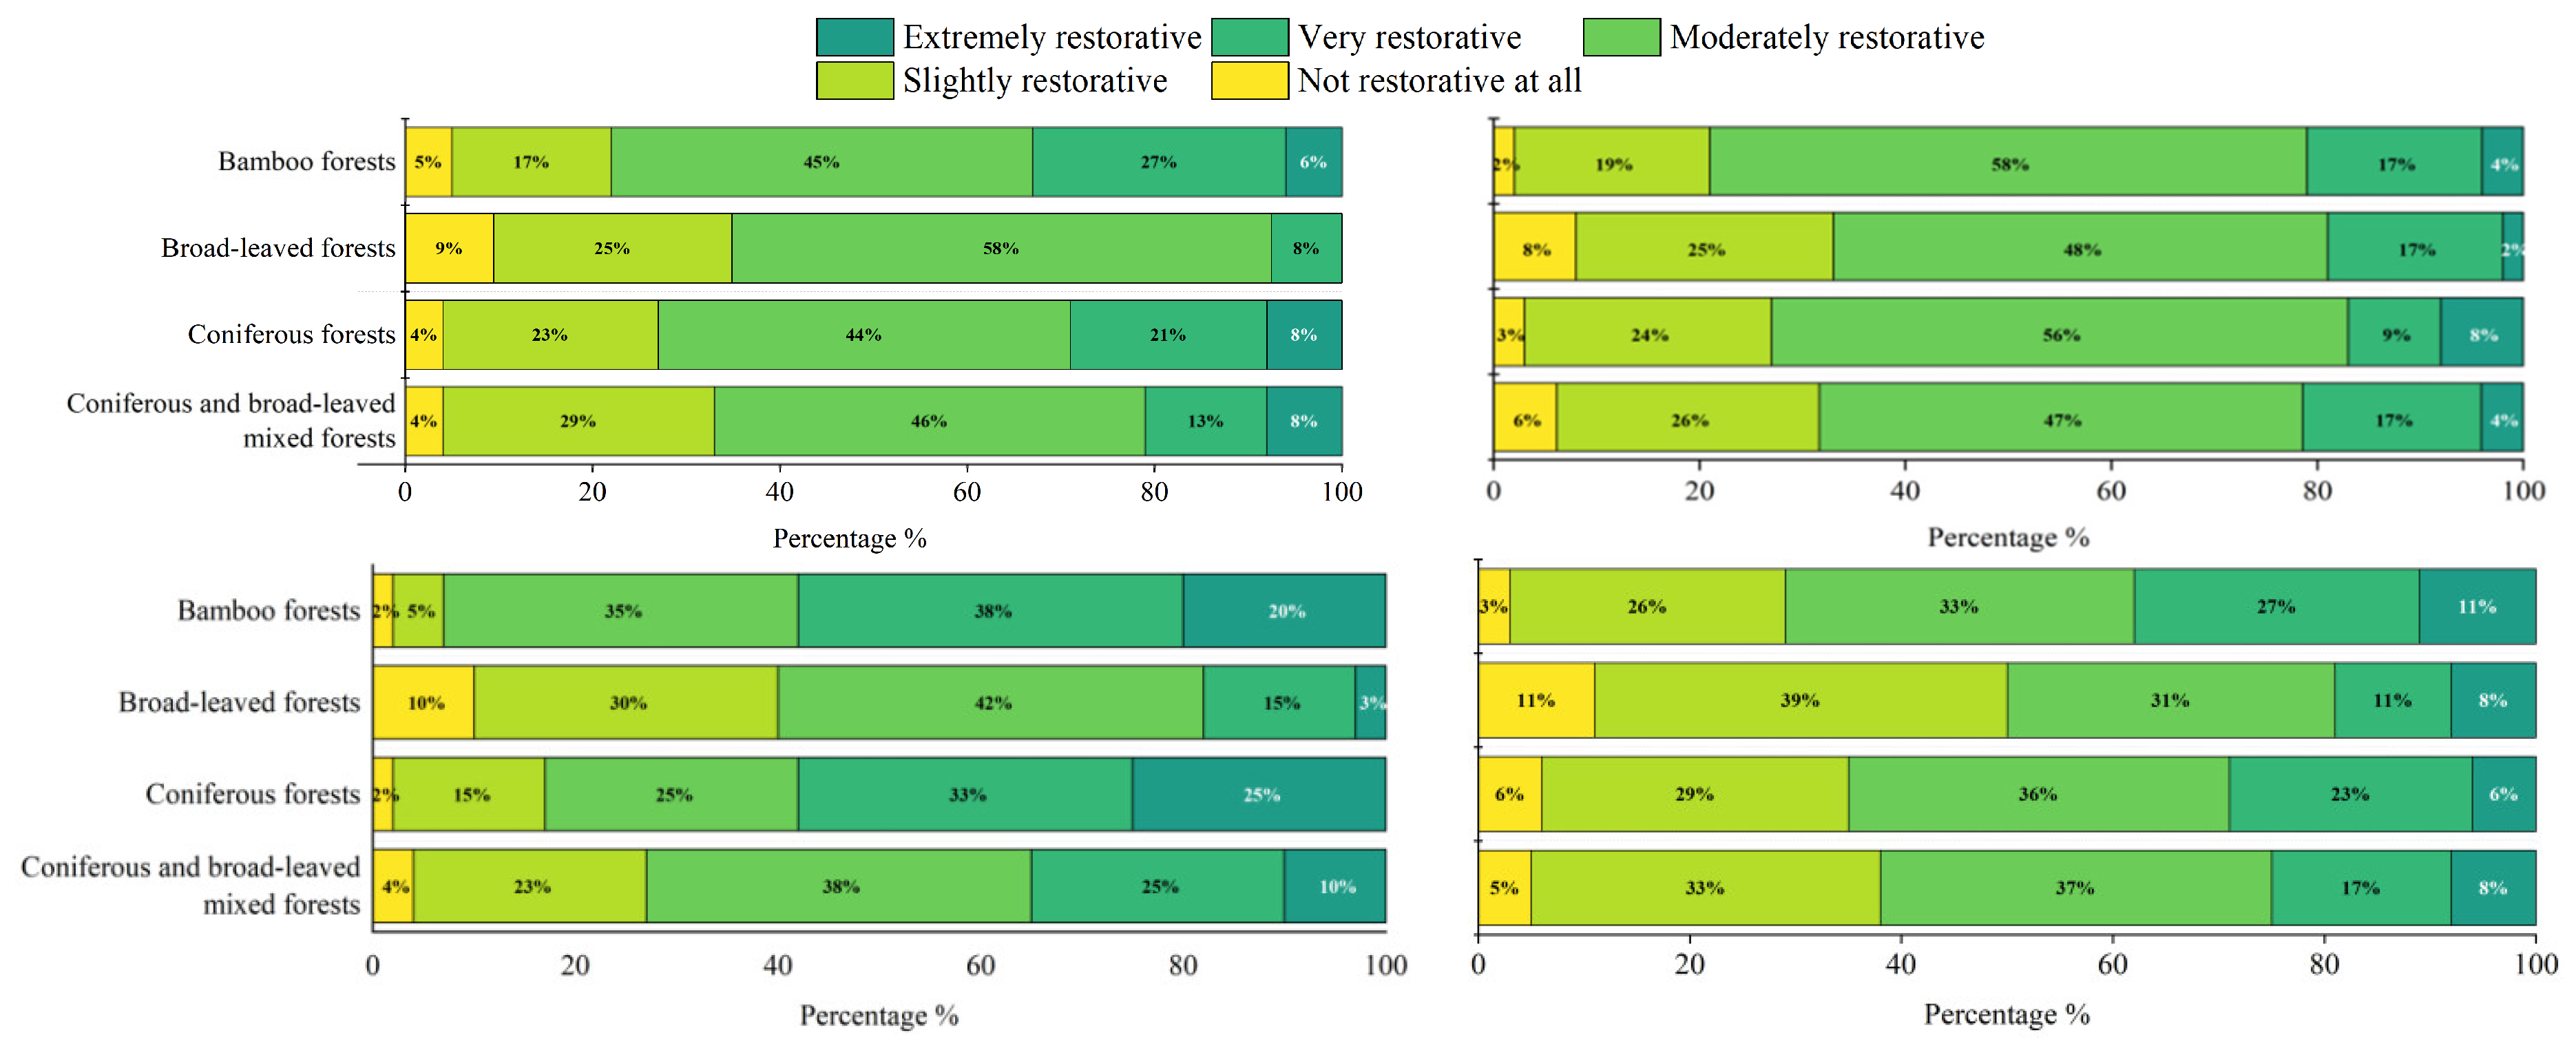
For ΔEMG and ΔEDA (See Figure 4), most participants recorded ‘moderately restorative’ in different forest structures. The total proportion of answers that included ‘moderately restorative’ and above was more than 65%. This suggested that all forest structures played a role in EMG and EDA for the participants. Furthermore, our results showed that ‘slightly restorative’ and ‘not restorative at all’ amounted to a small proportion of answers when in bamboo forests, compared to other forest structures. Few participants answered ‘extremely restorative’ in broad-leaved forests, which was consistent with the above results for the decline of EMG.
3.3. Modelling the Physiological Restorative Role of Soundscape
3.3.1. Relationship between Psychophysical and Physiological Parameters
Psychophysical and physiological datasets were combined to create a PRR model. The model could be applied to different forest structures to explore the relationship between psychophysical and physiological parameters.
Principal components analysis (PCA) was conducted to reduce the dimensionality of psychophysical and physiological parameters, and to combine the original variables into potential restorative factors [47]. Table 4 shows the PCA results of the psychophysical and physiological dataset. Two components obtained by PCA showcased the differences between psychophysical and physiological parameters: component 1 showed that 66.22% of the variance in functional parameter was due to its large capacity for loading most of the psychophysical and physiological parameters; component 2 showed that 21.68% of the variance in background sound was due to a high factor of loading LAeq and L90. As restorative factors for the public, these components affected human perception and response to the soundscape in different forest structures. Thus, we suggested a potential interaction between psychophysical parameters and physiological parameters.
3.3.2. Back-Propagation Neural Network for PRS Model
In our physiological restorativeness soundscape model (PRS model), 960 samples were used and divided into three randomly chosen sets: training set (672 samples, 70.0%), test set (144 samples, 15.0%) and validation set (144 samples, 15.0%). Three-fold cross validation was also conducted.
Table 5 shows the accuracy of the PRS model based on the validation set. The accuracy percentage of both the training and testing sets was more than 90%. After training the PRS model, classified soundscape data results indicated that the accuracy of ΔEMG, ΔEDA, ΔPPG, ΔRESP, and PR were 81.1%, 87.2%, 95.6%, 92.9% and 86.2%, respectively. As shown in Figure 5, ΔEMG, ΔEDA, and ΔRESP maintained stable accuracy during interval [−2.5, 2.5], while ΔPPG and PRR maintained stable accuracy during interval [−5.0, 10.0] and [−2.5, 3.5], respectively. Accuracy decreased when values were outside these intervals.
Figure 6 showcases the importance of input variables for determining outputs. Results showed that PL impacted accuracy the most and accounted for more than 35% of the independent variable importance. This suggested that perception was a main driver for physiological parameters.
4. Discussion
When Figure 3a,d were combined, our findings showed that LAeq and L10 were important drivers that influenced questionnaire responses in urban forests. This was similar to previous studies conducted in urban green areas [48,49]. We also found that LAeq and L10 displayed overlapping intervals, since there were fewer sources of mechanical noise in urban forests and animals did not need to raise their volume to communicate [50]. As our observation sites were in areas with some tourist activity, the maximum LAeq was higher when compared to previous studies [51], which suggests more various soundscape exposure contributing to more significant PRR in our research. Furthermore, our results showed a similarity between the distribution of L90 and L10-L90 (see Figure 3b,c). Most of these values fluctuated and dropped after values reached the threshold, which suggested that the threshold may conduct enough physiological and psychological phenomena on an individual to change them from a steady state to an excited state. Table 4 showed that L90 and L10-L90 influenced the data for the parameters of physiological restoration from different components. Therefore, there should be more attention and control over L90 and L10-L90, especially in forest-based health care [52]. In practice, L90 that is lower than 54.8 dBA is beneficial in the creation of quiet areas in urban areas, while L10-L90 lower than 14.7 dBA is effective in weakening the negative effects of eventual and unexpected sound events [53,54].
Our findings showed that EMG was the most sensitive physiological parameter in our data set (see Table 3 and Figure 4). This suggested an optimal effect of physiological restorativeness because of the dual sensory channels of input and output in the muscular system, contributing to the cognition and response of participants in forest soundscapes [55,56]. However, the accuracy of EMG was lower than the other parameters in the artificial neural network (ANN). This suggested that EMG was influenced by other environmental drivers and the individual’s senses. We also found that the coefficients ranking of parameters in the principal components analysis (PCA) and the accuracy ranking of parameters in the ANN testing group were potentially consistent (see Table 4 and Table 5): ΔEMG > ΔEDA > ΔRESP > ΔPPG. As shown in Figure 5, our ANN results suggested that L10–90 played the most important role of all physical parameters in determining the output value of soundscape. L10–90 was also consistent with the highest coefficient in the functional parameter. These results suggested that PCA can be used as a pre-experiment method for the creation of a model for the physiological restorative role of soundscape (PRR model). Figure 6 showed that soundscape questionnaire responses were the most important for input indicators and suggested that physiological responses were based on the cognitive basis of soundscape [57]. Furthermore, soundscape pleasantness contributed to the enhancement of attention to sound sources [58], which promoted a physiological response. Thus, we found that questionnaires were one of the most important methods for gathering physiological information. Furthermore, previous research suggests different absorption and radiation of the leaves and woods among different forest structures [55,59]. This helps us to understand the physiological restorative role of soundscapes in different forest structures strategies when proposing suitable forest-based health care.
In our study, some limitations may have been presented. Although we tried to minimize the effect of vision on physiological responses by using eye masks, participants were potentially affected by somatosensory effects including the variation of temperature and humidity. Additionally, audio-visual interaction was expected in urban forests, but we did not consider audio-visual drivers in this study.
5. Conclusions
Urban forested areas contribute to favorable exposure to the biophilic outdoor environment, which is beneficial to public health and recovery. This study revealed that psychophysical parameters jointly function in the physiological restorative role of soundscape in urban forested areas. Our findings showed that: (1) LAeq and L10 were important drivers that influence questionnaire responses; (2) EMG was the most sensitive physiological parameter; and (3) L10-L90 played the most important role of all physical parameters in the PRS model.
We suggest that the biophilic outdoor environment may offer physiological restorative potential for therapy after COVID-19. Furthermore, other potential drivers such as audio-visual interaction in forested areas may be considered in future studies to further explore physiological restorative patterns in different forest structures.
Author Contributions
Conceptualization, X.-C.H. and S.C.; methodology, X.-C.H. and J.L.; software, E.D.; formal analysis, X.-C.H. and J.-B.W.; investigation, X.-C.H. and S.C.; data curation, X.-C.H.; writing—original draft preparation, X.-C.H., S.C. and J.L.; writing—review and editing, E.D. and J.-B.W.; supervision, Y.C. All authors have read and agreed to the published version of the manuscript.
Funding
This project was supported by the National Natural Science Foundation of China (52208052, 51838003), the National Key Research & Development Program of China (2019YFD1100405), and the Program of Humanities and Social Science Research Program of Ministry of Education of China (Grant No. 21YJCZH038).
Informed Consent Statement
Informed consent was obtained from all subjects involved in the study.
Conflicts of Interest
The authors declare no conflict of interest.
References
- Leske, S.; Klves, K.; Crompton, D.; Arensman, E.; Leo, D.D. Real-time suicide mortality data from police reports in queensland, australia, during the COVID-19 pandemic: An interrupted time-series analysis. Lancet Psychiatry 2021, 8, 58–63. [Google Scholar] [CrossRef]
- Stec, K. Yoga and relaxation for promoting public health: A review of the practice and supportive research. Biomed. Hum. Kinet. 2020, 12, 133–140. [Google Scholar] [CrossRef]
- Lu, M.; Hu, S.; Mao, Z.; Liang, P.; Xin, S.; Guan, H. Research on work efficiency and light comfort based on EEG evaluation method—Sciencedirect. Build. Environ. 2020, 183, 107122. [Google Scholar] [CrossRef]
- Escobedo, F.; Giannico, V.; Jim, C.; Sanesi, G.; Lafortezza, R. Urban forests, ecosystem services, green infrastructure and nature-based solutions: Nexus or evolving metaphors? Urban For. Urban Green. 2019, 37, 3–12. [Google Scholar] [CrossRef]
- Qiu, M.; Sha, J.; Utomo, S. Listening to Forests: Comparing the Perceived Restorative Characteristics of Natural Soundscapes before and after the COVID-19 Pandemic. Sustainability 2021, 13, 293. [Google Scholar] [CrossRef]
- Wang, P.; He, Y.; Yang, W.; Li, N.; Chen, J. Effects of Soundscapes on Human Physiology and Psychology in Qianjiangyuan National Park System Pilot Area in China. Forests 2022, 13, 1461. [Google Scholar] [CrossRef]
- Shengyan, D.; Fude, S.; Lexiang, Q.; Xinxiang, C.; Shuang, L.; Haomin, L. Forest landscape patterns dynamics of Yihe-Luohe river basin. J. Geogr. Sci. 2003, 13, 153–162. [Google Scholar] [CrossRef]
- Han, L.; Shi, L.; Yang, F.; Xiang, X.Q.; Gao, L. Method for the evaluation of residents’ perceptions of their community based on landsenses ecology. J. Clean. Prod. 2020, 281, 124048. [Google Scholar]
- Boulos, M.K.; Al-Shorbaji, N.M. On the internet of things, smart cities and the who healthy cities. Int. J. Health Geogr. 2014, 13, 10. [Google Scholar] [CrossRef] [Green Version]
- Ding, R.; Logemann, J.A.; Larson, C.R.; Rademaker, A.W. The effects of taste and consistency on swallow physiology in younger and older healthy individualsa surface electromyographic study. J. Speech Lang. Hear. Res. 2014, 46, 977–989. [Google Scholar] [CrossRef]
- Yackinous, C.; Guinard, J.X. Relation between prop taster status and fat perception, touch, and olfaction. Physiol. Behav. 2001, 72, 427–437. [Google Scholar] [CrossRef]
- Xiao, J.; Tait, M.; Kang, J. A perceptual model of smellscape pleasantness. Cities 2018, 76, 105–115. [Google Scholar] [CrossRef] [Green Version]
- Hunt, D.F.; Hunt, H.; Park, J.H. Bioenergetic costs and state influence distance perception. Physiol. Behav. 2017, 180, 103–106. [Google Scholar] [CrossRef] [PubMed] [Green Version]
- Skoe, E.; Krizman, J.; Spitzer, E.; Kraus, N. The auditory brainstem is a barometer of rapid auditory learning. Neuroence 2013, 243, 104–114. [Google Scholar] [CrossRef]
- Bingham, G.P.; Winona, S.C.; Zhu, Q. Information about relative phase in bimanual coordination is modality specific (not amodal), but kinesthesis and vision can teach one another. Hum. Mov. Sci. 2018, 60, 98–106. [Google Scholar] [CrossRef]
- Liu, J. Towards a unified model of human information behavior: An equilibrium perspective. J. Doc. 2017, 73, 666–688. [Google Scholar] [CrossRef]
- Viaud-Delmon, I.; Warusfel, O. From ear to body: The auditory-motor loop in spatial cognition. Front. Neurosci. 2014, 9, 283. [Google Scholar] [CrossRef] [Green Version]
- Guo, X.; Liu, J.; Albert, C.; Hong, X.-C. Audio-visual interaction and visitor characteristics affect perceived soundscape restorativeness: Case study in five parks in China. Urban For. Urban Green. 2022, 77, 127738. [Google Scholar] [CrossRef]
- Steffens, J. When do we judge sounds? relevant everyday situations for the estimation of ecological validity of indoor soundscape experiments. J. Acoust. Soc. Am. 2013, 133, 3371. [Google Scholar] [CrossRef]
- ISO/TS 12913-1:2014. Acoustics–Soundscape–Part 1: Definition and Conceptual Framework; International Organization for Standardization ISO: Geneva, Switzerland, 2014.
- Hong, X.-C.; Wang, G.-Y.; Liu, J.; Dang, E. Perceived loudness sensitivity influenced by brightness in urban forests: A comparison when eyes were opened and closed. Forests 2013, 11, 1242. [Google Scholar] [CrossRef]
- Miller, Z.D.; Hallo, J.C.; Sharp, J.L.; Powell, R.B.; Lanham, J.D. Birding by ear: A study of recreational specialization and soundscape preference. Hum. Dimens. Wildl. 2014, 19, 498–511. [Google Scholar] [CrossRef]
- Hu, F.; Wang, Z.; Sheng, G.; Lia, X.; Chen, C.; Geng, D.; Hong, X.; Xu, N.; Zhu, Z.; Zhang, Z.; et al. Impacts of national park tourism sites: A perceptual analysis from residents of three spatial levels of local communities in Banff national park. Environ. Dev. Sustain. 2021, 24, 3126–3145. [Google Scholar] [CrossRef]
- Simkin, J.; Ojala, A.; Tyrvinen, L. Restorative effects of mature and young commercial forests, pristine old-growth forest and urban recreation forest—A field experiment. Urban For. Urban Green. 2020, 48, 126567. [Google Scholar] [CrossRef]
- Xu, X.; Wu, H. Audio-visual interactions enhance soundscape perception in China’s national parks. Urban For. Urban Green. 2020, 61, 127090. [Google Scholar] [CrossRef]
- Calleja, A.; Díaz-Balteiro, L.; Iglesias-Merchan, C.; Solio, M. Acoustic and economic valuation of soundscape: An application to the ‘retiro’ urban forest park. Urban For. Urban Green. 2017, 27, 272–278. [Google Scholar] [CrossRef]
- Payne, S.R. The production of a perceived restorativeness soundscape scale. Appl. Acoust. 2013, 74, 255–263. [Google Scholar] [CrossRef]
- Hong, X.; Wang, G.; Liu, J.; Lan, S. Cognitive persistence of soundscape in urban parks. Sustain. Cities Soc. 2019, 51, 17–26. [Google Scholar] [CrossRef]
- Kim, Y.H.; Hwang, I.H.; Hong, J.Y.; Lee, S.C. Effects of vegetation on soundscape of an urban religious precinct: Case study of Myeong-dong cathedral in Seoul. Build. Environ. 2019, 155, 389–398. [Google Scholar] [CrossRef]
- Chang, C.Y.; Hammitt, W.E.; Chen, P.K.; Machnik, L.; Su, W.C. Psychophysiological responses and restorative values of natural environments in taiwan. Landsc. Urban Plan. 2008, 85, 79–84. [Google Scholar] [CrossRef]
- Gathright, J.; Yamada, Y.; Morita, M. Comparison of the physiological and psychological benefits of tree and tower climbing. Urban For. Urban Green. 2006, 5, 141–149. [Google Scholar] [CrossRef]
- Shu, S.; Ma, H. Restorative effects of urban park soundscapes on children’s psychophysiological stress. Appl. Acoust. 2020, 164, 107293. [Google Scholar] [CrossRef]
- Korpela, K.M.; Klemettila, T.; Hietanen, J.K. Evidence for rapid affective evaluation of environmental scenes. Environ. Behav. 2002, 34, 634–650. [Google Scholar] [CrossRef]
- Kim, J.; Cha, S.H.; Koo, C.; Tang, S.-K. The effects of indoor plants and artificial windows in an underground environment. Build. Environ. 2018, 138, 53–62. [Google Scholar] [CrossRef]
- Martinsen, O.G.; Grimnes, S. Bioimpedance and Bioelectricity Basics; Academic Press: Pittsburgh, PA, USA, 2011. [Google Scholar]
- Elsadek, M.; Sun, M.; Sugiyama, R.; Fujii, E. Cross-cultural comparison of physiological and psychological responses to different garden styles. Urban For. Urban Green. 2019, 38, 74–83. [Google Scholar] [CrossRef]
- Calfee, C.S.; Delucchi, K.; Parsons, P.E.; Thompson, B.T.; Ware, L.B.; Matthay, M.A.; Nhlbi Ards Network. Subphenotypes in acute respiratory distress syndrome: Latent class analysis of data from two randomised controlled trials. Lancet Respir. Med. 2014, 2, 611–620. [Google Scholar] [CrossRef] [Green Version]
- Liu, L.; Qu, H.; Ma, Y.; Wang, K.; Qu, H. Restorative benefits of urban green space: Physiological, psychological restoration and eye movement analysis. J. Environ. Manag. 2022, 301, 113930. [Google Scholar] [CrossRef]
- Liu, Y.; Hu, M.; Zhao, B. Audio-visual interactive evaluation of the forest landscape based on eye-tracking experiments. Urban For. Urban Green. 2019, 46, 126476. [Google Scholar] [CrossRef]
- Ye, H.; Zhu, X. Study on the Effect of Spatial Characteristics and Health Restoration of Urban Parks in Harbin City in Autumn—Taking Zhaolin Park as an Example. J. Hum. Settl. West China 2018, 33, 73–79. [Google Scholar]
- Wang, Z.; Li, Y.; An, J.; Dong, W.; Li, H.; Ma, H.; Wang, J.; Wu, J.; Jiang, T.; Wang, G. Effects of Restorative Environment and Presence on Anxiety and Depression Based on Interactive Virtual Reality Scenarios. Int. J. Environ. Res. Public Health 2022, 19, 7878. [Google Scholar] [CrossRef]
- Huang, S.; Qi, J.; Li, W.; Dong, J.; Bosch, C.K.V.D. The Contribution to Stress Recovery and Attention Restoration Potential of Exposure to Urban Green Spaces in Low-Density Residential Areas. Int. J. Environ. Res. Public Health 2021, 18, 8713. [Google Scholar] [CrossRef]
- ISO/TS 12913-2:2018. Acoustics—Soundscape—Part 2: Data Collection and Reporting Requirements; International Organization for Standardization ISO: Geneva, Switzerland, 2018.
- Yu, L.; Kang, J. Modeling subjective evaluation of soundscape quality in urban open spaces: An artificial neural network approach. J. Acoust. Soc. Am. 2009, 126, 1163–1174. [Google Scholar] [CrossRef] [PubMed]
- Yang, J.; Yu, Y.; You, L. Segmentation by Visitor Motivation in Fuzhou National Forest Park: A Factor-Cluster Approach. Scientia Silvae Sin. 2015, 51, 106–116. [Google Scholar]
- Perfect, T.J.; Andrade, J.; Eagan, I. Eye closure reduces the cross-modal memory impairment caused by auditory distraction. J. Exp. Psychol. Learn. Mem. Cogn. 2011, 37, 1008–1013. [Google Scholar] [CrossRef]
- Nichols, S.M.; Bradley, D.L. Characterization of very low frequency ambient noise by principal component analysis. J. Acoust. Soc. Am. 2016, 140, 3352. [Google Scholar] [CrossRef]
- Zhang, X.; Ba, M.; Kang, J.; Meng, Q. Effect of soundscape dimensions on acoustic comfort in urban open public spaces. Appl. Acoust. 2018, 133, 73–81. [Google Scholar] [CrossRef] [Green Version]
- Ma, K.W.; Mak, C.M.; Hai, M.W. Effects of environmental sound quality on soundscape preference in a public urban space. Appl. Acoust. 2021, 171, 107570. [Google Scholar] [CrossRef]
- Farina, A. Soundscape Ecology: Principles, Patterns, Methods and Applications; Springer: Berlin/Heidelberg, Germany, 2021. [Google Scholar]
- Hong, X.; Liu, J.; Wang, G.; Jiang, Y.; Wu, S.; Lan, S. Factors influencing the harmonious degree of soundscapes in urban forests: A comparison of broad-leaved and coniferous forests. Urban For. Urban Green. 2019, 39, 18–25. [Google Scholar] [CrossRef]
- Nilsson, K. Papers from sessions on forests, trees and human health and wellbeing. Urban For. Urban Green. 2006, 5, 109. [Google Scholar] [CrossRef]
- Cerwén, G.; Mossberg, F. Implementation of Quiet Areas in Sweden. Int. J. Environ. Res. Public Health 2019, 16, 134. [Google Scholar] [CrossRef] [Green Version]
- Hong, X.-C.; Wang, G.-Y.; Liu, J.; Song, L.; Wu, E.T. Modeling the impact of soundscape drivers on perceived birdsongs in urban forests. J. Clean. Prod. 2021, 292, 125315. [Google Scholar] [CrossRef]
- Hong, X.-C.; Zhu, Z.-P.; Liu, J.; Geng, D.-H.; Wang, G.-Y.; Lan, S.-R. Perceived occurrences of soundscape influencing pleasantness in urban forests: A comparison of broad-leaved and coniferous forests. Sustainability 2019, 11, 4789. [Google Scholar] [CrossRef] [Green Version]
- Payne, S.R.; Guastavino, C. Exploring the validity of the perceived restorativeness soundscape scale: A psycholinguistic approach. Front. Psychol. 2018, 9, 2224. [Google Scholar] [CrossRef] [PubMed] [Green Version]
- Dijk, P.V.; Başkent, D.; Gaudrain, E.; Kleine, E.D.; Wagner, A.; Lanting, C. Physiology, psychoacoustics and cognition in normal and impaired hearing. In Advances in Experimental Medicine Biology; Springer International Publishing: Berlin/Heidelberg, Germany, 2017. [Google Scholar]
- Erfanian, M.; Mitchell, A.; Aletta, F.; Kang, J. Psychological well-being and demographic factors can mediate soundscape pleasantness and eventfulness: A large sample study. J. Environ. Psychol. 2021, 77, 101660. [Google Scholar] [CrossRef]
- Embleton, T.F.W. Sound propagation in homogeneous deciduous and evergreen woods. J. Acoust. Soc. Am. 1963, 35, 1119. [Google Scholar] [CrossRef]
Figure 1.
Observation sites in study area.

Figure 2.
Measurements time stamp for gathering parameters.

Figure 3.
Distribution of soundscape pleasantness level and (a) L10, (b)L90, (c) L10-L90 and (d) LAeq, in urban forests.
Figure 3.
Distribution of soundscape pleasantness level and (a) L10, (b)L90, (c) L10-L90 and (d) LAeq, in urban forests.

Figure 4.
Proportion of ΔEMG (top left), ΔEDA (top right), ΔPPG (bottom left), and ΔRESP (bottom right) in different forests Scheme 4. Our results showed that ‘slightly restorative’ and ‘not restorative at all’ accounted for more than 40% of responses in broad-leaved forests. In bamboo forests, we found that only 7% of participants answered ‘slightly restorative’ and ‘not restorative at all’ for ΔPPG, which suggested a consistency of above results for the decline of physiological indicators. Furthermore, our findings showed the restorative effect of RESP was limited in urban forests, with an average that was more than 38%.

Figure 5.
Prediction error for (a) ΔEMG, (b) ΔEDA, (c) ΔPPG, (d) ΔRESP and (e) PRR in ANNs.

Figure 6.
Importance of input indicators in determining the output value of soundscape.


Table 1.
Relationship between acoustic parameters and perceived pleasantness in different forest structures, where Pearson correlation coefficients are shown in each cell.
Table 1.
Relationship between acoustic parameters and perceived pleasantness in different forest structures, where Pearson correlation coefficients are shown in each cell.
| Bamboo Forests | Broad-Leaved Forests | Coniferous Forests | Coniferous and Broad-Leaved Mixed Forests | |
|---|---|---|---|---|
| L10 | −0.825 ** | −0.666 * | −0.821 ** | −0.689 * |
| L90 | −0.562 ** | −0.441 | −0.314 | −0.279 |
| L10-L90 | −0.720 * | −0.595 * | −0.967 ** | −0.793 ** |
| LAeq | −0.847 ** | −0.753 ** | −0.676 * | −0.709 * |
* p < 0.05, ** p < 0.01.
Table 2.
The t-test of EMG, EDA, PPG, and RESP at tranquility and stress inducement.
| EMG | EDA | PPG | RESP | |
|---|---|---|---|---|
| Baseline value (BL) | 2.847 | 0.925 | 39.104 | 10.052 |
| Pre-test value (Pr) | 4.735 | 1.607 | 39.890 | 10.536 |
| Pr-BL | 1.888 | 0.681 | 0.786 | 0.484 |
| t value | 9.874 ** | 7.105 ** | 2.482 ** | 2.561 ** |
** p < 0.01.
Table 3.
The t-test of EMG, EDA, PPG, and RESP at pre-test and post-test in different forest structures.
Table 3.
The t-test of EMG, EDA, PPG, and RESP at pre-test and post-test in different forest structures.
| Bamboo Forests | Broad-Leaved Forests | Coniferous Forests | Coniferous and Broad-Leaved Mixed Forests | ||
|---|---|---|---|---|---|
| EMG | Pr | 4.477 | 4.572 | 4.979 | 4.912 |
| Po | 3.800 | 4.335 | 4.413 | 4.436 | |
| ΔEMG | −0.677 | −0.237 | −0.566 | −0.476 | |
| t value | −4.171 ** | −2.058 * | −3.637 * | −2.403 * | |
| EDA | Pr | 1.562 | 1.638 | 1.616 | 1.611 |
| Po | 1.017 | 1.404 | 1.227 | 1.277 | |
| ΔEDA | −0.546 | −0.234 | −0.389 | −0.334 | |
| t value | −4.628 ** | −1.561 | 3.343 ** | −1.764 | |
| PPG | Pr | 39.854 | 39.781 | 40.229 | 39.698 |
| Po | 38.083 | 39.708 | 39.208 | 40.917 | |
| ΔPPG | −1.770 | −0.724 | −0.020 | 1.219 | |
| t value | −3.313 ** | −0.125 | −1.226 | 1.204 | |
| RESP | Pr | 10.57 | 10.438 | 10.565 | 10.577 |
| Po | 10.034 | 10.276 | 10.134 | 10.495 | |
| ΔRESP | −0.536 | −0.161 | −0.430 | −0.076 | |
| t value | −3.062 ** | −1.058 | −2.832 ** | −0.361 |
* p < 0.05, ** p < 0.01; Pre-test value (Pr), Post-test value (Po), Po-Pr value (ΔEMG, ΔEDA, ΔPPG, ΔRESP).
Table 4.
Summary of principal component analysis (PCA) on physiological restorative parameters.
| Varimax-Rotated Component (Explained Variance, %) | ||
|---|---|---|
| Functional Parameter (66.22) | Background Sound (21.68) | |
| LAeq | 0.645 | 0.666 |
| L10 | 0.704 | 0.555 |
| L90 | 0.146 | 0.961 |
| L10-L90 | 0.912 | 0.225 |
| PL | −0.842 | −0.290 |
| PRR | −0.880 | −0.192 |
| ΔEMG | 0.880 | 0.314 |
| ΔEDA | 0.899 | 0.296 |
| ΔPPG | 0.943 | 0.247 |
| ΔRESP | 0.935 | 0.320 |
Table 5.
Accuracy of parameters in the PRR model based on the validation set.
| Parameters | Percent Correct (%) | |
|---|---|---|
| Training | ΔEMG | 84.1 |
| ΔEDA | 80.9 | |
| ΔPPG | 95.7 | |
| ΔRESP | 94.8 | |
| PRR | 88.3 | |
| Overall percent | 90.8 | |
| Testing | ΔEMG | 81.1 |
| ΔEDA | 87.2 | |
| ΔPPG | 95.6 | |
| ΔRESP | 92.9 | |
| PRR | 86.2 | |
| Overall percent | 90.1 |
Publisher’s Note: MDPI stays neutral with regard to jurisdictional claims in published maps and institutional affiliations. |
© 2022 by the authors. Licensee MDPI, Basel, Switzerland. This article is an open access article distributed under the terms and conditions of the Creative Commons Attribution (CC BY) license (https://creativecommons.org/licenses/by/4.0/).
Share and Cite
MDPI and ACS Style
Hong, X.-C.; Cheng, S.; Liu, J.; Dang, E.; Wang, J.-B.; Cheng, Y. The Physiological Restorative Role of Soundscape in Different Forest Structures. Forests 2022, 13, 1920. https://0-doi-org.brum.beds.ac.uk/10.3390/f13111920
AMA Style
Hong X-C, Cheng S, Liu J, Dang E, Wang J-B, Cheng Y. The Physiological Restorative Role of Soundscape in Different Forest Structures. Forests. 2022; 13(11):1920. https://0-doi-org.brum.beds.ac.uk/10.3390/f13111920
Chicago/Turabian StyleHong, Xin-Chen, Shi Cheng, Jiang Liu, Emily Dang, Jia-Bing Wang, and Yuning Cheng. 2022. "The Physiological Restorative Role of Soundscape in Different Forest Structures" Forests 13, no. 11: 1920. https://0-doi-org.brum.beds.ac.uk/10.3390/f13111920
Note that from the first issue of 2016, this journal uses article numbers instead of page numbers. See further details here.