Article

Effects of Thinning Intensity on Forest Floor and Soil Biochemical Properties in an Aleppo Pine Plantation after 13 Years: Quantity but Also Quality Matters

by
Antonio J. Molina
1,*,
Inmaculada Bautista
2,
Cristina Lull
2,
Antonio del Campo
1,
María González-Sanchis
1 and
Antonio Lidón
2
1
Departamento de Ingeniería Hidráulica y Medio Ambiente, Universitat Politècnica de València, Camino de Vera s/n, E-46022 Valencia, Spain
2
Instituto de Ingeniería del Agua y Medio Ambiente, Universitat Politècnica de València, Camino de Vera S/N, E-46022 Valencia, Spain
*
Author to whom correspondence should be addressed.
Submission received: 15 December 2021 / Revised: 27 January 2022 / Accepted: 3 February 2022 / Published: 6 February 2022
(This article belongs to the Special Issue Adaptive Forest Management to Climatic Change)

Abstract

:
In order to quantify the impacts of silvicultural treatments in semiarid forests, it is necessary to know how they affect key aboveground processes and also properties characterizing the forest floor and mineral soil compartments. The general objective of this work is to study the mid-term effects of thinning intensity on forest floor and soil properties after 13 years following the intervention. The experimental design consisted of a randomized block design with four thinning treatments (3 thinning intensity plots plus a control or unmanaged plot) and three blocks or replicates. Several determinations, such as total organic carbon, dissolved organic carbon, or basal respiration, were performed for characterizing forest floor and mineral soil by considering three random sampling points per experimental plot. Thirteen years after thinning, total organic content, the different organic carbon fractions studied, and basal respiration were higher in the forest floor of the unmanaged plot. These results, however, were contrasted to those obtained for the mineral soil, where significant differences between the treatments were only observed in basal respiration and C/N ratio, while the different organic carbon fractions were not affected by thinning intensity. Our results suggest better soil quality where biological activity is enhanced as a consequence of improved environmental conditions and also litterfall input. The latter is especially important in forests with tree leaves of low biodegradability, where new understorey species promoted by thinning can provide higher nutrient availability for the remaining trees and, therefore, better forest resilience.

1. Introduction

Forest soils play an important role in maintaining the productivity and sustainability of forest ecosystems through many ecosystem processes, such as organic matter decomposition, water, and nutrient provision. Carbon sequestration by forest soils has become a key mechanism for offsetting the greenhouse gases emissions from fossil fuel burning [1]. This is being clearly translated into national and international actions for mitigating climate change impacts, such as the plantation of 3 billion trees in the EU by 2030, following the new EU forest strategy (https://ec.europa.eu/environment/strategy/forest-strategy_en, accessed on 14 December 2021).
Apart from planting new trees, thinning is a common silvicultural practice that may affect several aboveground and belowground processes by changing environmental conditions as well as stand structure and composition and soil properties [2]. The reduction in tree density normally decreases litter production and C content in the forest floor when the short-term effects of thinning are evaluated [3,4]. Conversely, thinning can increase forest floor C content when a sufficient development of understorey biomass is capable of offsetting the decrease in tree litter production [5,6,7]. Mineral soil is less sensitive than forest floor to changes in aboveground biomass and requires longer recovery periods when soil carbon has been significantly changed by thinning [7,8]. James and Harrison [8] reviewed the role of harvesting on C in forest floor and mineral soil and observed significant reductions in both compartments but a much smaller reduction (−3%) in the 0–15 cm soil depth. For their part, Nave et al. [7] also found a higher reduction in the C of forest floor (−30%) but a non-significant harvest effect on mineral soil in their meta-analysis for temperate forests, and they discussed the complex role of soil type, species composition, and time as possible drivers of variation. Ruiz-Peinado et al. [9] found that thinning did not significantly affect soil organic carbon in a Mediterranean maritime pine forest 5 years after the last silvicultural intervention. Lull et al. [10] observed that selective thinning and shrub clearing did not negatively affect soil carbon pools and biological activity when woody debris was left on the forest floor in a Mediterranean Holm oak forest 7 years after intervention. These results are in accordance with Nave et al. [7], who observed that carbon loss is temporary and recovers over a period of 6–20 years after harvesting in similar soil types to the ones studied here. As stated in Zhang et al. [11], thinning intensity, time elapsed from thinning, and forest type are key aspects when evaluating forest thinning on soil carbon stocks and dynamics.
Soils contain a variety of organic carbon fractions with different residence times and different sensitivity to environmental and management changes [12,13]. The dissolved fraction (water-soluble organic carbon) is likely the most labile and active form of soil organic carbon and, thus, the first available source for soil microorganisms and chemical conversion reactions [13,14]. This active fraction plays an important role in determining the structure and function of the soil ecosystem by acting as an energy source for heterotrophic organisms and as a reservoir of the dissolved fraction and plant nutrients [14]. In contrast, the passive fraction interacts with mineral surfaces, preventing organic matter decomposition through biochemical reactions [15]. The easily oxidizable carbon fraction can be considered as an intermediate kind. Most of the thinning studies have focused on changes in total soil organic C or the fraction that is easily oxidizable, and little attention has been paid to differentiate the role of thinning on the different soil organic carbon fractions (see [10,15] for exceptions). In addition, as thinning is expected to increase net rainfall water input [16] and soil temperature [11], complementary measurements of soil biological activity such as soil microbial biomass carbon or basal soil respiration can help to improve our understanding of the role of forest management on soil carbon fractions and dynamics [13,17].
In Spain, Pinus forests are the most extended forest type, occupying 32.6% of the total forested area in the country [18]. This fact is explained by the profuse use of pines in afforestation programs, given their capacity to adapt to a wide range of environmental conditions but also to their status as pioneer species, colonizing mainly burned areas and abandoned agricultural fields. In the case of the Valencian community, Aleppo pine (Pinus halepensis Mill.) forests are the most representative forests and account for 72% of the wooded area [19], and most of them are plantations characterized by high tree density because of low timber profitability. Aleppo pine residues are poor in nitrogen and highly recalcitrant and resistant to biodegradation in Mediterranean ecosystems [20]. Unmanaged Aleppo pine forest stands in southeastern Spain show values for carbon accumulation in litter and dead matter aboveground storage of 19.9 t ha−1 [21]. The accumulation of stable soil organic matter also increases the stock of organic carbon and nitrogen, thereby improving soil fertility, since, in mature forests, the main supply of nitrogen comes from the biogeochemical cycle (litterfall and decomposition) [22].
This study is carried out in a mature, overstocked Aleppo pine plantation established over 60 years ago in abandoned agricultural fields. Different thinning treatments were performed in 12 experimental units in 2008. Several results about the effect of thinning intensity on aboveground processes have been reported; the most recently published study focused on evaluating the mid-term effects on tree and stand–water relationships [23]. However, the impacts of thinning intensity on forest floor characteristics and soil organic matter stock remain unclear. In this sense, the general objective of this work is to study the effects of thinning intensity on forest floor and soil properties after 13 years following the intervention. To this end, the specific aims of this study are to: (1) determine the influence of thinning intensity on forest floor mass, carbon fractions, and basal respiration; (2) compare the thinning effects on soil carbon fractions, basal respiration, and organic N and C/N ratio; (3) study the relationships between forest floor and soil properties.

2. Materials and Methods

2.1. Study Site and Experimental Design

The study was conducted at a planted Aleppo pine area located in the public forest “La Hunde y Palomeras” in eastern Spain (39°05′ N, 1°12′ W; 950 ma.s.l). The plantation dates from the national reforestation programs carried out between the 1950s and 1960s with a soil–water conservation objective. The forest has not been managed since its establishment except for the usual linear-strip thinning to prevent forest fire propagation. In February 2008, an experiment for testing thinning intensity effects on several processes was carried out in three blocks, each with four square 30-m-side experimental units: unthinned (T100, 83% of forest cover, 1289 trees ha−1), high thinning intensity (T10, 16% of forest cover, 178 trees ha−1), moderate thinning intensity (T30, 46% of forest cover, 478 trees ha−1), and low thinning intensity (T60, 64% of forest cover, 689 trees ha−1) [16]. Thinning removed the most dominated trees and achieved a relatively homogeneous tree distribution. All the biomass removed was piled outside the plots. Metrics describing the forest structure of the experimental units are summarized in [23].
Mean annual values for temperature, Penman-Monteith reference evapotranspiration, and rainfall were 13.7 °C, 749, and 466 mm, respectively. The soil is a leptosol according to the World Reference Base for Soil Resources [24], and its general characteristics are summarized in Table 1. The slope in the planted area is less than 5%. Quercus ilex subsp. ballota (Desf.) Samp., Juniperus oxycedrus L., and J. phoenicea L. are the main understorey woody species observed in the unmanaged stands, while different degrees of species diversity and plant groundcover are observed in the thinned treatments. The total number of species (including all the Raunkier’s plant life forms) was 19, 12, 9, and 13, while means for relative plant groundcover were 61.01%, 11.03%, 16.04%, and 28.6% for T10, T30, T60, and T100, respectively (see Table A2 in Appendix B). These values especially highlight the different evolution of understorey growth between T10 and the rest of the treatments.

2.2. Forest Floor and Soil Determinations

During January 2021 (13 years after thinning), several measurements were carried out on the experimental units in order to test the mid-term effects of thinning intensity on several forest floor and soil characteristics. In each experimental unit, a random stratified design was followed to select three sampling points; the same orientated diagonal was divided into three parts, and then one sampling point was randomly selected for each part. All samples were taken at least 1 m from tree trunks.
At each point, a metal frame (25 × 25 cm) was used to collect all the litter material. After collecting litter, soil samples were taken in the same points with a circular soil auger to a depth of 30 cm at 10 cm intervals (0–10, 10–20, 20–30 cm). In each plot, undisturbed samples were collected from 0–10 and 10–20 cm depths to obtain soil bulk density.

2.2.1. Forest Floor Samples

After drying the litter samples at 65 °C for 48 h, they were sieved through a 2 mm mesh, and then were classified into the following fractions in order to calculate their proportions (% of the total dry weight and kg ha−1): (a) needles, (b) small branches, (c) bark, cones and other organs, (d) miscellaneous (including plant material other than that from pine trees), (e) material smaller than 2 mm, and (f) stones.
The materials smaller than 2 mm (the most decomposed and humified fraction) were used for obtaining total carbon (TOCh, g C kg−1), total N, and water-soluble organic carbon (WOCh, g C kg−1). TOCh and Total Nh were determined by a total analyzer (Flash EA 1112 Series-Leco Truspec). WOCh was determined in the aqueous extract (1:8), obtained after 30 min of mechanical shaking, centrifugation at 2500 rpm for 5 min, and filtration through a Whatman 42 paper filter. WOCh in the extracts was assessed by K2Cr2O7 oxidation in concentrated H2SO4 [25]. To obtain total organic carbon/nitrogen for the entire forest floor (TOCff and Total Nff, kg ha−1), each fraction weight (kg OM fraction ha−1) was firstly multiplied by its corresponding carbon concentration (kg C/N kg−1 OM fraction), following those presented in [3] for Aleppo pine plantations close to ours, and then summed up. WOCff (kg ha−1) was calculated by multiplying WOCh by the fraction weight (smaller than 2 mm) relative to the total sample weight and then dividing it by the sampled surface (25 × 25 cm). Finally, basal respiration (BRff, mmol CO2 kg−1) was determined on 10 g of rehydrated samples, incubated in hermetically sealed flasks in the dark at 25 °C for 28 days. The kinetic of respiration rate was obtained from the increment in % CO2 in the headspace volume of the flask, which was measured with a CO2 sensor every day for the first 4 days and weekly thereafter (Checkpoint, PBI Dansensor, Ringsted, Denmark) and expressed as mmol CO2 kg −1 soil. The data for each point of measurement were added up to obtain the total amount of C released as CO2 during the incubation period.

2.2.2. Soil Samples

Soil samples were air-dried and sieved through a 2 mm mesh, recording the weight of stones to obtain the coarse elements percentage.
Oxidizable soil organic carbon (SOC, g C kg−1 soil) was determined in soil samples after sieving through a 0.5 mm mesh by wet oxidation with 1 N potassium dichromate in acidic medium and evaluating the excess of dichromate with 0.5 N ferrous ammonium sulfate, as described by [26]. In addition, for the samples of the 0–10 cm interval, total Cs (sum of organic and mineral parts, g C kg−1 soil) and total N were determined by combustion, as in forest floor. For these samples, total organic carbon (TOCs, g C kg−1 soil) was obtained by subtracting mineral carbon (obtained from carbonate content) to total C. WOCs and BRs were determined on 10 g soil samples following the same methodology as for the forest floor samples (WOCs in a 1:25 aqueous extract). The soil organic carbon pools were expressed in kg ha−1 by considering bulk density and the proportion of soil in the analyzed fraction to total soil weight. Finally, the Al, Ca, Cu, Fe, K, Mg, Mn, Na, P, and Si contents (g 100 g−1 soil) were determined in the soil samples of the 0–10 cm interval by inductively coupled plasma optical emission spectroscopy (iCAP 6500 DUO/IRIS INTREPID II XDL) after acid digestion (HNO3–H2O2 4:1) in a microwave (Appendix A, Table A1).

2.3. Data Treatment and Analyses

The effect of thinning intensity on the different forest floor and soil determinations was evaluated with two-way ANOVAs, with treatment and block as fixed factors. For testing the effect of thinning intensity on SOC, treatment, block, and soil depth were considered as fixed factors. In every case, the data were examined to ensure normality using the Kolmogorov–Smirnoff/Shapiro–Wilk test (depending on sample size) and the homogeneity of variances using the Levene test. When normality was not achieved, the Kruskal–Wallis test, based on the chi-squared statistic, was used. When the ANOVAs indicated significant differences between thinning treatments at p-value < 0.05, Tukey’s HSD post hoc test was used for comparisons of means, while the Tamhane’s T2 test was used to compare multiple means for the Kruskal–Wallis results or when the homogeneity of variances was not achieved in the ANOVAs.
The relationships between variables were studied through bivariate Spearman correlations (all studied soil/forest floor properties) and linear and power regression analyses (TOC and C/N), whose parameters were fitted by least-squares methods. All the statistical analyses were performed with SPSS v.16. Finally, a soil quality index (SQI) developed for Mediterranean forests [27] was calculated for evaluating the integrative thinning intensity effect on soil quality. SQI is estimated based on the following variables: total organic carbon, soil moisture, pH, microbial biomass carbon (MBC), phosphatase activity, and β-glucosidase activity. Soil moisture was obtained from the mean values for each thinning intensity treatment previously published [23]. MBC was estimated based on the relationship between MBC and basal soil respiration (MBC = 5.605BR0.6686; R2 = 0.6), as obtained in Aleppo pine experimental plots with very similar forest structure and age to those analyzed in this work [28] (see [29] for more information about this site). Finally, the phosphatase and β-glucosidase activities for our treatments were also obtained from those experimental plots ([28], unpublished data). The variables were previously standardized, and SQI was obtained as described in Andrés-Abellán et al. (2019) [27].

3. Results

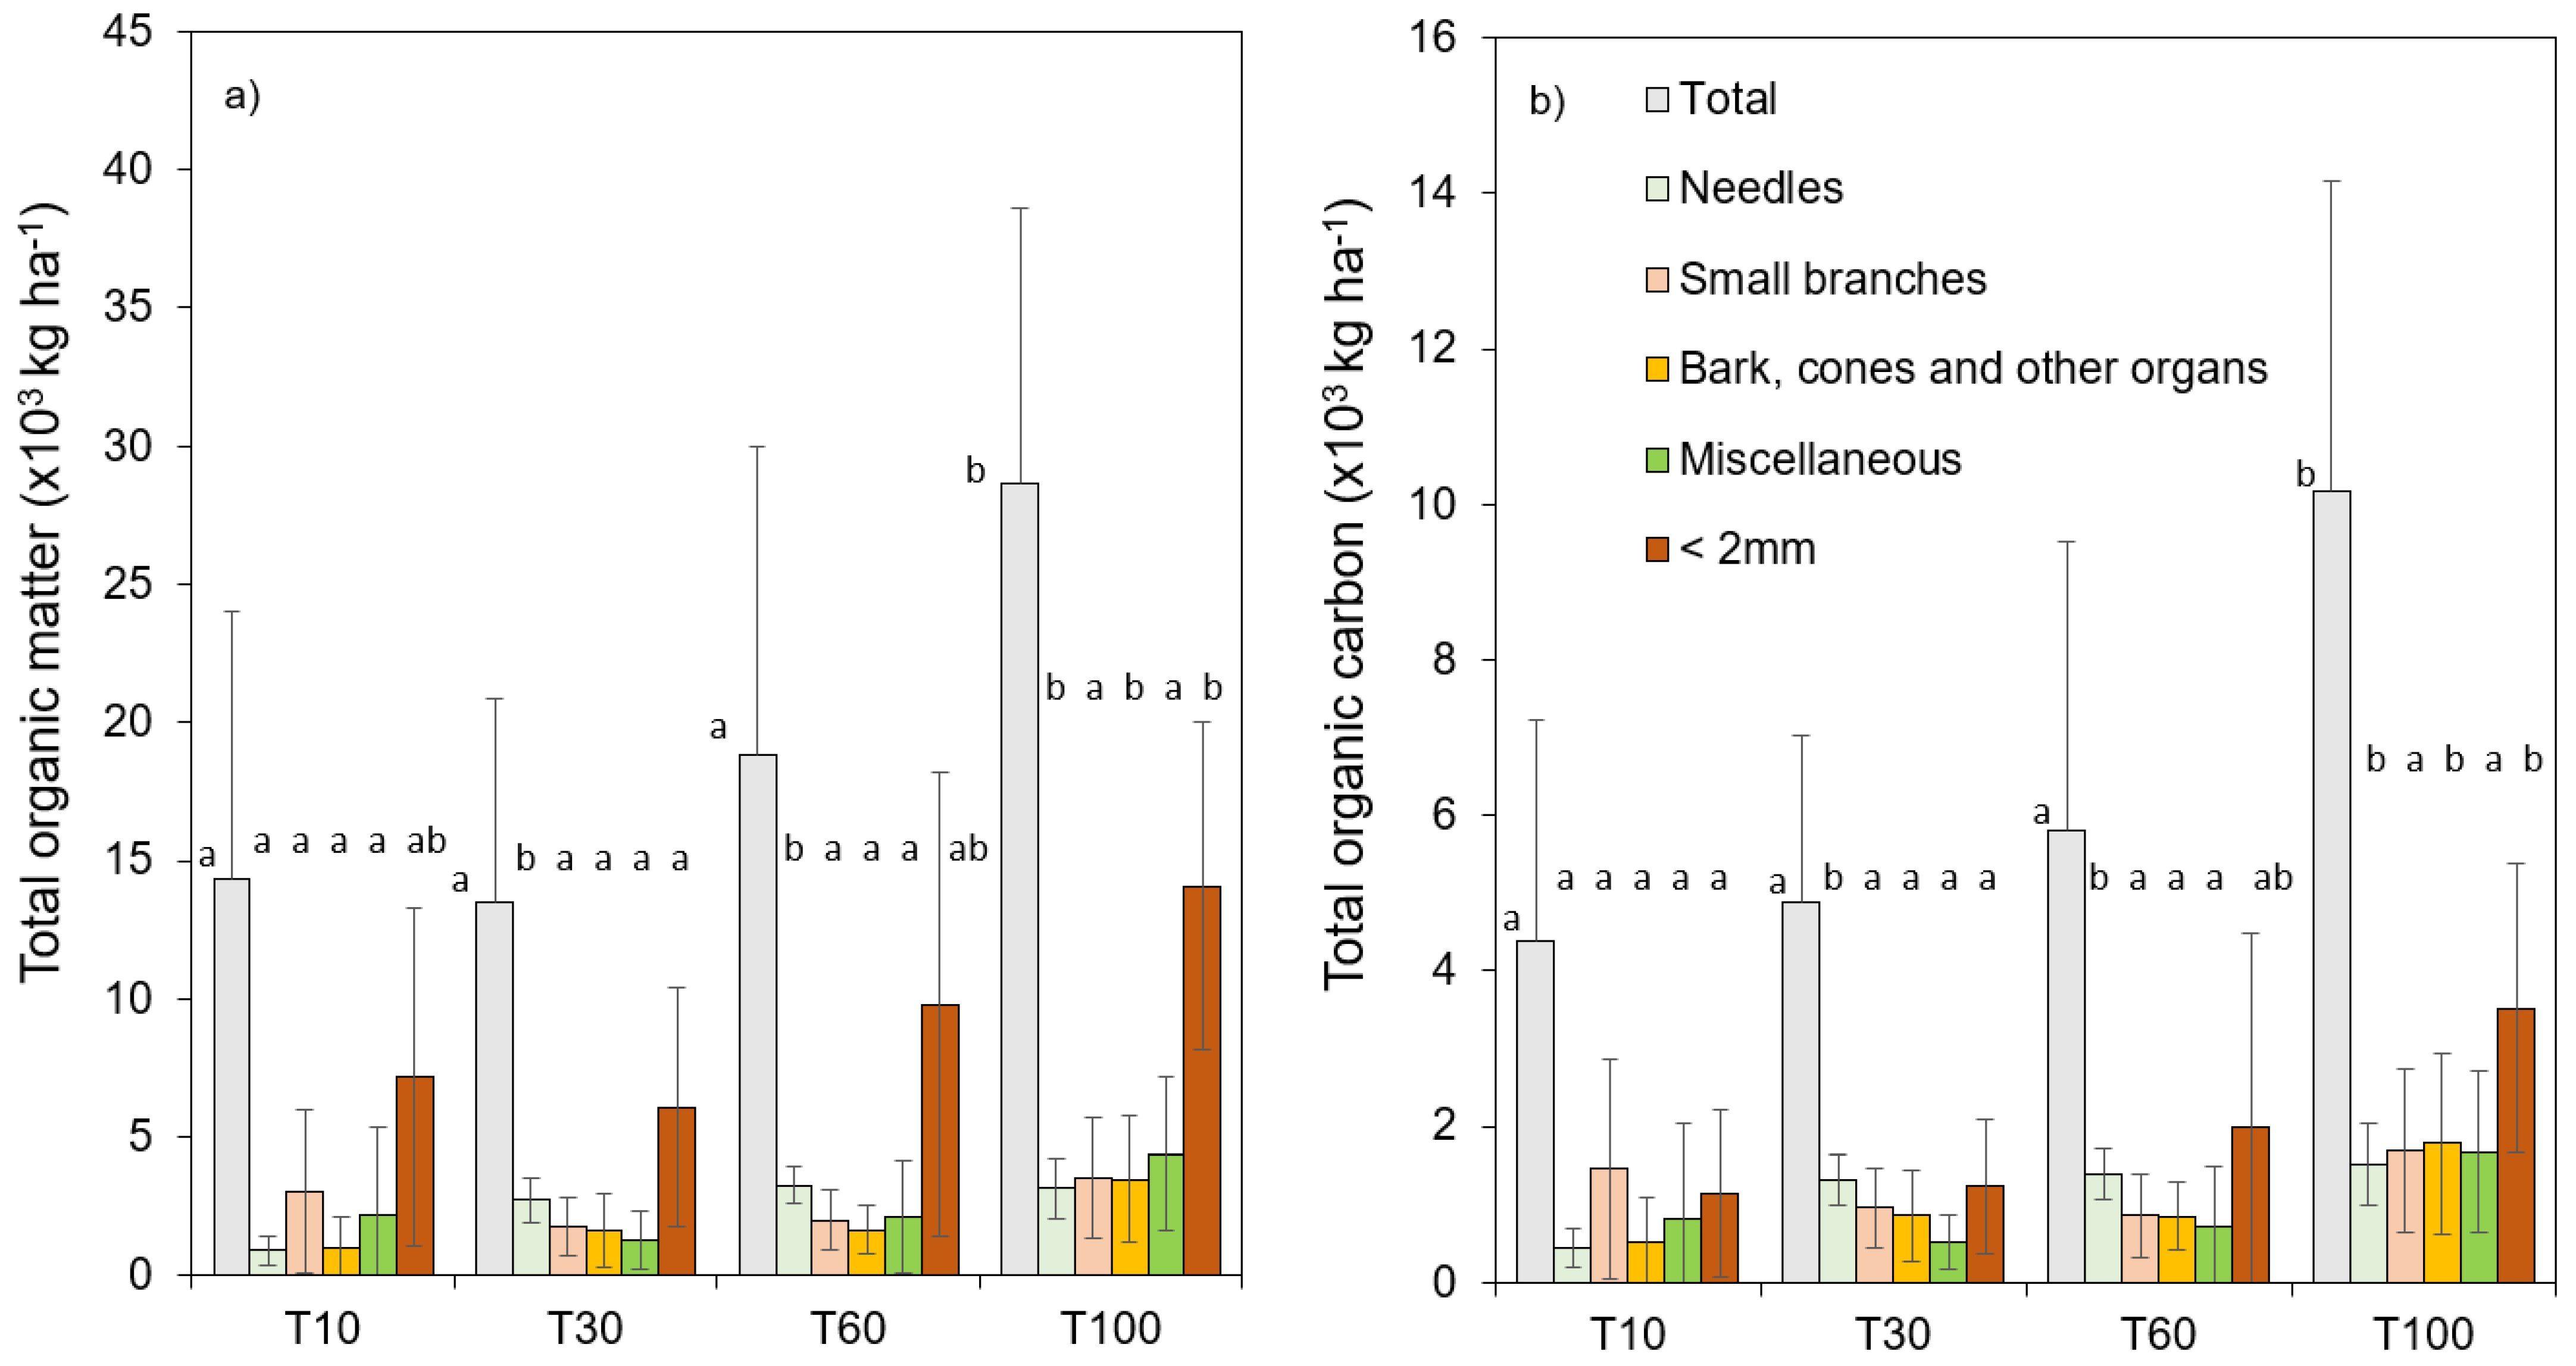
3.1. Effect of Thinning Intensity on Forest Floor Properties

The highest frequency of material smaller than 2 mm (approximately 50%) was consistent across the thinning treatments (Figure 1a). The two-way ANOVAs/Kruskal–Wallis tests revealed a significant effect of thinning intensity on total organic matter and organic carbon, with T100 significantly higher than the rest of the thinning treatments (Figure 1a,b). This reduction effect was also observed for all the fractions but with different magnitudes depending on the thinning intensity and fraction. For instance, the highest organic carbon reduction compared to the control treatment was obtained for the needle fraction in T10 (71%), whereas this reduction was maximum for the miscellaneous fraction in T30 and T60 (69.1% and 57.3%, respectively). In any case, the differences observed in total organic matter were also maintained when comparing organic carbon from the forest floor fractions among the thinning treatments (Figure 1a,b).
The results of the statistical comparisons for the rest of the variables measured are shown in Table 2. In the cases of soluble organic carbon (WOCff) and total nitrogen (total Nff), a clear ranking as a function of thinning intensity was observed, and the differences were significant between T10 and T100 for WOCff and between T30 and T100 for total Nff. In the case of the C/N and basal respiration properties, the highest intensity treatment (T10) showed lower values than the rest of the thinning treatments (only significant differences in the case of basal respiration), while T60 did not differ from T100.

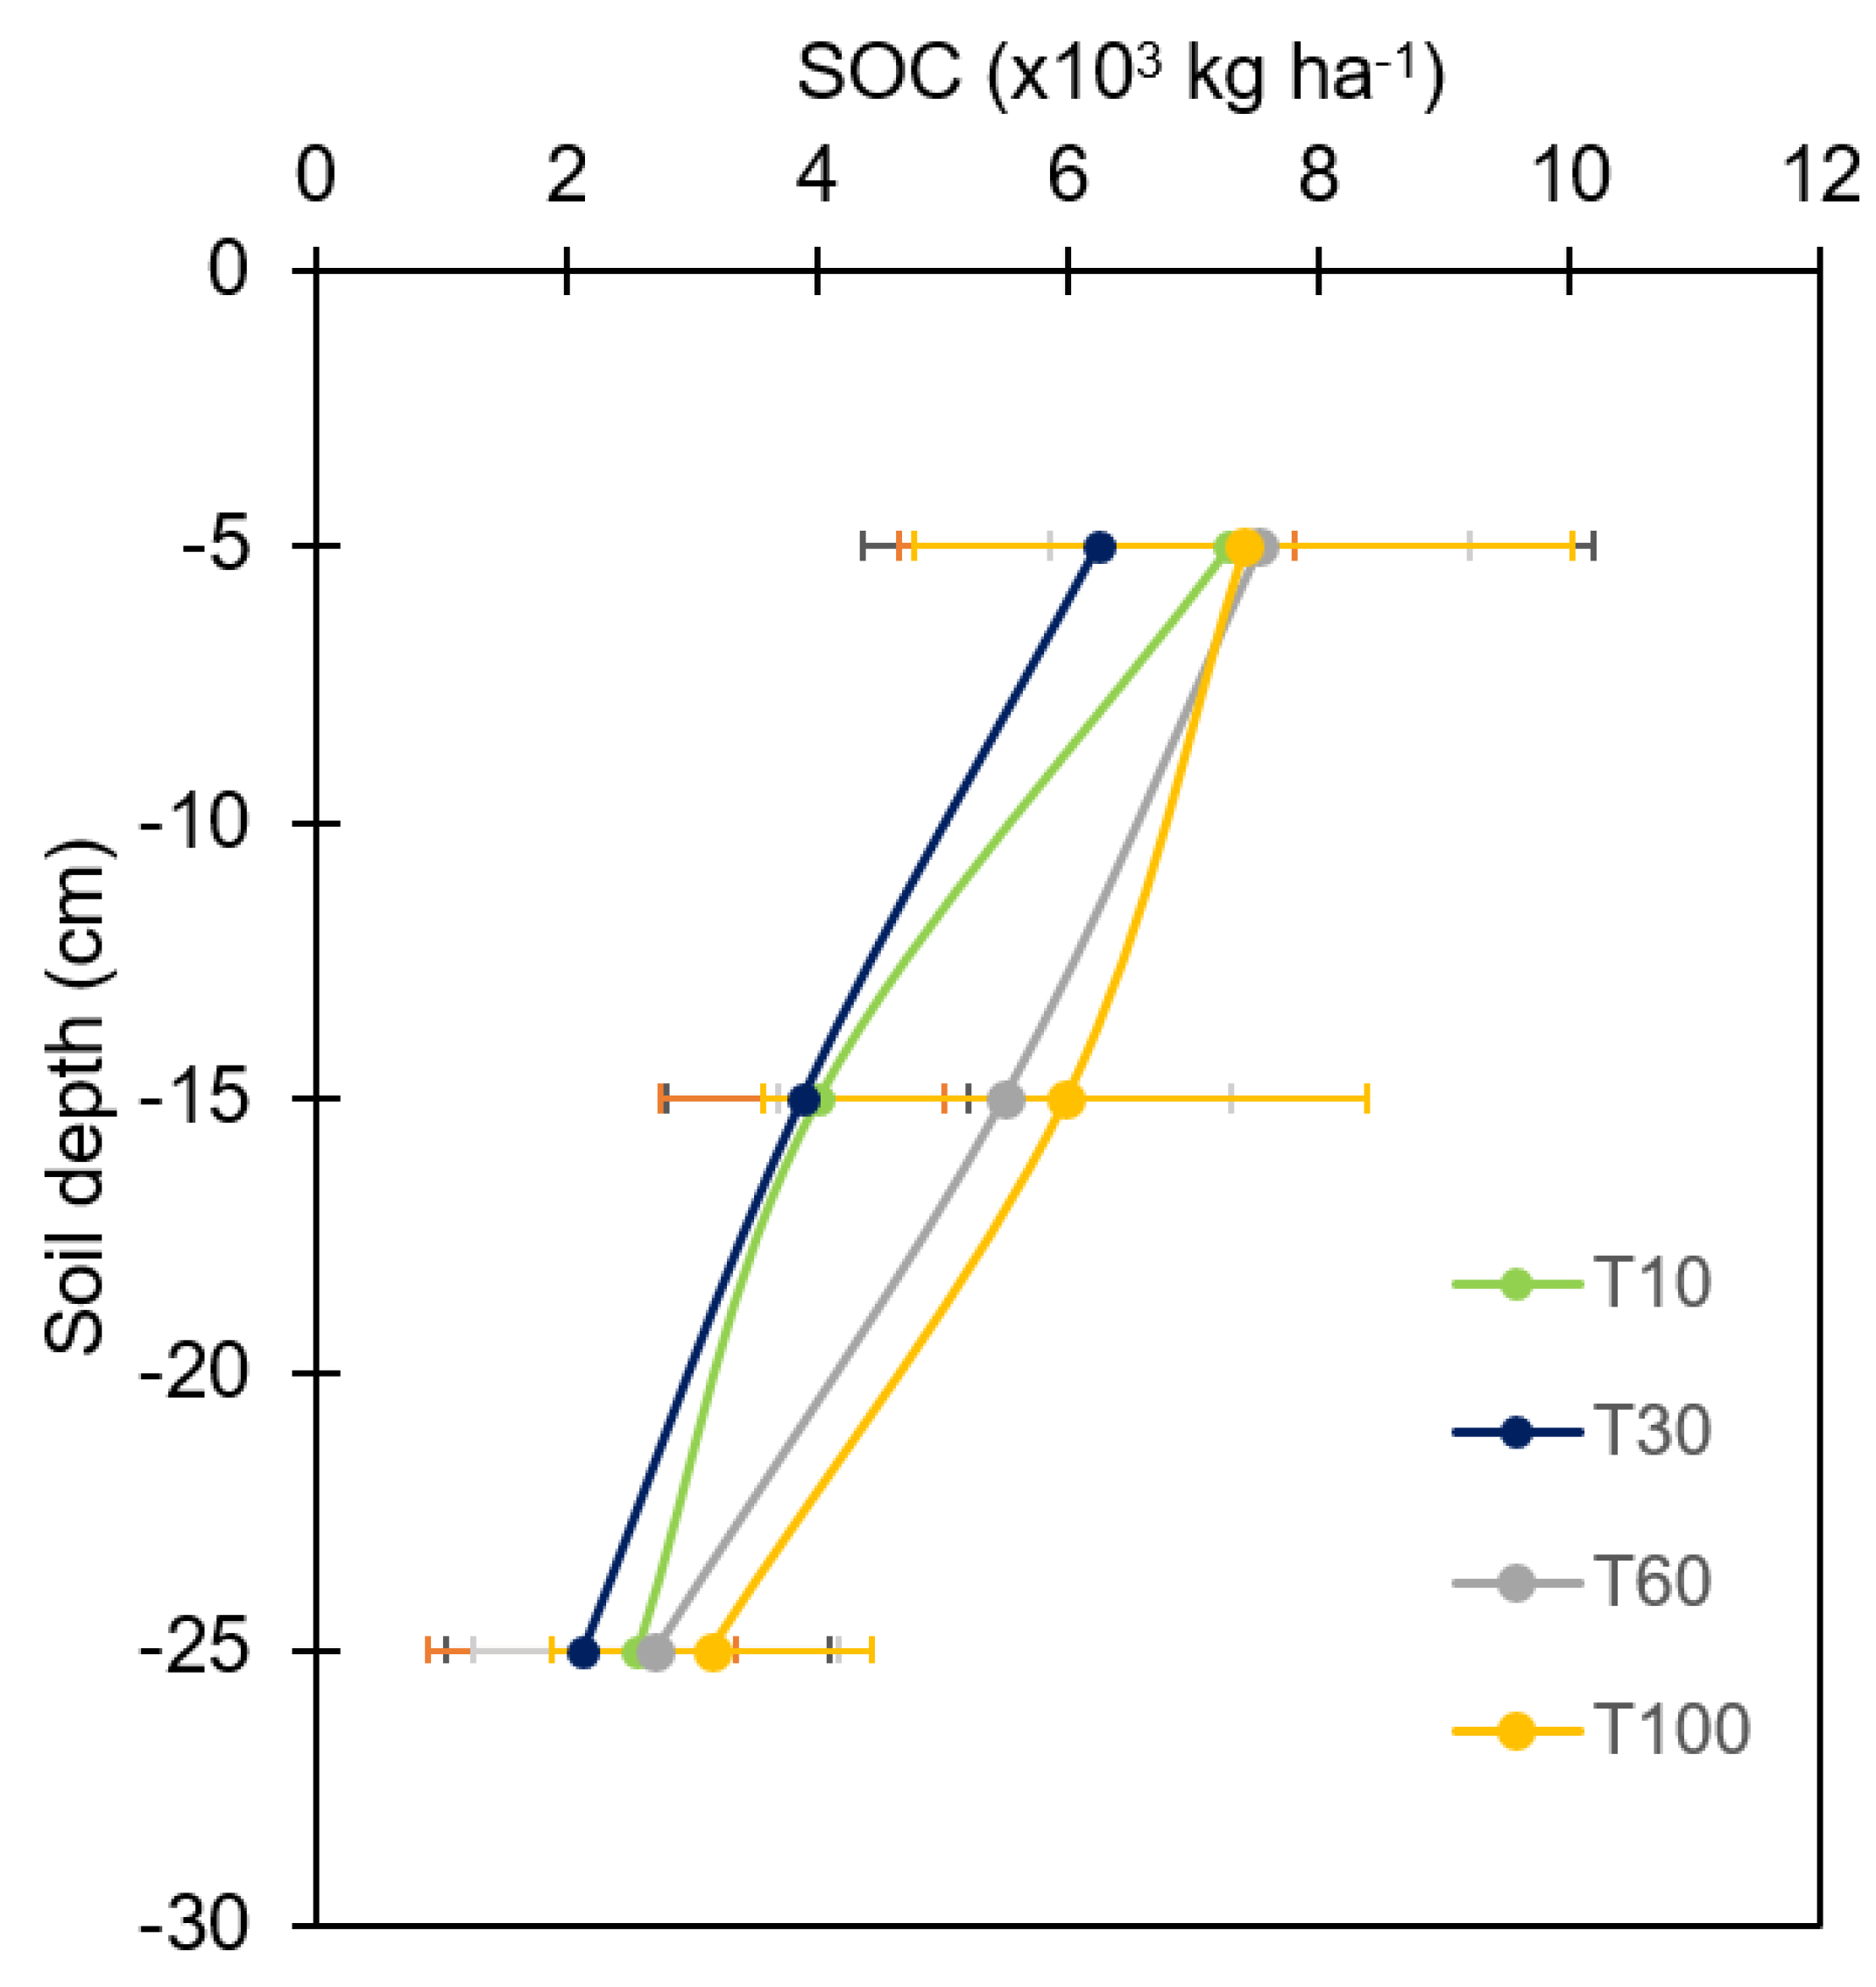
3.2. Effect of Thinning Intensity on Soil Properties

When comparing thinning treatments, the T10 < T60 < T30 < T100 rank was maintained for most of the soil properties studied (Table 3). On the other hand, non-significant differences were observed when comparing the organic carbon fraction, which is easily oxidizable (SOC) (Figure 2), with soil depth as the only significant factor in the ANOVA test (0–10 > 10–20 > 20–30 cm). Basal respiration was probably affected by thinning intensity, with all thinned plots presenting lower (although not significantly different) values than the control one (Table 3). Regarding total N, the results indicated very similar values between the treatments, while C/N in T10 was significantly different from the rest of the treatments (T10 < T60 < T30 < T100; T10 ≠ T30 = T60 = T100, respectively). Finally, the evaluation of thinning effect on soil quality through the SQI evaluation revealed very similar values between our treatments and soils of intermediate quality (0.22–0.25).

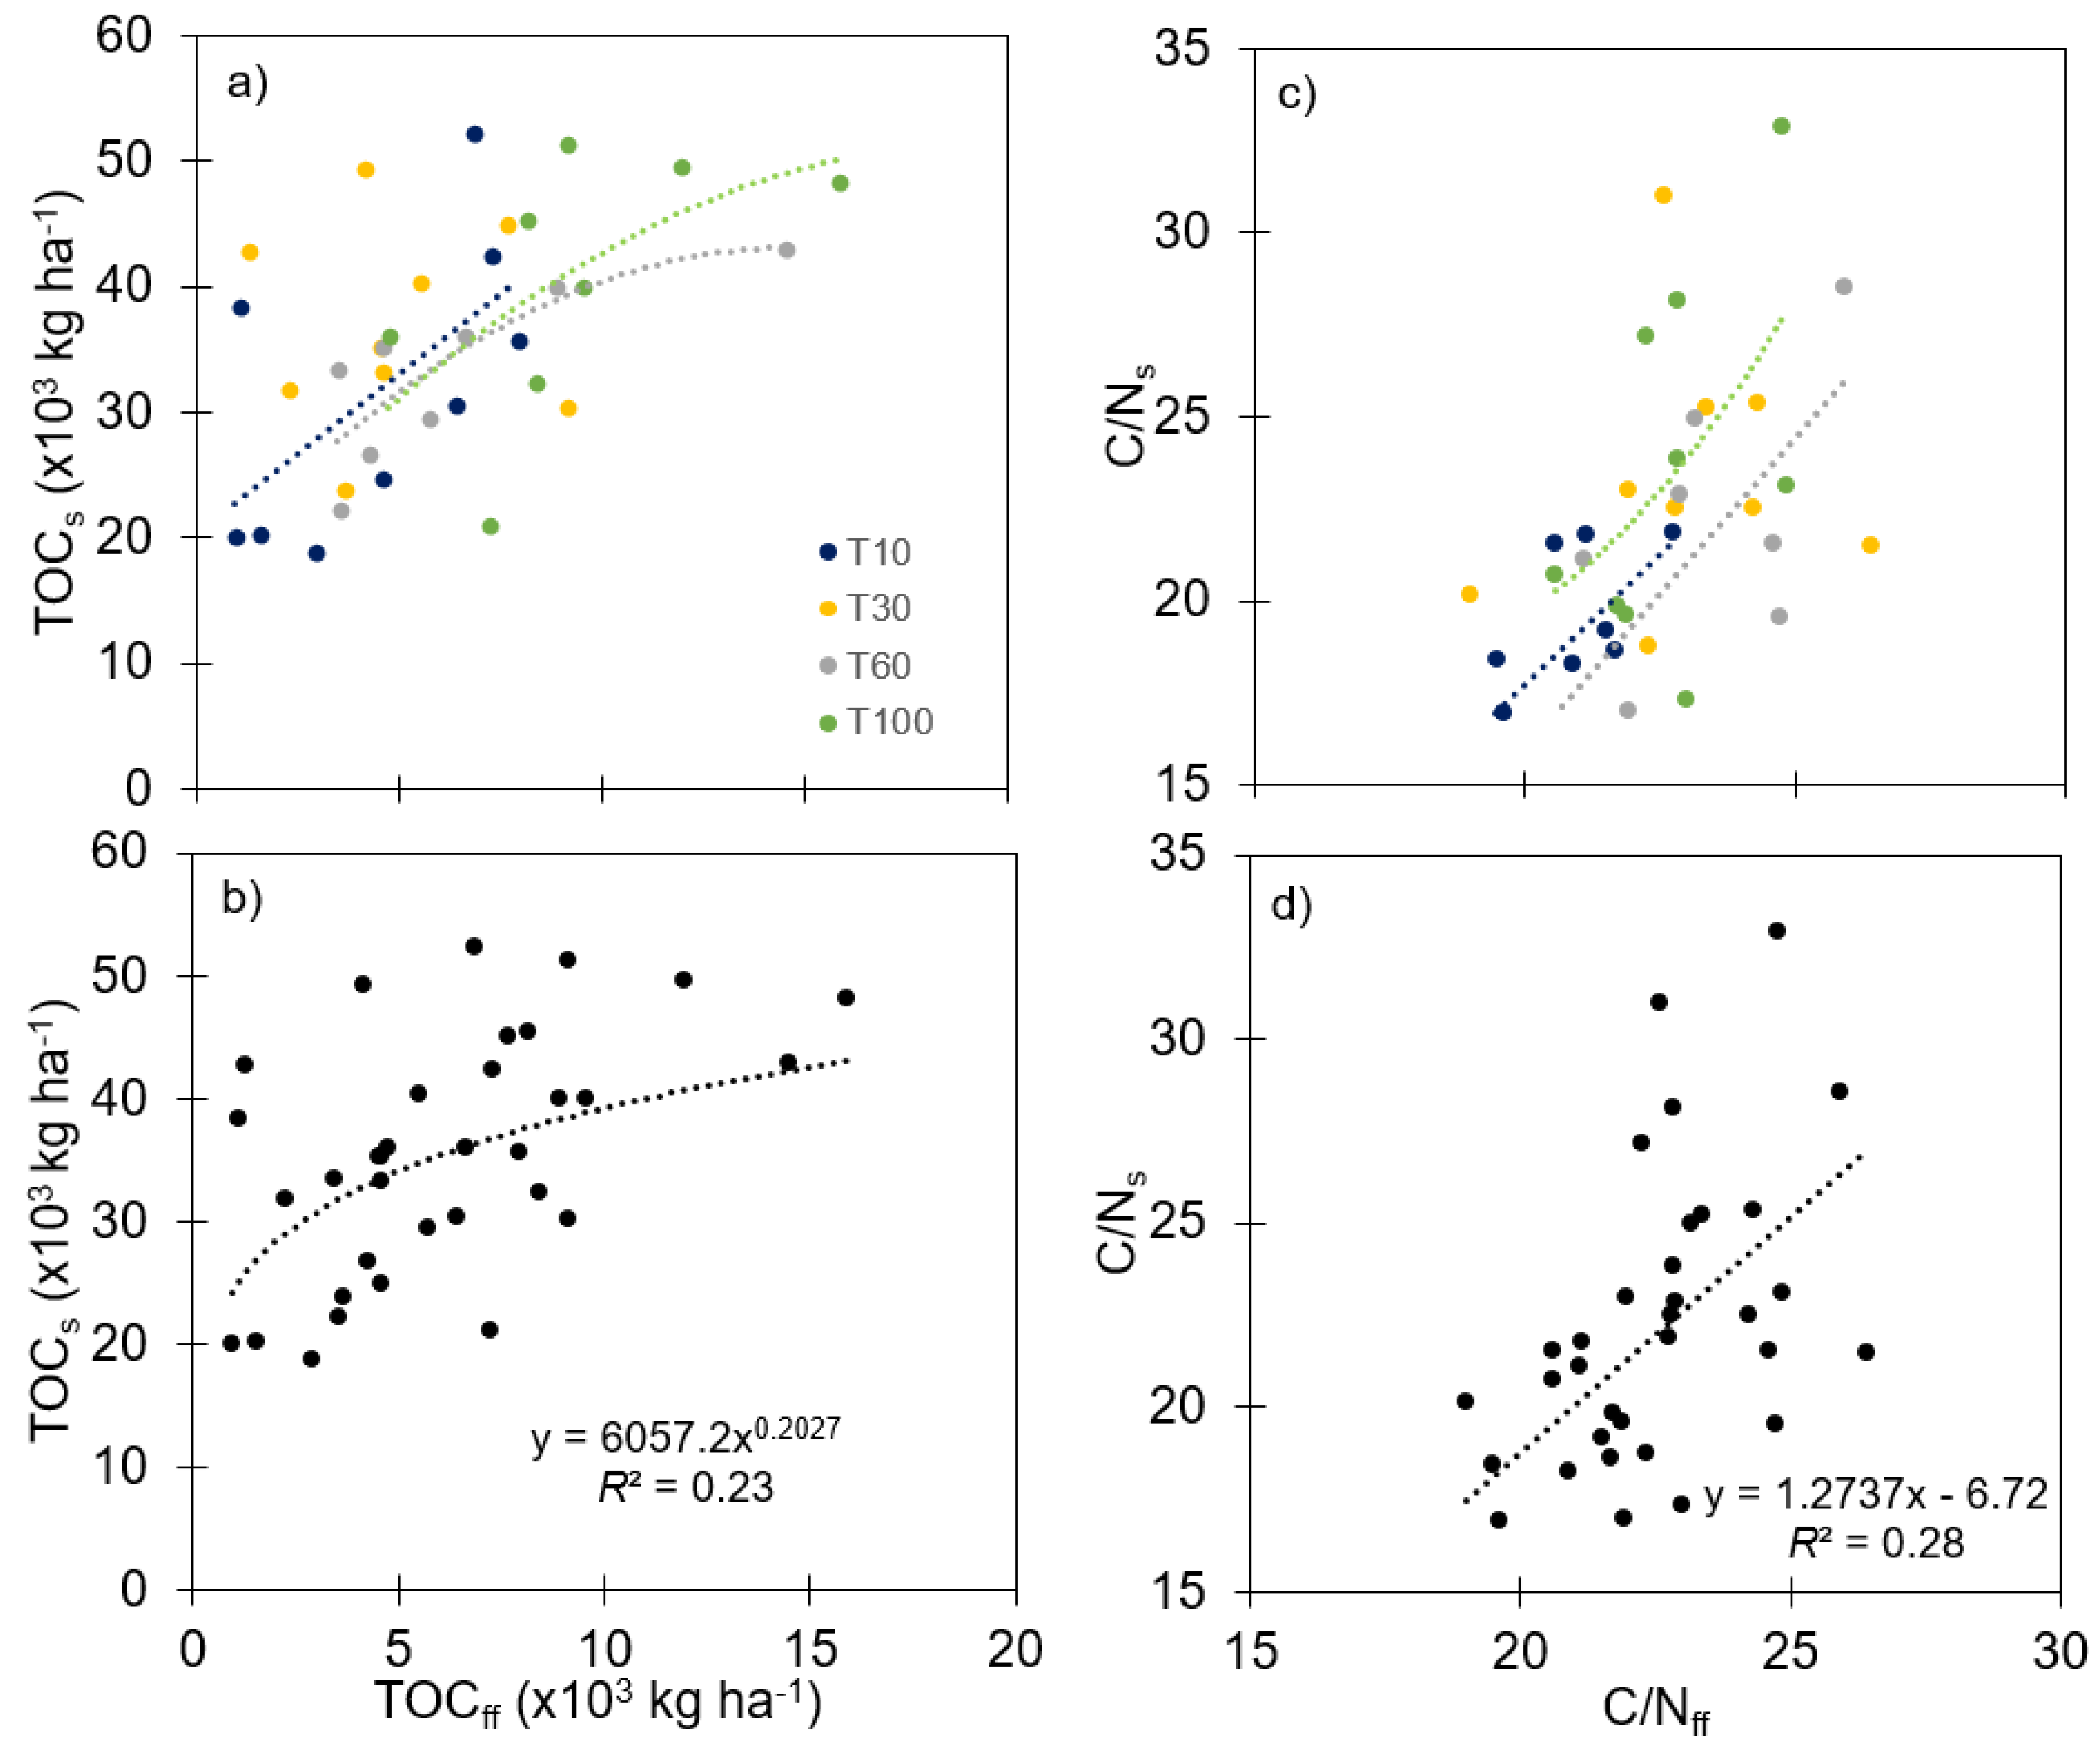
3.3. Relationships between Forest Floor and Soil Properties

Bivariate correlations were used to study the degree of association between the properties measured for characterizing the forest floor and the mineral soil from the 0–10 cm depth interval. Organic carbon fractions in the forest floor showed significant correlations with TOCs and WOCs, but they were not related to SOC (Table 4). In this respect, TOCff in T60 and T100 did not promote an increase in TOCs; the general relationship is represented by a power function (Figure 3). In addition, the C/N ratio in forest floor is linearly related to that in mineral soil (Figure 3).

4. Discussion

Thirteen years after experimental thinning intensity treatments in a mature overstocked Aleppo pine plantation, significant differences between thinned plots and the control plot were only observed in the forest floor compartment as a consequence of reduced litterfall. Our work highlights the important carbon sequestration role of this forest type, accounting for a total of 35.8, 41.6, 39.7, and 48.9 t C ha−1 for T10, T30, T60, and T100, respectively, when both the forest floor and the upper soil layer compartments are considered.
Apart from local variations, both forest floor and soil compartments have been exposed to the same litter production for more than 55 years in our forest plantation, while the cumulative effect of tree removal has only happened for 13 years. Despite this long common time period for all the experimental plots, thinning significantly reduced forest floor fraction when at least approximately 50% of trees were removed (1289 versus 688 trees ha−1 for T100 and T60, respectively), and this reduction in both total organic matter and organic carbon has shown to be proportional to thinning intensity. Although forest cover was higher in T60 and the remaining trees showed better growth rates [23], this improvement in forest structure is not enough to compensate for the litterfall depletion. Our results are consistent with those obtained in another Aleppo pine plantation where all the thinning intensity treatments reduced total litterfall production and nutrient returns 12 years after intervention [3] and also in other types of conifer forests where long-term effects of thinning have been evaluated [30,31].
Lower forest floor quantity in the thinned treatments may be explained by lower litter inputs and/or by higher outputs (e.g., basal respiration, leaching of dissolved organic matter, mixing into the mineral soil by fauna, photodegradation) [30]. Our measurements indicated a clear linear reduction of dissolved organic carbon fraction (WOC) in the forest floor with thinning intensity, higher basal respiration in the control treatment (T100) than in the most thinned one, and non-significant differences between T100 and the rest of the thinning treatments (see Table 2). Higher activity of microorganisms in T100 can be partly explained by the higher fraction of the most labile and mobile form of organic carbon, as WOC is the first carbon pool that is available to be consumed by microorganisms [10]. Needles of Aleppo pine have been identified as the most recalcitrant litter type in Mediterranean ecosystems [20], posing stronger resistance to microbial breakdown, and, thus, litter decomposition may become more strongly dependent on abiotic processes than on biotic ones [32]. In this sense, Almagro and Martinez-Mena [32], when comparing two Mediterranean ecosystems with different tree densities of Aleppo pine trees, observed higher decomposition in the plot with lower aboveground biomass but also with lower basal respiration in the forest floor. The authors explained this fact by the effects that a higher canopy cover may have when decreasing physical decomposition processes such as photodegradation or fragmentation of litter by raindrop impact and splash. In addition, Zhang et al. [11] observed that thinning significantly increased soil respiration in both broadleaved and mixed forests but not in coniferous forests due to the lower litterfall quality of the latter. Our results can thus be explained by lower litter inputs and also higher abiotic decomposition in the thinned plots, but especially in the T10, where effective rainfall and forest structure clearly differed with the rest of the thinning treatments [16,23]. In this respect, higher abiotic decomposition in T10 may be offsetting the higher basal respiration of T30 and T60.
We obtained mean values of 7094, 4815, and 2650 kg ha−1 (1.71, 1.10, and 0.65%) for the SOC fraction for the 0–10, 10–20, and 20–30 cm soil depth intervals, while a mean value of 35,160 kg ha−1 (4.7%) was found when considering total organic carbon (TOC) for the 0–10 cm soil depth interval. These values are in the range of other studies on Pinus species growing under Mediterranean conditions; for instance, Bautista et al. [29] reported a range of 1.1–5.4% for TOC in a Pinus halepensis plantation with different thinning treatments, while a mean value of 4.84% for SOC was reported in a plot with an intermediate forest cover dominated by Pinus pinaster [33]. Thirteen years after thinning, all the organic carbon fractions analyzed decreased with thinning intensity, but significant differences were not observed between the experimental plots. In this respect, when comparing the mean values between the most intense thinning treatments (T10 and T30) and the rest of the treatments (T60 and T100), it can be observed that relative differences are of low magnitude, and they account for approximately 5%, 20%, and 10% for TOC, WOC, and SOC, respectively. Our sampling intensity is slightly lower than those observed in other studies [10,34,35,36]. Thus, a significant effect of thinning is especially expected on WOC as a consequence of an increased sampling effort and, therefore, reduced data variability among experimental plots. In any case, these results are not consistent with the general findings obtained in the review work of James and Harrison [8] but are supported by the other reviews by Nave et al. [7], Zhang et al. [11] and Zhou et al. [37], who observed that thinning did not have significant effects on either total soil carbon or SOC. It is important to remark that these general results had a high number of sources of variability, and they also considered different data sources. When comparing our results to other studies with similarities in terms of thinning (intensity and time elapsed), forest structure and composition, and environmental conditions, TOC for the 0–10 cm soil depth interval was not significantly enhanced 13 years after thinning (light and heavy thinning interventions) in an Aleppo pine plantation very similar to ours [29]. In addition, other thinning experiments, conducted in the Mediterranean area for Pinus pinaster Ait. [9] and P. sylvestris forests [38,39], have found no differences when the mid-term effects of thinning intensity on soil carbon stock were evaluated. Nave et al. [7] found that thinning slightly reduced soil organic carbon, but it recovered over a period of 6–20 years after thinning due to changes in aboveground biomass and, therefore, in litter production. The organic carbon fractions in the forest floor were higher in the control treatment; thus, similar litter input quantities between the treatments is not a plausible explanation in our case [15]. A possible explanation may be related to the higher production of fine roots in the thinned plots [40,41], normally located in the 0–10 cm soil depth interval in forest soils. Lopez et al. [42] observed very similar fine root density dynamics between the heavily thinned plot (79% of basal area removed) and the control one in a Mediterranean holm oak forest 5 years after thinning, and root elongation was clearly explained by soil water content. The higher soil water content promoted by the thinning intensity in our case [23] may promote higher tree root formation and, therefore, higher colonization of the upper soil horizon. On the other hand, complementary measurements taken in our experimental plots clearly indicated the higher plant cover and density of understorey species, especially in the T10 plots [23]. In this sense, it is important to highlight the role of thinning may have on improving soil quality and, therefore, on nutrient availability for the remaining trees. Lower C/N ratios for the treated plots in both forest floor and mineral soil, especially when comparing T10 and T100, may indicate a positive effect of thinning in microclimatic conditions and microbial substrate, therefore increasing N mineralization rate [29]. Better conditions, but also better quality (bio-degradability) C, in the leaves of the understorey species, as compared to P. halepensis needles [32], are expected to promote higher microbial activity, thus reducing the C/N ratio.
As in the case of forest floor, WOC was linearly related to thinning intensity, indicating higher availability of this labile carbon fraction in T100. WOC is greatly affected by climatic conditions, and the highest value during the year is expected to occur in summer, when leaching is at a minimum [10]. At the moment of sampling, soil water content was very close to field capacity in all the treatments as a consequence of antecedent periods with high rainfall input (mean volumetric water content of 0.25 cm3 cm−3). However, the cumulative effect of higher soil water content in the treated plots during the entire year is expected to promote higher WOC leaching [10,43]. Therefore, our results on C/N ratios in both forest floor and mineral soil indicate that, although higher carbon fractions in the soil promote a higher presence of microorganisms, this is not necessarily translated into a higher carbon decomposition rate.
Most of the correlation results between forest floor and mineral soil properties were as expected, especially those indicating the role of the forest floor as a source of soil organic carbon, both the total and the soluble fractions. WOC in soil is composed of WOC leaching from litterfall, root exudates, and carbon from microorganism biomass [44]. A correlation between WOC from forest floor and mineral soil is thus expected as the former represents the main labile carbon input to the latter [10]. In addition, C stored in the soil is not only controlled by the carbon input from the forest floor but also by the potential of soil to stabilize organic carbon [43]. In a study where the effect of thinning on different carbon fractions was tested in beech forests, the higher litter input in the control plots was not clearly reflected in increases in the carbon fractions [45]. The authors obtained clear positive relationships between clay and Fe contents with both fractions of organic carbon studied (light and heavy). In contrast, Cheng et al. [15] obtained opposite correlations, similar to ours, but the authors did not further discuss the role of thinning intensity or soil composition. We observed a negative effect of clay content on WOC and SOC (results not shown); thus, a plausible explanation for this effect remains open. On the other hand, the C/N ratios from forest floor and soil were clearly positively related. This indicates that environmental factors controlling organic carbon decomposition by microbial activity were affected in a similar way, highlighting the simultaneous effect of thinning on these two compartments.
Finally, the results on soil quality through an index developed for soils from Mediterranean forests [27] revealed very similar values between our treatments, although this result should be taken with caution as we considered enzymatic activities that were not directly measured in our study site. In addition, as our results and also other works considering C/N as a key variable related to soil quality [46] suggest that the effects of other soil properties that are expected to be highly affected by understorey evolution should be considered when evaluating the mid- to long-term effects of thinning on soil quality.

5. Conclusions

Silviculture will play a crucial role when adapting semiarid Pinus plantations to climate change; thus, results evaluating its mid- to long-term impacts on soil properties are required to gain a complete picture that is not only based on aboveground processes. Our results have shown that thinning intensity significantly affects organic carbon fractions in the forest floor compartment, reducing the amount of cumulated litterfall material from aboveground vegetation. This did not translate into clear differences when the soil carbon fractions were compared among the thinning treatments, highlighting the fact that thinning intensity has little impact on soil carbon accumulation 13 years after the intervention. However, if a higher sampling effort had been carried out, a significant effect of thinning would be expected to appear, particularly when comparing the most intense thinning treatment with the control treatment for the soluble organic carbon fraction. On the other hand, the lower C/N ratios in the thinned plots suggest better soil quality in those sites, where biological activity is enhanced as a consequence of improved environmental conditions and also litterfall input. The latter is especially important in forests with tree leaves of low biodegradability, where the incorporation of new species from the enhanced understorey growth can provide higher nutrient availability for the remaining trees and, therefore, better forest resilience. In any case, further studies linking the local dynamics of understorey growth with belowground processes are required for a complete assessment of the impact of silvicultural treatments on the water and biogeochemical cycles in these forests and, specifically, the role of time elapsed from thinning in order to recommend when to repeat thinning.

Author Contributions

Conceptualization, A.J.M. and A.L.; methodology, A.L. and I.B.; formal analysis, I.B., A.L., and A.J.M.; writing—original draft preparation, A.J.M.; writing—review and editing, A.J.M., A.L., I.B., C.L., A.d.C., and M.G.-S.; funding acquisition, A.J.M. and A.d.C. All authors have read and agreed to the published version of the manuscript.

Funding

A.J. Molina is the beneficiary of an “APOSTD’ fellowship (APOSTD/2019/111) funded by the Generalitat Valenciana. The authors received national and international funding through the following projects: SILVADAPT.NET (RED2018-102719-T funded by MCIN/AEI/10.13039/501100011033), CEHYRFO-MED (CGL2017-86839-C3-2-R funded by MCIN/AEI/10.13039/501100011033 and FEDER a way to make Europe), and RESILIENTFORESTS (LIFE17 CCA/ES/000063).

Institutional Review Board Statement

Not applicable.

Informed Consent Statement

Not applicable.

Data Availability Statement

The data presented in this study are available on request from the corresponding author.

Acknowledgments

Thanks goes to Rafael Herrera from the Centro de Ecología, Instituto Venezolano de Investigaciones Científicas, Caracas, Venezuela, for critically reviewing the manuscript.

Conflicts of Interest

The authors declare no conflict of interest. The funders had no role in the design of the study; in the collection, analyses, or interpretation of data; in the writing of the manuscript, or in the decision to publish the results.

Appendix A

Table A1. Mean ± standard deviation values for selected soil elements. Lower case letters denote significant differences (Tukey’s HSD post hoc test) for the factor thinning treatment at p-value < 0.05.
ElementTreatment
(g kg−1)T10T30T60T100
Al26.47 ± 10.35a23.82 ± 7.38a23.53 ± 9.35a19.81 ± 6.13a
Ca76.07 ± 30.35a108.63 ± 24.89ab107.70 ± 47.49ab118.39 ± 44.91a
Cu0.007 ± 0.002a0.007 ± 0.002a0.007 ± 0.002a0.006 ± 0.001a
Fe14.11 ± 5.83a12.39 ± 3.84a12.06 ± 4.75a9.97 ± 3.00a
K5.94 ± 2.00a5.97 ± 1.81a5.50 ± 1.87a4.77 ± 1.22a
Mg4.52 ± 0.58a10.29 ± 4.55c5.59 ± 1.34ab8.20 ± 5.18bc
Mn0.21 ± 0.04a0.23 ± 0.06a0.20 ± 0.04a0.20 ± 0.03a
Na0.16 ± 0.03a0.18 ± 0.04a0.17 ± 0.02a0.16 ± 0.02a
P0.18 ± 0.03a0.23 ± 0.05b0.20 ± 0.01ab0.21 ± 0.03ab
Si0.35 ± 0.06a0.40 ± 0.11a0.37 ± 0.05a0.37 ± 0.08a

Appendix B

Table A2. Observed understorey species in the tested treatments. Data were taken in June 2020, where four systematic 20 m length transects were considered for each experimental plot.
Understorey SpeciesT10T30T60T100
Dorycnium hirsutum (L.) Ser.xxxx
Brachypodium retusum (Pers.) Beauv.xxxx
Eryngium campestre L.x
Helianthemum hirtum (L.) Mill.x
Helianthemum marifolium (L.) Mill. subsp. marifoliumx
Thymus mastichina L.x
Picnomon acarna (L.) Cass.xx x
Dorycnium pentaphyllum subsp. herbaceum (Vill.) Rouyxx x
Hipericum perforatum L.x
Staehelina dubia L.x
Pinus halepensis Mill.xxxx
Rubia peregrina L. subsp. peregrinaxxxx
Quercus ilex L. subsp. ballota (Desf.) Samp.xxxx
Cistus albidus L.x x
Juniperus oxycedrus L. subsp. oxycedrusxxxx
Juniperus thurifera L.xxxx
Quercus coccifera L.xxxx
Ulex parviflorus Pourr. subsp. parviflorusxx x
Rosmarinus officinalis L.xx x
Thymus vulgaris L. subsp. vulgaris x

References

  1. IPCC. Climate Change 2014: Synthesis Report; IPCC: Geneva, Szwitzerland, 2014. [Google Scholar]
  2. Noormets, A.; Epron, D.; Domec, J.C.; McNulty, S.G.; Fox, T.; Sun, G.; King, J.S. Effects of forest management on productivity and carbon sequestration: A review and hypothesis. For. Ecol. Manag. 2015, 355, 124–140. [Google Scholar] [CrossRef] [Green Version]
  3. Lado-Monserrat, L.; Lidón, A.; Bautista, I. Erratum to: Litterfall, litter decomposition and associated nutrient fluxes in Pinus halepensis: Influence of tree removal intensity in a Mediterranean forest. Eur. J. For. Res. 2016, 135, 203–214. [Google Scholar] [CrossRef] [Green Version]
  4. Navarro, F.B.; Romero-Freire, A.; Del Castillo, T.; Foronda, A.; Jiménez, M.N.; Ripoll, M.A.; Sánchez-Miranda, A.; Huntsinger, L.; Fernández-Ondoño, E. Effects of thinning on litterfall were found after years in a Pinus halepensis afforestation area at tree and stand levels. For. Ecol. Manag. 2013, 289, 354–362. [Google Scholar] [CrossRef]
  5. Lee, S.H.; Kim, S.; Kim, H.J. Effects of thinning intensity on understory vegetation in Chamaecyparis obtusa stands in South Korea. For. Sci. Technol. 2018, 14, 7–15. [Google Scholar]
  6. Dang, P.; Gao, Y.; Liu, J.; Yu, S.; Zhao, Z. Effects of thinning intensity on understory vegetation and soil microbial communities of a mature Chinese pine plantation in the Loess Plateau. Sci. Total Environ. 2018, 630, 171–180. [Google Scholar] [CrossRef]
  7. Nave, L.E.; Vance, E.D.; Swanston, C.W.; Curtis, P.S. Harvest impacts on soil carbon storage in temperate forests. For. Ecol. Manag. 2010, 259, 857–866. [Google Scholar] [CrossRef]
  8. James, J.; Harrison, R. The effect of harvest on forest soil carbon: A meta-analysis. Forests 2016, 7, 308. [Google Scholar] [CrossRef]
  9. Ruiz-Peinado, R.; Bravo-Oviedo, A.; López-Senespleda, E.; Montero, G.; Río, M. Do thinnings influence biomass and soil carbon stocks in Mediterranean maritime pinewoods? Eur. J. For. Res. 2013, 132, 253–262. [Google Scholar] [CrossRef]
  10. Lull, C.; Bautista, I.; Lidón, A.; del Campo, A.D.; González-Sanchis, M.; García-Prats, A. Temporal effects of thinning on soil organic carbon pools, basal respiration and enzyme activities in a Mediterranean Holm oak forest. For. Ecol. Manag. 2020, 464, 118088. [Google Scholar] [CrossRef]
  11. Zhang, X.; Guan, D.; Li, W.; Sun, D.; Jin, C.; Yuan, F.; Wang, A.; Wu, J. The effects of forest thinning on soil carbon stocks and dynamics: A meta-analysis. For. Ecol. Manag. 2018, 429, 36–43. [Google Scholar] [CrossRef]
  12. Ramesh, T.; Bolan, N.S.; Kirkham, M.B.; Wijesekara, H.; Kanchikerimath, M.; Rao, C.S.; Sandeep, S.; Rinklebe, J.; Ok, Y.S.; Choudhury, B.U.; et al. Soil organic carbon dynamics: Impact of land use changes and management practices: A review. Adv. Agron. 2019, 156, 1–107. [Google Scholar]
  13. Wang, H.; Wu, J.; Li, G.; Yan, L. Changes in soil carbon fractions and enzyme activities under different vegetation types of the northern Loess Plateau. Ecol. Evol. 2020, 10, 12211–12223. [Google Scholar] [CrossRef]
  14. Von Lützow, M.; Kögel-Knabner, I.; Ekschmitt, K.; Flessa, H.; Guggenberger, G.; Matzner, E.; Marschner, B. SOM fractionation methods: Relevance to functional pools and to stabilization mechanisms. Soil Biol. Biochem. 2007, 39, 2183–2207. [Google Scholar] [CrossRef]
  15. Cheng, X.; Yu, M.; Wang, G.G. Effects of thinning on soil organic carbon fractions and soil properties in Cunninghamia lanceolata stands in eastern China. Forests 2017, 8, 198. [Google Scholar] [CrossRef] [Green Version]
  16. Molina, A.J.; del Campo, A.D. The effects of experimental thinning on throughfall and stemflow: A contribution towards hydrology-oriented silviculture in Aleppo pine plantations. For. Ecol. Manag. 2012, 269, 206–213. [Google Scholar] [CrossRef] [Green Version]
  17. Bautista, I.; Lidón, A.; Lull, C.; González-Sanchis, M.; del Campo, A.D. Thinning decreased soil respiration differently in two dryland Mediterranean forests with contrasted soil temperature and humidity regimes. Eur. J. For. Res. 2021, 140, 1469–1485. [Google Scholar] [CrossRef]
  18. Vallejo, R. El mapa forestal de España escala 1:50.000 (MFE50) como base del tercer inventario forestal nacional. Cuad. Soc. Española de Cienc. For. 2005, 19, 205–210. [Google Scholar] [CrossRef]
  19. GVA. Memoria Plan de Acción Territorial Forestal de la Comunitat Valenciana; Generalitat Valenciana: Valencia, Spain, 2013.
  20. Berg, B.; Davey, M.P.; De Marco, A.; Emmett, B.; Faituri, M.; Hobbie, S.E.; Johansson, M.-B.; Liu, C.; McClaugherty, C.; Norell, L.; et al. Factors influencing limit values for pine needle litter decomposition: A synthesis for boreal and temperate pine forest systems. Biogeochemistry 2010, 100, 57–73. [Google Scholar] [CrossRef]
  21. Chamón, M.; Jordán, E.; Martínez, R.; Vicente, L.; Martínez, R.; García, R.; Alcoba, P. Cuantificación del Sumidero de Carbono en la Materia Muerta Sobre el Suelo en Masas de Pinus halepensis Sometidas a Tratamientos Selvícolas en la Región de Murcia. In Proceedings of the Congreso Nacional del Medio Ambiente CONAMA 2018, Madrid, Spain, 26–29 November 2018; pp. 1–19. [Google Scholar]
  22. Kimmins, J. Forest Ecology—A Foundation for Sustainable Forest Management and Environmental Ethics in Forestry, 3rd ed.; Prentice Hall: Upper Saddle River, NJ, USA, 2004. [Google Scholar]
  23. Molina, A.J.; González-Sanchis, M.; Biel, C.; del Campo, A.D. Ecohydrological turnover in overstocked Aleppo pine plantations: Does the effect of thinning, in relation to water, persist at the mid-term? For. Ecol. Manag. 2021, 483, 118781. [Google Scholar] [CrossRef]
  24. IUSS Working Group WRB. World Reference Base for Soil Resources 2014, Update 2015. International Soil Classification System for Naming Soils and Creating Legends for Soil Maps; Soil Resources Reports No. 106; FAO: Rome, Italy, 2015. [Google Scholar]
  25. Yakovchenko, V.P.; Sikora, L.J. Modified dichromate method for determining low concentrations of extractable organic carbon in soil. Commun. Soil Sci. Plant Anal. 1998, 29, 421–433. [Google Scholar] [CrossRef]
  26. Walkley, A.; Black, I.A. An examination of the Degtjareff method for determining soil organic matter, and a proposed modification of the chromic acid titration method. Soil Sci. 1934, 37, 29–38. [Google Scholar] [CrossRef]
  27. Andrés-Abellán, M.; Wic-Baena, C.; López-Serrano, F.R.; García-Morote, F.A.; Martínez-García, E.; Picazo, M.I.; Rubio, E.; Moreno-Ortego, J.L.; Bastida-López, F.; García-Izquierdo, C. A soil-quality index for soil from Mediterranean forests. Eur. J. Soil Sci. 2019, 70, 1001–1011. [Google Scholar] [CrossRef]
  28. Lull, C.; (Universitat Politècnica de València, Valencia, Spain). Personal communication, 2021.
  29. Bautista, I.; Lado-Monserrat, L.; Lull, C.; Lidón, A. Mid-Term Effects of Forest Thinning on N Mineralization in a Semi-Arid Aleppo Pine Forest. Forests 2021, 12, 1470. [Google Scholar] [CrossRef]
  30. Jonard, M.; Misson, L.; Ponette, Q. Long-term thinning effects on the forest floor and the foliar nutrient status of Norway spruce stands in the Belgian Ardennes. Can. J. For. Res. 2006, 36, 2684–2695. [Google Scholar] [CrossRef]
  31. Vesterdal, L.; Dalsgaard, M.; Felby, C.; Raulund-Rasmussen, K.; Jørgensen, B.B. Effects of thinning and soil properties on accumulation of carbon, nitrogen and phosphorus in the forest floor of Norway spruce stands. For. Ecol. Manag. 1995, 77, 1–10. [Google Scholar] [CrossRef]
  32. Almagro, M.; Martínez-Mena, M. Exploring short-term leaf-litter decomposition dynamics in a Mediterranean ecosystem: Dependence on litter type and site conditions. Plant Soil 2012, 358, 323–335. [Google Scholar] [CrossRef]
  33. Baena, C.W.; Andrés-Abellán, M.; Lucas-Borja, M.E.; Martínez-García, E.; García-Morote, F.A.; Rubio, E.; López-Serrano, F.R. Thinning and recovery effects on soil properties in two sites of a Mediterranean forest, in Cuenca Mountain (South-eastern of Spain). For. Ecol. Manag. 2013, 308, 223–230. [Google Scholar] [CrossRef]
  34. Maillard, F.; Leduc, V.; Bach, C.; Reichard, A.; Fauchery, L.; Saint-André, L.; Buée, M. Soil microbial functions are affected by organic matter removal in temperate deciduous forest. Soil Biol. Biochem. 2019, 133, 28–36. [Google Scholar] [CrossRef]
  35. Settineri, G.; Mallamaci, C.; Mitrović, M.; Sidari, M.; Muscolo, A. Effects of different thinning intensities on soil carbon storage in Pinus laricio forest of Apennine South Italy. Eur. J. For. Res. 2018, 137, 131–141. [Google Scholar] [CrossRef] [Green Version]
  36. Bastida, F.; López-Mondéjar, R.; Baldrian, P.; Andrés-Abellán, M.; Jehmlich, N.; Torres, I.F.; López-Serrano, F.R. When drought meets forest management: Effects on the soil microbial community of a Holm oak forest ecosystem. Sci. Total Environ. 2019, 662, 276–286. [Google Scholar] [CrossRef]
  37. Zhou, D.; Zhao, S.Q.; Liu, S.; Oeding, J. A meta-analysis on the impacts of partial cutting on forest structure and carbon storage. Biogeosciences 2013, 10, 3691–3703. [Google Scholar] [CrossRef] [Green Version]
  38. Bravo-Oviedo, A.; Ruiz-Peinado, R.; Modrego, P.; Alonso, R.; Montero, G. Forest thinning impact on carbon stock and soil condition in Southern European populations of P. sylvestris L. For. Ecol. Manag. 2015, 357, 259–267. [Google Scholar] [CrossRef]
  39. Ruiz-Peinado, R.; Bravo-Oviedo, A.; Montero, G.; del Río, M. Carbon stocks in a Scots pine afforestation under different thinning intensities management. Mitig. Adapt. Strateg. Glob. Chang. 2016, 21, 1059–1072. [Google Scholar] [CrossRef]
  40. McClaugherty, C.A.; Aber, J.D.; Melillo, J.M. The role of fine roots in the organic matter and nitrogen budgets of two forested ecosystems. Ecology 1982, 63, 1481–1490. [Google Scholar] [CrossRef] [Green Version]
  41. Shen, Y.; Wang, N.; Cheng, R.; Xiao, W.; Yang, S.; Guo, Y. Short-term effects of low intensity thinning on the fine root dynamics of Pinus massoniana plantations in the three gorges reservoir area, China. Forests 2017, 8, 428. [Google Scholar] [CrossRef] [Green Version]
  42. López, B.; Sabaté, S.; Gracia, C.A. Annual and seasonal changes in fine root biomass of a Quercus ilex L. forest. Plant Soil 2001, 230, 125–134. [Google Scholar] [CrossRef]
  43. Jiang, P.K.; Xu, Q.F. Abundance and dynamics of soil labile carbon pools under different types of forest vegetation. Pedosphere 2006, 16, 505–511. [Google Scholar] [CrossRef]
  44. Hassink, J. The capacity of soils to preserve organic C and N by their association with clay and silt particles. Plant Soil 1997, 191, 77–87. [Google Scholar] [CrossRef]
  45. Grüneberg, E.; Schöning, I.; Hessenmöller, D.; Schulze, E.D.; Weisser, W.W. Organic layer and clay content control soil organic carbon stocks in density fractions of differently managed German beech forests. For. Ecol. Manag. 2013, 303, 1–10. [Google Scholar] [CrossRef]
  46. De Paul Obade, V.; Lal, R. A standardized soil quality index for diverse field conditions. Sci. Total Environ. 2016, 541, 424–434. [Google Scholar] [CrossRef]
Figure 1. Variation in the forest floor fractions (means and standard deviations) between the thinning treatments: (a) total organic matter (×103 kg·ha−1), (b) total organic carbon (TOCff, ×103 kg·ha−1). Lower case letters denote significant differences (Tukey’s HSD post hoc test) for the factor thinning treatment at p-value < 0.05.
Forests 13 00255 g001
Figure 2. Oxidizable soil organic carbon (SOC, ×103 kg ha−1) as a function of soil depth (cm) and thinning intensity treatment. Thinning intensity was a non-significant factor in the ANOVA, while soil depth was significant at p-value < 0.05. Lines are drawn to improve the visualization of the SOC profile for each thinning treatment.
Forests 13 00255 g002
Figure 3. Total organic carbon in soil (TOCs) as a function of total organic carbon in forest floor (TOCff) (a,b). C/N in soil (C/Ns) as a function of C/N in forest floor (C/Nff) (c,d).
Forests 13 00255 g003
Table 1. General soil characteristics in the study site. Values are mean ± standard deviation (n = 9–12). EC: electrical conductivity; BD: bulk density. EC and pH were measured in a 1:2.5 (w/v) aqueous solution, with a conductivimeter (Crison GLP31, Spain) and a pH meter (Crison micropH 2000, Spain), respectively. Carbonate content was determined with a Bernard calcimeter. The texture was determined by the Bouyoucos densimeter method. n.d.: non-determined.
Soil Depth (cm)pH
1:2.5
EC 1:2.5
(dS·m−1)
CaCO3
g kg−1
Sand
(%)
Silt
(%)
Clay
(%)
TextureBD
(g·cm−3)
0–108.33 ± 0.080.20 ± 0.05207 ± 10949.4 ± 6.830.0 ± 2.720.6 ± 4.8Loam1.21 ± 0.16
10–208.43 ± 0.070.20 ± 0.05260 ± 10949.7 ± 7.229.2 ± 3.521.1 ± 5.8Sandy clay1.33 ± 0.08
20–308.45 ± 0.080.21 ± 0.05265 ± 9945.5 ± 5.631.6 ± 3.722.9 ± 6.0Loamn.d.
Table 2. Mean ± standard deviation values for soluble organic carbon (WOCff), total Nff, C/Nff relationship, and basal respiration for the fine fraction of the forest floor after 28 days of incubation (BRff). Lower case letters denote significant differences (Tukey’s HSD/Tamhane’s T2 post hoc tests) for the factor thinning treatment at p-value < 0.05.
TreatmentWOCff
(kg ha−1)
Total Nff
(kg ha−1)
C/NffBRff
(mmol CO2 kg−1)
T1068.03 ± 63.74a54.84 ± 51.38ab20.85 ± 1.04a472.43 ± 169.68a
T3094.56 ± 74.12a54 ± 35.96a22.56 ± 1.91a897.87 ± 227.57ab
T60176.32 ± 178.17ab95.98 ± 106.62ab23.11 ± 1.86ab736.44 ± 254.86ab
T100207.97 ± 91.62b154.6 ± 83.02b22.73 ± 1.39b834.11 ± 198.77b
Table 3. Mean ± standard deviation soil values for total organic carbon (TOCs), soluble organic carbon (WOCs), total Ns, C/Ns relationship, and basal respiration after 28 days of incubation (BRs). Lower case letters denote significant differences (Tukey’s HSD/Tamhane’s T2 post hoc tests) for the factor thinning treatment at p-value < 0.05.
TreatmentTOCs
(kg ha−1)
WOCs
(kg ha−1)
Total Ns
(kg ha−1)
C/NsBRs
(mmol CO2 kg−1)
T1031,459 ± 11,626a94.71 ± 15.08a1664.54 ± 584.6a18.93 ± 2.7a30.11 ± 7.98a
T3036,898 ± 8069a87.44 ± 11.85a1546.26 ± 208.7a23.35 ± 3.58b24.88 ± 5.57a
T6033,295 ± 6860a114.13 ± 29.54a1576.83 ± 165.9a21.24 ± 4.5ab26.56 ± 10.07a
T10038,784 ± 10,986a112.81 ± 59.03a1626.74 ± 289.1a23.65 ± 4.97b38.52 ± 13.86a
Table 4. Correlation matrix (Spearman correlation coefficients) between the soil (s) and forest floor measurements (ff): TOC: total organic carbon, WOC: dissolved organic carbon, SOC: easy oxidizable organic carbon, N: nitrogen content, C/N: C/N ratio, BR: basal respiration, BD: bulk density, Ps: soil phosphorous content. ** Significant correlation at p-value < 0.01; * significant correlation at p-value < 0.05.
TOCffWOCffNffC/NffBrff
TOCs0.438 **0.418 *0.493 **0.421 *−0.267
WOCs0.1870.331 *0.2190.267−0.318
SOC0.3130.2630.2960.203−0.328
Ns0.1370.1010.0940.068−0.043
C/Ns0.4820.408 *0.498 **0.622 **−0.167
BRs0.389 *0.366 *0.353 *0.071−0.234
CaCO30.4290.599 *0.687 **0.462−0.091
Sand0.4010.665 *0.780 **0.401−0.643 **
Silt−0.06−0.302−0.626 *−0.2360.476
Clay−0.418−0.681 *−0.709 **−0.3740.510
BD−0.091−0.0020.2300.431−0.088
Ps0.1370.1310.2390.360 *0.051
Publisher’s Note: MDPI stays neutral with regard to jurisdictional claims in published maps and institutional affiliations.

