Article

Carbon Sequestration in Carob (Ceratonia siliqua L.) Plantations under the EU Afforestation Program in Southern Spain Using Low-Density Aerial Laser Scanning (ALS) Data

by
Guillermo Palacios-Rodríguez
1,2,*,
Luis Quinto
3,
Miguel A. Lara-Gómez
2,
Javier Pérez-Romero
4,
José Manuel Recio
5,
Marta Álvarez-Romero
1,
Antonio M. Cachinero-Vivar
1,
Salvador Hernández-Navarro
6 and
Rafael M. Navarro-Cerrillo
1
1
Laboratory of Dendrochronology, Silviculture and Climate Change, DendrodatLab-ERSAF, Department of Forestry Engineering, Campus de Rabanales s/n, School of Agriculture and Forestry, University of Cordoba, Edificio Leonardo da Vinci, 14071 Córdoba, Spain
2
IDAF-Centre for Research Applied in Agroforestry Development, Parque Científico Tecnológico Rabanales 21, Edificio Aldebarán, M1.5, C/Astrónoma Cecilia Payne, 14014 Córdoba, Spain
3
Darién Regional University Center, Department of Soils and Water/Agroforestry, Faculty of Agricultural Sciences, University of Panama, Panama City 3366, Panama
4
University Institute of Water and Environmental Engineering, Polytechnic University of Valencia, Camino de Vera s/n, 46022 Valencia, Spain
5
Department of Ecology (Physical Environment and Geomorphology), Campus de Rabanales s/n, University of Cordoba, 14071 Córdoba, Spain
6
Department of Agricultural and Forestry Engineering, ETSIIAA, Universidad de Valladolid, 34004 Palencia, Spain
*
Author to whom correspondence should be addressed.
Submission received: 20 December 2021 / Revised: 25 January 2022 / Accepted: 3 February 2022 / Published: 10 February 2022
(This article belongs to the Special Issue Adaptive Forest Management to Climatic Change)

Abstract

:
Climate change is one of the environmental issues of global dominance and public opinion, becoming the greatest environmental challenge and of interest to researchers. In this context, planting trees on marginal agricultural land is considered a favourable measure to alleviate climate change, as they act as carbon sinks. Aerial laser scanning (ALS) data is an emerging technology for quantitative measures of C stocks. In this study, an estimation was made of the gains of C in biomass and soil in carob (Ceratonia siliqua L.) plantations established on agricultural land in southern Spain. The average above-ground biomass (AGB) corresponded to 85.5% of the total biomass (average 34.01 kg tree−1), and the root biomass (BGB) was 14.5% (6.96 kg tree−1), with a BGB/AGB ratio of 0.20. The total SOC stock in the top 20 cm of the soil (SOC-S20) was 60.70 Mg C ha−1 underneath the tree crown and 43.63 Mg C ha−1 on the non-cover (implantation) area for the C. siliqua plantations. The allometric equations correlating the biomass fractions with the dbh and Ht as independent variables showed an adequate fit for the foliage (Wf, R2adj = 0.70), whereas the fits were weaker for the rest of the fractions (R2adj < 0.60). The individual trees were detected using colour orthophotography and the tree height was estimated from 140 crowns previously delineated using the 95th percentile ALS-metric. The precision of the adjusted models was verified by plotting the correlation between the LiDAR-predicted height (HL) and the field data (R2adj = 0.80; RMSE = 0.53 m). Following the selection of the independent variable data, a linear regression model was selected for dbh estimation (R2adj = 0.64), and a potential regression model was selected for the SOC (R2adj = 0.81). Using the segmentation process, a total of 8324 trees were outlined in the study area, with an average height of 3.81 m. The biomass C stock, comprising both above- and below-ground biomass, was 4.30 Mg C ha−1 (50.67 kg tree−1), and the SOC20-S was 37.45 Mg C ha−1. The carbon accumulation rate in the biomass was 1.94 kg C tree−1 yr−1 for the plantation period. The total C stock (W-S and SOC20-S) reached 41.75 Mg ha−1 and a total of 4091.5 Mg C for the whole plantation. Gleaned from the synergy of tree cartography and these models, the distribution maps with foreseen values of average C stocks in the planted area illustrate a mosaic of C stock patterns in the carob tree plantation.

1. Introduction

Based on FAO statistics, forests covered an estimated area of 3999 million ha in 2015, or about 31% of the global land area. A further 1204 million ha were covered by other wooded land [1]. Europe (including the Russian Federation) accounts for approximately 25% of the forests and is the greater forest geographical region in the world [1]. Additionally, the global planted forest area increased from 167.5 million ha to 277.9 million ha in the period of 1990 to 2015, with the increase varying by region and climate domain. A total of 56% of the planted forest surfaces in 2015 were in the temperate zone [2].
Forest ecosystems play an important role in reducing greenhouse effects by storing atmospheric carbon dioxide as biomass [3,4], with an estimated global terrestrial CO2 sink of 2.7 ± 0.9 Pg C year−1. Other studies, such as [5], estimated the total C sink in established forests was 2.4 ± 0.4 Pg C year1 for the period of 1990–2007. In addition, [6] estimated that forest land was a net source of CO2 emissions of 0.40 PgC year−1 in the period of 1991–2015, mainly due to deforestation and forest degradation. After considering these results and according to other authors [7,8], significant uncertainties regarding carbon sinks exist that are related to imprecise estimates of the biomass in forest systems. Forest plantations are recognised as part of the strategy to mitigate greenhouse gas emissions [9]. Conversion to forest land through the planting of trees (afforestation/reforestation) is a forestry activity that has an effect on climate change mitigation and is defined in the Kyoto Protocol as one activity that can be accounted to fulfil national commitments [10].
Since 1990, the EU afforestation actions have had a significant boost within the Common Agricultural Policy. The EU has supported afforestation on agricultural land since 1992 (Council Regulation 2080/92), returning non-productive cultivated lands to forests. Since 2000, the objectives of extending woodland areas have been integrated into the support for rural development (Council Regulation 1257/1999). The EU afforestation policies have had an enormous impact on the Spanish afforestation dynamics [11]. The afforested land during the period of 1993–1999 reached 460,000 ha and was performed by private landowners using Quercus as the main tree species. Furthermore, between 2000 and 2006, a total surface area of 208,000 ha was afforested. The impact of this afforestation programme was uneven throughout Spain [11]. However, the large-scale implementation of the EU afforestation program will lead to an extensive new forest and ultimately contribute to providing a greater range of ecosystem services, such as fruit and wood production, erosion, and desertification control, contributing to the regional carbon cycle and the reduction of atmospheric CO2 in the long run [12]. A good example of the EU afforestation program may be observed in the Andalusia region (southern Spain), where about 137,455 ha of agricultural land have been afforested (1993–2006) mainly using the Mediterranean Quercus species (Q. ilex L., Q. suber L., 59%), wild olive (Olea europea L. var. sylvestris Brot, 15.37%), carob tree (Ceratonia siliqua L, 10.24%), and Aleppo pine (Pinus halepensis Mill, 9.5%) [13,14,15]. In particular, carob tree species are located in Andalusia with a total of 14,075 ha, mainly in the interior of Eastern Andalusia. The carob tree is an evergreen tree frequently used in agri-food industries and soil restoration purposes. In the EU afforestation program in Andalusia, more than 12,000 ha have been cultivated with this species, with an extraordinary productive potential (e.g., justified by pharmacological and food industry interests) as well as with high environmental benefits, such as C sequestration and degraded soil ecological restoration. In quantitative terms, Muñoz-Rojas et al. [16] estimated an increase of 17.24 Mg in the total vegetation C stock in Andalusia between 1956 and 2007, mainly due to afforestation and the intensification of agriculture.
Forest plantations have a high carbon uptake potential, especially concerning their contribution to soil carbon accumulation in abandoned agricultural lands [9,17]. Some authors have confirmed an increase in soil organic C (SOC) after plantation in Mediterranean environments [18,19]. More generally, recent studies have pointed out that agricultural dereliction may be an important and low-cost proposed action for climate change mitigation due to the vegetation retrieval and increase in soil organic matter [20,21,22,23]. The importance of the accurate estimation of C sinks on these plantations, with different species and management systems, may contribute to a better understanding of the contribution of planted forests to the global C cycle [24]. Additionally, the estimation of C in afforestation programs requires the use of new species-specific methodological approaches and high-resolution zonal cartography that contribute to improving the clarity and accuracy of C sink accounting [25,26].
Carbon estimations by direct methods are complex, time-consuming, and costly. Thus, alternatively, indirect techniques based on models combined with remote sensing data have been developed [23,27]. The most common and well-known approach is to fit tree allometric equations based on forest inventory data [26,28] and, more recently, remote-sensing techniques have been used [29]. In the last decade, the use of airborne laser scanning (ALS) data has provided high-precision dasometric information on forest stands, improving above-ground biomass (AGB) [30]. Many studies have provided methodologies to integrate tree allometric models with LiDAR data to estimate the C stock of forest plantations [23,31,32,33]. However, despite these recent contributions, there is still a gap in the knowledge about the estimation of biomass accumulation and carbon sequestration at a species-specific scale for afforestation activities in Mediterranean environments. Here, we combined tree crown segmentation based on low-density ALS data (0.5 points m−2) and allometric models to estimate the overall biomass (above- and below-ground—AGB and BGB) and the SOC in a 14-year-old carob (Ceratonia siliqua L.) plantation in former agricultural land. The specific goals of this study were (i) to determine robust allometric models to estimate overall C biomass and SOC stocks based on tree height and diameter from field data; (ii) to use low-density ALS-derived individual tree measurements to segment individual tree crowns and assess tree heights in the carob afforestation studied; (iii) to quantify the dbh and SOC for individual trees using LiDAR-derived individual tree height since the dbh is the most reliable variable for biomass estimation; (iv) to estimate and map the total C stocks of the total carob afforestation. Our study provides a valuable statistical and methodological framework to use allometric models and low-density ALS data for the purposes of monitoring C stocks in forest plantations on agricultural lands. This is crucial information to assess environmental services related to climate change mitigation through CO2 fixation. The methodology covers the need for a consistent and operational methodological framework that is affordable (e.g., cost and accuracy) using free-public ALS data with application for local to regional scales.

2. Materials and Methods

2.1. Site Description

The study was located in Puerto Real (36°30′54.79” N–6°4′42.50” W, 52 m.a.s.l, Cádiz, southern Spain, Figure S1, Supplementary Materials), at a private planted forest established under the EU afforestation scheme. The study area falls into a semi-humid Mediterranean climate region with an average annual temperature of 17.6 °C, hot dry summers (25.2 °C, July), and warm and humid winters (10.5 °C, January). The annual mean precipitation is 595 mm. The study area comprised 28.5 ha that is covered with a carob tree plantation. The topography of the plantation is smooth. The colour of the studied soil was brown (10YR 5/2(d) and 10YR 4/1 (w), an indicator of young soils with the presence of carbonates [34]. The parent material is of colluvial–alluvial origin, originating a Calcic Fluvisol/Calcaric Regosol [35]. According to data from Andalusian Environmental Information Network (REDIAM), the soils are characterised by a pH (H2O) ranging between 7 and 7.5, with low organic matter content (2–2.5%), low nitrogen content (0.1–0.15%), and a texture varying from clay to clay loam. The natural vegetation is composed of a mixture of evergreen shrubs (“mancha”) dominated by Quercus coccifera L. Ceratonia siliqua L., Arbutus unedo L., Cistus laurifolius L., Pistacia lentiscus L., and Myrtus communis L.) varying greatly in both horizontal and vertical dimensions.
The carob tree plantations were established in 1994 (it was 26 years old at the time of our last measurements, 2020) in a 5 m × 6 m pattern, equal to a density of 330 trees ha−1 of C. siliqua (Table 1) on 28.5 ha of former agricultural land. This land was previously used for crop production until it was afforested as part of the EU afforestation program. The planting was performed in two phases, first by inserting disc harrows drawn by a 70-hp farm tractor to pull off shrub vegetation (20 cm deep) and continued by linear subsoiling produced with a shank (40 cm deep) along the planting line. To impede the spontaneous vegetation, mechanised tillage was performed on a yearly basis. The plantation was occasionally irrigated (the first and second year after establishment) and pruned (between ten and fifteen years) but never harvested or fertilised.
Our study used a combination of data sets and technically required the development of remote-sensing indices and data analysis methods. A flowchart outlining the steps and relationships of each process is provided in Figure 1.

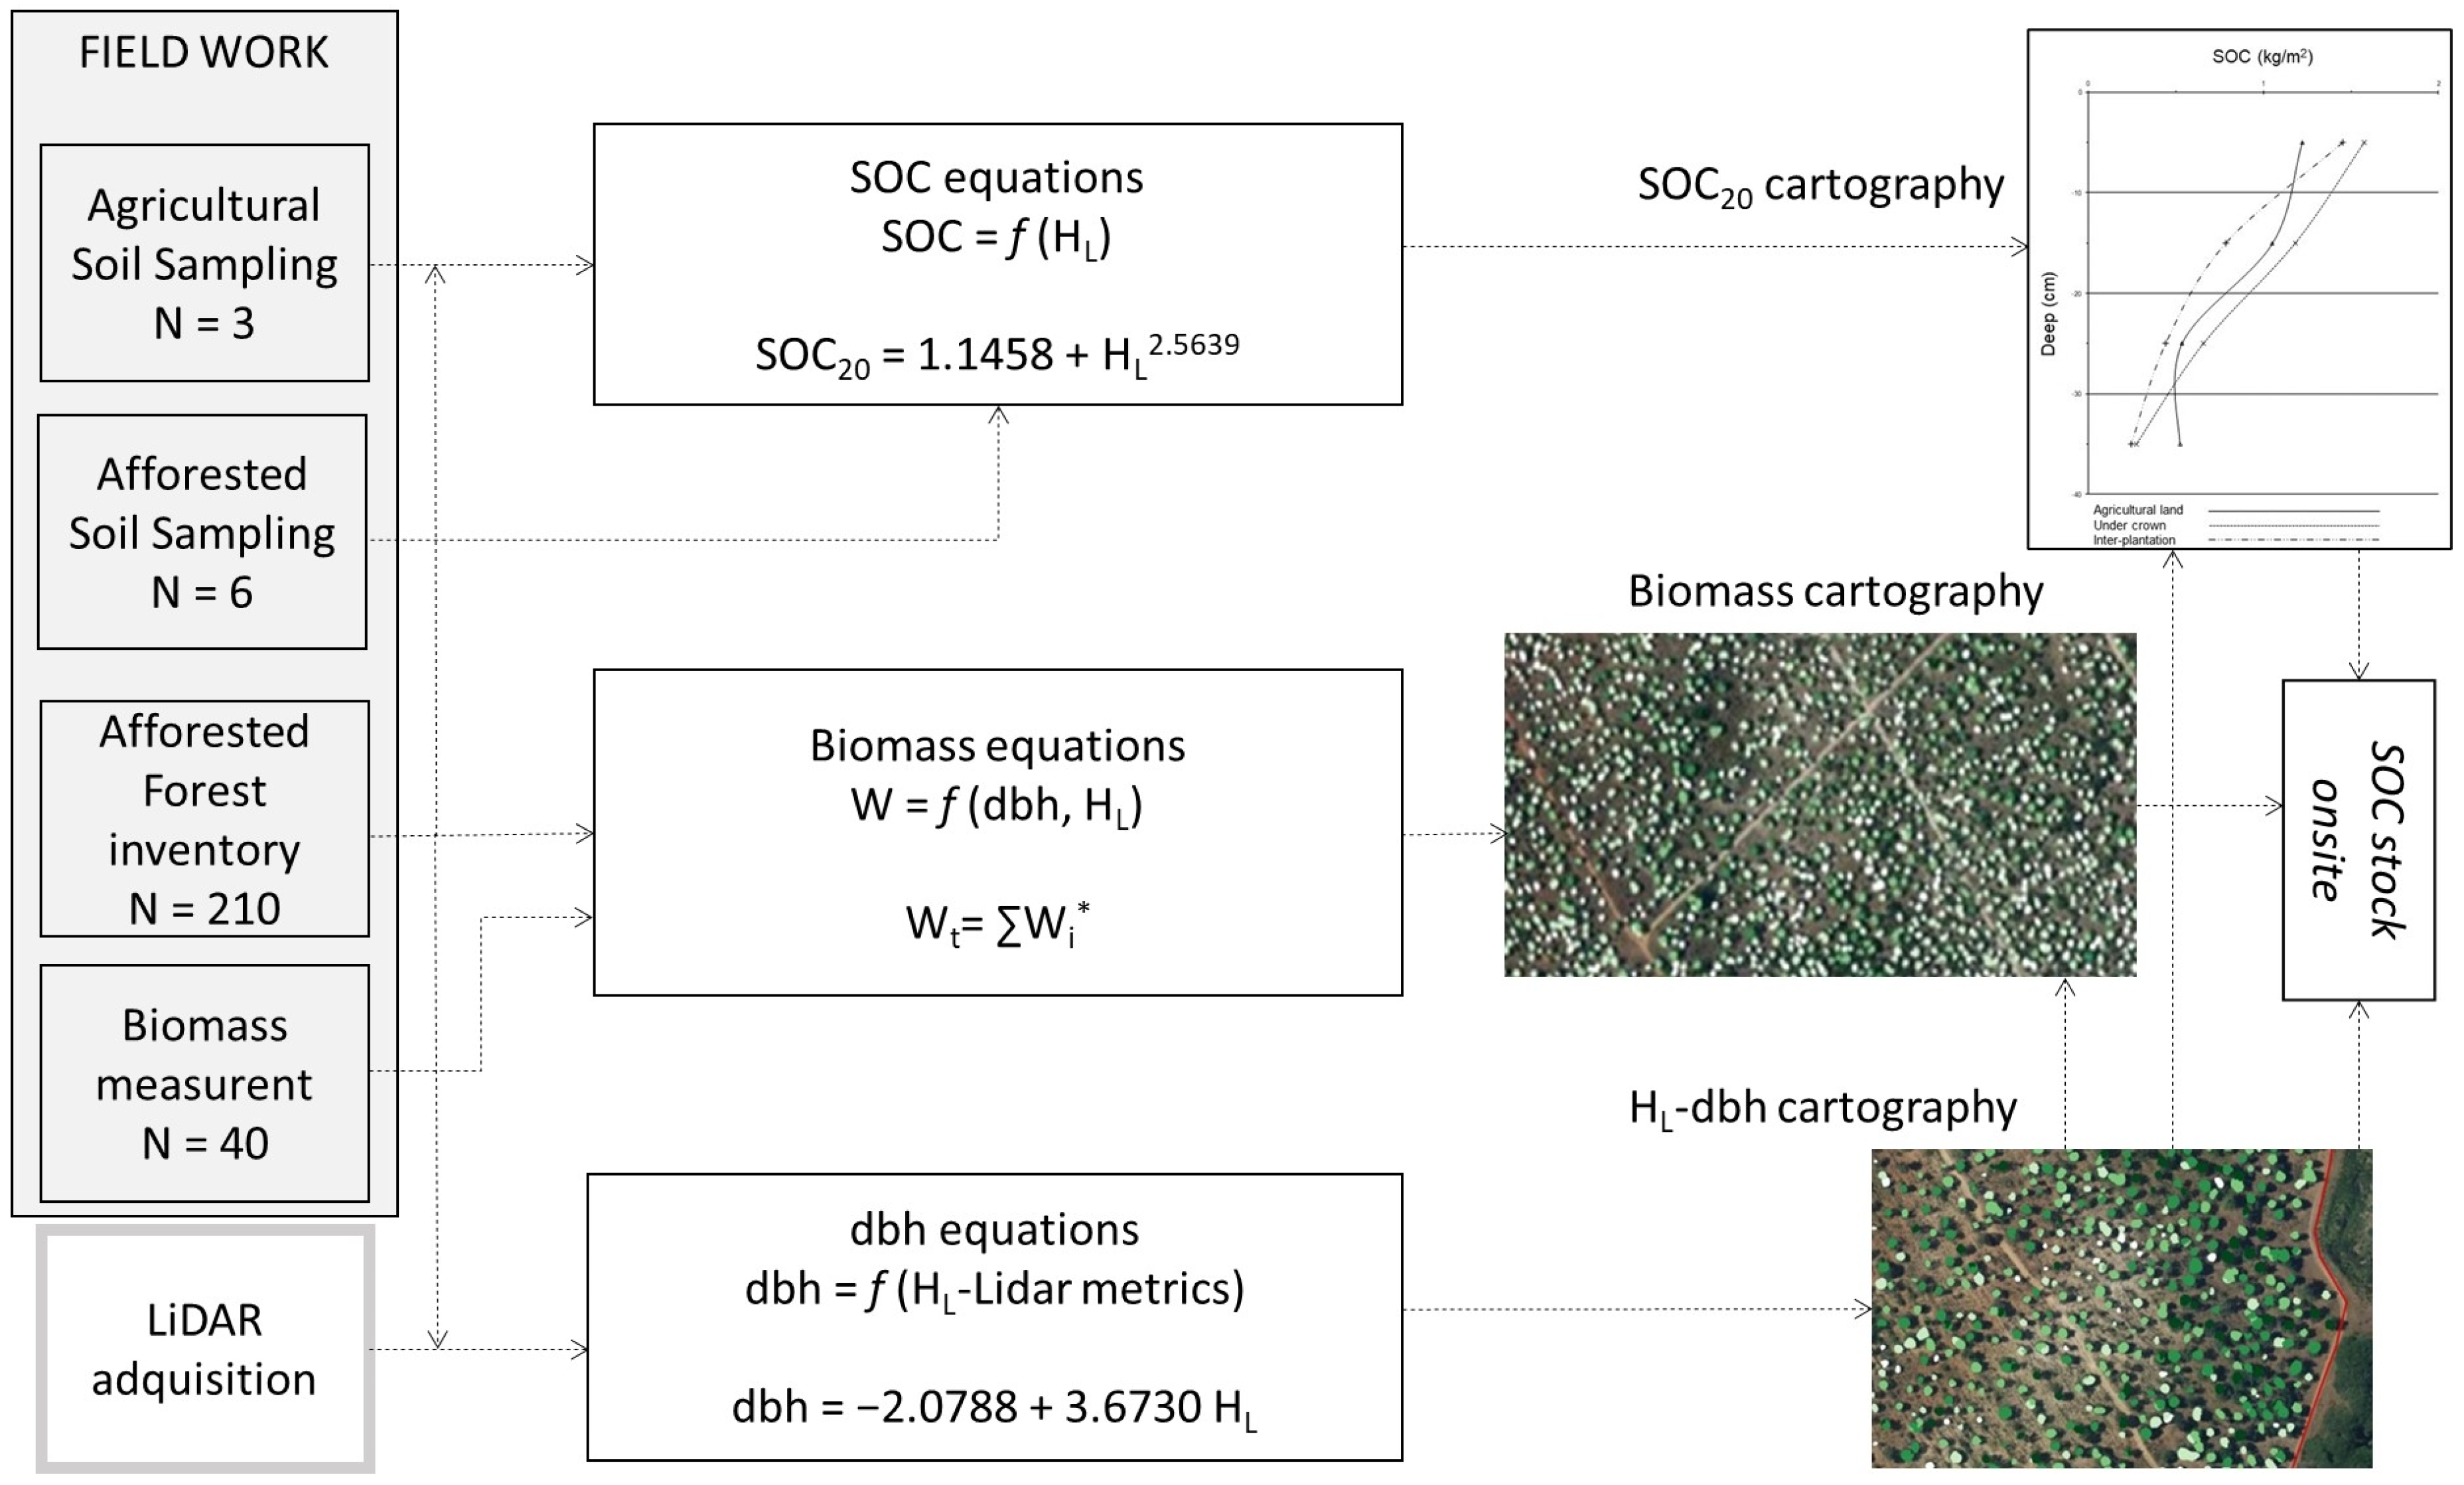
2.2. Sampling and Biomass Equations

The estimates for the biomass and stored carbon were made following the methods used in previous studies by the same authors [23] and according to general standard methodologies [27,36]. In July 2006, an extensive field survey was performed by the University of Córdoba to obtain the allometric equations of four tree species used in afforestation in Andalusia. In the study, 9 plots of carob trees were selected and characterised (Table S1, Supplementary Materials). The selected plot in which all the selected trees were measured covered a total area of 9000 m2 (10 × 10 m) of a regular plantation, with an average slope of 20%. In each plot, the diameter at breast height (1.3 m above ground level, dbh, cm), the diameter at the base of the trunk (db, cm), and the tree height (Ht, cm) of all the trees were measured with a Vertex III hypsometer (Haglöf, Sweden). Forty trees—4 to 5 per plot with diameters between 5 and 20.5 cm—were chosen and logged for biomass determination, using the segmenting method considering fractions—stem, branches, foliage, and root. Root samples were obtained by a total excavation of the trees extending gradually out from the trunk and downwards to bedrock until no more roots were visible. At the tree base and dbh, two 2-cm-thick discs were extracted, which were weighed fresh (with bark) in the field. The branch biomass was assessed based on the fresh-to-dry weight ratio, which was estimated for branches selected from three segments of the tree crown that were later oven-dried. The sample branches from each tree were also used to estimate the foliage biomass. These subsamples were taken to the laboratory and oven-dried to a constant weight at 103 °C to estimate the dry matter content (W, kg). The dry weight of every sample was determined and mechanically ground to pass through a 0.5 mm mesh screen. The above-ground biomass (Wa) was represented by the sum of the stem, branches, and foliage. The total biomass (Wt) was represented by the sum of the Wa and the below-ground dry weight biomass (Wb). Individual models selected for each biomass component were fitted simultaneously using the additive system of equations based on nonlinear seemingly unrelated regression (NSUR) [37,38].
The powder samples of the tree components were analysed for the C concentrations using a NIR macro elemental analyser (Eurovector EA 3000) according to the Dumas combustion method. The obtained conversion factor was 0.487, very close to that established by the IPCC (1996) standards (0.5). The total carbon content from the tree biomass reservoir was estimated by adding together the above- and below-ground biomass, and the dry biomass elements were converted to C stocks using the 48.7% C fraction determined previously. Descriptive statistics of the total above-ground biomass, biomass components, and other variables are shown in Table S1 in the Supplementary Materials.

2.3. Soil Sampling

In January 2020, a new field survey was performed in the study area to obtain tree measures and soil samples. In this survey, 210 carob trees were randomly selected and characterised. In each tree, the diameter at breast height (dbh, cm) and the tree height (Ht, cm) of all trees were measured (Table 1). A sub-meter global satellite receiver (Leica Zeno 20 GIS, Leica Geosystems, Heerbrugg, Switzerland) was used to examine the tree samples, and overtopped trees were excluded from our analysis (Figure 1).
From this sample, ten trees were selected to obtain soil samples according to the representative soil-forming factors for the study area (e.g., an average parental material, vegetation, and topographic conditions, and with adequate internal variability microtopography to collect the condition variation of all of the plantation factors). Soil samples were collected from the first 20 cm of the soil surface using a soil corer 8 cm in diameter; no surface litter was included. At this depth, the effects of the roots on the soil organic carbon content are considered. The mineral topsoil layer (0–20 cm) is the main area of interest in spatial inventories of SOC according to the Kyoto report requirements [39]. The soil samples for each tree were taken at two different distances away from the trunk and perpendicular to the plantation line. At each point, three subsamples were taken. The first three samples were taken close to each other at a distance of one meter away from the trunk and under the influence of the tree canopy. The next three samples were sampled two meters away from the trunk and in the same way as the previous ones. In addition, an agricultural reference soil was sampled. These samples were used to assess the soil organic carbon content. The soil samples were air-dried at room temperature (25 °C) and then sieved (mesh size of 2 mm) to remove coarse living roots and gravel. The bulk density (BD) of the soil sampled points were estimated as follows [40] (g cm−3):
BD = 100 % O M       0.244   + 100 % O M 1.64
where OM, the soil organic matter, was obtained with the expression %OM = %SOC * 1724; we used a typical value of 1.64 for the mineral bulk density [41].
The organic carbon content of the soil fine fraction was determined by oxidation with K2Cr2O7 in an acidified medium with H2SO4 (96%), using the method described by [42]. The total SOC (Mg ha−1) stock within a certain soil layer was calculated according to the following adapted equation [43]:
SOC stock (Mg Cha−1) = BD × SOC × dh
where bd is the bulk density of the soil (g/cm3), dh is the thickness in centimetres of the horizon analysed, and SOC is the soil organic carbon concentration as a percentage of the soil weight.

2.4. ALS Data and Height Data Processing

Low-density ALS data (0.5 points m−2) were acquired in March, 2014 and provided by the PNOA (http://www.ign.es/PNOA/vuelo_ALS.html, accessed on 20 December 2020). The ALS survey was conducted using an airborne Leica ALS60 discreet return sensor. A total of 1.55 Gb of ALS data were provided and captured in 2009. The data were delivered in three 2 km × 2 km tiles (ranging from 86 Mb to 136 Mb) of raw data points in an ASPRS laser LAS binary file, format v.1.1, containing x- and y-coordinates (UTM Zone 30 ETRS 1989) and ellipsoidal elevation Z, with up to four returns measured per pulse and intensity values from a 1064-nm wavelength laser. The resulting ALS point density of the test areas was 0.5-point m−2, with a vertical accuracy higher than 0.20 m. The flight parameters were a scan frequency of 45 Hz and an FOV of 50°. The reference system was the European Terrestrial Reference System 89 (ETRS89), and the coordinate system was UTM for the thirtieth time zone.
Before the ALS data processing, automated crown tree detection was performed using high-resolution aerial colour panchromatic images (1:10,000 scale, 0.5 m pixel, Junta de Andalucía, 2016). Photogrammetric stereo-measurements of the tree crowns were performed using a DPW (Hyundai IT W220S stereo-monitor) with PHOTOMOD Lite 4.4 photogrammetric software and Global Mapper v11.01 software [44]. The tree segments were manually checked by an experimented observer to remove potential errors and verify the accuracy of the segmentation process.
Afterwards, a digital vegetation model (DVM) was generated for the study area from the ALS data, but due to the low density of points and the reduced size of the trees, a gap-filling algorithm was performed to obtain the canopy height model (CHM) using LAStools software [45]. In this study, 43 metrics were obtained by the “GridMetrics” command implemented in the FUSION and lidR package v2.0.0 [46,47] (Table S2, Supplementary Materials). All returns above 0.5 m were detected and the perimeter of each tree crown was defined considering that high laser values in a spatial neighbourhood represent the tip of a tree crown (95th percentile) [48]. The time delay between the ALS data (2014) acquisition and the field data collection (i.e., 2020, 6 years) was not considered as a significant source of error due to the management practices (e.g., pruning), which reduced the height growth in adult trees. In a subset of data (n = 140), the relationship between the LiDAR percentile heights and the individual tree heights was determined using linear regression analysis. For additional details of the procedure used to obtain such ALS metrics and models, see [23].

2.5. Relationships among ALS Height, dbh, and SOC

Regression models were used to develop equations relating the ALS height as an independent variable, the dbh of individual trees, and the SOC. The coefficient of determination R2 was calculated as a measure of the goodness of fit of the prediction model. R software, version 4.0.3 was used, including the ggplot2 package.

2.6. Cartography of C Stocks

A C stock map of the carob tree plantations in the studied location was generated. The heights of all trees were obtained using the ALS data (HL) based on tree crown binarisation/segmentation. Once the HL of each tree had been calculated, the allometric models, considering the HL as an independent variable, were used to estimate the dbh (dbhL) and SOC. The dbhL values were included in the equations to predict the total biomass of the trees. Both the SOC and biomass models were applied at the tree scale (8323 trees) to generate two C stock maps—Wt-S and Wt-S + SOC-S20. The overall C (Mg C ha−1) presented in the tree biomass was calculated by adding all the trees’ individual values. The overall SOC presented in the afforestation was obtained, and the biomass ratios and SOC–C stocks were calculated for the 26-year period.

2.7. Statistical Analysis

The normality and homoscedasticity were analysed by the Kolgmorov and Levene tests (p > 0.05). All data were log-transformed when necessary to meet the assumption of normality. The results in the tables are shown as the means along with their standard errors for the untransformed variables.
Individual models selected for each biomass component were fitted simultaneously using the additive system of equations based on nonlinear seemingly unrelated regression (NSUR) to ensure compatibility between the total biomass and the sum of the fractions [37]. This statistical approach has been frequently used in biomass studies [38]. The Proc SQL program of SAS [49] was used to perform the routine. The characteristic heteroscedasticity of the biomass data was evaluated with the White test (SAS Institute 2004) and was corrected with a residual variance power function as the weighting factor. The accuracy and precision of the models were evaluated by graphical and numerical analyses of the residuals. The relationships among the individual ALS tree heights (HL) with the field height (n = 140), dbh (n = 140), and SOC (n = 10) were determined using linear, exponential, power, and logarithmic regressions models. The statistical criteria for selecting the best model were the adjusted coefficient of determination (R2adj), the root mean square error (RMSE) and the Durbin–Watson test [50]. All statistical analyses were based on a significant level of p < 0.05. We performed all analyses with R software, version 4.0.3, and SAS statistical software [50] was used for fitting the weighted nonlinear systems of equations using NSUR.

3. Results

3.1. Biomass and SOC Values

The tree biomass values for the carob trees and fractions are presented in Table 1. The order of the biomasses of the different fractions is root>branches>stem>foliage. The average above-ground biomass corresponded to 85.5% of the total biomass (average 34.01 kg tree−1) and the root biomass was 14.5% (6.96 kg tree−1), with a BGB/AGB ratio of 0.20.
The total SOC stock in the top 20 cm of the soil (SOC-S20) was 58.91 Mg C ha−1 underneath the tree crown and 37.72 Mg C ha−1 on the non-cover (implantation) area for the C. siliqua plantations. The agricultural soil used as reference had an SOC-S20 of 23.16 Mg C ha−1 (Table 1).

3.2. The Biomass Allometric Equations

Table 2 shows the allometric equations using the NSUR functions correlating the biomass fractions with the dbh and Ht as independent variables. In all cases, an exponential trend was observed. The graphs of the residuals weighting did not show any trend or heteroscedasticity (data not included). All parameters were significant at the 95% confidence level. The best NSUR generic equations for biomass estimation showed adequate fit for the foliage (Wf, R2adj = 0.70), whereas the fits were weaker for the rest of the fractions (R2adj < 0.60; Table 2).

3.3. Height Estimation Based on ALS Metrics

The individual trees were detected using colour orthophotography (Figure 1), according to a supervised maximum likelihood classification of three classes (soil, shadow, and vegetation). A total of 140 individual trees were detected using colour orthophotography (Figure 1), using photogrammetric stereo-measurements of the tree crowns. The tree heights were estimated using the 95th percentile ALS metric. The precision of the adjusted models was verified by plotting the correlation between the LiDAR-predicted height (HL) and the field data (n = 70) (R2adj = 0.80; RMSE = 0.53 m).

3.4. The dbh and SOC Allometric Equations Based on ALS Height

The dbh and SOC models were fitted using the ALS height (HL) as an independent variable (Table 3). Linear regression was selected for dbh estimation (R2adj = 0.64, DW = 1.47), and a potential regression model was selected for SOC estimation (R2adj = 0.81, DW = 2.19).

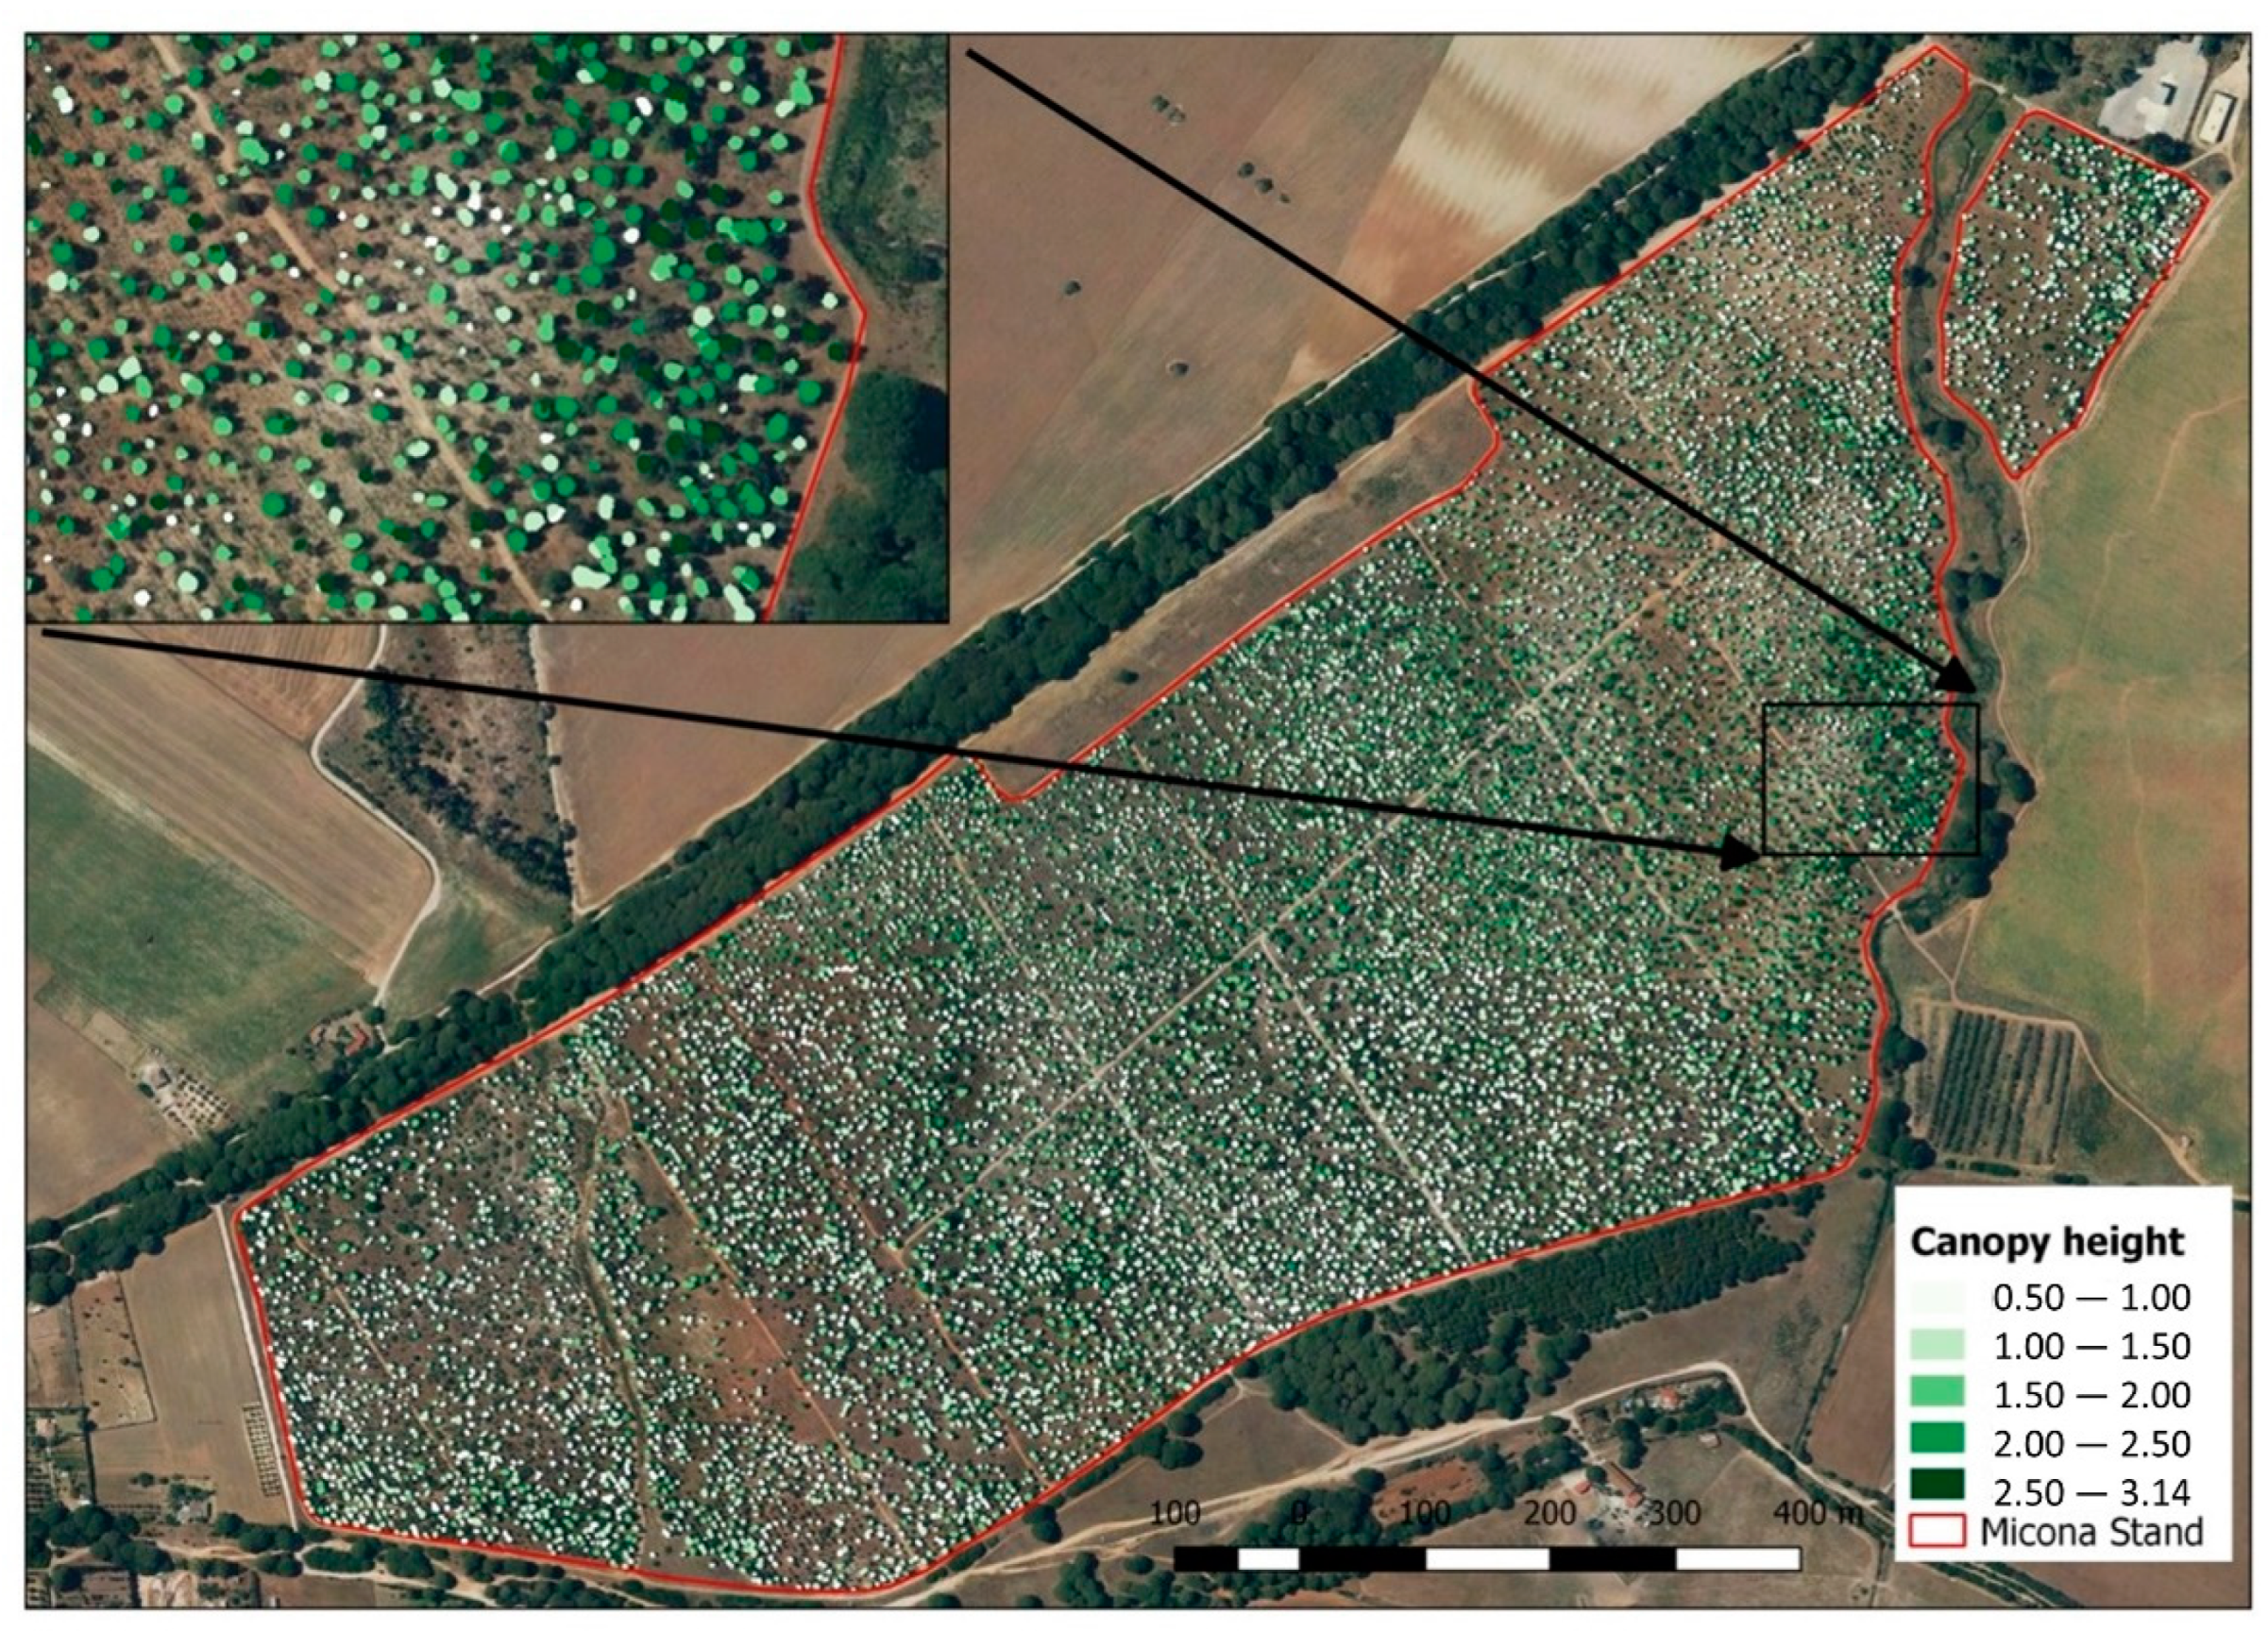
3.5. C Stock Estimation and Cartography from ALS Data

Using the segmentation process, a total of 8324 trees were delineated in the study area, with an average height of 3.81 m. A regression model was selected to spatially estimate the C stocks for the study area (Wt-S and SOC20-S, Table 3).
The biomass C stock, including both the above- and below-ground biomass, was 4.30 Mg C ha−1 (50.67 kg tree−1) and the weighted SOC20-S was 41.51 Mg C ha−1, with a total C stock (Wt-S and SOC20-S) of 45.81 Mg ha−1, (Table 4). The overall average C accumulation rate was 1.76 Mg C ha−1 yr−1 for the plantation period, and regarding the reference agricultural soil, the C accumulation rate was 0.87 Mg C ha−1 yr−1 for the plantation period. The total C stock (W-S and SOC20-S) for the whole plantation (28.5 ha) reached a value of 1,305.70 Mg C for the entire plantation (Table 4). Based on the tree cartography and these models, the distribution maps with predicted values of average C stocks in the planted area show a mosaic of C stock patterns in the carob tree plantation (Figure 2).

4. Discussion

In this study, we estimated the overall biomass C and SOC stocks on a Ceratonia siliqua afforestation using field and low-density ALS point cloud data. The mean canopy height was selected as a predictor variable for the biomass and SOC individual tree estimation and the subsequent mapping. A set of regression equations was used to predict the biomass fraction and forest properties (dbh and SOC), and the ALS individual canopy heights were selected to estimate the tree heights. The combination of both models allowed us to calculate the total C stock in the plantation accurately and at a lower cost than with field inventories.

4.1. Biomass and SOC Values

Biomass is the most important indicator of the C sequestration capacity of forests; therefore, its calculation is essential to estimate forest carbon balance and dynamics. The average overall biomass C stock of carob trees was 46.48 kg tree−1, which is lower than those reported for the natural and planted trees of the same species (AGB = 157 kg tree −1, BGB = 170 kg tree−1) but similar to the values found for Quercus species in similar plantations (27.9 kg tree−1 for holm oak and 41.1 kg tree−1 for cork oak [23]). These discrepancies can be explained by the differences in tree size (dbh = 12.83 cm and 19.0 cm, respectively [27]). The above-ground biomass represented the highest proportion of individual tree biomass (63.2%), which is similar to the results of C. siliqua in Spain (54.7%), but with a lower root/shoot ratio (0.58 and 0.80, respectively, [27]). The lower proportion of the below-ground biomass of the carob trees in this study may be related to the origin of the forest. In plantations, the root growth pattern is limited by the seedling quality and the root ability to explore the soil (e.g., root morphology due to container culture), which in turn, can produce alterations in height and root growth in the field [51,52]. In addition, most measures of root biomass are usually neglected and probably underestimate this biomass fraction [53], although root pool contributes significantly to the soil organic carbon fraction [54].
Regarding the SOC-S, in our study, SOC20-S was 58.91 Mg ha−1 under the tree crown and 37.72 Mg ha−1 in the interplanted areas, with a weighted average of 41.51 Mg ha−1, which is significantly higher than the values found in the reference agricultural soil (23.16 Mg ha−1). These values are also higher than other forest plantations (Quercus ilex-Q. suber plantation, SOC40-S = 36.90 Mg ha−1 under the tree crown and 29.26 Mg ha−1 for the inter-planted areas, Lara et al., 2020) and mature semi-natural populations of Quercus species (Q. suber, SOC50-S = 24.20 Mg ha−1 [55]; Q. pyrenaica, SOC20-S = 33 Mg ha−1 [56,57]). Many studies have considered the soil the most important carbon pool in forest plantations; however, changes in soil carbon stocks among forest species used on plantations are not easy to assess due to differences in litter production, tree size, soil management, and so forth, resulting in different SOC values [58].

4.2. Allometric Equations for Biomass Estimation

A nonlinear seemingly unrelated regression (SUR) approach was used to fit the models relating the biomass fractions with the dbh and Ht as independent variables from the field inventory data and field-based estimates of the biomass at a tree scale [37]. In carob trees, the foliage and overall biomass correlated most strongly with the height and dbh data (R2adj > 0.65); branches showed the weakest correlation (R2adj = 0.51), and the stem and root biomass model had a middle value (R2adj ~0.60). Carob is a very managed tree; its crown can be altered by pruning, significantly altering the allometry [59], and which is more relevant in accurately estimating the biomass of small trees. Although our results have lower adjusted models than previous studies [27], we obtained accurate estimates for the overall and fraction biomass, showing that the dbh and H were useful parameters to estimate the biomass in low-density C. siliqua plantations.

4.3. Allometric and SOC Stock Estimation from ALS Data

In this study, we obtained the carob tree height using a combination of segmentation and heights extracted from the raw CHM (ALS-data, 95th percentile). Colour orthophotos were used for the tree crown segmentation process based on simple raster classification [54] However, it is difficult to conclude that colour orthophotography should be recommended for tree segmentation in forest areas due to the limitations related to the use of specific algorithms for segmentation, species shape, and tree distribution (crown overlapping) [60].
Once the tree crowns were delimited, ALS data were applied for height estimation. Low-density ALS data (less than 1 point m−2) has also been used to predict dasometric variables (e.g., dbh and height) at the tree and stand scale, with a good fit for predicting biomass [61,62]. Thus, a similar approach was used in this study to relate the PNOA-ALS (0.5 point m−2) height with the field height on carob tree plantations. A regression model was generated to predict the tree height based on ALS metrics (e.g., 95th percentile) in homogeneous carob tree plantations. The validation results (R2adj = 0.80; RMSE = 0.53 m) are consistent with those of previous studies that have estimated the height in Quercus spp. plantations in the Mediterranean area, with a similar coefficient of determination (between 0.60 to 0.90, [23,63]). However, LiDAR-derived tree heights are frequently underestimated [64]. Potential sources of error in our study may be related to field measurement data (e.g., tree geolocation) and ALS data (e.g., time delay between the ALS data acquisition and the field measure). In this study, individual tree geolocation was conducted with low error (lower than 10 cm); thus, ALS point clouds corresponded exactly with the dasometric values obtained through the field inventories. Additionally, a time delay between the ALS acquisition and the field measure may have resulted in height detection errors due to the growth form of carob trees producing many shoots in small trees [59]. However, although there were temporal differences between the ALS data and the field tree heights (6 years), the height estimation was useful and reliable and helped in the visual interpretation of the trees.
Finally, two regression models between ALS-height data and dbh and SOC-S were generated (in concordance with results obtained in other studies [23,62,65]. The best accuracies were obtained for linear (dbh, R2adj = 0.64) and potential regression models (SOC, R2adj = 0.81). To the best of our knowledge, no study has applied height as an indicator in SOC estimation for carob tree plantations. Our study shows that low-density ALS data was sufficient for estimating forest inventory variables and SOC at the tree level for planted forests.

4.4. C Stock Cartography

The establishment of tree plantations on former arable soils has contributed significantly to the process of soil C sequestration [66]. In this study, as a final product, the overall C stock (biomass and SOC) of the whole carob tree plantation was estimated at the tree and plot scales. This plantation has shown a high capacity for C carbon sequestration (45.81 Mg ha−1), as has been found for other forest plantations, such as Quercus ilex and Q. suber in similar conditions (46.47 and 35.11 Mg ha−1, respectively) [23], with an overall on-site C stock of 1305.70 Mg in the 26-year-old, 28.5-ha plantation. This difference may be associated with the higher capacity for soil organic carbon related to the litter quality input and rate of decomposition [67]. When considering this overall C stock, we obtained a positive C biomass accumulation rate after the establishment of 1.76 Mg ha−1 yr−1 including SOC20, and 0.871 Mg ha−1 yr−1 in comparison to the reference agricultural soil. These rates in C stocks agree with another study showing a higher C accumulation following reforestation [23], which estimated a C accumulation rate between 0.90 and 1.22 Mg C ha−1 yr−1 [68]. The increase in on-site C stock in the C. siliqua plantation was related to the tree biomass and the SOC accumulation underneath the tree crown, which highlights the importance of low-density forest plantations for C sequestration in Mediterranean areas [23]. Additionally, the use ALS data and a limited number of field measurements for C quantification allows for the accurate mapping of the C stock distribution at trees and plantations [23].
C stock cartography outlines the importance of forest plantations on abandoned agricultural land for C sequestration in the coming years. In this study, biomass C stock, comprising both above- and below-ground biomass, was 4.30 Mg C ha−1, and the SOC20-S was 37.45 Mg C ha−1, with a total C stock (W-S and SOC20-S) of 41.75 Mg ha−1. These values show the potential contribution of low-density plantations of C. siliqua for C sequestration under adequate management practices, as has been found in similar plantations in Mediterranean areas [23,69]. The current and future rural development strategy of the EU should promote ecosystem services related to planted forests, as they are some of the most important for C sequestration [70].

5. Conclusions

Southern Spain was one of the most relevant areas in the European Afforestation Scheme (1993–2008), and forest plantations of carob trees covered more than 5000 ha, mostly on low-quality agricultural land. This paper presents an individual tree-based approach for estimating C stock in carob trees. Integrating several allometric equations, low-density ALS data, and co-registered digital orthophoto imagery makes our approach a realistic alternative to traditional methods, allowing for a faster, lower cost, and higher precision approach. The main limitation is related to the ALS data quality and temporal update, but more frequent (four-year frequency in Spain) low-density national ALS covers can help to minimise this limitation. The final maps of C stocks (biomass and SOC) are crucial for the assessment of land-use changes and greenhouse gas emission balances. However, few studies have mapped C stocks at Mediterranean forest plantations on agricultural lands in Europe (see, [33]) from LiDAR data. The development of C prediction models would be based on regional equations, opening many alternatives to ALS data to estimate the C stock in Mediterranean forest plantations at affordable costs and with good accuracy. The results of this study show that low-density ALS data at a regional scale allows for the use of generalised equations for predicting C stocks at homogenous species plantations based on allometric techniques. Additionally, ALS data allows for the generation of high-resolution maps of on-site C stocks, which are essential for C-based silviculture and successful monitoring in terms of C sequestration. The increase in the national scale ALS systems’ capabilities and the reduction in costs (e.g., open-source data) have made reliable operational methods possible for C stock inventories of tree plantations established on agricultural lands at regional scales.

Supplementary Materials

The following supporting information can be downloaded at https://0-www-mdpi-com.brum.beds.ac.uk/article/10.3390/f13020285/s1, Figure S1: Location of the study area and afforestation perimeter, Table S1: Dasometric characteristics and biomass measures of Carob trees plots, Table S2: ALS-based metrics used for the estimation of tree heights.

Author Contributions

Conceptualisation, R.M.N.-C., G.P.-R. and L.Q.; methodology, R.M.N.-C., G.P.-R., M.Á.-R. and M.A.L.-G.; formal analysis, R.M.N.-C., L.Q., M.Á.-R. and G.P.-R.; investigation, R.M.N.-C., L.Q., J.P.-R., M.A.L.-G., S.H.-N. and J.M.R.; resources, G.P.-R. and R.M.N.-C.; data curation, R.M.N.-C., J.P.-R. and M.A.L.-G.; writing—original draft preparation, R.M.N.-C. and G.P.-R.; writing—review and editing, R.M.N.-C. and A.M.C.-V., with contributions from all authors; project administration, G.P.-R. All authors have read and agreed to the published version of the manuscript.

Funding

This research was funded by the ESPECTRAMED (CGL2017-86161-R).

Institutional Review Board Statement

Not applicable.

Informed Consent Statement

Not applicable.

Data Availability Statement

Not applicable.

Acknowledgments

The authors thank the Andalucía Department of Agriculture and Environment, which provided access to and background information on the field site, particularly Fernando Piñón. We are very grateful to Rafael Sánchez de la Cuesta and Andrés Cortés for their valuable assistance during the fieldwork and data acquisition and processing; without them, this project would not have been possible. We also acknowledge the institutional support of the University of Cordoba—Campus de Excelencia CeiA3.

Conflicts of Interest

The authors declare no conflict of interest.

References

  1. Keenan, R.J. Climate change impacts and adaptation in forest management: A review. Ann. For. Sci. 2015, 72, 145–167. [Google Scholar] [CrossRef] [Green Version]
  2. Payn, T.; Carnus, J.M.; Freer-Smith, P.; Kimberley, M.; Kollert, W.; Liu, S.; Orazio, C.; Rodriguez, L.; Silva, L.N.; Wingfield, M.J. Changes in planted forests and future global implications. For. Ecol. Manag. 2015, 352, 57–67. [Google Scholar] [CrossRef] [Green Version]
  3. Lorenz, K.; Lal, R. Carbon Sequestration in Forest Ecosystems; Springer Science & Business Media: Berlin/Heidelberg, Germany, 2009. [Google Scholar]
  4. Le Quéré, C.; Raupach, M.R.; Canadell, J.G.; Marland, G.; Bopp, L.; Ciais, P.; Conway, T.J.; Doney, S.C.; Feely, R.A.; Foster, P.; et al. Trends in the sources and sinks of carbon dioxide. Nat. Geosci. 2009, 2, 831–836. [Google Scholar] [CrossRef]
  5. Pan, Y.; Birdsey, R.A.; Fang, J.; Houghton, R.; Kauppi, P.E.; Kurz, W.A.; Phillips, O.L.; Shvidenko, A.; Lewis, S.L.; Canadell, J.G.; et al. A large and persistent carbon sink in the world’s forests. Science 2011, 333, 988–993. [Google Scholar] [CrossRef] [Green Version]
  6. Federici, S.; Tubiello, F.N.; Salvatore, M.; Jacobs, H.; Schmidhuber, J. New estimates of CO2 forest emissions and removals: 1990–2015. For. Ecol. Manag. 2015, 352, 89–98. [Google Scholar] [CrossRef] [Green Version]
  7. Houghton, R.A. Aboveground forest biomass and the global carbon balance. Glob. Change Biol. 2005, 11, 945–958. [Google Scholar] [CrossRef]
  8. Le Quéré, C.; Andrew, R.M.; Friedlingstein, P.; Sitch, S.; Hauck, J.; Pongratz, J.; Pickers, P.A.; Korsbakken, J.I.; Peters, G.P.; Canadell, J.G.; et al. Global carbon budget 2018. Earth Syst. Sci. Data 2018, 10, 2141–2194. [Google Scholar] [CrossRef] [Green Version]
  9. Calfapietra, C.; Peñuelas, J.; Niinemets, Ü. Urban plant physiology: Adaptation-mitigation strategies under permanent stress. Trends Plant Sci. 2015, 20, 72–75. [Google Scholar] [CrossRef]
  10. Reyer, C.; Guericke, M.; Ibisch, P.L. Climate change mitigation via afforestation, reforestation and deforestation avoidance: And what about adaptation to environmental change? New For. 2009, 38, 15–34. [Google Scholar] [CrossRef]
  11. Vadell, E.; de-Miguel, S.; Pemán, J. Large-scale reforestation and afforestation policy in Spain: A historical review of its underlying ecological, socioeconomic and political dynamics. Land Use Policy 2016, 55, 37–48. [Google Scholar] [CrossRef]
  12. Henders, S.; Persson, U.M.; Kastner, T. Trading forests: Land-use change and carbon emissions embodied in production and exports of forest-risk commodities. Environ. Res. Lett. 2015, 10, 125012. [Google Scholar] [CrossRef]
  13. MAPA. Forestación de Tierras Agrícolas: Análisis de su Evolución y Contribución a la Fijación del Carbono y al Uso Racional de la Tierra; Ministerio de Agricultura, Pescay Alimentación: Madrid, Spain, 2006; p. 374. [Google Scholar]
  14. Navarro Cerrillo, R.M.; Peman García, J.; del Campo García, A.; Moreno Sánchez, J.; Lara Gómez, M.A.; Díaz Hernández, J.L.; Pousa Salvador, F.; Piñon Castillo, F. Manual de Especies para la Forestación de Tierras Agrarias de Andalucía; Consejería de Agriculturay Pesca: Sevilla, Spain, 2009; p. 395. [Google Scholar]
  15. Jiménez, M.N.; Navarro, F.B. Programa de Forestación de Tierras Agrarias en Andalucía: Legislación y Situación Actual. Granada; Consejería de Agricultura, Pesca y Desarrollo Rural: Sevilla, Spain, 2014. [Google Scholar]
  16. Muñoz-Rojas, M.; De la Rosa, D.; Zavala, L.M.; Jordán, A.; Anaya-Romero, M. Changes in land cover and vegetation carbon stocks in Andalusia, Southern Spain (1956–2007). Sci. Total Environ. 2011, 409, 2796–2806. [Google Scholar] [CrossRef]
  17. Laganiere, J.; Angers, D.A.; Pare, D. Carbon accumulation in agricultural soils after afforestation: A meta-analysis. Glob. Chang. Biol. 2010, 16, 439–453. [Google Scholar] [CrossRef]
  18. Fernández-Ondoño, E.; Serrano, L.R.; Jiménez, M.N.; Navarro, F.B.; Díez, M.; Martín, F.; Fernández, J.; Martínez, F.J.; Roca, A.; Aguilar, J. Afforestation improves soil fertility in south-eastern Spain. Eur. J. For. Res. 2010, 129, 707–717. [Google Scholar] [CrossRef]
  19. Muñoz-Rojas, M.; Jordán, A.; Zavala, L.M.; De la Rosa, D.; Abd-Elmabod, S.K.; Anaya-Romero, M. Impact of land use and land cover changes on organic carbon stocks in Mediterranean soils (1956–2007). Land Degrad. Dev. 2015, 26, 168–179. [Google Scholar] [CrossRef]
  20. Lasanta, T.; Nadal-Romero, E.; Arnáez, J. Managing abandoned farmland to control the impact of re-vegetation on the environment. The state of the art in Europe. Environ. Sci. Policy 2015, 52, 99–109. [Google Scholar] [CrossRef] [Green Version]
  21. Nadal-Romero, E.; Cammeraat, E.; Pérez-Cardiel, E.; Lasanta, T. Effects of secondary succession and afforestation practices on soil properties after cropland abandonment in humid Mediterranean mountain areas. Agric. Ecosyst. Environ. 2016, 228, 91–100. [Google Scholar] [CrossRef] [Green Version]
  22. Novara, A.; Gristina, L.; Sala, G.; Galati, A.; Crescimanno, M.; Cerdà, A.; Badalamenti, E.; La Mantia, T. Agricultural land abandonment in Mediterranean environment provides ecosystem services via soil carbon sequestration. Sci. Total Environ. 2017, 576, 420–429. [Google Scholar] [CrossRef] [Green Version]
  23. Lara-Gómez, M.A.; Navarro-Cerrillo, R.M.; Ceacero, C.J.; Ruiz-Goméz, F.J.; Díaz-Hernández, J.L.; Palacios Rodriguez, G. Use of Aerial Laser Scanning to Assess the Effect on C Sequestration of Oak (Quercus ilex L. subsp. ballota [Desf.] Samp-Q. suber L.) Afforestation on Agricultural Land. Geosciences 2020, 10, 41. [Google Scholar] [CrossRef] [Green Version]
  24. Köhl, M.; Ehrhart, H.P.; Knauf, M.; Neupane, P.R. A viable indicator approach for assessing sustainable forest management in terms of carbon emissions and removals. Ecol. Indic. 2020, 111, 106057. [Google Scholar] [CrossRef]
  25. Henry, M.; Picard, N.; Trotta, C.; Manlay, R.; Valentini, R.; Bernoux, M.; Saint-André, L. Estimating tree biomass of sub-Saharan African forests: A review of available allometric equations. Silva Fenn. 2011, 45, 477–569. [Google Scholar] [CrossRef] [Green Version]
  26. De Miguel, Á.; Kallache, M.; García-Calvo, E. The water footprint of agriculture in Duero River Basin. Sustainability 2015, 7, 6759–6780. [Google Scholar] [CrossRef]
  27. Ruiz-Peinado, R.; González, G.M.; Del Rio, M. Biomass models to estimate carbon stocks for hardwood tree species. For. Syst. 2012, 21, 42–52. [Google Scholar] [CrossRef]
  28. Henry, M.; Bombelli, A.; Trotta, C.; Alessandrini, A.; Birigazzi, L.; Sola, G.; Vieilledent, G.; Santenoise, P.; Longuetaud, F.; Valentini, R.; et al. GlobAllomeTree: International platform for tree allometric equations to support volume, biomass and carbon assessment. For. Biogeosci. For. 2013, 6, 326. [Google Scholar] [CrossRef] [Green Version]
  29. Rodríguez-Veiga, P.; Wheeler, J.; Louis, V.; Tansey, K.; Balzter, H. Quantifying forest biomass carbon stocks from space. Curr. For. Rep. 2017, 3, 1–8. [Google Scholar] [CrossRef] [Green Version]
  30. Knapp, N.; Fischer, R.; Huth, A. Linking lidar and forest modeling to assess biomass estimation across scales and disturbance states. Remote Sens. Environ. 2018, 205, 199–209. [Google Scholar] [CrossRef]
  31. Navarro-Cerrillo, R.M.; González-Ferreiro, E.; García-Gutiérrez, J.; Ruiz, C.J.; Hernández-Clemente, R. Impact of plot size and model selection on forest biomass estimation using airborne LiDAR: A case study of pine plantations in southern Spain. J. For. Sci. 2017, 63, 88–97. [Google Scholar] [CrossRef]
  32. Navarro-Cerrillo, R.M.; Duque-Lazo, J.; Rodríguez-Vallejo, C.; Varo-Martínez, M.; Palacios-Rodríguez, G. Airborne laser scanning cartography of on-site carbon stocks as a basis for the silviculture of Pinus halepensis plantations. Remote Sens. 2018, 10, 1660. [Google Scholar] [CrossRef] [Green Version]
  33. Navarrete-Poyatos, M.A.; Navarro-Cerrillo, R.M.; Lara-Gómez, M.A.; Duque-Lazo, J.; Varo, M.D.; Palacios Rodriguez, G. Assessment of the Carbon Stock in Pine Plantations in Southern Spain through ALS Data and K-Nearest Neighbor Algorithm Based Models. Geosciences 2019, 9, 442. [Google Scholar] [CrossRef] [Green Version]
  34. IGME. Mapa Geológico de España, E. 1:50,000. Hoja nº 1061 (Cádiz); Instituto Geológico y Minero de España: Madrid, Spain, 1977. [Google Scholar]
  35. FAO. World Reference Base for Soil Resources; Food and Agriculture Organization of the United Nations: Roma, Italy, 2014. [Google Scholar]
  36. Shi, L.; Liu, S. Methods of estimating forest biomass: A review. Biomass Vol. Estim. Valoriz. Energy 2017, 10, 65733. [Google Scholar] [CrossRef] [Green Version]
  37. Parresol, B.R. Additivity of nonlinear biomass equations. Can. J. For. Res. 2001, 31, 865–878. [Google Scholar] [CrossRef]
  38. Hirigoyen, A.; Resquin, F.; Navarro-Cerrillo, R.; Franco, J.; Rachid-Casnati, C. Stand biomass estimation methods for Eucalyptus grandis and Eucalyptus dunnii in Uruguay. BOSQUE 2021, 42, 53–66. [Google Scholar] [CrossRef]
  39. Chiti, T.; Papale, D.; Smith, P.; Dalmonech, D.; Matteucci, G.; Yeluripati, J.; Rodeghiero, M.; Valentini, R. Predicting changes in soil organic carbon in mediterranean and alpine forests during the Kyoto Protocol commitment periods using the CENTURY model. Soil Use Manag. 2010, 26, 475–484. [Google Scholar] [CrossRef]
  40. Post, W.M.; Kwon, K.C. Soil carbon sequestration and land-use change: Processes and potential. Glob. Change Biol. 2000, 6, 317–327. [Google Scholar] [CrossRef] [Green Version]
  41. Mann, L.K. Changes in soil carbon storage after cultivation. Soil Sci. 1986, 142, 279–288. [Google Scholar] [CrossRef]
  42. Sims, J.R.; Haby, V.A. Simplified colorimetric determination of soil organic matter. Soil Sci. 1971, 112, 137–141. [Google Scholar] [CrossRef]
  43. Abebe, G.; Tsunekawa, A.; Haregeweyn, N.; Takeshi, T.; Wondie, M.; Adgo, E.; Masunaga, T.; Tsubo, M.; Ebabu, K.; Berihun, M.L.; et al. Effects of land use and topographic position on soil organic carbon and total nitrogen stocks in different agro-ecosystems of the upper blue Nile Basin. Sustainability 2020, 12, 2425. [Google Scholar] [CrossRef] [Green Version]
  44. Balenović, I.; Seletković, A.; Pernar, R.; Jazbec, A. Estimation of the mean tree height of forest stands by photogrammetric measurement using digital aerial images of high spatial resolution. Ann. For. Res. 2015, 58, 125–143. [Google Scholar] [CrossRef] [Green Version]
  45. Van Rees, E. Rapidlasso: Efficient tools for LiDAR processing. GeoInformatics 2013, 16, 14. [Google Scholar]
  46. Sullivan, A.A.; McGaughey, R.J.; Andersen, H.E.; Schiess, P. Object-oriented classification of forest structure from light detection and ranging data for stand mapping. West. J. Appl. For. 2009, 24, 198–204. [Google Scholar] [CrossRef] [Green Version]
  47. Team, R.C. R: A Language and Environment for Statistical Computing; R Foundation for Statistical Computing: Vienna, Austria, 2018. [Google Scholar]
  48. Mielcarek, M.; Stereńczak, K.; Khosravipour, A. Testing and evaluating different LiDAR-derived canopy height model generation methods for tree height estimation. Int. J. Appl. Earth Obs. Geoinf. 2018, 71, 132–143. [Google Scholar] [CrossRef]
  49. Shavelle, R.M.; Mackenzie, R.; Paculdo, D.R. SAS/STAT Software: Changes and enhancements through release 9.1 SAS/STAT Software: Changes and enhancements through release 9.1, 1989. Int. J. Hematol. 2012, 95, 248–256. [Google Scholar] [CrossRef] [PubMed]
  50. White, K.J. The Durbin-Watson test for autocorrelation in nonlinear models. Rev. Econ. Stat. 1992, 370–373. [Google Scholar] [CrossRef]
  51. Burdett, A.N.; Simpson, D.G.; Thompson, C.F. Root development and plantation establishment success. Plant Soil 1983, 71, 103–110. [Google Scholar] [CrossRef]
  52. Pemán, J.; Voltas, J.; Gil-Pelegrin, E. Morphological and functional variability in the root system of Quercus ilex L. subject to confinement: Consequences for afforestation. Ann. For. Sci. 2006, 63, 425–430. [Google Scholar] [CrossRef] [Green Version]
  53. Poorter, H.; Niklas, K.J.; Reich, P.B.; Oleksyn, J.; Poot, P.; Mommer, L. Biomass allocation to leaves, stems and roots: Meta-analyses of interspecific variation and environmental control. New Phytol. 2012, 193, 30–50. [Google Scholar] [CrossRef]
  54. Wang, Q.; Wang, S.; Zhang, J. Assessing the effects of vegetation types on carbon storage fifteen years after reforestation on a Chinese fir site. For. Ecol. Manag. 2009, 258, 1437–1441. [Google Scholar] [CrossRef]
  55. Howlett, D.S.; Moreno, G.; Losada, M.R.; Nair, P.R.; Nair, V.D. Soil carbon storage as influenced by tree cover in the Dehesa cork oak silvopasture of central-western Spain. J. Environ. Monit. 2011, 13, 1897–1904. [Google Scholar] [CrossRef] [Green Version]
  56. Getino, A.P.; Ruiz-Peinado, R.; González, G.M.; Palomares, O.S. Estimación del CO2 fijado en suelos y árboles de los rebollares de “Quercus pyrenaica” en la provincia de Ourense. Cuad. Soc. Española Cienc. For. 2008, 25, 179–184. [Google Scholar]
  57. Turrión, M.B.; Schneider, K.; Gallardo, J.F. Carbon accumulation in Umbrisols under Quercus pyrenaica forests: Effects of bedrock and annual precipitation. Catena 2009, 79, 1–8. [Google Scholar] [CrossRef]
  58. Wiesmeier, M.; Urbanski, L.; Hobley, E.; Lang, B.; von Lützow, M.; Marin-Spiotta, E.; van Wesemael, B.; Rabot, E.; Ließ, M.; Garcia-Franco, N.; et al. Soil organic carbon storage as a key function of soils-A review of drivers and indicators at various scales. Geoderma 2019, 333, 149–162. [Google Scholar] [CrossRef]
  59. Batlle, I.; Tous, J. Carob Tree. Ceratonia Siliqua L.; International Plant Genetic Resources Institute: Rome, Italy, 1997. [Google Scholar]
  60. Zhen, Z.; Quackenbush, L.J.; Zhang, L. Trends in automatic individual tree crown detection and delineation—Evolution of LiDAR data. Remote Sens. 2016, 8, 333. [Google Scholar] [CrossRef] [Green Version]
  61. Guerra-Hernández, J.; Tomé, M.; González-Ferreiro, E. Using low density LiDAR data to map Mediterranean forest characteristics by means of an area-based approach and height threshold analysis. Rev. De Teledetección 2016, 103–117. [Google Scholar] [CrossRef] [Green Version]
  62. Castaño-Díaz, M.; Álvarez-Álvarez, P.; Tobin, B.; Nieuwenhuis, M.; Afif-Khouri, E.; Cámara-Obregón, A. Evaluation of the use of low-density LiDAR data to estimate structural attributes and biomass yield in a short-rotation willow coppice: An example in a field trial. Ann. For. Sci. 2017, 74, 1–6. [Google Scholar] [CrossRef] [Green Version]
  63. Surový, P.; Almeida Ribeiro, N.; Panagiotidis, D. Estimation of positions and heights from UAV-sensed imagery in tree plantations in agrosilvopastoral systems. Int. J. Remote Sens. 2018, 39, 4786–4800. [Google Scholar] [CrossRef]
  64. Ganz, S.; Käber, Y.; Adler, P. Measuring tree height with remote sensing—A comparison of photogrammetric and LiDAR data with different field measurements. Forests 2019, 10, 694. [Google Scholar] [CrossRef] [Green Version]
  65. Tojal, L.T.; Bastarrika, A.; Barrett, B.; Sanchez Espeso, J.M.; Lopez-Guede, J.M.; Graña, M. Prediction of Aboveground Biomass from Low-Density LiDAR Data: Validation over P. radiata Data from a Region North of Spain. Forests 2019, 10, 819. [Google Scholar] [CrossRef] [Green Version]
  66. Böttcher, H.; Lindner, M. Managing forest plantations for carbon sequestration today and in the future. In Ecosystem Goods and Services from Plantation Forests; Routledge: Oxfordshire, UK, 2010; pp. 59–92. [Google Scholar]
  67. Kizildağ, N.; Darici, C.; Sağliker, H.A. Influence of different parent materials on litter decomposition in the East Mediterranean region. Pak. J. Bot. 2014, 46, 875–879. [Google Scholar]
  68. Poeplau, C.; Don, A. Sensitivity of soil organic carbon stocks and fractions to different land-use changes across Europe. Geoderma 2013, 192, 189–201. [Google Scholar] [CrossRef]
  69. Del Río, M.; Barbeito, I.; Bravo-Oviedo, A.; Calama, R.; Cañellas, I.; Herrero, C.; Bravo, F. Carbon sequestration in Mediterranean pine forests. In Managing Forest Ecosystems: The Challenge of Climate Change; Springer: Dordrecht, Switzerland, 2008; pp. 221–245. [Google Scholar] [CrossRef]
  70. Burrascano, S.; Chytrý, M.; Kuemmerle, T.; Giarrizzo, E.; Luyssaert, S.; Sabatini, F.M.; Blasi, C. Current European policies are unlikely to jointly foster carbon sequestration and protect biodiversity. Biol. Conserv. 2016, 201, 370–376. [Google Scholar] [CrossRef]
Figure 1. Flowchart laying out the methodological steps of C stock estimation in a Ceratonia siliqua plantation in southeastern Andalusia, applying field and aerial laser scanning (ALS) data.
Forests 13 00285 g001
Figure 2. Cartography of individual tree height (m) in the Ceratonia siliquaQuercus ilex plantation at Puerto Real (Cádiz, Southwestern Spain).
Forests 13 00285 g002
Table 1. Silvicultural characteristics, biomass (kg tree1), and soil organic carbon stocks (Mg ha−1) of Ceratonia siliqua plantation established under the EU afforestation scheme in Andalusia (Puerto Real, Cádiz, southern Spain). Variables and abbreviations: stem density (D, trees ha1); height (H, m); diameter at breast height (dbh, cm); basal area (G, m2 ha−1), biomass C stock (Wt, Mg C ha−1), and soil organic carbon stock (SOCdepth –S, Mg C ha−1). Values are means ± SE.
Silvicultural description
Surface28.5
Age (years)26
D (trees ha−1)293
H (m)4.29 (0.15)
Dbh (cm)12.83 (0.82)
G (m2 ha−1)7.39 (0.61)
Biomass (kg tree−1)
Foliate5.35 (0.27)
Branches14.53 (1.07)
Stems9.52 (1.06)
Roots17.06 (1.45)
Biomass stock (Wt)46.48 (3.75)
Soil organic carbon (Mg ha−1)
SOC20-S under tree crown58.91 (7.85)
SOC20-S on non-covered areas37.72 (3.42)
SOC20-S on agricultural reference soil23.16 (2.03)
Table 2. Allometric equations for tree biomass estimation (g) for Ceratonia siliqua L. plantation in Andalusia using nonlinear seemingly unrelated regressions (NSUR) (southern Spain), independent variables (Ht = total height, m; D = dbh, cm), the adjusted coefficient of determination (R2adj), root mean square error (RMSE, g), and p-value.
FractionModelRMSER2adjp-Value
Foliage W f = e ( 5.2047 + 0.9515 l n D + 1.4302 l n H 2224.710.708<0.001
Branches W b = 271.3179   e ( 0.0848 D H ) 13.230.517<0.001
Stems W s = e ( 0.0600 D H ) 3365.970.611<0.001
Roots W r = 2148.622 e 0.0423 D H 9694.120.609<0.001
Overall W i 25.990.658<0.001
Table 3. Allometric equations were used to estimate the dbh (cm) and SOC content (kg m−2) (SOC20, 0–20 cm) for the Ceratonia siliqua plantation (southern Spain). Independent variable (HL = ALS derived height, m), adjusted determination coefficient (R2adj), p-value, F, Durbin–Watson test for residuals autocorrelation (DW).
VariableModelAdjusted R2Fp-Valuep-DW
dbhdbh = −2.0788 + 3.6730 HL 0.64947.27<0.0011475
SOC20SOC20 = 1.1458 + HL2.56390.813109.7<0.0012.19
Table 4. Silvicultural characteristics, biomass, and soil organic carbon stocks (Mg ha−1) of Ceratonia siliqua plantation derived from low-density ALS in Andalusia (Puerto Real, Cádiz, southern Spain). Overall biomass (Wt, Mg C ha−1) and soil organic carbon stock (0–20 cm layer, SOC20-S, Mg C ha−1) in the forest plantation (98 ha). Proportional distribution of SOC values in line and interline tree plantation.
Height (m)Dbh (cm)Biomass C Stock (Mg ha−1)SOC20-S (Mg ha−1) under Crown (17.91%)SOC Stock in Inter-Plantation (Mg ha−1) (82.09%)SOC Stock in Plantation (Mg ha−1) Total C Stock in Forest Plantation (Mg)
3.8111.924.3010.5530.9641.511305.70
Publisher’s Note: MDPI stays neutral with regard to jurisdictional claims in published maps and institutional affiliations.

