1. Introduction
Faced with a series of issues such as climate change, frequent increases in extreme weather, and industrial structural innovation, China has made a serious commitment to “strive to peak carbon dioxide emissions by 2030 and strive to achieve carbon neutrality by 2060”. Under the demand of mitigating climate change, carbon sinks have an important ecosystem regulation function [
1,
2,
3]. Among them, the main ways to increase sinks are bioenergy with carbon capture and storage (BECCS) and increasing the carbon sink capacity of terrestrial vegetation [
4]. The former method has higher costs for technological innovation, investment, and maintenance, and its universality and economy have yet to be considered. Nature-based policies are one of the most cost-effective ways to increase carbon sinks and simultaneously have large social and economic benefits [
5]. Among all terrestrial vegetation types, forests are the most important carbon pools in terrestrial ecosystems, accounting for 70%–80% of the global amount of carbon storage [
6,
7]; additionally, forests have the best long-term effects. Therefore, an increase in the forest carbon sink will play a vital role in the process of carbon neutrality.
State-owned forest regions (SOFRs) are experiencing conflicts between ecological and economic benefits in the process of reform, and they are undertaking the major goal of achieving “carbon neutrality” [
8]. Therefore, it is necessary to measure the cost-effectiveness of forest management investment (FMI) in various forest regions and identify areas with high efficiency in forest management. Forest management measures mainly increase the carbon storage of forests by improving the forest growth environment, increasing the forest area, and improving the forest stand quality. SOFRs are large in scale, relatively standardized in their management, and have a high FMI, such as forest tending. The main task of SOFRs is to increase forest resources, improve forest quality, give full play to the production potential of SOFRs, and improve the ecological, social, and economic benefits of various forest regions. However, the improvement of forest quality is not only related to forest management measures, but is also affected by regional forest stand quality, natural climate conditions, and forest region size [
9,
10]. In particular, forest management has scale effects, and large-scale management results are better [
11]. Moreover, because forest tending and afforestation measures do not obtain immediate results, there may be a lag effect. Therefore, the effect of FMI on forest quality improvement is uncertain in time and space, and there may be differences in the level of investment efficiency among forest regions. Therefore, identifying high-efficiency investment areas can help alleviate the conflict between the ecological and economic benefits of SOFRs, and is of great significance for policymakers who wish to improve the efficiency of policy implementation [
12].
Research on the ecological efficiency of SOFRs mainly adopts the methods of data envelopment analysis (DEA) and slacks-based measure–data envelopment analysis (SBM–DEA) to evaluate the ecological efficiency of key state-owned forestry enterprises [
13,
14]. However, this research failed to link the FMI with the increase in the carbon sink amount and focused on the expected and undesired output of the overall input to the ecological environment. Most of the research on the measurement of the ecological effects of forest management has focused on measuring the impact of different forest management methods (natural forests, artificial forests) and forest tending measures on soil and tree diameter at breast height [
15,
16,
17]. Similarly, most studies from the perspective of increasing carbon sinks in forests have focused on small-scale investigations. The research is based on the results of forest resource surveys used to study the impact of single or several common tree species, such as selective cutting, thinning intensity, tending, and other forest management measures, on the forest stock and carbon cycle per unit area [
18,
19]. Alternatively, carbon storage can be calculated based on the biomass carbon storage conversion coefficient [
20,
21]. This type of research typically measures and describes the changes before and after the implementation of single or several tree species forest management measures in a small area, ignoring the influence of other interference factors, and it cannot accurately determine whether changes in carbon sinks are related to forest management measures. Furthermore, there is no correspondence between forest management measures and capital investment, and it is impossible to measure the efficiency of FMI and the difference in the investment efficiency of various forest regions.
In addition, studies have carried out annual calculations on the stock of different tree species to assess the quality of a forest stand. For example, the enhanced vegetation index (EVI) was used to establish a biomass allometric growth and inversion model to measure the changes in the biomass of the different forest species to estimate the changes in the carbon sink amount [
22,
23]. Furthermore, in the measurement of large-scale forest carbon sinks, some studies have comprehensively measured forest biomass based on land use types and combined with MODIS optical data. The study counted long-term carbon sequestration changes to quantify the carbon sequestration effects of forest management measures such as reforestation, thinning, and forest tending, as well as to assess the related socioeconomic carbon sequestration costs [
24,
25,
26]. Such studies have comprehensively considered the changes in forest quality and quantity, and there are few research results. Moreover, most studies on the macro scale use the InVEST model to correspond to the forest species coefficient, and use the change of land type to calculate the total amount of carbon sequestration in forest land [
27,
28]. However, the accuracy of this calculation method is low. Although the carbon density coefficient is considered, it is mostly empirical and averaged. It can only be used to measure changes in carbon sinks based on changes in land types. In addition, this method does not consider forest quality and its differences, so it is difficult to accurately measure the increase or decrease in the carbon sink amount in the region, and it is impossible to accurately measure the effect of how FMI might increase the carbon sink amount.
In view of this, this paper used panel data from 40 key state-owned forest farms in Heilongjiang Province from 2001 to 2019 to explore the increase in carbon sink efficiency and the differences in FMI in various forest regions under the control of natural meteorological factors. First, this paper combined geographic information system (GIS) and remote sensing (RS) technology based on RS data on vegetation net primary productivity (NPP) and accurately calculated the evolution of carbon sinks in the study area from 2001 to 2019. Second, we controlled for other variables that might affect the increase in forest carbon sinks, introduced the lag term of carbon sinks, used the individual fixed-effect model to determine the FMI lag period, and realized the measurement of the causal relationship between the two. Then, we used the panel threshold model to examine the differences in FMI efficiency under different carbon sink levels and identify forest regions with a higher investment efficiency. Finally, we verified that FMI followed the law of diminishing marginal returns in terms of increasing the carbon sink, and discussed how to rationally plan investment levels. This research aimed to promote the high-quality development of forest resources in SOFRs, increase the level of forest carbon sinks, and improve the utilization efficiency of FMI to achieve “carbon neutrality” as soon as possible.
2. Overview of Study Area, Data, and Methods
2.1. Study Area
Heilongjiang Province is the northernmost and easternmost provincial administrative region of China. It lies between 121°11′–135°05′ E and 43°26′–53°33′ N. The terrain is high in the northwest, north, and southeast and low in the northeast and southwest. It belongs to the cold temperate zone and has a temperate continental monsoon climate. Heilongjiang Province is located along the “Belt and Road” and borders Russia. It is the main body of the terrestrial ecosystem in Northeast Asia. The grassland comprehensive vegetation coverage in Heilongjiang Province is as high as 67.50%, and the forest coverage rate reaches 43.78%, of which key SOFRs account for approximately one-fifth of the province’s total area [
29]. There are 87 key SOFRs (forest industry enterprises) in northeast and Inner Mongolia, and Heilongjiang Province is in charge of 40. The 40 key state-owned forest divisions are the Yichun Forest Industry Group and Longjiang Forest Industry Group. The Yichun Forest Industry Group has jurisdiction over 17 key SOFRs, and the Longjiang Forest Industry Group has jurisdiction over 23 key SOFRs. There are 627 forest farms (stations) under the jurisdiction of the 40 key SOFRs, and the jurisdictions of four forestry bureaus cross the boundary of Heilongjiang Province [
30].
The state-owned forest farm in Heilongjiang Province promotes the development of the forestry economy while promoting the high-quality development of forests, and this approach has had large social and economic benefits. These methods include forest tree breeding and nursery, timber and bamboo harvesting and transportation, economic forest product planting and collection, flowers, wood processing, wood, bamboo, rattan, palm, and reed product manufacturing, forestry tourism and leisure services, and the forest economy. As of 2019, there were nearly 160,000 employees in the industry. In 2019, the total output value reached CNY 39.51412 billion, with a total investment of CNY 6.99164 billion, of which afforestation and forest tending investment reached CNY 2.15375 billion [
29]. The geographical location map of the 40 key SOFRs in Heilongjiang Province is shown in
Figure 1, where green represents forest land.
2.2. Index Selection
- (1)
Explained variable: As the largest terrestrial carbon pool, forests play a major role in the goal of achieving “carbon neutrality”. The management system of China’s state-owned forest farms is relatively complete, the FMI is relatively high, and the forest quality is relatively good. Previous studies mostly used NPP as the basis for calculating carbon sinks [
31,
32]. To measure the carbon sink level of 40 key SOFRs, this paper used vegetation NPP as the basis for calculation. The NPP of vegetation refers to the amount of organic matter accumulated by green plants per unit area and unit time, i.e., the remaining part after deducting autotrophic respiration (RA) from the gross primary productivity (GPP) fixed by plant photosynthesis. This indicator can measure forest quality to the greatest extent and can calculate the carbon sink amount based on basic data. The specific calculation method is explained in the next section.
- (2)
Explanatory variables: To measure the investment efficiency in forest tending and management and the investment in various major forestry projects, this paper selected the total FMI (invest) as the explanatory variable. This measure includes forest tending investment, forest management and protection investment, forestry fixed asset investment, afforestation and renewal investment, Natural Forest Protection Program (NFPP) investment, and forest quality improvement investment.
- (3)
Socioeconomic factors: Although the increase in the carbon sink amount requires a large amount of financial investment, it also creates many employment opportunities. Furthermore, as more become engaged in forest management, tending, and industrial development, it has a positive effect on increasing forest quality and increasing the carbon sink amount. Therefore, the paper incorporated the number of employees (workpop) into the model. In addition, personnel wages play a positive role in stimulating forest management measures such as management and maintenance, and it is necessary to consider the indicator of total wages (wage) [
33]. However, forest maintenance measures such as thinning have led to a large amount of timber output and income, which also promotes the development of downstream enterprises related to wood products. Forest maintenance will produce income from tourism, stimulate the economic development of forest regions, and generate income from the tertiary industry. Therefore, in the econometric model, the impact of SOFRs’ gross domestic product (gdp) on the carbon sink should be examined [
34]. In addition, there may be an inverted U-shaped relationship between the economic development level of the SOFRs and the ecological environment, following the path of the environmental Kuznets curve (EKC) [
35]. Therefore, we put gdp and gdp
2 into the model at the same time as control variables.
- (4)
Natural meteorological factors: The effect and efficiency of FMI are related to forest quality issues. The afforestation land, the growth of young and middle-aged trees, and the effect of forest tending are greatly affected by climatic factors [
36,
37]. Climatic factors such as precipitation and temperature have greater impacts on forest quality and productivity [
38,
39]. Additionally, temperature and soil moisture together affect the photosynthesis sensitivity of plants [
40,
41]. Therefore, when constructing the model, precipitation and temperature need to be used as control variables. Furthermore, because the overall precipitation in the SOFRs of Heilongjiang Province has little difference, the temperature difference between summer and winter is large. Therefore, we used the annual average precipitation and the July average temperature data.
2.3. Data Sources and Processing
- (1)
Carbon sink data: The carbon sink data were calculated based on the carbon content of vegetation NPP corresponding to vegetation dry matter. The NPP data in this study were derived from the MODIS satellite-based MOD17A3HGF product released by the National Aeronautics and Space Administration (NASA). The spatial resolution of the data is 500 meters, and the time resolution is annual. MRT software and ArcGIS 10.7 software were used to pre-process the data for splicing, cropping, and projection, and the raster calculator function was used to eliminate the NPP data outliers. Finally, the annual NPP sequence data of China from 2001 to 2019 were obtained, and the unit is gC/m2. After calculating these data, according to the green vegetation photosynthesis chemical formula (6CO2 + 6H2O→C6H12O6 + 6O2), for every 1 kg of dry matter produced by vegetation, 1.63 kg of CO2 can be fixed, and the carbon content in the dry matter accounts for approximately 45% of the total NPP. Therefore, the calculation formula for the fixed CO2 of vegetation is as follows: WCO2 = NPP/0.45 × 1.63, and the unit of WCO2 is g/m2. Based on this, the carbon sink data for China’s forests were calculated in grid form. Then, according to the base map of the 40 key SOFRs, ArcGIS 10.7 was used to extract the carbon sink of each forest region from 2001 to 2019, which was processed according to the unit area to obtain the carbon sink data used in the model.
- (2)
FMI and socioeconomic data: 1. Data on the FMI, total output value, number of employees, and total wages of each forest region were all sourced from the 2001–2019 China Forestry and Grassland Statistical Yearbook, which is compiled and obtained each year. 2. The administrative boundary data of Heilongjiang Province came from the basic geographic database (
http://www.webmap.cn, accessed on 16 July 2021); the vector maps of the 40 key SOFRs were based on the forest base map and drawn according to ArcGIS geographic registration.
- (3)
Natural data: 1. The basic precipitation data in each forest region came from multiyear station data on the website of the China Meteorological Administration (
http://data.cma.cn/, accessed on 20 August 2021). We selected a total of 40 sites in and near the SOFRs, and we used the ArcGIS 10.7 interpolation analysis function to perform spatial interpolation processing; additionally, kriging was used to interpolate based on the covariance function and to extract the area mean, and the pixel size after processing was 100 m. 2. The average temperature data for each forest region in July came from the Loess Plateau Science Data Center, National Earth System Science Data Sharing Infrastructure, National Science and Technology Infrastructure of China (
http://loess.geodata.cn, accessed on 25 August 2021). This dataset is based on the global 0.5° climate dataset released by the CRU (
https://crudata.uea.ac.uk/cru/data/hrg/, accessed on 13 July 2021) and the high-resolution climate dataset released by WorldClim (
http://www.worldclim.org/, accessed on 6 August 2021). The data were generated by downscaling in China through the Delta space downscaling scheme and had a spatial resolution of approximately 1 km [
42]. Then, ArcGIS 10.7 software was used to define the geographic coordinates of the NC data format, project them, and finally extract the annual average temperature in July in the study area. 3. Land use data: The land use data for Heilongjiang Province in 2020 (
Figure 1) (1 km × 1 km) came from the Resource and Environmental Science Data Center of the Chinese Academy of Sciences (
http://www.resdc.cn/, accessed on 28 July 2021). In this paper, referring to the land type classification standard of the Chinese Academy of Sciences, the study area’s land use/cover was reclassified into two categories: forest land and other land. The summary of each variable and the descriptive statistical analysis are shown in
Table 1.
2.4. Research Methods
2.4.1. Analysis of Spatial Distribution Directionality
Spatial distribution directional analysis refers to the outline and dominant direction of the observed variable in the spatial distribution [
43]. The standard deviation ellipse (SDE) is a spatial statistical method used to reveal the spatial distribution characteristics of elements [
44]. This method mainly measures the centre of gravity, major axis, minor axis, azimuth angle, and other parameters of the SDE of geographic elements to quantitatively describe the spatial distribution characteristics of the observed variables in the study area [
45]. The definition formula is as follows:
Center of gravity coordinates:
X-axis standard deviation:
Y-axis standard deviation:
In Formulas (1)–(4), () represents the weighted average centre of each observed variable; represents the spatial coordinates of the observed variable; represents the spatial weight; θ is the azimuth of the standard deviation ellipse, that is, the main trend direction of the data distribution; respectively represent the standard deviation of the ellipse′s x-axis and y-axis; and respectively represent the coordinate deviation of each observed variable to the weighted average centre.
2.4.2. Individual Fixed-Effects Model
The individual fixed-effects model refers to deterministic variables other than explanatory variables, whose effects vary only with the individual and not with time. Because the carbon sink value of the explained variable in the study was affected by the previous period, the lag term of the explained variable was added to the model explanatory variable. Then, the Hausman test found that the fixed-effects model was better than the random-effects model, so the individual fixed-effects model was used. This paper first built an individual fixed-effects model and judged the regression results of the model without considering the carbon sink as a threshold variable. The model was basically constructed as follows:
In Formula (5), represents the SOFR, and represents the year. represents the carbon sink of each SOFR; represents the amount of FMI; represents the gross domestic product of each SOFR; represents the square of the gross domestic product of each SOFR; represents the total wages; represents the number of employees in each SOFR; represents the carbon sink level after a period of lag; represents the annual precipitation; represents the average temperature in July; to are the parameters to be estimated in the model; is the individual effect; and is the random disturbance term. If the regression result of the model is unreasonable, the variable was adjusted for the lag period to determine a reasonable lag period.
2.4.3. Panel Threshold Model
The threshold effect means that when a certain parameter reaches a certain critical value (threshold value), it will cause another parameter to change in direction or quantity [
46]. The threshold regression model does not need to use cross-terms to determine the nonlinear relationship between FMI and carbon sinks in key SOFRs in Heilongjiang Province, and it was determined by its endogeneity. To determine the specific critical value of the threshold variable, this paper used the panel threshold model and then used the bootstrap method to estimate the significance of the threshold
. The basic model was set as follows:
In Formula (6), is the threshold value to be estimated; is the indicative function, and the value in parentheses is 1 or 0; to are the coefficients to be estimated in the model; and other variables indicate the same meaning as those for Formula (5).
2.4.4. Partially Linear Functional-Coefficient Panel Data Model
A partially linear functional-coefficient regression model allows for linearity in some regressors and nonlinearity in other regressors, where the effects of these covariates on the dependent variable vary according to a set of low-dimensional variables nonparametrically [
47], thereby showing distinct advantages in capturing nonlinearity and heterogeneity [
48]. The main purpose of this model is to avoid the incorrect specification of the function form caused by the linear assumption of the measurement model, and to verify that the effect of the FMI increasing the carbon sink value follows the law of diminishing marginal benefits. Therefore, we set the FMI as a variable with functional coefficients in the function setting, and we set it as variables that enter the functional coefficients that interact with variables in the order specified by the variables that had functional coefficients. The specific form of the model is as follows:
In Formula (7), represents the SOFR, and represents the year. is a scalar dependent variable; is a vector of continuous variables, that is, ; is the vector of covariates in the model; the coefficient is ; is a × 1 vector of covariates with a constant slope , which is also ; is the individual fixed effect that may be related to , and ; and represents the error term.
3. Results and Analysis
3.1. Spatiotemporal Evolution of Carbon Sink and SDE Analysis
3.1.1. Time Change Analysis of Carbon Sink
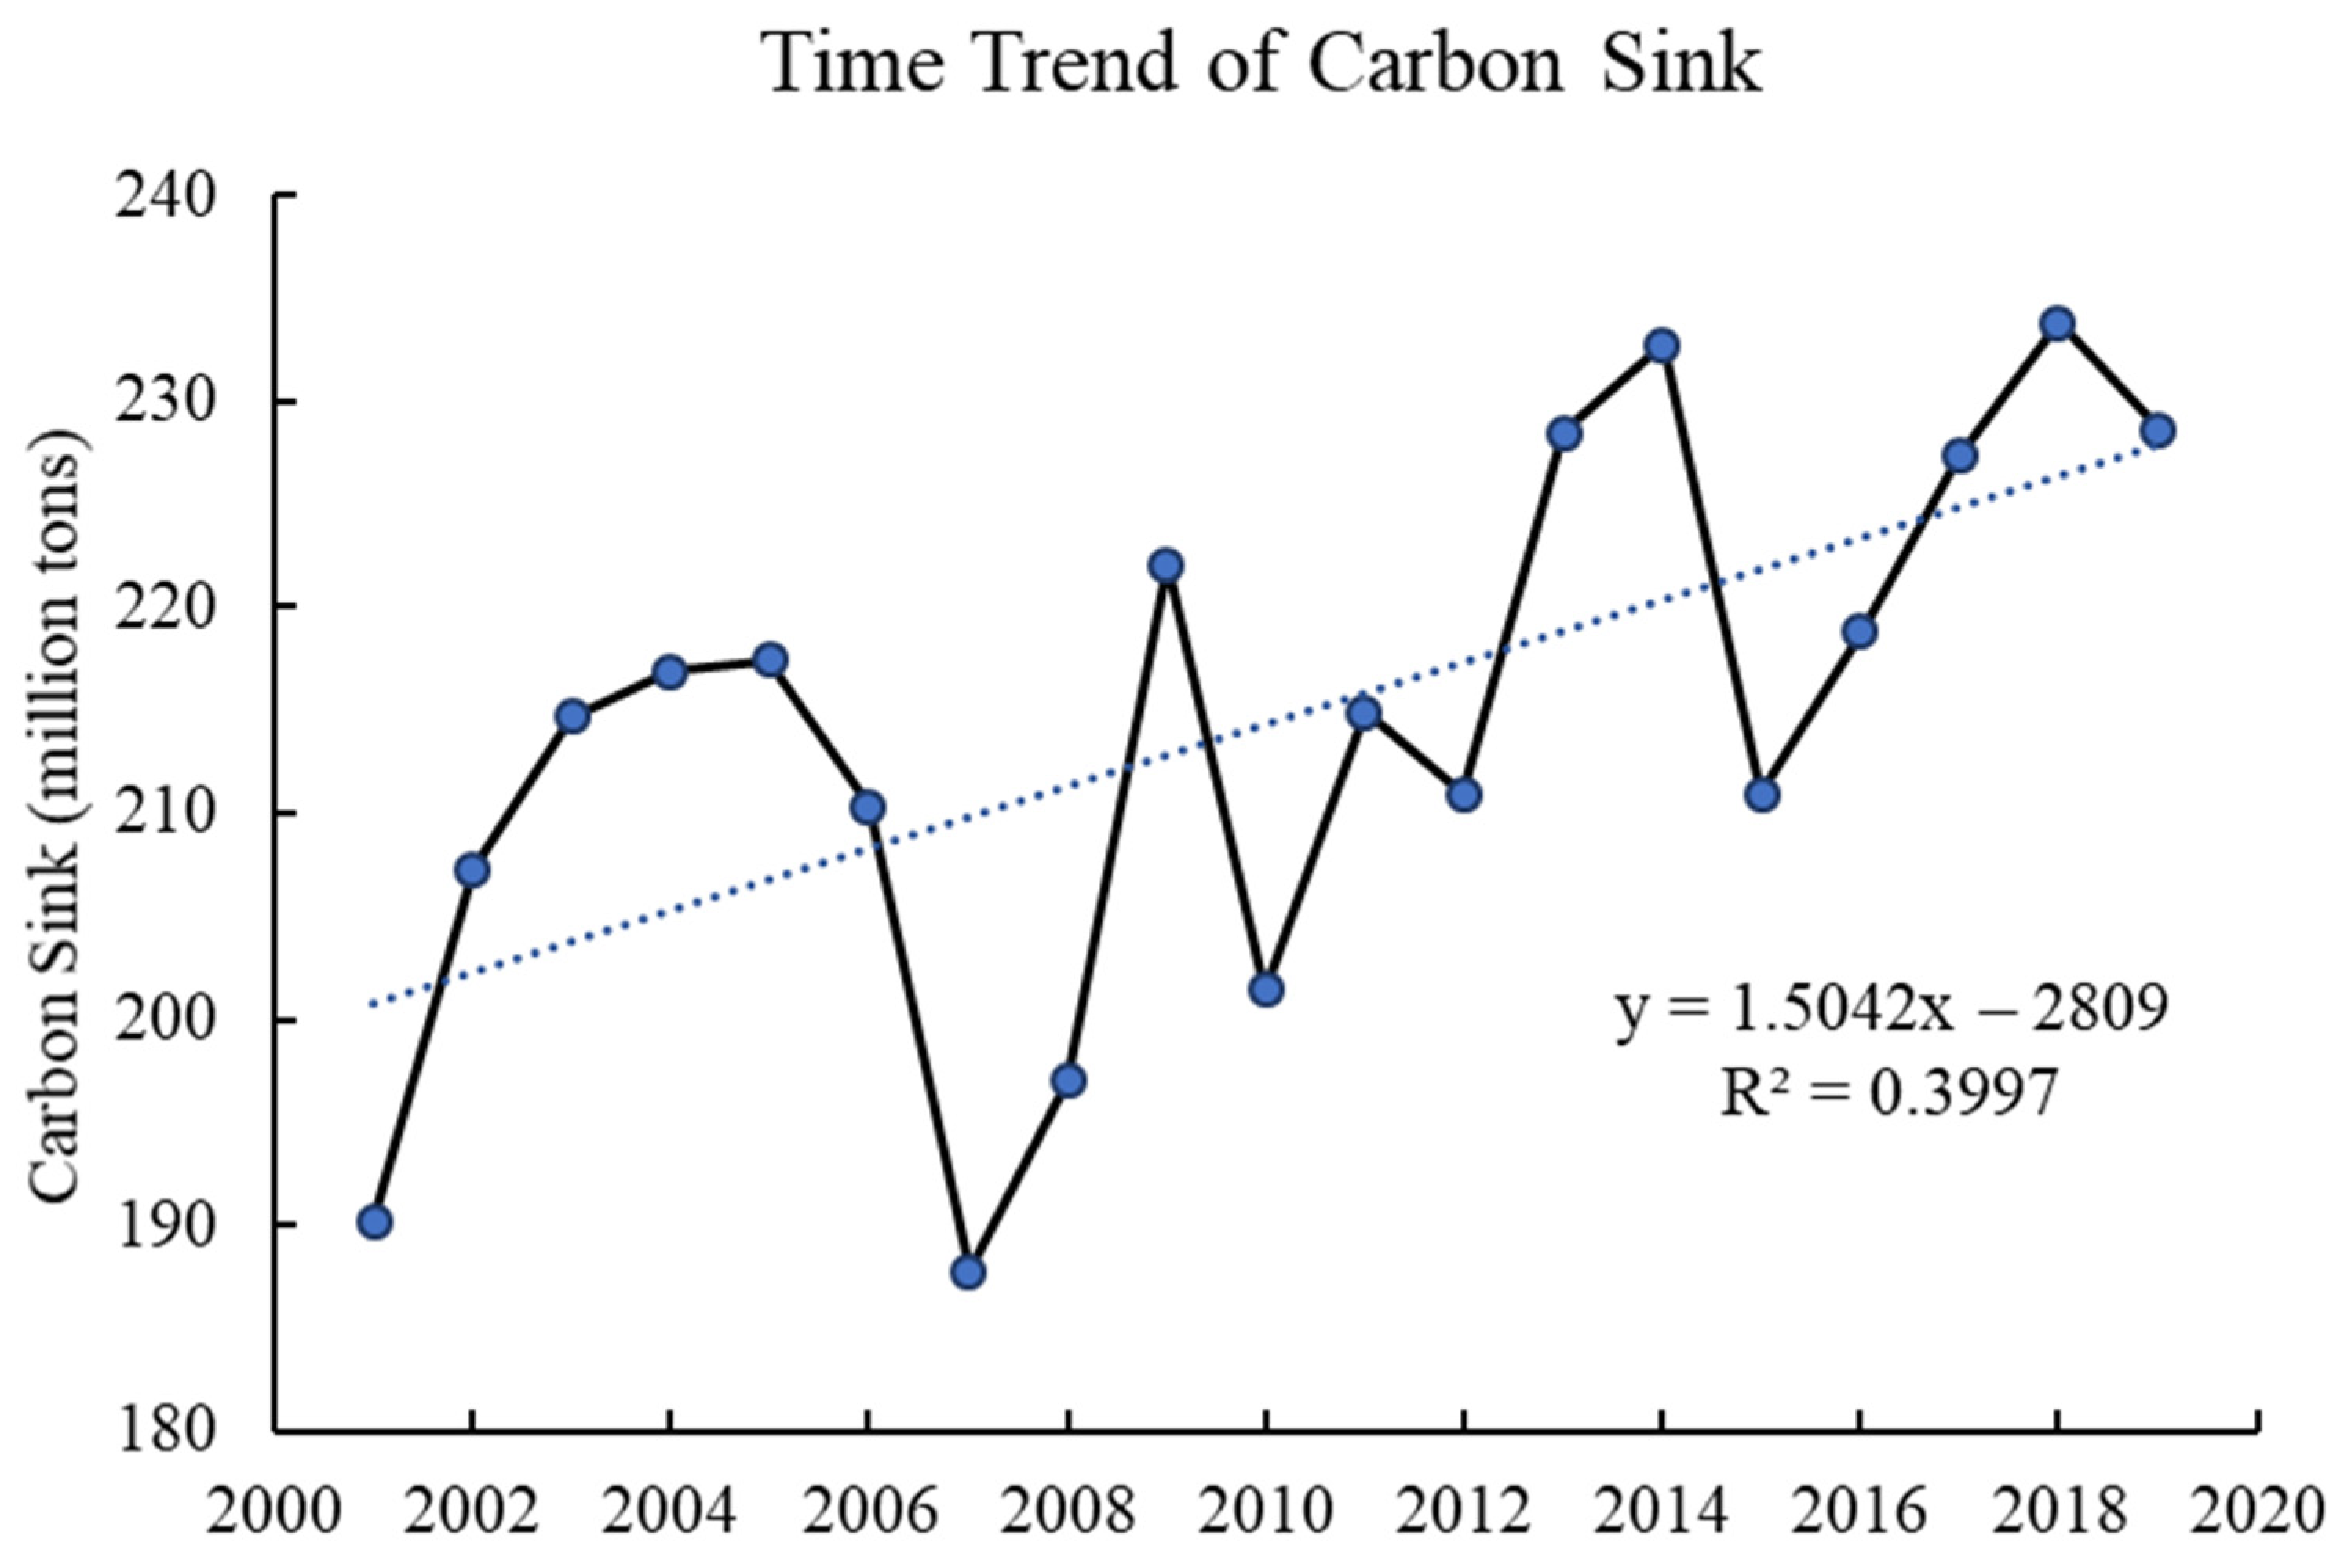
To investigate the time evolution trend of the carbon sink in the 40 key SOFRs in Heilongjiang Province during the study period, ArcGIS software was used to calculate the annual carbon sink value of each forest region and draw it as a line graph (
Figure 2).
From the perspective of time, the carbon sink of the SOFRs showed an upward trend from 2001 to 2019, with a total growth rate of approximately 20.17%, and the fitting formula for annual growth was y = 1.5042x − 2809. It reached the maximum value in 2018, approximately 233.78 million tons, but the overall fluctuation was relatively large. The reasons for the overall increase in the carbon sink are as follows. According to the data from the fifth to eighth forest resource surveys, Heilongjiang has a relatively large proportion of natural forests and a relatively small proportion of artificial forests. The carbon storage per unit area of planted forests is approximately twice that of natural forests. Since 2000, the implementation of the NFPP and the increase in the area of planted forests have increased the intensity of forest management and protection. Therefore, the carbon sink function of forest stands has been enhanced, and the overall trend is increasing.
3.1.2. Spatial Distribution of Carbon Sink and SDE Analysis
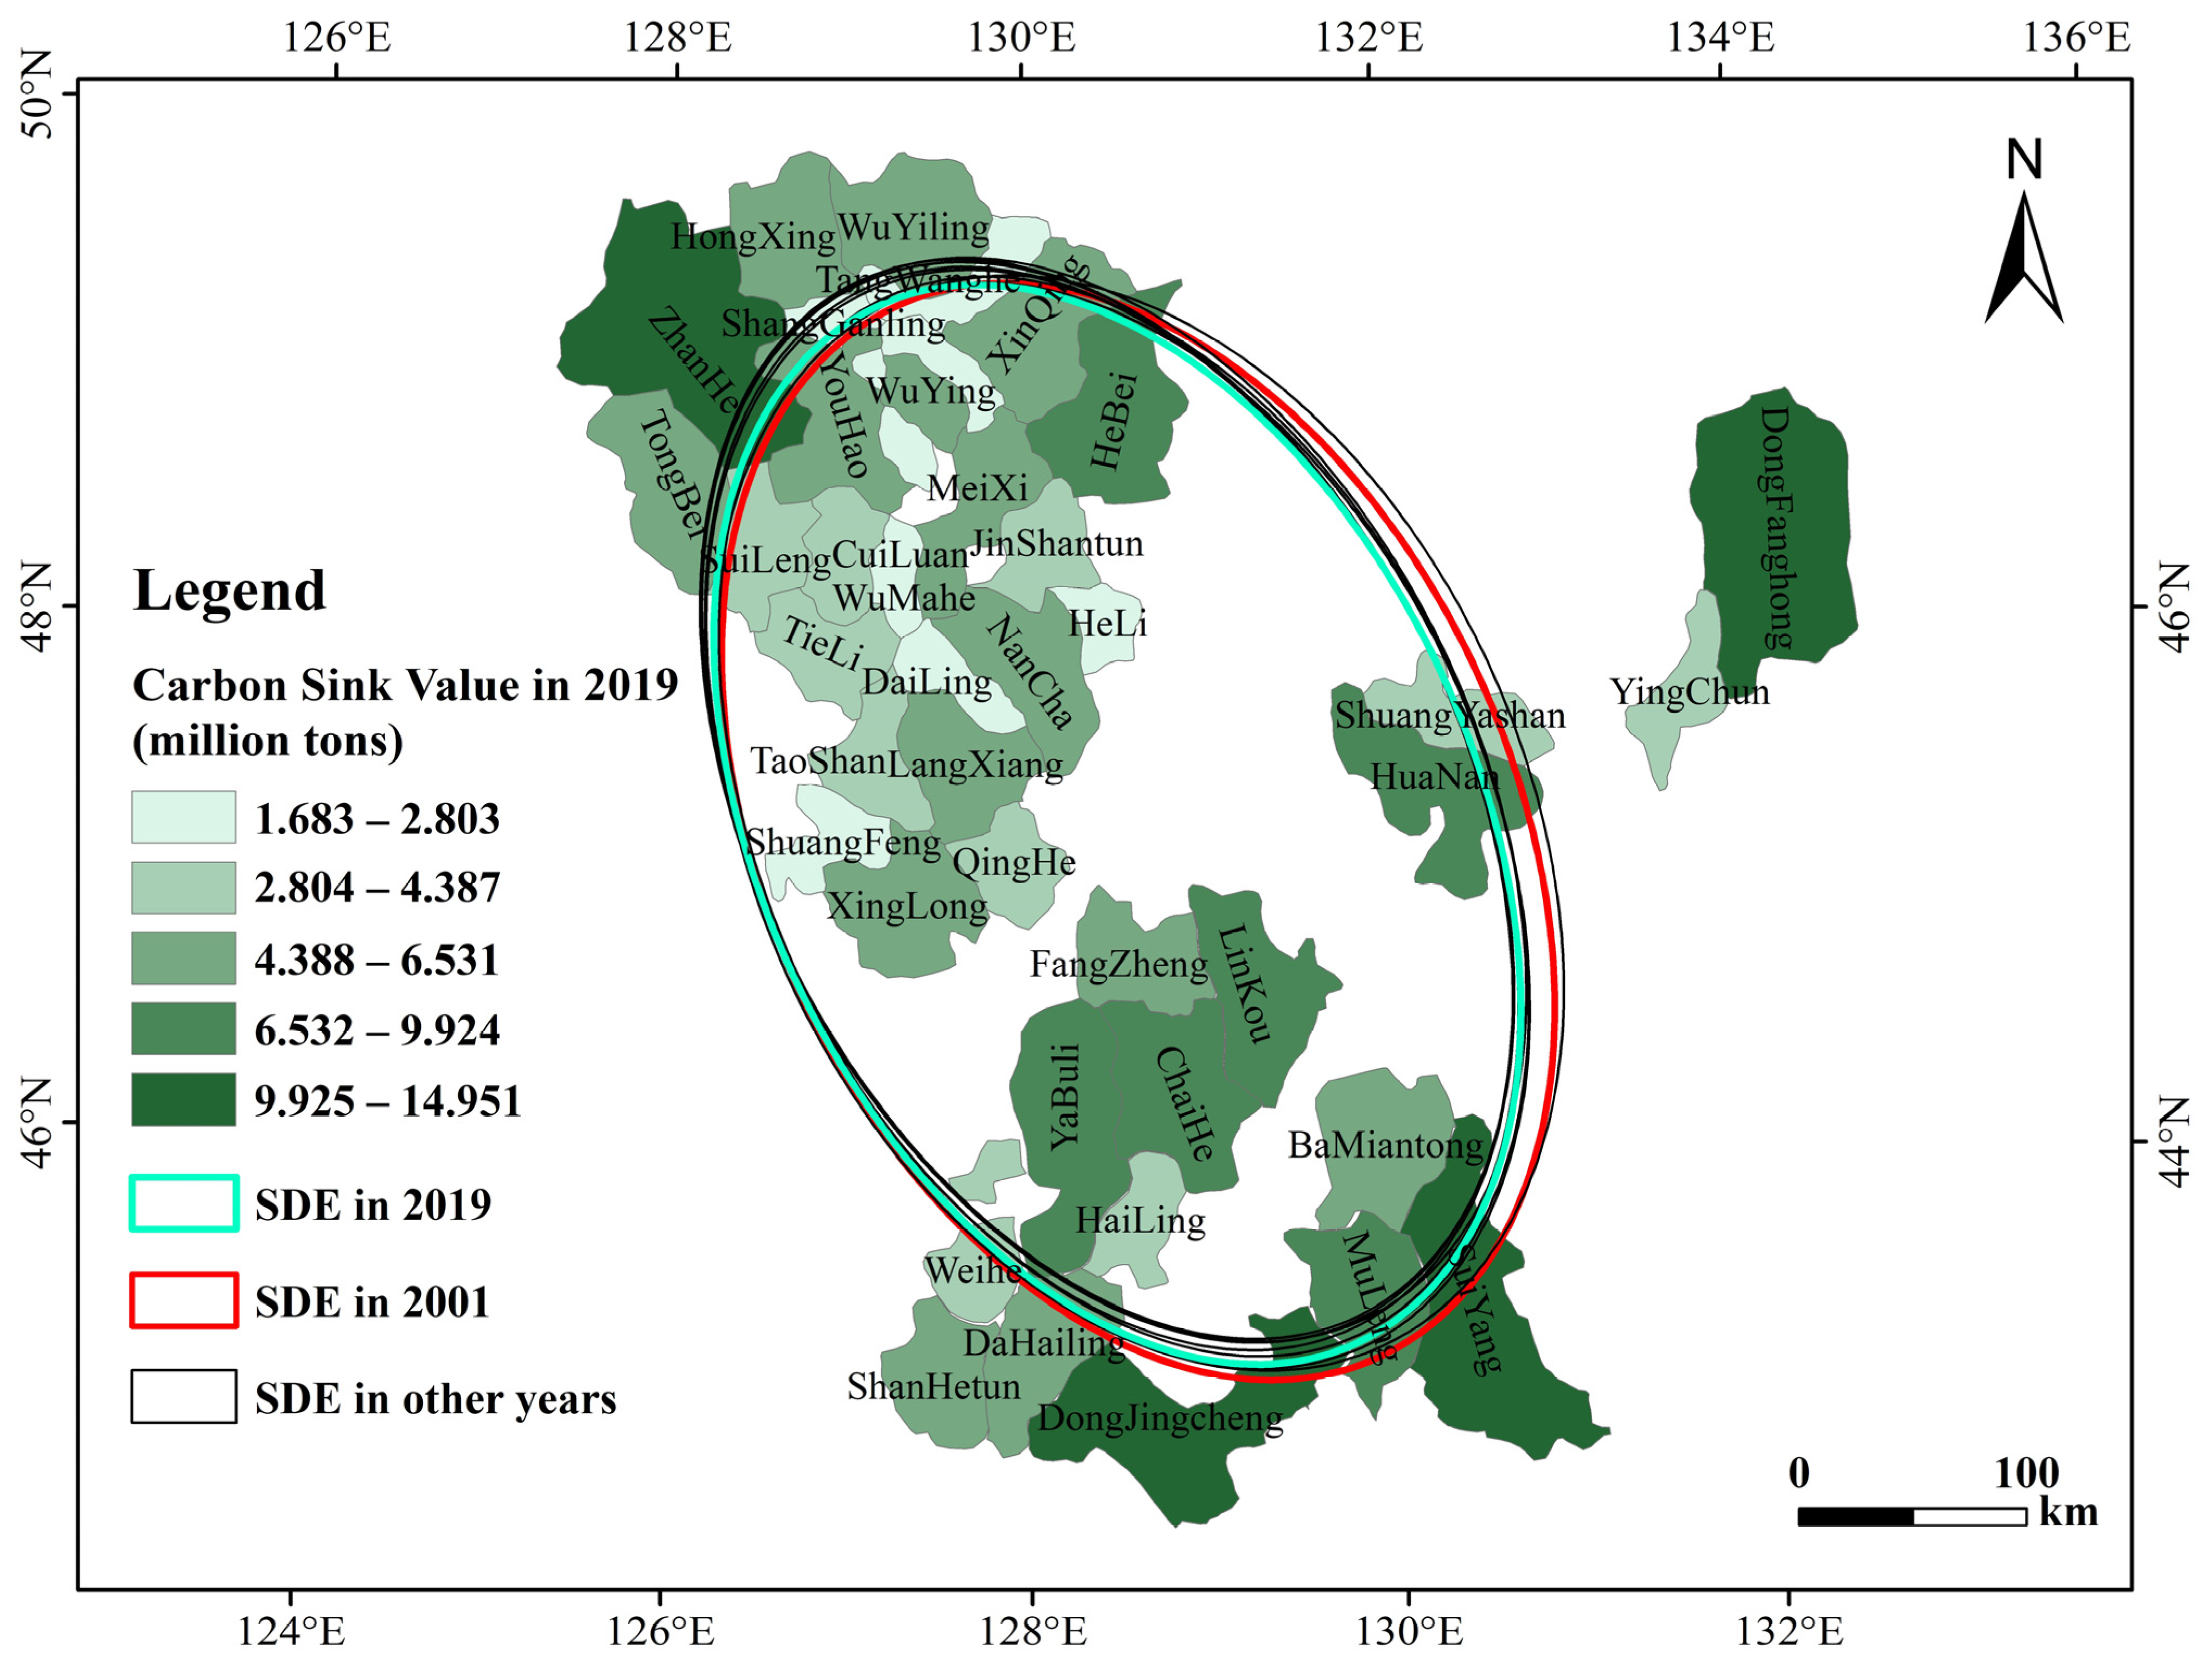
To reflect the differences in the carbon sinks of the key SOFRs within the spatial scope, the carbon sink values of the 40 forest regions in 2019 were sorted, and ArcGIS 10.7 was used to link this information with the locations of the forest regions. Then, the natural breaks (Jenks) classification method was selected to classify the carbon sinks in 2019 and visualize them (
Figure 3). Additionally, to calculate the direction of the spatial distribution of the carbon sink in the 40 SOFRs, this paper used the spatial statistical tools in ArcGIS 10.7 software to calculate the statistical parameters of the SDEs of the carbon sink in each forest region each year (
Table 2).
Regarding the distribution of the carbon sink in each forest region in 2019, the carbon sink of each forest region was quite different, and the overall regional distribution of the carbon sink was characterized by “more in the north and south, but less in the middle”, as shown in
Figure 3. Among them, the four forest regions of ZhanHe, DongFanghong, DongJingcheng, and SuiYang had the highest carbon sinks, ranging from 9.925 million tons to 14.951 million tons. Mainly due to the large scale of these forest regions and the implementation of key forestry projects, the quality of these forests is better, and thus, the carbon sink value is higher. The seven forest regions of ShuangFeng, DaiLing, HeLi, WuMahe, TangWanghe, WuYing, and ShangGanling had the lowest carbon sinks, with values in the range of 1.683–2.803 million tons. Most likely because of the small scale of these forest regions, the management and maintenance of large-scale forest regions is relatively low.
From 2001 to 2019, the SDE of the SOFRs showed an overall pattern of “southeast–northwest” and reflected the characteristics of “from southeast to northwest” migration, but the range of change was small. The turning angle θ showed a fluctuating downward trend, but the magnitude of change was small, indicating that the carbon sink growth rate of the SOFRs in the southeast of the ellipse axis was slightly slower than that of the SOFRs in the northwest of the ellipse axis. The area of the SDE showed a fluctuating downward trend. The overall area of the ellipse decreased by 7351.1 km2 compared with the value in 2001, and the rate of decrease was 5.61%. The area of the ellipse reached its maximum value in 2007 at 133,949.3 km2. The short-axis standard deviation fluctuated downwards, decreasing by 7299.2 m; the long-axis standard deviation also fluctuated, decreasing by 3113.1 m. The changes in the carbon sink values in the SOFRs in Heilongjiang Province showed a trend of agglomeration and migration to the northwest.
3.1.3. Analysis of Spatial Changes in the Carbon Sink Value
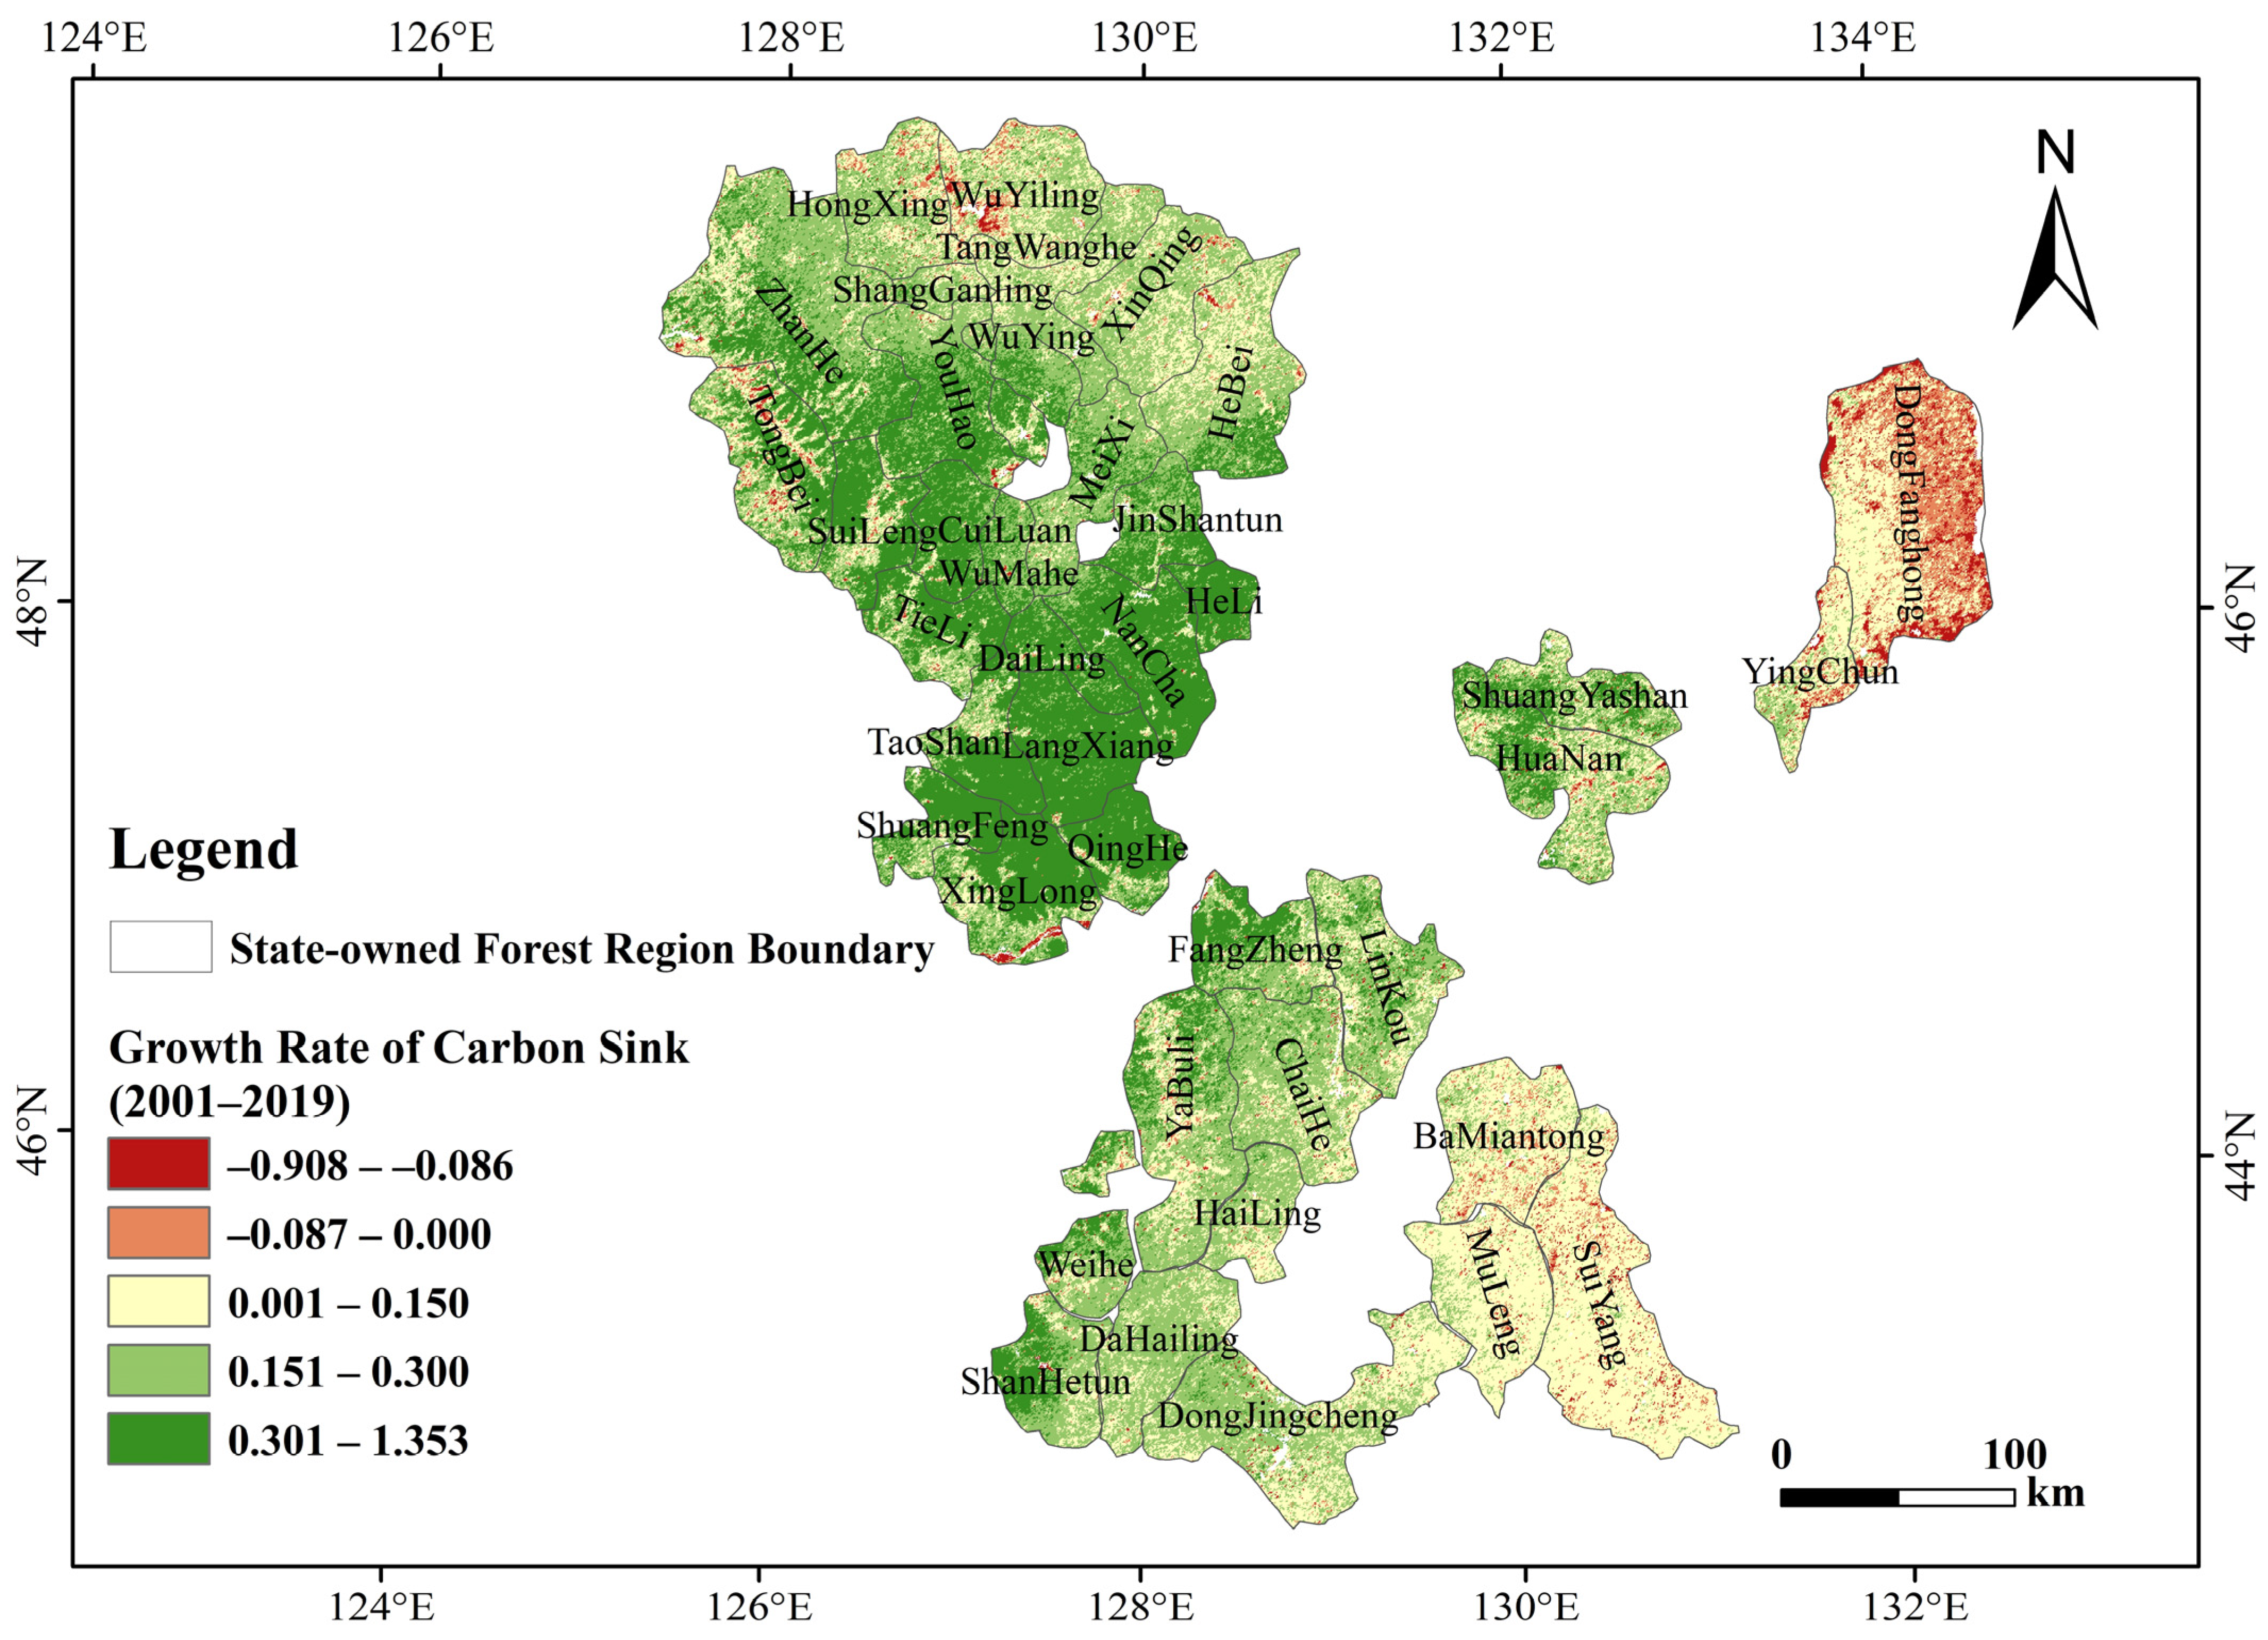
To investigate the spatial changes in the carbon sink value during the study period, this paper used the spatial distribution maps of the carbon sink (500 m) in the SOFRs in 2001 and 2019. Combined with the function of map algebra in ArcGIS 10.7, the growth rate of the carbon sink at the grid scale was calculated. Then, based on the clustering of the results, the spatial regional carbon sink growth was classified, and the spatial change trend map of the carbon sink in the studied region from 2001 to 2019 was drawn (
Figure 4). ArcGIS 10.7 then reclassified the results and calculated the area and corresponding proportions of the five changing trends.
From the perspective of the growth rate of the spatial carbon sink in the 40 key SOFRs in Heilongjiang Province, the carbon sink of the SOFRs from 2001 to 2019 showed an “overall increase and small-scale reduction” phenomenon (
Figure 4). Among them, the area where the growth rate of the carbon sink was between 0.151 and 0.300 was the largest, accounting for 36.15%; the second largest growth rate of the carbon sink was between 0.001 to 0.150 and 0.301 to 1.353, accounting for 29.90% and 27.05%, respectively. From 2001 to 2019, the total proportion of positive growth in the carbon sink value in the SOFRs in Heilongjiang Province reached 93.10%. The areas with negative growth rates were divided into two levels, namely, −0.908~−0.086 and −0.087~0.000, and the corresponding area proportions were 2.06% and 4.84%, respectively. Areas with a growth rate of 0.151 or more accounted for 63.20%, indicating that the carbon sink in most regions increased significantly during the study period. Corresponding to the analysis in
Figure 3, the carbon sinks of the regions with higher growth rates were lower, which proved that the initial value was lower and the growth potential was greater. However, the regions with growth rates of 0.001 to 0.150 and negative growth rates were mostly located in regions with high carbon sinks, and their growth space was small.
The possible reasons for the negative growth of the carbon sink in some regions are as follows. First, the DongFanghong Forest Region has a large scale of forest management and high timber output, which makes forest management and protection more difficult. Second, after 1998, forest management and protection were strengthened, resulting in a decrease in logging, but the geographical distribution was wider. Therefore, there is illegal carbon burning in forest areas with inconvenient transportation and low population density. In addition, it takes a certain period for the area of unforested land to increase as a result of forest tending and other methods to transform into forest land. Therefore, there may be a decrease in the carbon sink value during the study period.
3.2. Analysis of Temporal and Spatial Distribution of Amount of FMI in Key SOFRs
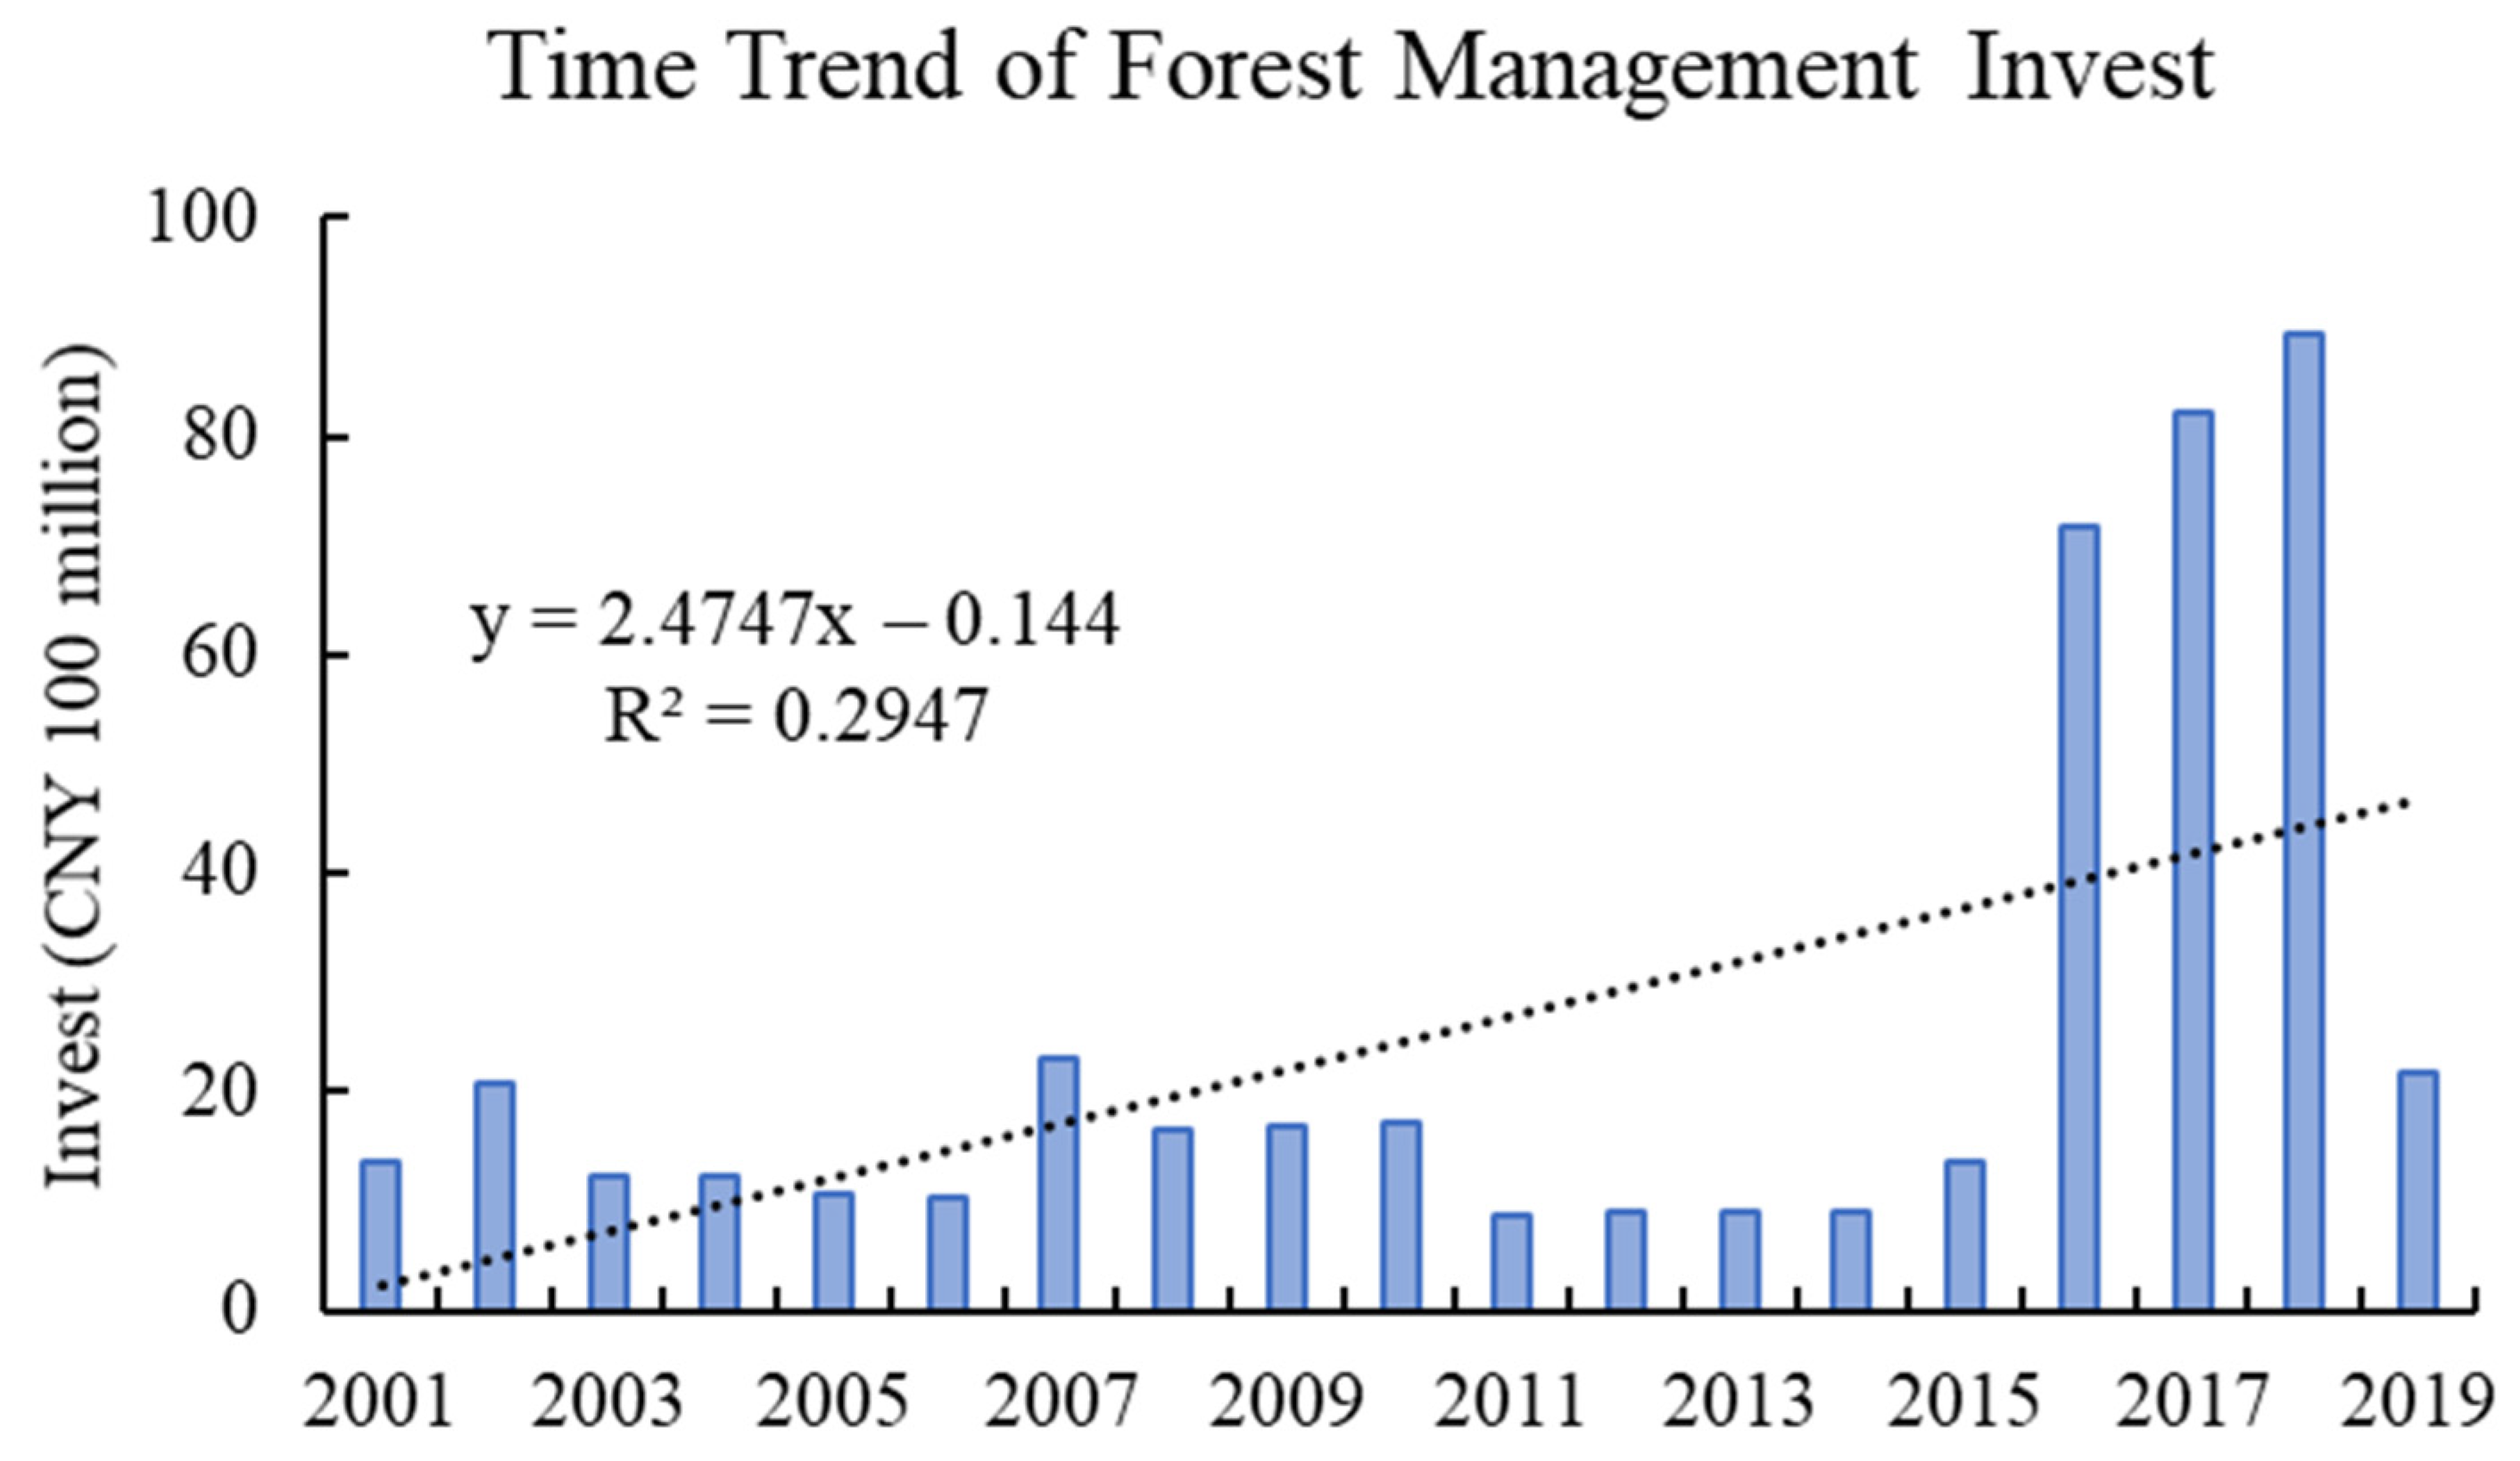
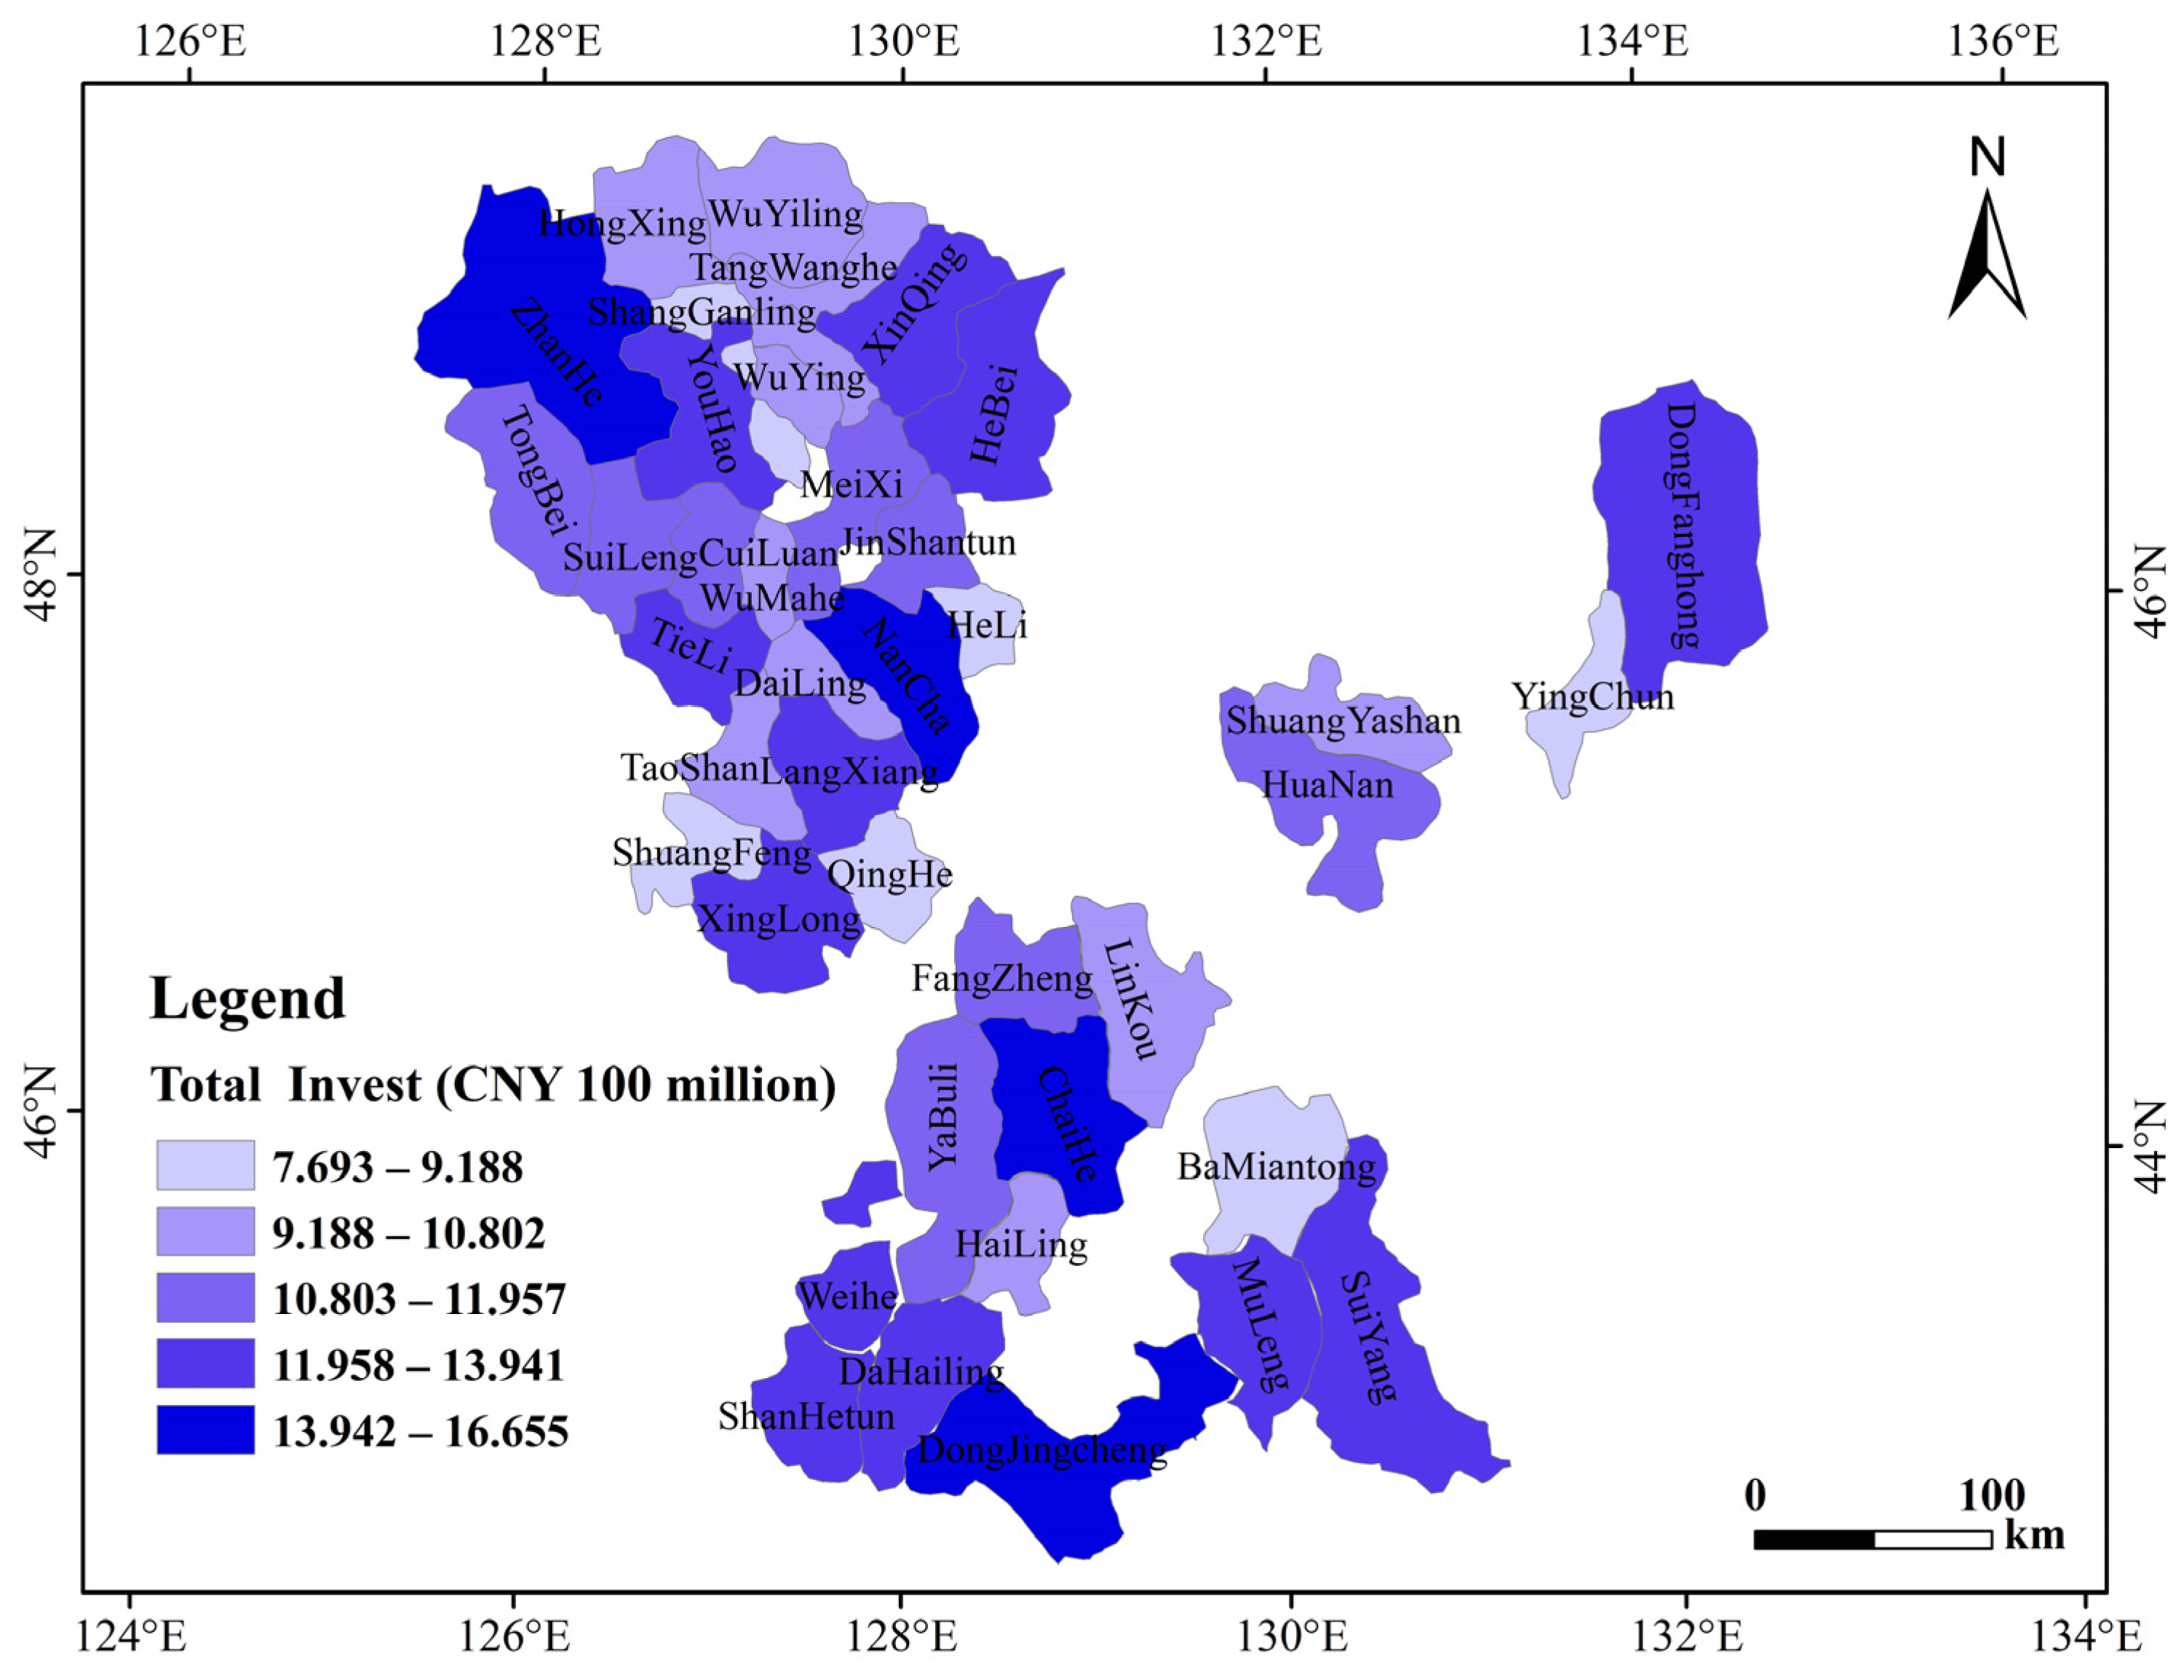
To visually reflect the changes in the annual FMI during the study period, the paper summarized the total annual FMI and created a histogram (
Figure 5). To reflect the difference in FMI in the 40 key SOFRs within the spatial scope, the thesis comprehensively organized the total amount of FMI in the 40 SOFRs during the 19-year study period and used ArcGIS 10.7 to connect with the forest regions. The natural break point classification method (Jenks) was chosen to classify the FMI amount and visualize it (
Figure 6).
The temporal change in FMI in the SOFRs showed an overall upward trend. The fitted curve was y = 2.4747x − 0.144, but the R2 value was low at 0.2947. The investment amount fluctuated from 2001 to 2015. The amount of investment soared from 2016 to 2018 and dropped sharply in 2019. The total FMI from 2001 to 2019 was approximately CNY 46.745 billion. Among them, the highest investment amount was CNY 8.926 billion in 2018. This was followed by that in 2016 and 2017, with values of CNY 7.156 billion and CNY 8.224 billion, respectively. Except from 2016 to 2018, the average FMI in other years was CNY 1.402 billion.
The amount of FMI in various forest regions in Heilongjiang Province was quite different, the regional distribution of FMI was uneven, and there was no obvious aggregation state. Among them, ZhanHe, NanCha, ChaiHe, and DongJingcheng had the highest level of FMI in the four forest regions, ranging from CNY 1.3942 to 1.6655 billion, accounting for 13.55% of the total FMI. Additionally, the amount of FMI in the 12 forest regions of YouHao, XinQing, HeBei, TieLi, LangXiang, XingLong, DongFanghong, WeiHe, DaHailing, ShanHetun, SuiYang, and MuLeng was in the fourth tier, ranging from CNY 1.195–1.3941 billion, accounting for 33.93%. The amount of FMI in the eight forest regions of TongBei, SuiLeng, JinShantun, CuiLuan, MeiXi, HuaNan, FangZheng, and YaBuli was between CNY 1.0803 and 1.1957 billion, accounting for 19.97%. The investment in the 10 forest regions of Hailing, LinKou, ShuangYashan, TaoShan, DaiLing, WuMahe, HongXing, WuYiling, WuYing, and TangWanghe was between CNY 918.8 million and 1.0802 billion, accounting for 21.79%. In ShangGanling, HeLi, ShuangFeng, QingHe, YingChun, and BaMiantong, the amount of FMI in the six forest regions was among the lowest tiers, ranging from CNY 769.3 to 918.8 million, accounting for only 10.76%.
3.3. Analysis of Effect of Threshold Model Testing
We first examined whether the threshold effect existed, and then determined the number of threshold values based on the test results. According to the analysis of the test results in
Table 3, the F statistic and its significance level verified the existence of the threshold effect. The F statistics of the single-threshold model and the dual-threshold model were 78.20 and 90.44, respectively, and both passed the 1% significance level test. The
p value indicated that both a single threshold and a double threshold could be selected, and the width of the confidence interval was small. However, a small sample size in the interval would lead to inaccurate estimation results. Therefore, considering the sample size of each interval, the research should select a single threshold model. When the corresponding likelihood ratio statistic LR was 0, the threshold parameter estimated value was γ = 5,327,211.87.
3.4. Analysis of Model Results
The study used Stata 16.1 measurement software to conduct the regression to investigate the efficiency of FMI in increasing carbon sinks in 40 key SOFRs in Heilongjiang Province. The specific results are shown in
Table 4.
Model (1) showed the regression result of the individual fixed-effects model, which verified the cost-effectiveness of increasing the carbon sink by FMI without considering the lagging impact of FMI on the carbon sink. Model (2) and Model (3) examined the efficiency of FMI in increasing the carbon sink when FMI lagged by one and two periods. Model (4) used the carbon sink as the threshold variable to examine the differences in the efficiency of FMI under different levels of the carbon sink.
- (1)
Model (1) showed that the impact of FMI in SOFRs on the carbon sink did not pass the 10% significance test. However, from a theoretical point of view, FMI includes forest tending investment, forest management and protection investment, forestry fixed asset investment, afforestation and renewal investment, NFPP investment, forest quality improvement investment, and other aspects. These funds will increase the forest stock to varying degrees, thereby increasing the forest carbon sink, but the results of the model had no significant impact. The possible reasons are as follows. First, after the investment of forestry funds, the implementation of measures such as afforestation and forest tending take a certain amount of time. Second, some forest management and protection measures do not have an immediate positive impact on forest carbon sinks. For example, thinning will cause a short-term decline in carbon storage. In addition, measures such as forest tending and artificial afforestation require a certain amount of time to affect the carbon sink, and they do not have an immediate impact on the carbon sink. Therefore, it takes a certain period from the investment to produce obvious effects—that is, the influence of the variable on lags.
- (2)
We determined the reasonable lag period for FMI in 40 key SOFRs and used this as a basis to analyze the efficiency of increasing the carbon sink, such as in Models (2) and (3). Since we took the logarithm of all variables, the coefficient in the result indicated the sensitivity of the carbon sink to changes in FMI. The results showed that the elasticity coefficients of FMI for the first and second periods of lag were 0.01419 and 0.00750, respectively. The elasticity coefficient (sensitivity) was the largest when the FMI lagged for a period, which was 0.01419. This result means that for every 1% increase in the amount of FMI, the carbon sink will increase by 0.0142%. Therefore, we chose one lagging period of FMI as a reasonable lag period.
- (3)
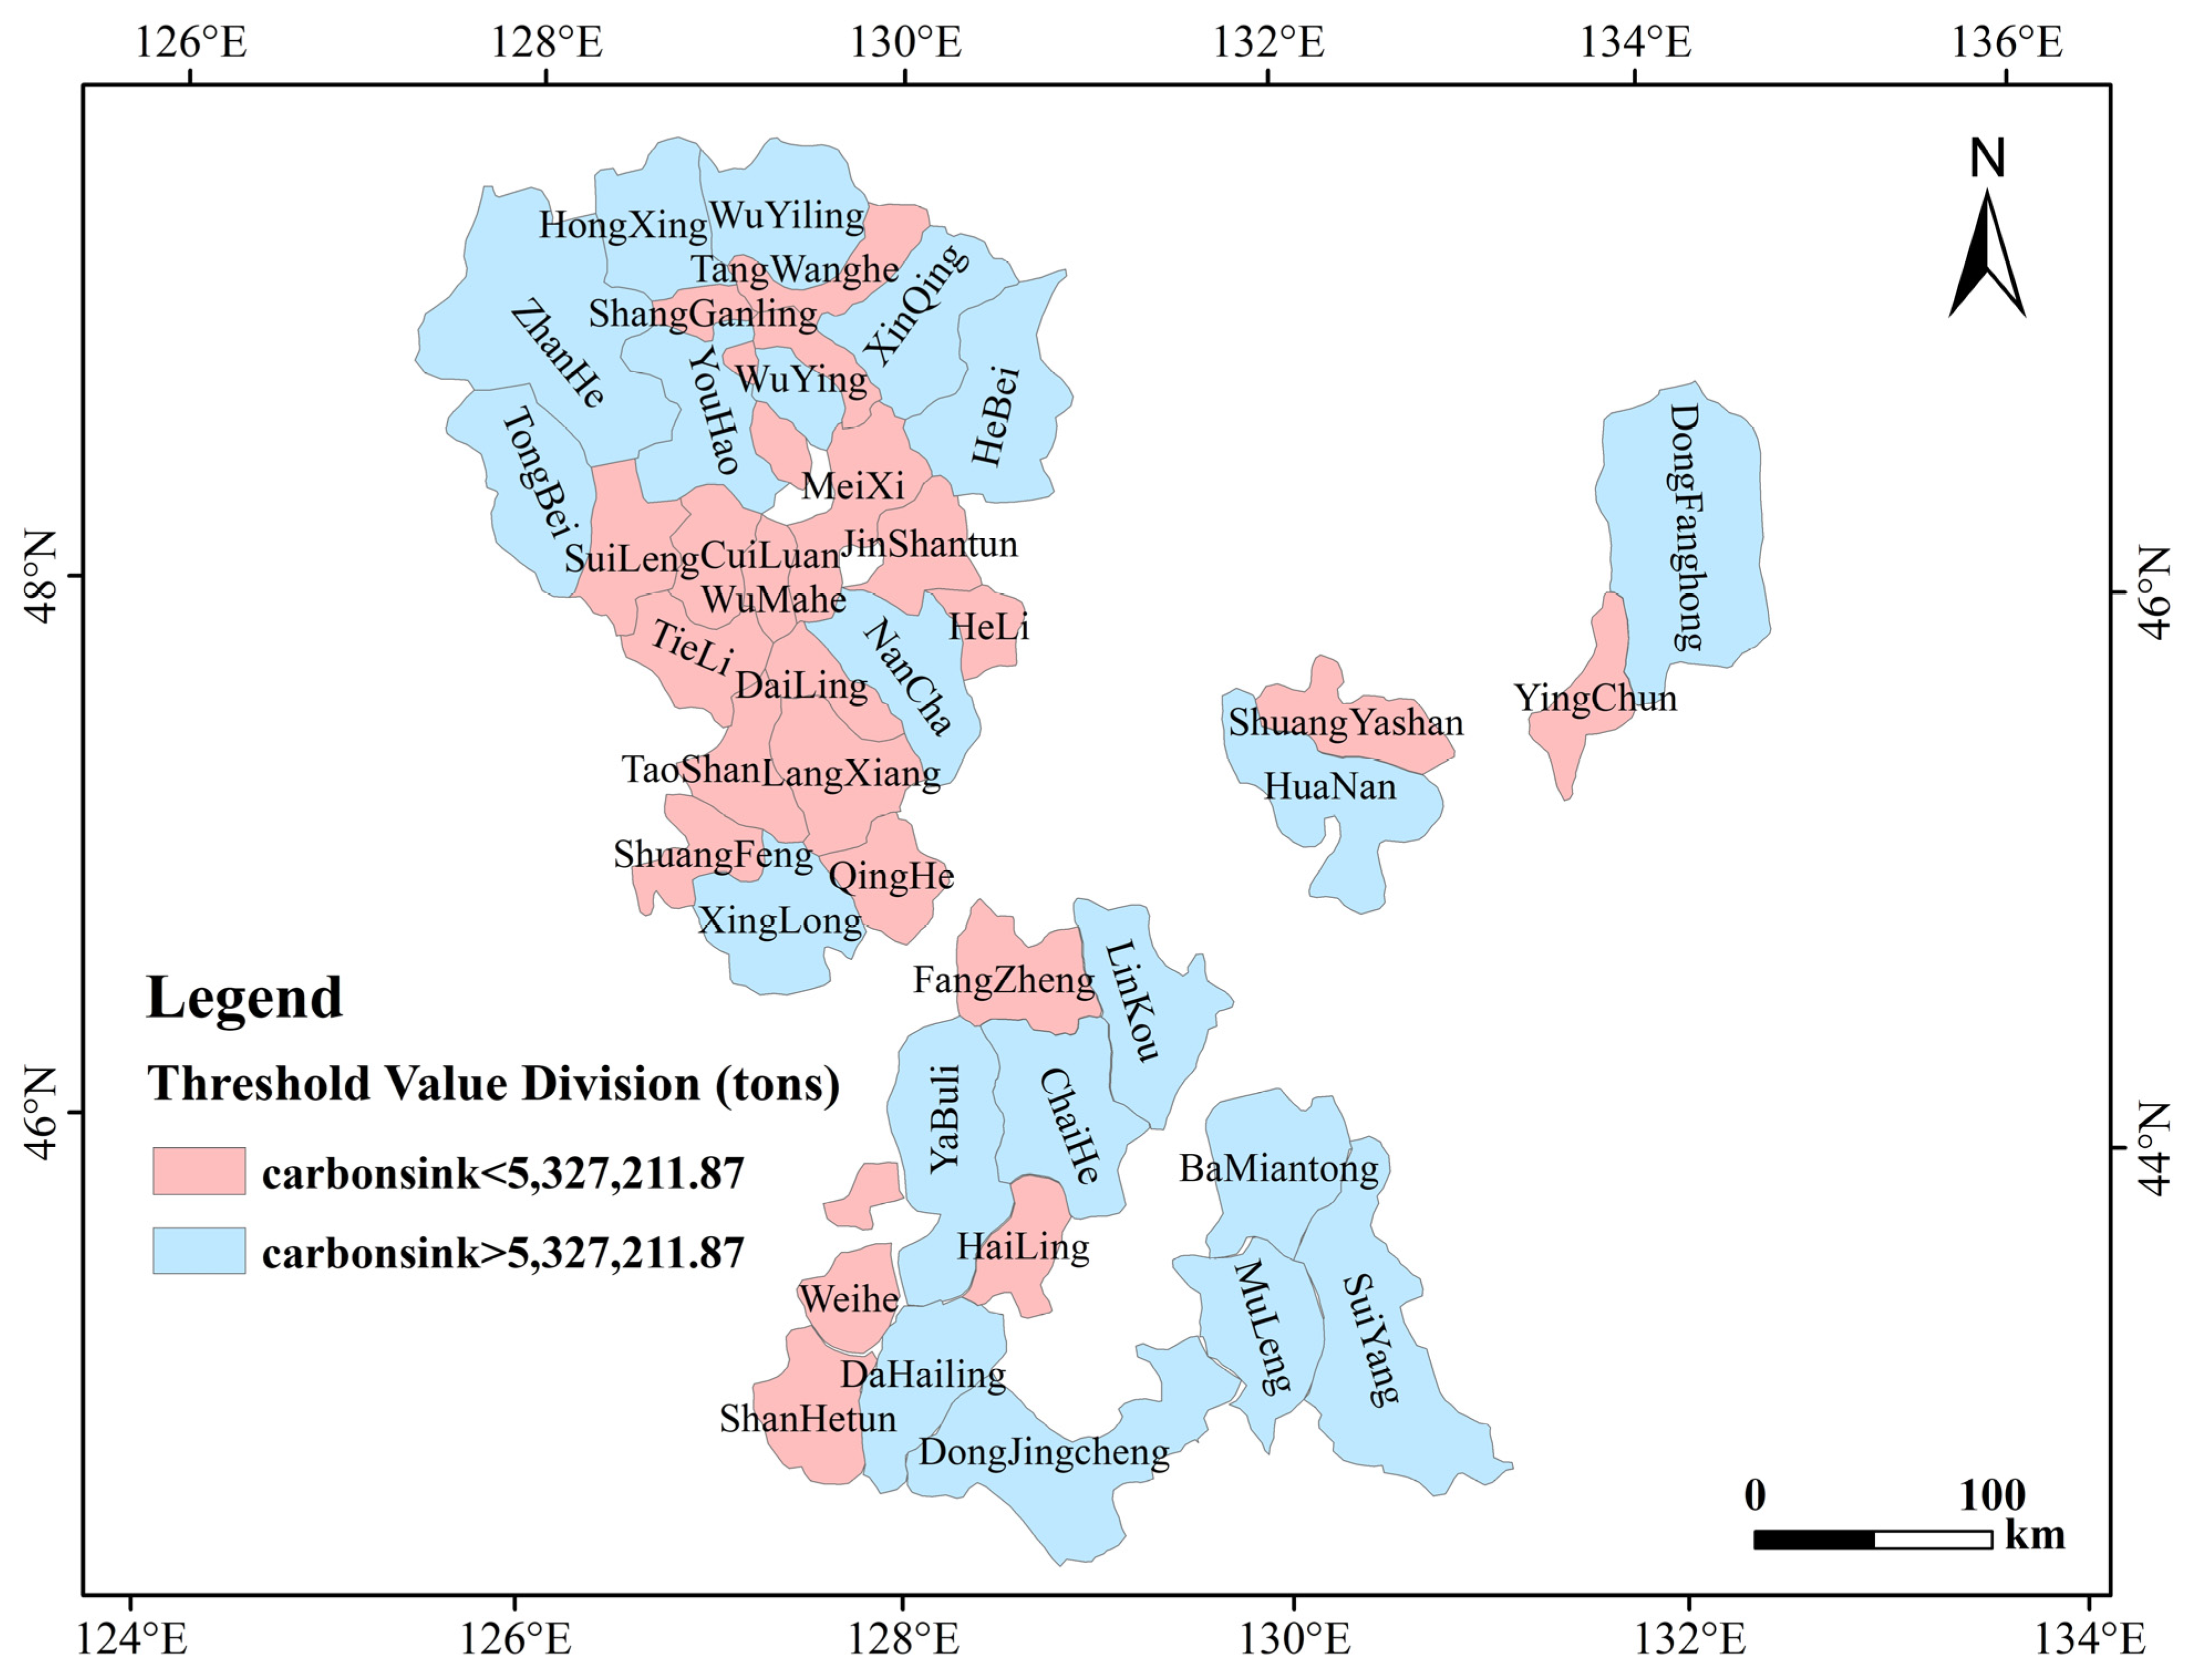
The efficiency of FMI in forest regions with high carbon sinks was greater than that of regions with low carbon sinks, as shown in Model (4). At different carbon sink levels, FMI had a significant positive impact on the carbon sink (
p < 0.01), but there was strong heterogeneity. The carbon sink of each forest region can, to a large extent, represent the scale of the forest region and the endowment of forest resources. The areas with higher carbon sinks were mostly forest regions with large scales and better endowments of forest resources. Due to the existence of the scale effect, the large-scale forestry management effect was obviously better [
11]. When the carbon sink was less than 5,327,211.8707 tons, FMI had a significant positive impact on the carbon sink (
p < 0.01), and the elasticity coefficient was 0.00953. That is, for every 1% increase in FMI, the carbon sink value of the region increased by 0.00953%. When the carbon sink was higher than 5,327,211.8707 tons, FMI had a significant positive impact on the carbon sink (
p < 0.01), and its elasticity coefficient was 0.02175. That is, for every 1% increase in FMI, the carbon sink value of the region increased by 0.02175%. The higher the value of the elasticity coefficient of FMI was, the greater the contribution rate of FMI to the growth of the carbon sink, and the higher the investment efficiency. The latter’s FMI efficiency was 128.23% higher than that of the former. According to the threshold regression results,
Figure 7 was drawn, in which the pink and blue areas are areas with low and high FMI efficiency, respectively.
Among the control variables (Models 1, 2, 3, and 4), the GDP has an inverted U-shaped impact on the carbon sink. That is, as the level of forestry output value in each forest region increased, the carbon sink showed a trend of “rising first, then falling”, following the basic path of the environmental Kuznets curve. In Model (4), the number of employees had a significant positive impact on the carbon sink (p < 0.01), and the coefficient value was 0.03713. Precipitation had a significant positive impact on the carbon sink (p < 0.01), with a coefficient value of 0.22435. That is, for every 1% increase in precipitation, the carbon sink increased by 0.22435%. The results met the tree growth principles and theoretical expectations, thus verifying the logic of the model and the reliability of the results.
- (4)
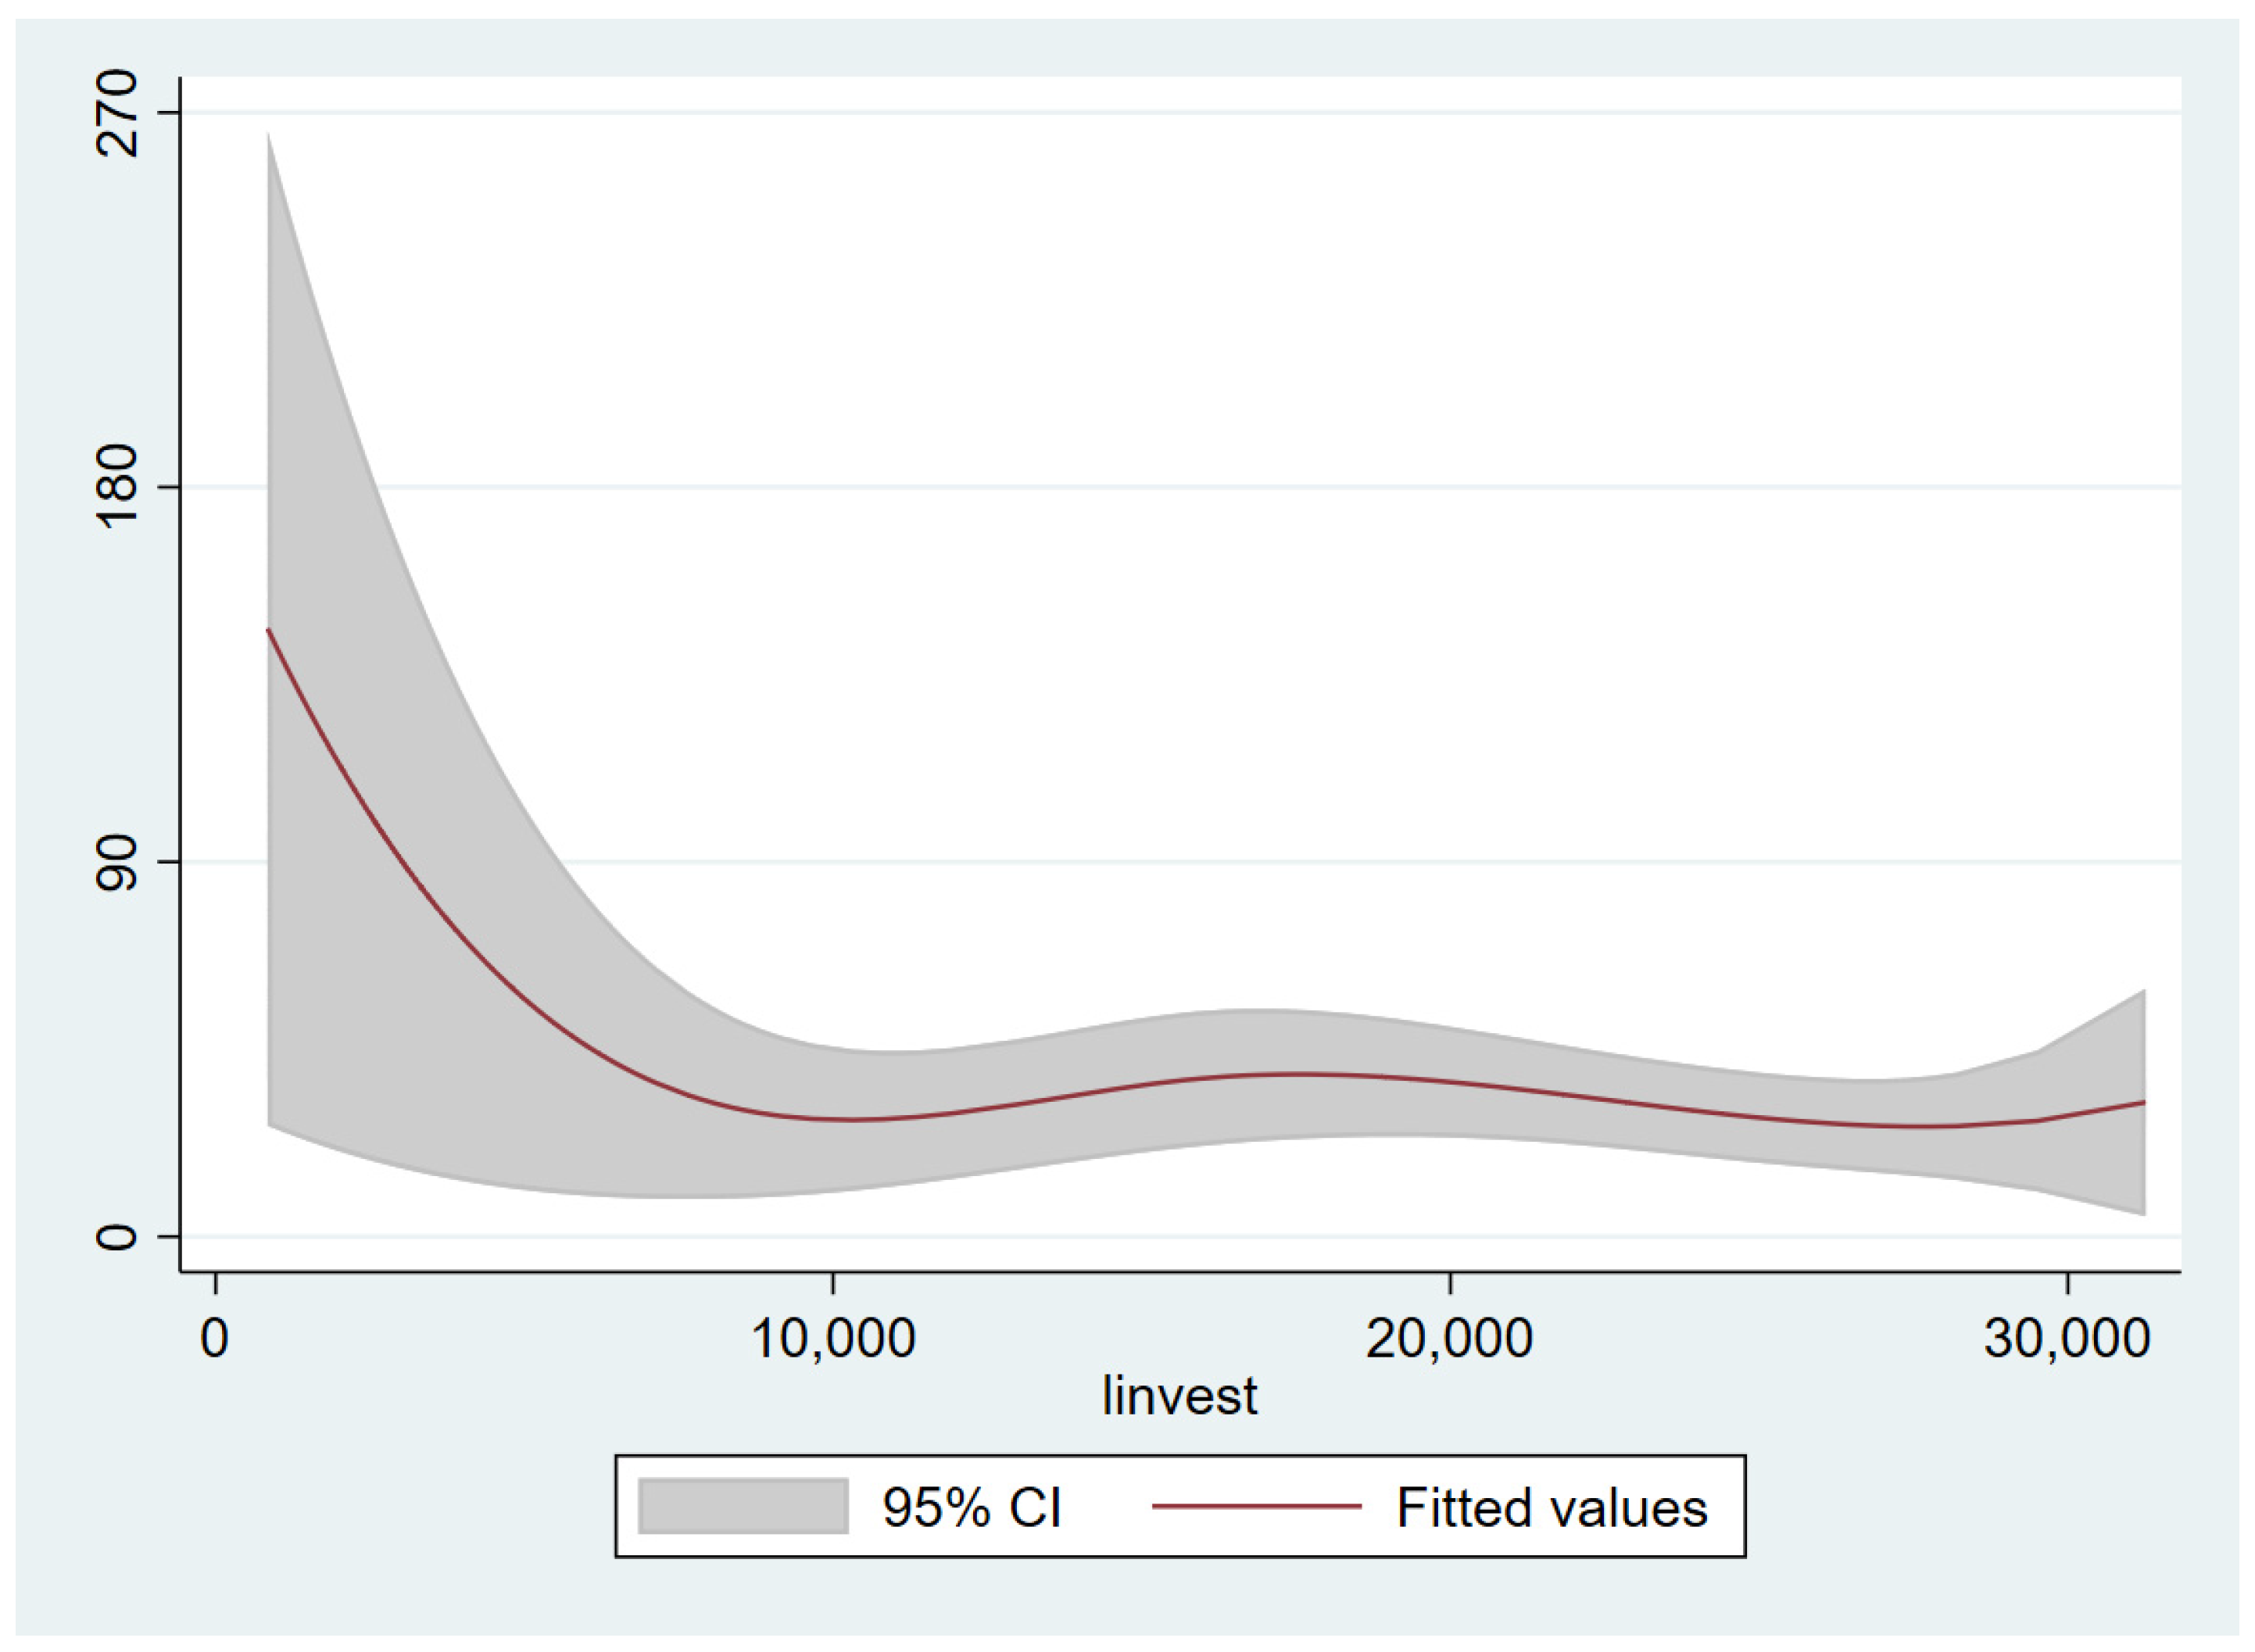
The FMI shows a law of diminishing marginal benefits for increasing carbon sinks in each forest region, as shown in
Figure 8. With the increase in FMI, the effect of increasing the carbon sink showed a downward sloping curve. The result passed the significance test, and the confidence interval of the coefficient value at each point did not include 0. Since this model was the result of nonparametric estimation, the estimation result of FMI on the carbon sink parameters in the individual fixed-effects model should be an oblique upward curve, and the coefficient value should be positive. When the investment amount in the forest region exceeded CNY 100 million, the growth rate of the carbon sink remained at a low level. However, the marginal benefit curve did not intersect or approach 0, indicating that FMI has not yet reached the optimal investment scale, and additional investment should be reasonable.
4. Discussion
This paper used panel data from 40 SOFRs in Heilongjiang Province from 2001 to 2019 for 19 periods, selected the panel threshold model to divide the carbon sink threshold, and examined the efficiency and difference of FMI in increasing the carbon sink value under different carbon sink levels. The analysis of the results showed that the amount of carbon sink greatly affected the efficiency of FMI and verified the law of diminishing marginal returns of FMI. The main differences from previous studies are as follows: (1) We visualized the changes in the carbon sink and FMI in key SOFRs in Heilongjiang Province in time and space to facilitate dynamic analysis. (2) We excluded the sensitivity of FMI changes to carbon sinks on a large scale. (3) We used the panel threshold model to fully investigate the impact of the carbon sink in each forest region on investment efficiency, and then identified efficient FMI areas. (4) Partially linear functional-coefficient panel data models were used to verify that the FMI in the key SOFRs in Heilongjiang Province followed the law of diminishing marginal returns. The research significance of this article mainly lies in the following: carbon sinks were used to characterize the natural conditions, forest resources, and scale of each forest region, and natural factors were included in the system to measure the efficiency of FMI in increasing carbon sinks. According to the differences in FMI in different forest regions, the results provided a decision-making basis for SOFR management, capital allocation, and high-quality forest development, and promoted the realization of the “dual carbon” goal.
During the study period, the overall carbon sink level of the key SOFRs in Heilongjiang Province fluctuated greatly. The possible reason is that the SOFRs, as one of the country’s timber supply producing areas, have an annual timber output of up to 4 million cubic meters, and the objects of logging are mostly mature forests and overmature forests. The carbon storage in mature forests and overmature forests is higher than that in young, middle-aged, and near-mature forests, and logging will result in a short-term decline in carbon storage. Additionally, the annual net productivity of young forests and middle-aged forests will reach the highest value after a certain period of time and do not immediately contribute to the increase in carbon storage. In addition, measures such as forest tending and artificial afforestation require a certain amount of time to affect the carbon sink, so immediate results are not visible. In addition, forests are affected by multiple factors, such as pests, wind breaks, and drought. Especially in 2007 and 2011, the annual rainfall was significantly lower than that in other years, which restricted the growth of trees and caused a short-term decline in the carbon sink. In addition, in 2015, the state issued a policy stating that logging was prohibited in all natural forests in northeast China [
49,
50], and the carbon sinks of forest regions increased. Therefore, there were large fluctuations in the changes in the carbon sink in the study area.
Previous research methods did not consider the impacts of forest scale and resources on the efficiency of FMI. Therefore, it was impossible to accurately identify high-efficiency investment areas, and it was difficult to improve the level of carbon sinks and the efficiency of FMI in a targeted manner, resulting in a waste of forestry funds. In this paper, the investment efficiency of forest management in the key SOFRs of Heilongjiang Province, divided according to the amount of carbon sink, was quite different. There were 21 forest regions with carbon sinks of less than 532,721.87 tons, and their FMI efficiency was 56.18% lower than that of forest regions with more than 532,721.87 tons. In forest regions with low FMI efficiency, first, the amount of FMI should be reasonably controlled, and limited funds should be allocated to forest regions with higher efficiency. Second, the management and supervision of the use of forestry funds should be strengthened, disease and insect pests and drought should be prevented in a timely manner, and timely thinning and replanting should be carried out to improve forest quality in SOFRs.
This paper verified that the effect of increasing the carbon sink of FMI reflected the law of diminishing marginal benefits. According to the results of the model, when the FMI was greater than CNY 100 million, the marginal benefit remained at a stable low level. This result means that when the FMI reached CNY 100 million, the carbon sink volume did not change significantly. However, the marginal benefit curve did not intersect at 0, indicating that FMI has not yet reached the optimal investment scale. Therefore, the government should reasonably increase the amount of FMI when planning FMI in various forest regions. However, since all FMI is used to improve forest quality, the growth potential of each unit area of forest in a certain period of time is limited. Therefore, even without considering the problems in the process of fund management and use, there is a diminishing marginal benefit for each share of funds to increase the carbon sink. Generally, after the forest quality reaches a certain level, even if the FMI gradually increases, the forest quality tends to have a stable and slow growth state. Therefore, the effect of increasing the carbon sink of FMI shows a law of diminishing marginal benefits.
The main contribution and innovation of the research lies in the establishment of an evaluation system for FMI efficiency. In addition, natural factors and forest resource characteristics are incorporated into the system to measure the utilization efficiency. Our research will help to explore the reasons for the differences in FMI efficiency, promote forest management according to local conditions, and improve the utilization efficiency of SOFRs. Furthermore, our research constructs a calculation method for the optimal investment scale for the purpose of ecological benefit. It plays an important role in improving government budget and final accounts, and provides a decision-making basis for forest management, fund allocation, and high-quality forest development. Of course, our research has limitations. Our research area was limited to SOFRs in Heilongjiang Province, and the results of the study have directional policy significance for SOFRs. However, due to regional heterogeneity, the applicability of this result to other SOFRs remains to be further verified. Future research can use the methods described in this paper to explore the difference in the efficiency of state-owned FMI and collective FMI in increasing carbon sinks. In addition, future research can subdivide the efficiency of increasing the carbon sink in various SOFRs and provide targeted suggestions for government FMI management and decision making.
5. Conclusions
This paper used the panel data from 40 SOFRs in Heilongjiang Province from 2001 to 2019 as the research sample. First, the individual fixed-effects model was used to determine a reasonable lag period, and then the panel threshold model was selected to investigate the increase in carbon sink efficiency and differences in FMI under different carbon sink levels. In addition, partially linear functional-coefficient panel data models were used to verify the law of the effect of FMI on increasing the carbon sink. The main conclusions of the study were as follows. (1) The aggregate carbon amount of SOFRs in Heilongjiang Province from 2001 to 2019 showed an overall upward trend, the total growth rate was 20.17%, and the overall fluctuation was large. In terms of space, the carbon sink showed a phenomenon of “increasing as a whole and decreasing in a small area”. The SDE of the carbon sink presented a pattern of “southeast–northwest” and showed the characteristics of “from southeast to northwest” migration. In addition, the carbon sink of each forest region was quite different, showing the characteristics of “more in the north and south, but less in the middle”. (2) The total FMI from 2001 to 2019 was approximately CNY 46.745 billion, showing an upward trend, but the amount of FMI varied greatly among forest regions. (3) The amount of carbon sink in each forest region significantly affected the efficiency of increasing the carbon sink by FMI. When the carbon sink was less than 5,327,211.8707 tons, the elasticity coefficient of the impact of FMI on the carbon sink was 0.00953. When the carbon sink was higher than 5,327,211.8707 tons, the elasticity coefficient of the impact of FMI on the carbon sink was 0.02175, and the latter’s FMI efficiency was 128.23% higher than that of the former. (4) The increasing carbon sink effect of FMI showed the law of diminishing marginal benefits, but it has not yet reached the optimal investment scale. When the FMI reached CNY 100 million, the growth rate of the carbon sink remained at a low level.
Overall, the government should reasonably increase the level of FMI in various forest regions and simultaneously strengthen the management and supervision of the use of forest management funds. Additionally, timely prevention of plant diseases and insect pests, drought prevention and moisture conservation, and timely implementation of forestry measures such as thinning and replanting should be implemented. The high-quality development of forests in the key SOFRs of Heilongjiang Province should be promoted and the realization of the “dual carbon” goal can be achieved.
Author Contributions
Conceptualization, S.L. and S.Y.; methodology, S.L.; software, S.L. and Z.D.; validation, Z.D., Y.L. and S.Y.; formal analysis, S.L. and Z.D.; investigation, S.L., Y.L. and Z.D.; resources, Y.L. and S.Y.; data curation, S.L.; writing—original draft preparation, S.L.; writing—review and editing, S.L.; visualization, S.L., Y.L. and Z.D.; supervision, S.Y. and Z.D.; project administration, S.Y.; funding acquisition, S.Y. All authors have read and agreed to the published version of the manuscript.
Funding
This research was funded by the Special Fund for Scientific Research of Forestry Commonwealth Industry, grant number 201504424 and the National Natural Science Foundation of China, grant number 71473195, 71773091.
Institutional Review Board Statement
Not applicable.
Data Availability Statement
No new data were created or analyzed in this study. Data sharing is not applicable to this article.
Conflicts of Interest
The authors declare no conflict of interest.
References
- Cho, S.H.; Soh, M.; English, B.C.; Yu, T.E.; Boyer, C.N. Targeting payments for forest carbon sequestration given ecological and economic objectives. For. Policy. Econ. 2019, 100, 214–226. [Google Scholar] [CrossRef]
- Daigneault, A.; Favero, A. Global forest management, carbon sequestration and bioenergy supply under alternative shared socioeconomic pathways. Land Use Policy 2021, 103, 105302. [Google Scholar] [CrossRef]
- Cho, S.H.; Lee, J.; Roberts, R.; Yu, E.T.; Armsworth, P.R. Impact of market conditions on the effectiveness of payments for forest-based carbon sequestration. For. Policy. Econ. 2018, 92, 33–42. [Google Scholar] [CrossRef]
- Weng, Y.; Cai, W.; Wang, C. Evaluating the use of BECCS and afforestation under China’s carbon-neutral target for 2060. Appl. Energy 2021, 299, 117263. [Google Scholar] [CrossRef]
- Bithas, K.; Latinopoulos, D. Managing tree-crops for climate mitigation. An economic evaluation trading-off carbon sequestration with market goods. Sustain. Prod. Consum. 2021, 27, 667–678. [Google Scholar] [CrossRef]
- Baccini, A.; Goetz, S.J.; Walker, W.S.; Laporte, N.T.; Sun, M.; Sulla-Menashe, D.; Hackler, J.; Beck, P.S.A.; Dubayah, R.; Friedl, M.A.; et al. Estimated carbon dioxide emissions from tropical deforestation improved by carbon-density maps. Nat. Clim. Chang. 2012, 2, 182–185. [Google Scholar] [CrossRef]
- Mitchard, E.T.A. The tropical forest carbon cycle and climate change. Nature 2018, 559, 527–534. [Google Scholar] [CrossRef]
- Cao, Y.K.; Li, M.Y.; Li, D.X.; Zhu, Z.F. Research on the Reform of Heilongjiang Province State-owned Forest Region and Its Impact on the Natural Forest Protection Project. For. Econ. Issues 2020, 40, 225–235. (In Chinese) [Google Scholar] [CrossRef]
- He, X.; Lei, X.D.; Dong, L.H. How large is the difference in large-scale forest biomass estimations based on new climate-modified stand biomass models? Ecol. Indic. 2021, 126, 107569. [Google Scholar] [CrossRef]
- Kweon, D.; Comeau, P.G. Climate, site conditions, and stand characteristics influence maximum size-density relationships in Korean red pine (Pinus densiflora) and Mongolian oak (Quercus mongolica) stands, South Korea. For. Ecol. Manag. 2021, 502, 119727. [Google Scholar] [CrossRef]
- Liu, M.X.; Zhu, Z.; Shen, Y.Q.; Li, B.W.; Yu, K. Research on the impact of forestland management scale on the selection and effect of forestry subsidy policy implementation targets: Based on the survey of two counties and cities in Zhejiang Province. Manag. Rev. 2021, 33, 82–91. (In Chinese) [Google Scholar] [CrossRef]
- Ding, Z.M.; Yao, S.B. Ecological effectiveness of payment for ecosystem services to identify incentive priority areas: Sloping land conversion program in China. Land Use Policy 2021, 104, 105350. [Google Scholar] [CrossRef]
- Xue, H.; Frey, G.E.; Geng, Y.D.; Cubbage, F.W.; Zhang, Z.H. Reform and efficiency of state-owned forest enterprises in Northeast China as “social firms”. J. For. Econ. 2018, 32, 18–33. [Google Scholar] [CrossRef]
- Ning, Y.L.; Liu, Z.; Ning, Z.K.; Zhang, H. Measuring eco-efficiency of state-owned forestry enterprises in Northeast China. Forests 2018, 9, 455. [Google Scholar] [CrossRef] [Green Version]
- Gong, C.; Tan, Q.Y.; Liu, G.B.; Xu, M.X. Forest thinning increases soil carbon stocks in China. For. Ecol. Manag. 2021, 482, 118812. [Google Scholar] [CrossRef]
- Feng, Q.Y.; Chen, C.F.; Qin, L.; He, Y.T.; Wang, P.; Duan, Y.X.; Wang, Y.F.; He, Y.J. The influence of different management modes on the stand structure and plant diversity of Quercus mongolica natural secondary forest. For. Sci. 2018, 54, 12–21. (In Chinese) [Google Scholar] [CrossRef]
- Zhang, H.N.; Chen, S.F.; Xia, X.; Ge, X.M.; Zhou, D.Q.; Wang, Z. The competitive mechanism between post-abandonment Chinese fir plantations and rehabilitated natural secondary forest species under an in situ conservation policy. For. Ecol. Manag. 2021, 502, 119725. [Google Scholar] [CrossRef]
- Bravo-Oviedo, A.; Ruiz-Peinado, R.; Modrego, P.; Alonso, R.; Montero, G. Forest thinning impact on carbon stock and soil condition in Southern European populations of P. sylvestris L. For. Ecol. Manag. 2015, 357, 259–267. [Google Scholar] [CrossRef]
- Kim, C.; Son, Y.; Lee, W.K.; Jeong, J.; Noh, N.J. Influences of forest tending works on carbon distribution and cycling in a Pinus densiflora S. et Z. stand in Korea. For. Ecol. Manag. 2009, 257, 1420–1426. [Google Scholar] [CrossRef]
- Zhang, C.H.; Wang, L.Y.; Song, Q.W.; Chen, X.F.; Gao, H.; Wang, X.Q. Forest carbon storage and its dynamic changes in Heilongjiang Province from 1973 to 2013. China Environ. Sci. 2018, 38, 4678–4686. (In Chinese) [Google Scholar] [CrossRef]
- Ahmad, B.; Wang, Y.H.; Hao, J.; Liu, Y.H.; Bohnett, E.; Zhang, K.B. Variation of carbon density components with overstory structure of larch plantations in northwest China and its implication for optimal forest management. For. Ecol. Manag. 2021, 496, 119399. [Google Scholar] [CrossRef]
- Wu, J.C.; Zhou, J.; Zhang, Y.; Yu, X.Y.; Shi, L.; Qi, L.H. The dynamic changes of the value of moso bamboo forests to sequester carbon and increase sink: Taking Fujian Province as an example. For. Sci. 2020, 56, 181–187. (In Chinese) [Google Scholar] [CrossRef]
- Chen, D.S.; Huang, X.Z.; Zhang, S.G.; Sun, X.M. Biomass modeling of larch (Larix spp.) plantations in China based on the mixed model, dummy variable model, and Bayesian hierarchical model. Forests 2017, 8, 268. [Google Scholar] [CrossRef] [Green Version]
- Tong, X.; Brandt, M.; Yue, Y.; Ciais, P.; Rudbeck Jepsen, M.; Penuelas, J.; Wigneron, J.P.; Xiao, X.; Song, X.P.; Horion, S.; et al. Forest management in southern China generates short term extensive carbon sequestration. Nat. Commun. 2020, 11, 1–10. [Google Scholar] [CrossRef]
- Austin, K.G.; Baker, J.S.; Sohngen, B.L.; Wade, C.M.; Daigneault, A.; Ohrel, S.B.; Ragnauth, S.; Bean, A. The economic costs of planting, preserving, and managing the world’s forests to mitigate climate change. Nat. Commun. 2020, 11, 1–9. [Google Scholar] [CrossRef]
- Lefebvre, D.; Williams, A.G.; Kirk, G.J.D.; Paul, B.J.; Meersmans, J.; Silman, M.R.; Román-Dañobeytia, F.; Farfan, J.; Smith, P. Assessing the carbon capture potential of a reforestation project. Sci. Rep. 2021, 11, 2–11. [Google Scholar] [CrossRef]
- Babbar, D.; Areendran, G.; Sahana, M.; Sarma, K.; Raj, K.; Sivadas, A. Assessment and prediction of carbon sequestration using Markov chain and InVEST model in Sariska Tiger Reserve, India. J. Clean. Prod. 2021, 278, 123333. [Google Scholar] [CrossRef]
- Chu, X.; Zhan, J.Y.; Li, Z.H.; Zhang, F.; Qi, W. Assessment on forest carbon sequestration in the Three-North Shelterbelt Program region, China. J. Clean. Prod. 2019, 215, 382–389. [Google Scholar] [CrossRef]
- State Forestry and Grassland Administration. China Forestry and Grassland Statistical Yearbook (2019); China Forestry Publishing House: Beijing, China, 2020; (In Chinese). ISBN 978-7-5219-0876-3. [Google Scholar]
- Qin, H.Y. Research on the Relationship between Forest Ecology and Poverty in State-owned Forest Regions in Heilongjiang Province. Ph.D. Dissertation, Northeast Forestry University, Harbin, China, 2019. (In Chinese). [Google Scholar] [CrossRef]
- Chen, J.; Gao, M.; Cheng, S.; Hou, W.; Song, M.; Liu, X.; Liu, Y.; Shan, Y. County-level CO2 emissions and sequestration in China during 1997–2017. Sci. Data 2020, 7, 1–12. [Google Scholar] [CrossRef]
- Chen, Y.; Feng, X.; Tian, H.; Wu, X.; Gao, Z.; Feng, Y.; Piao, S.; Lv, N.; Pan, N.; Fu, B. Accelerated increase in vegetation carbon sequestration in China after 2010: A turning point resulting from climate and human interaction. Glob. Chang. Biol. 2021, 27, 5848–5864. [Google Scholar] [CrossRef]
- Zhang, X.; Brandt, M.; Tong, X.; Ciais, P.; Yue, Y.; Xiao, X.; Zhang, W.; Wang, K.; Fensholt, R. A large but transient carbon sink from urbanization and rural depopulation in China. Nat. Sustain. 2022. [Google Scholar] [CrossRef]
- Ding, Z.; Yao, S. Theory and valuation of cross-regional ecological compensation for cultivated land: A case study of Shanxi province, China. Ecol. Indic. 2022, 136, 108609. [Google Scholar] [CrossRef]
- Lu, C.X.; Venevsky, S.; Shi, X.L.; Wang, L.Y.; Wright, J.S.; Wu, C. Econometrics of the environmental Kuznets curve: Testing advancement to carbon intensity-oriented sustainability for eight economic zones in China. J. Clean. Prod. 2021, 283, 124561. [Google Scholar] [CrossRef]
- Li, C.; Fu, B.; Wang, S.; Stringer, L.C.; Wang, Y.; Li, Z.; Liu, Y.; Zhou, W. Drivers and impacts of changes in China’s drylands. Nat. Rev. Earth Environ. 2021, 2, 858–873. [Google Scholar] [CrossRef]
- Li, K.; Tong, Z.; Liu, X.; Zhang, J.; Tong, S. Quantitative assessment and driving force analysis of vegetation drought risk to climate change: Methodology and application in Northeast China. Agric. For. Meteorol. 2020, 282–283, 107865. [Google Scholar] [CrossRef]
- Wu, D.; Xie, X.; Tong, J.; Meng, S.; Wang, Y. Sensitivity of Vegetation Growth to Precipitation in a Typical Afforestation Area in the Loess Plateau: Plant-Water Coupled Modelling. Ecol. Modell. 2020, 430, 109128. [Google Scholar] [CrossRef]
- Jia, B.R.; Sun, H.R.; Shugart, H.H.; Xu, Z.Z.; Zhang, P.; Zhou, G.S. Growth variations of Dahurian larch plantations across northeast China: Understanding the effects of temperature and precipitation. J. Environ. Manag. 2021, 292, 112739. [Google Scholar] [CrossRef]
- Luo, T.X.; Liu, X.S.; Zhang, L.; Li, X.; Pan, Y.D.; Wright, I.J. Summer solstice marks a seasonal shift in temperature sensitivity of stem growth and nitrogen-use efficiency in cold-limited forests. Agric. For. Meteorol. 2018, 248, 69–478. [Google Scholar] [CrossRef]
- Vlam, M.; Baker, P.J.; Bunyavejchewin, S.; Zuidema, P.A. Temperature and rainfall strongly drive temporal growth variation in Asian tropical forest trees. Oecologia 2014, 174, 1449–1461. [Google Scholar] [CrossRef]
- Peng, S.Z.; Ding, Y.X.; Liu, W.Z.; Li, Z. 1 km monthly temperature and precipitation dataset for China from 1901 to 2017. Earth Syst. Sci. Data 2019, 11, 1931–1946. [Google Scholar] [CrossRef] [Green Version]
- Rogerson, P.A. Historical change in the large-scale population distribution of the United States. Appl. Geogr. 2021, 136, 102563. [Google Scholar] [CrossRef]
- Wang, N.; Fu, X.; Wang, S. Spatial-temporal variation and coupling analysis of residential energy consumption and economic growth in China. Appl. Energy 2022, 309, 118504. [Google Scholar] [CrossRef]
- Zuo, Z.; Guo, H.; Cheng, J.; Li, Y.L. How to achieve new progress in ecological civilization construction?—Based on cloud model and coupling coordination degree model. Ecol. Indic. 2021, 127, 107789. [Google Scholar] [CrossRef]
- Hansen, B.E. Threshold effects in non-dynamic panels: Estimation, testing, and inference. J. Econ. 1999, 93, 345–368. [Google Scholar] [CrossRef] [Green Version]
- Cai, Z.W.; Fang, Y.; Lin, M.; Su, J. Inferences for a partially varying coefficient model with endogenous regressors. J. Bus. Econ. Stat. 2019, 37, 158–170. [Google Scholar] [CrossRef]
- Du, K.R.; Zhang, Y.H.; Zhou, Q.K. Fitting partially linear functional-coefficient panel-data models with Stata. Stata J. 2020, 20, 976–998. [Google Scholar] [CrossRef]
- Geng, Y.D.; Sun, S.B.; Yeo-Chang, Y. Impact of forest logging ban on the welfare of local communities in northeast China. Forests 2021, 12, 3. [Google Scholar] [CrossRef]
- Liu, S.L.; Xu, J.T. Livelihood mushroomed: Examining household level impacts of non-timber forest products (NTFPs) under new management regime in China’s state forests. For. Policy. Econ. 2019, 98, 44–53. [Google Scholar] [CrossRef]
| Publisher’s Note: MDPI stays neutral with regard to jurisdictional claims in published maps and institutional affiliations. |
© 2022 by the authors. Licensee MDPI, Basel, Switzerland. This article is an open access article distributed under the terms and conditions of the Creative Commons Attribution (CC BY) license (https://creativecommons.org/licenses/by/4.0/).


