Article

Natural Regeneration of Scots Pine Requires the Application of Silvicultural Treatments such as Overstorey Density Regulation and Soil Preparation

Department of Forest Sciences, Faculty of Environmental Sciences, Institute of Silviculture and Forest Protection, Chair of Silviculture, TU Dresden, 01737 Tharandt, Germany
*
Author to whom correspondence should be addressed.
Submission received: 14 April 2022 / Revised: 13 May 2022 / Accepted: 22 May 2022 / Published: 24 May 2022
(This article belongs to the Special Issue Enhancing the Productivity and Sustainability of Pine)

Abstract

:
Current management strategies for European Scots pine (Pinus sylvestris L.) forests are oriented towards the use of natural regeneration processes. They aim to maintain continuity of stand structure by preserving seed-producing and shelter trees at varying densities. Soil scarification techniques may be employed to support the natural regeneration of pine. Our study is based on data from seven study sites in the German lowlands, where the basal areas of the overstorey pine trees varied between 4 and 21 m2/ha. The soil scarification methods ranged from full surface ploughing by tractor or horse through small-scale scarification by cultivators to sites without soil scarification. Differences in the densities, spatial distributions, age structures, and above-ground development of pine seedlings were evaluated. We analysed the spatial interactions between overstorey pine trees and the densities of naturally regenerated pine seedlings as a function of the microsite types using the multitype Strauss hard-core process (MSH) method. The results show a significant decrease in height growth with increasing stand density after a period of 5 years, with seedling density and spatial patterns strongly influenced by soil scarification. The MSH pairwise interaction analyses revealed significant negative effects on seedling densities based on combinations of microsites and overstorey trees.

1. Introduction

After a period during the 20th century in which planting was the preferred method of artificial regeneration [1], current European forest management principles focus on close-to-nature concepts supported by continuous cover forestry (CCF), primarily using natural regeneration and supporting mixed forests [2,3,4,5]. Nevertheless, for a variety of ecological and economic reasons, forest owners must always strike a balance between natural regeneration, direct seeding, and planting [6,7]. Natural pine forests (Pinus sylvestris L.) absent prior anthropogenic influence capable of serving as reference systems, e.g., for forest structures or age class distributions, are rare in central Europe [2,8,9]. Scots pine, a light-demanding species, typically forms mono-layered forests, but Lundqvist et al. [4] noted that there are some examples of multi-layered pine forests. Therefore, silviculturists use different crown thinning systems in Scots pine stands, such as seed tree systems, shelterwood systems, and group or strip thinning systems, aligned with planned natural regeneration [10,11,12]. These thinning systems differ in terms of the corresponding overstorey tree densities, their spatial distributions, and the length of the regeneration periods [13,14]. The chosen thinning system and its characteristics determine the variability in age, growth rate, and spatial distributions of pine seedlings [15,16]. Shelterwood systems with a range from 50 to 400 regularly distributed overstorey pine trees will normally lead to relatively homogenous seedling growth, established over a longer period [17]. In contrast, seed tree systems mostly retain less than 50 overstorey trees [18], which can be distributed heterogeneously across the site [19]. All of the thinning systems mentioned provide the option to establish other tree species, in particular deciduous tree species, as admixtures [20,21].
Natural regeneration of Scots pine has a long tradition, in particular in areas where there were once high proportions of this species and suitable site conditions prevail [1,20,22]. The overall success of regeneration using natural regeneration methods is typically determined by various environmental factors [23]. Taking current climate change projections into account, it can be assumed that the influence of environmental factors will increase the uncertainty surrounding the silvicultural measures undertaken to promote natural regeneration [5,24,25]. The spatial impacts of ecological factors and the silvicultural methods determine future forest structures, influencing all stages in the life cycle of flora and fauna [2,26,27]. The first processes and development stages in the regeneration cycle in particular, such as flowering, seed production, and seed dispersal, are strongly related to weather conditions and are only indirectly controllable by silvicultural measures determining seed tree density, vitality, and spatial distributions [12,23,28]. For example, the individual growth space of overstorey pine tree crowns can be regulated continuously by crown thinning to preserve tree vitality. Such thinning methods increase the potential for flowering and seed production, but these conditions are superseded by weather conditions, such as temperature, drought, or heavy rain [29,30]. Furthermore, the dispersal of mature Scots pine seeds is strongly influenced by wind speed and wind direction [31]. It is known that the result of the anemochorous dispersal of pine seeds is spatially limited, with mean dispersal distances between 20 m and 50 m, but mostly less than 30 m [32,33]. This is also important for the evaluation process used to determine the densities of overstorey seed trees [34]. Once seeds reach the ground, overstorey trees act as a facilitative shelter against strong solar radiation and reduce direct heat or frost events, but shelter trees also compete with the surrounding ground vegetation and seedlings for water and nutrients [35]. The availability of light is only moderately reduced by the shelter of Scots pine trees compared to the conditions beneath shade-tolerant tree species [36,37,38]. The competition exerted by overstorey or shelter trees may impact disadvantageous types of ground vegetation like grasses or ferns, favouring pine seedlings [28]. Other identified spatial zones of influence, especially of individual overstorey pine trees, relevant for pine seedling growth and survival are root plate zones [34,39,40,41]. According to Karlsson & Örlander [23], it is necessary to improve our knowledge of how seed trees affect their surroundings and interact with ground vegetation and seedlings [42].
Forest practitioners use different soil scarification methods to establish suitable safe site conditions for pine seedlings by reducing the competition pressure exerted by ground vegetation [23,43,44]. The timing and choice of the soil scarification technique determine the vertical machining depth in the upper soil layer, the intensity of soil substrate mixing, and the spatial patterns of the competing ground vegetation [45]. The techniques most frequently used in forests differ in the proportions and sizes of the scarified areas. For example, cultivators establish small patches consisting of hollows and mounds [36,46,47,48], whereas ploughs or disc harrows pulled by horses or small tractors produce furrows and mounds across the entire stand area [14]. The proportion of the surface area that is prepared when using a cultivator with a working distance of 2 m to 3 m usually extends from 12% to 18% [47]. The creation of plough strips results in exposure of the mineral soil on 20% to 27% of the area, depending on the working width of the ploughshare and the strip spacing [36]. When plough strips are used, the exposed mineral soil can increase from 50% to 70% of the area, if the areas folded-over soil are also included in the calculation. The various soil scarification measures are used to increase seedling densities and to optimise the spatial distribution of seedlings for better growth conditions, such as increased soil temperatures and soil porosity, and altered nutrient conditions [49,50]. Small-scale heterogeneity can also be increased by the newly created microrelief [43,50].
The focus of this study is on the effects of silvicultural approaches adopted to regulate overstorey trees and microsite conditions. The following hypotheses were derived:
(1)
The most important density and growth parameters in Scots pine seedlings can be controlled by overstorey tree density or the basal area of pine stands;
(2)
Soil scarification increases pine seedling densities by reducing the competition pressure exerted by unfavourable ground vegetation types;
(3)
The small-scale patterns of varying densities of pine seedling distribution are strongly affected by the spatial distributions and interaction radii of the overstorey pine trees in combination with the prevailing ground cover species and microsite types.

2. Materials and Methods

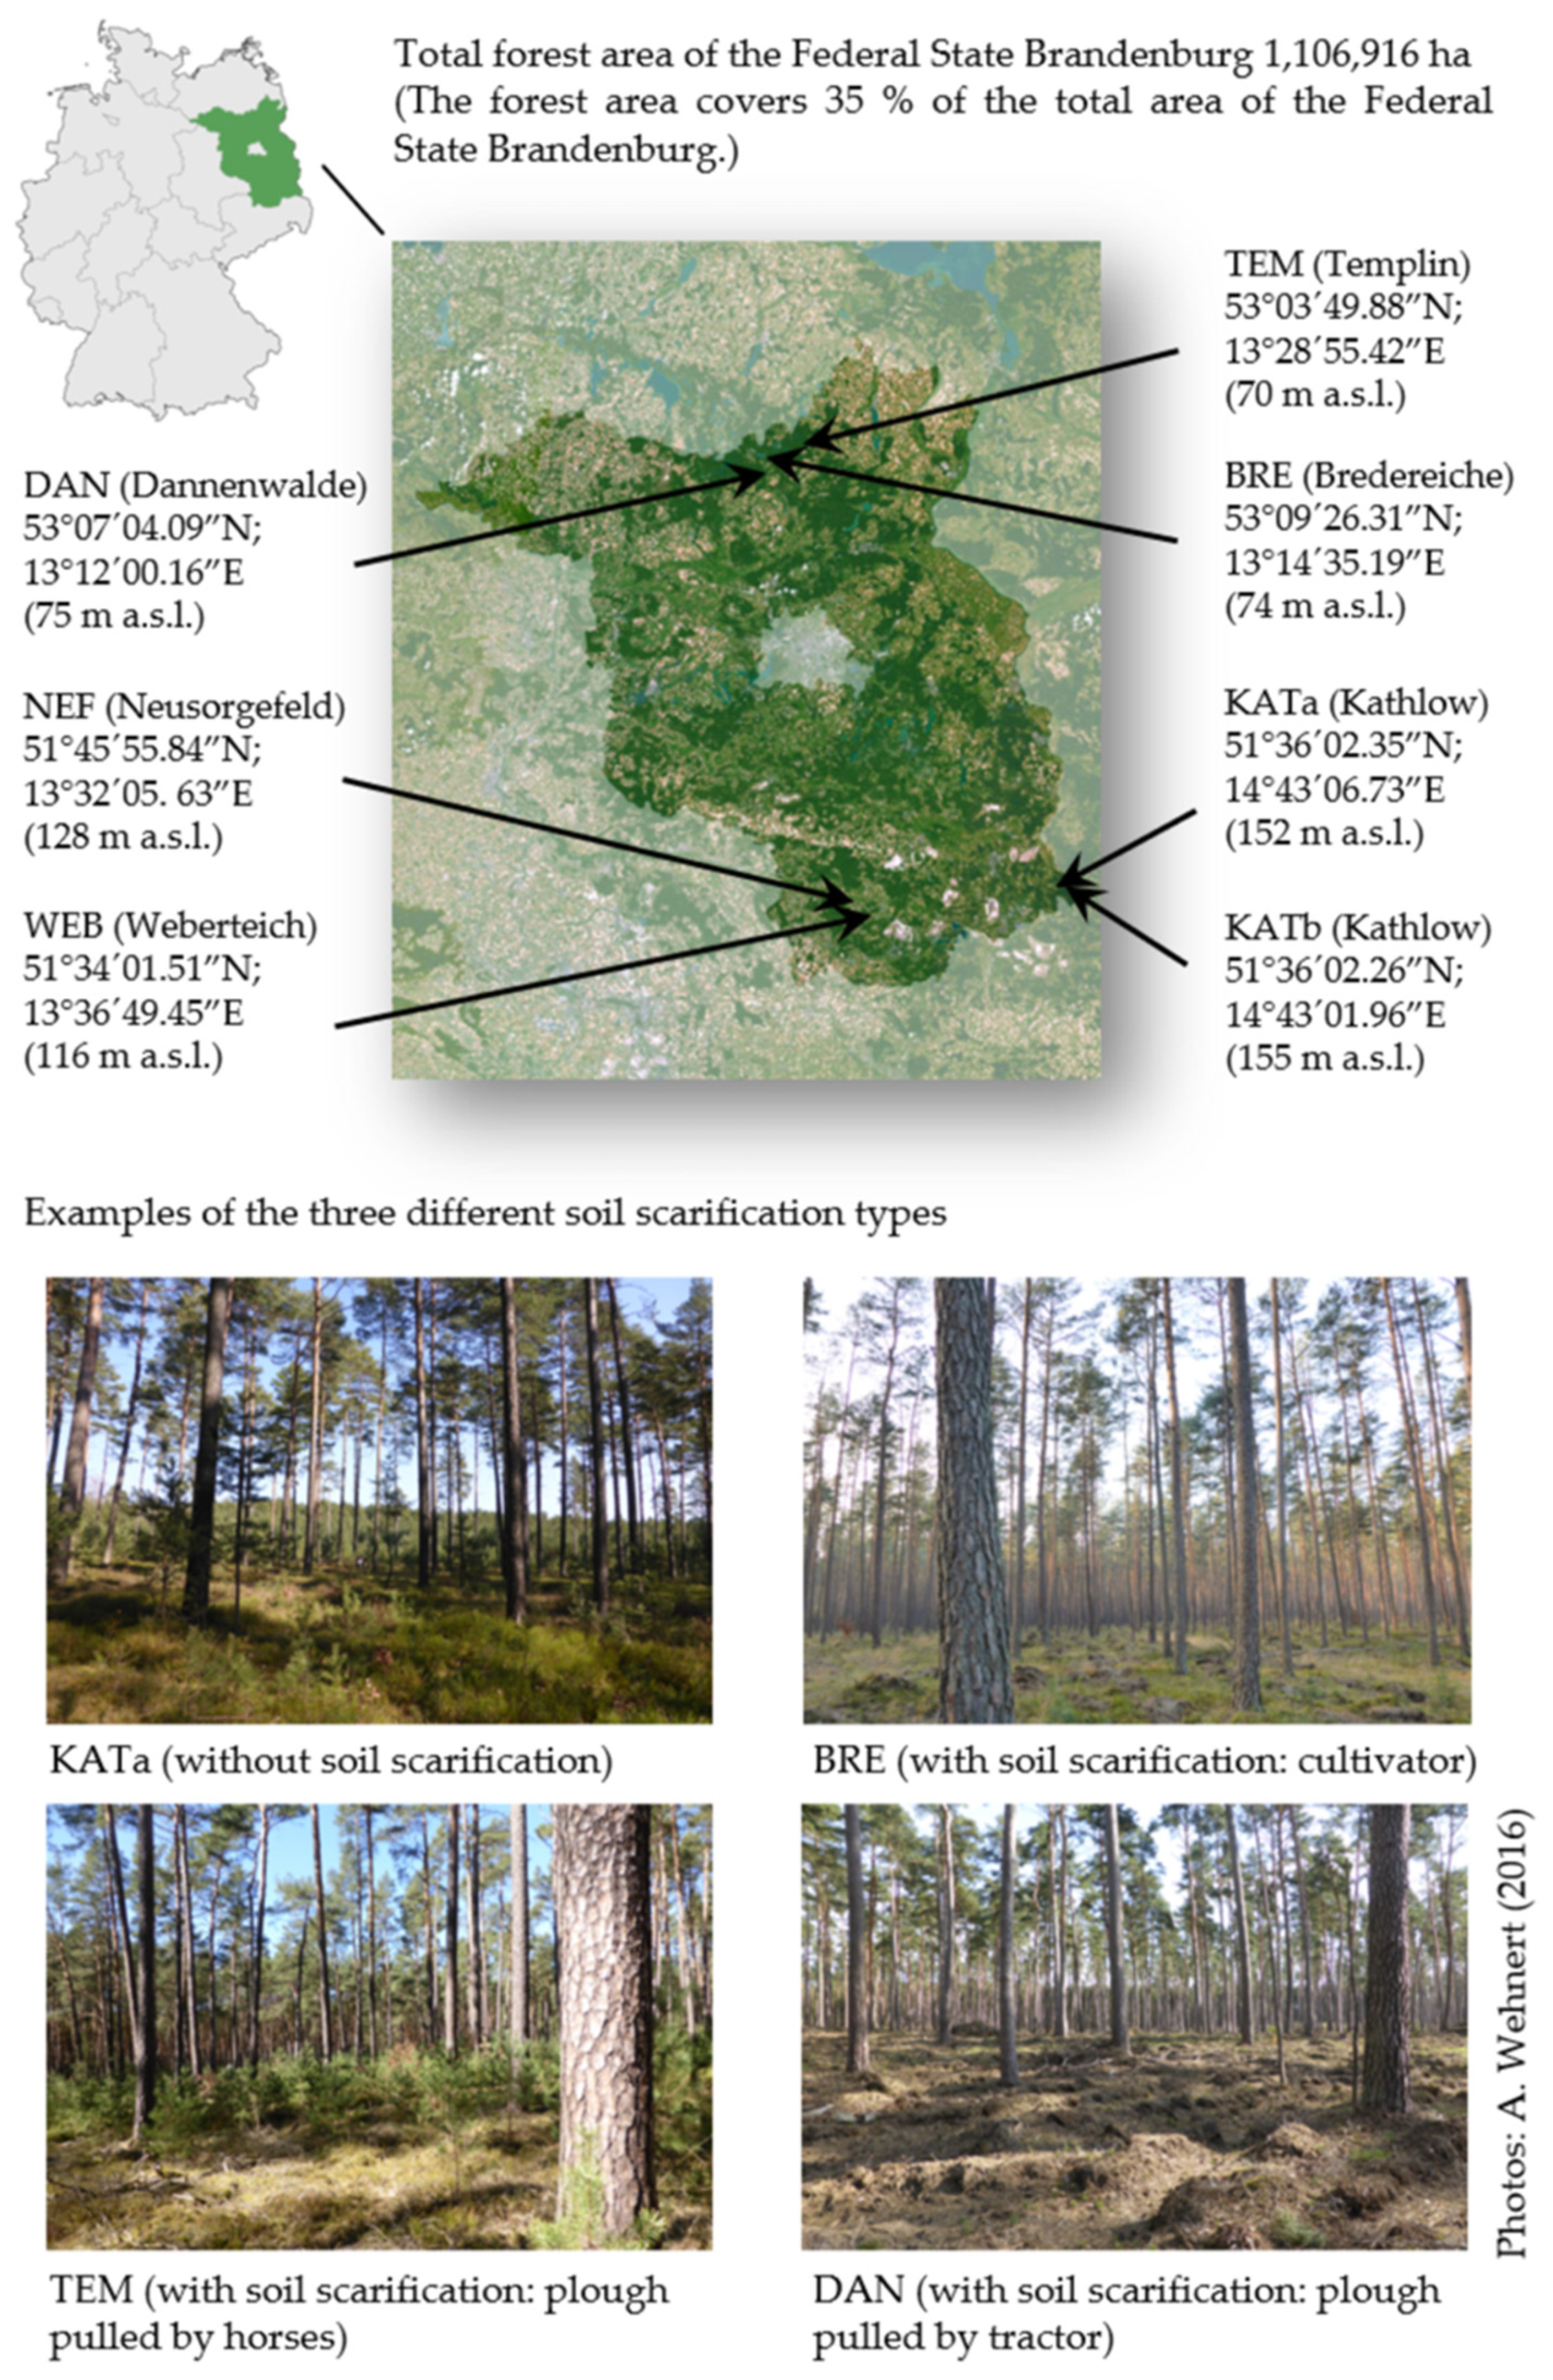
2.1. Study Region, Sample Design and Tree Characteristics

The study was carried out in the Federal State Brandenburg, which possesses the highest proportion of Scots pine in Germany. The total area of Scots pine is 734,845 ha, representing a relative proportion of 70% of the total forest area [51]. To the north of the state, the relative proportion of pine stands is lower, at 62.5%, whereas to the south the proportion reaches 77.2%. The whole region is characterised as lowland with mostly poor and sandy soils. All of the chosen study sites were situated between 70 m and 155 m above sea level (Figure 1). The long-term annual precipitation data indicate precipitation in the northern part of the region between 607.8–642.5 mm per annum and between 603.9–670.6 mm in the southern part. The mean annual temperature is 9.0–9.4 °C in northern Brandenburg and 9.2–9.6 °C in the south [52].
All of the chosen study sites were intensively managed and contained the skid trail systems prescribed in the silvicultural management framework directive of the Federal State Brandenburg [53]. Three pine stands were chosen as study sites in the northern part, hereafter referred to as DAN (Dannenwalde), TEM (Templin), and BRE (Bredereiche) (see Figure 1). The four study sites NEF (Neusorgefeld), WEB (Weberteich), and KATa,b (Kathlow) were representative of the forests of the southern part of the state. The chosen pine stands were characterised by mono-layered and even-aged stand structures absent other tree species. The overstorey pine trees were at least 100 years old at each site (Table 1). The stand areas ranged in size between 1.9 and 13.8 ha. Two study sites (KATa, WEB) had a tree density of fewer than 50 trees per ha, three sites (NEF, TEM, DAN) had a medium overstorey tree density (90–160 pines per ha), and on two study sites (KATb, BRE) the tree density was relatively high (230–310 pines per ha). The mean tree heights ranged between 20.2 m and 28.0 m.
The measurements were done using a nested sample design with an area of 50 m × 50 m for the overstorey pine trees, whereas the pine seedlings and saplings were recorded on plots with sizes of 30 m × 30 m, with the exception of the sites BRE and DAN, which were characterised by extremely high seedling densities. There the dimensions of the regeneration plots were 15 m × 15 m. The nutrient supply of the soils may be considered poor for all study sites and the water supply moderate. Three categories of soil scarification occurred on the study sites. The first category, applied on four study sites (KATa,b, WEB, NEF), involved no soil scarification. Here the soil surface layer was dominated by typical ground cover types [42], such as undisturbed pine litter or a humus layer and ground vegetation consisting of mosses (e.g., Dicranum scoparium Hedw., Pleurozium schreberi (Brid.) Mitt., Hypnum cupressiforme Hedw. s. str.), grasses (e.g., Deschampsia flexuosa (L.) Trin., Calamagrostis epigejos (L.) Roth), shrubs (Vaccinium vitis-idaea L., Vaccinium myrtillus L., Calluna vulgaris (L.) Hull), or herbaceous plants (Rumex acetosella L., Stellaria media (L.) Vill., Ornithopus perpusillus L.). The second category, where the soil surface was scarified by ploughs pulled either by horse (TEM) or tractor (DAN), was represented by two sites. The study site BRE belonged to the third category of soil scarification. Here a cultivator prepared small patches 0.5 m × 1.0 m in size and to a depth of 0.10 m [47].
As a consequence of the different overstorey tree densities combined with the different soil scarification techniques, the following specific types of microsites were created: (m1) undisturbed areas within the stand dominated by ground cover, (m2) skid trails, (m3) skid trail borders, (m4) hollows or furrows, (m5) mounds, and (m6) ground cover-dominated stand edges.
To facilitate spatial analyses (see Section 2.2 below) including both overstorey trees and seedlings, the polar coordinates were measured using a laser-dendrometer (type TruPulse 360R) with a degree of precision to within 0.5° for direction and 0.2 m for distance. The polar coordinates were converted into x- and y-coordinates (Cartesian coordinates). The overstorey pine trees were characterised by parameters such as tree height, vertical and horizontal crown dimensions, and the diameter at breast height (dbh). The age was determined for all the naturally regenerated young trees. The heights of juvenile plants and their vertical and horizontal crown dimensions were recorded using a folding rule to 0.1 cm. The root collar diameter (rcd) of each plant was recorded at the soil surface with a calliper, to 0.1 mm [54]. As was mentioned, the specific ground vegetation and microsite types were recorded directly in the vicinity (5 cm radius) of each juvenile plant. Age-dependent microsite effects or interactions could be checked in this way.

2.2. Statistical Analyses

We analysed the age-dependent growth of pine seedlings using linear (rcd~height) and non-linear regression (age~height) models, including all trees up to 10 years of age. The relationship between the overstorey condition, represented by basal area, and seedling growth parameters, and the differences in seedling growth, were analysed using the non-parametric Mann–Whitney and Kruskal–Wallis tests [55]. The commonly used seedling growth variables slenderness, live crown ratio and crown profile facilitated further interpretation of site-specific growth dynamics [54,56].
We used spatially explicit, but relatively simple indices to adapt silvicultural measures. The reason for this was that these simple indices can be readily implemented in forest practice, and they are helpful for comparisons between different types of silvicultural management [26]. We used the widely known procedure of nearest neighbour distances to calculate the aggregation or clumping index R (hereinafter referred to as RCE) to identify the spatial patterns of seedlings and overstorey pine trees, not only in their functions as seed sources but also as competitors of pine seedlings [57]. The aggregation index RCE was derived from the observed distance to the nearest neighbour plant (robs) in relation to the mean estimated distance (rest) based on a random (Poisson) distribution [58].
R C E = r o b s ¯ r e s t ¯ ,   0   R 2.15
The aggregation index RCE was substantiated by the following scale for interpretation [57,59]: RCE = 1 (random distribution), RCE < 1 (aggregated or clumped distribution), RCE close to 0 (strongly aggregated or clumped distribution), RCE > 1 (regular distribution), and RCE close to 2.15 (strongly regular distribution). We calculated the individual growth space of pine seedlings using Delaunay triangulation and the centroidal Dirichlet or Voronoi tessellation (hereinafter referred to as TESS) using Lloyd’s algorithm as part of the r-package ‘deldir’ [60]. Our analysis tested the assumption that an increase in seedling density leads to an immediate reduction in the growing space occupied by individual seedlings. However, detailed information about different spatial scales is missing from the aforementioned spatial indices [26,61]. Point pattern analyses and related model approaches were applied to accommodate for this (see below).

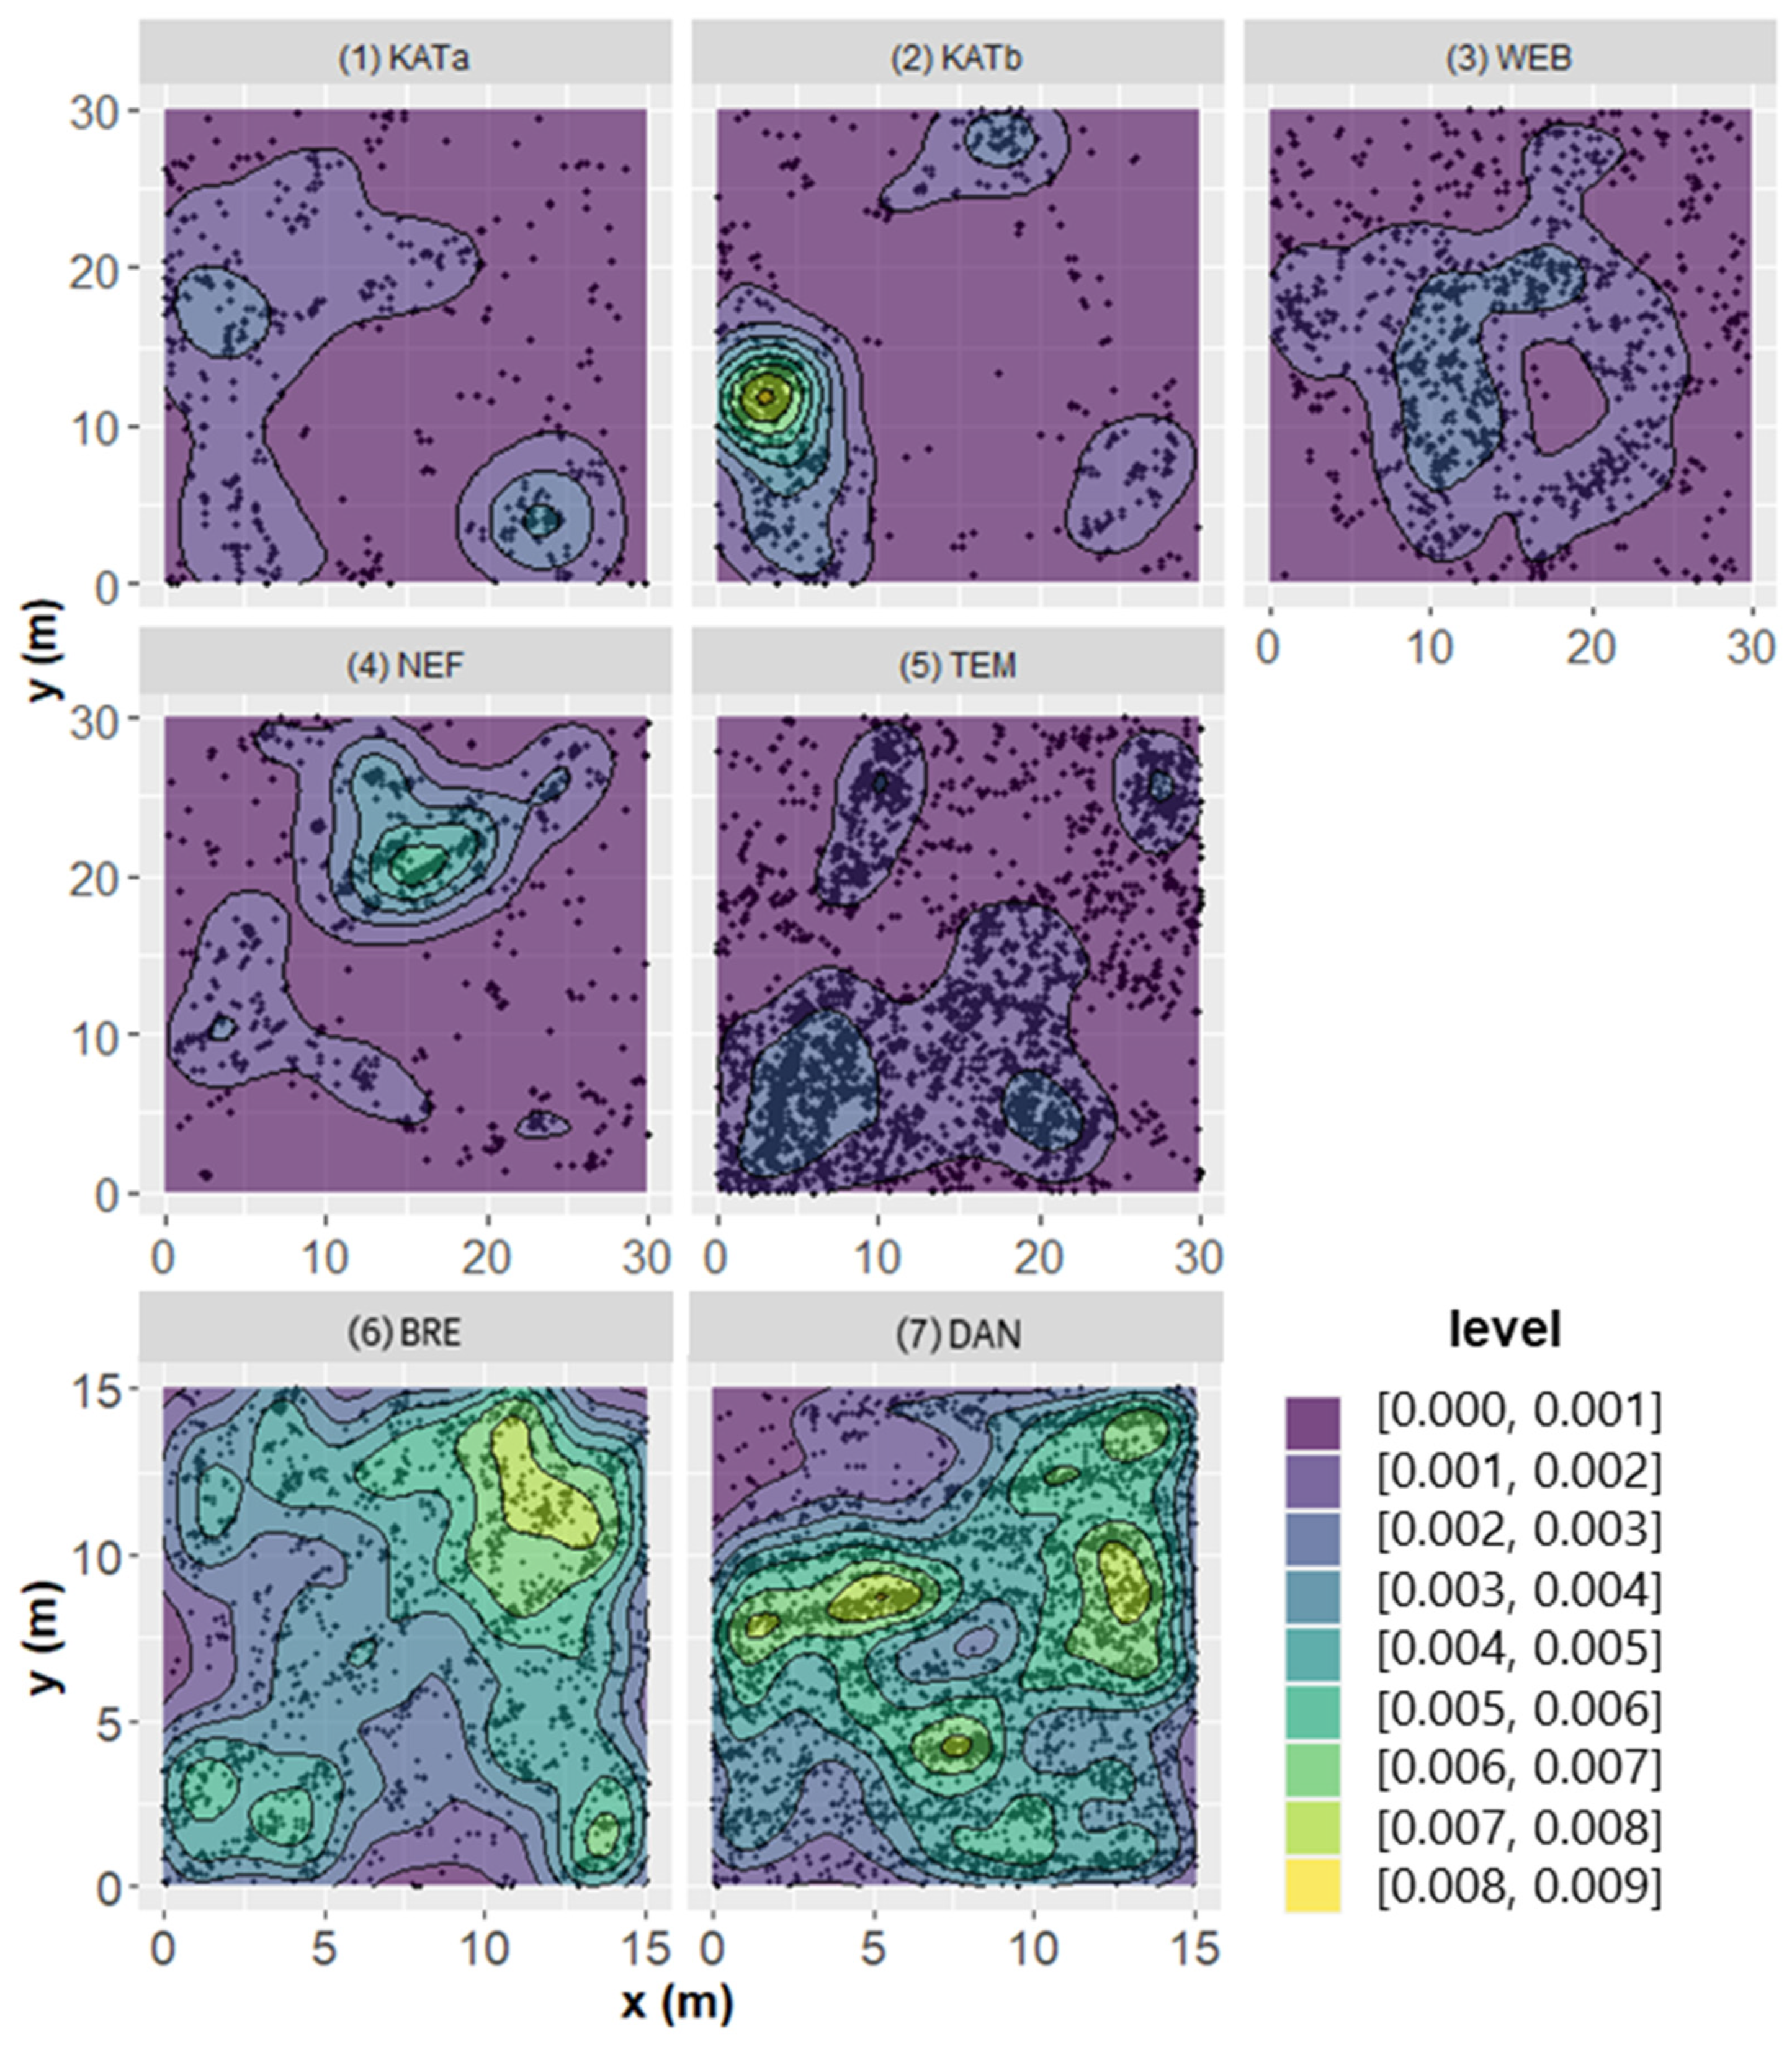
2.2.1. Point Pattern Analysis

The general technique used to describe the spatial patterns of pine regeneration was spatial point process analysis [62,63,64]. A prerequisite for analyses of this kind is a common observation window (see description of plots) for the different data, e.g., point data of old pine trees, of seedlings, and covariates. The covariates measured to describe the environmental conditions confronting the seedlings were the microsite types described before (six classes m1–m6, see Section 2.1). The information about the microsite types was taken from the seedlings’ locations and spatial smoothing was performed. As the microsite information is categorical, the bandwidth was set to zero when smoothing. Thus, kernel smoothing becomes mathematically equivalent to nearest-neighbour interpolation. The smoothed information was stored in image files.

2.2.2. Modelling

In spatial point pattern statistics, the terms ‘intensity’ and point ‘density’ are both used to characterise the number of points per unit of area (p. 175 [62]). Prior to modelling the density of pine seedlings, the spatial point pattern of the pine seedlings as such had to be described. The effects of the covariate and the interaction between overstorey pine trees and seedlings were assessed individually.
The density of pine seedlings was determined using the following equation (p. 80 [62])
λ ^ = N ( W ) ν ( W )
where N ( W ) is the number of pine seedlings in the observation window and ν ( W ) is the area of the window. In addition to the question of mean pine seedling densities, our analyses addressed the spatial patterns of pine seedlings throughout the window.
Modelling pine seedling intensity to test our hypotheses (see introduction), we assumed the individual point process of a single plot to be inhomogeneous, or non-stationary. We sought to analyse a spatial trend caused by environmental covariates (microsite types) and by the effect of the overstorey pine trees on the seedlings. We did not account for an internal process of clustering within the seedling cohort, i.e., point interaction. However, inhomogeneity and clustering may be related [64].
In each plot, the intensity λ is inhomogeneous across different locations but is a different, random value in different plots. We assumed that the log-intensity is a normal random variable.
An important step in the analysis of a non-stationary point process is building a function ‘ ρ ’, which provides information on how the intensity of points depends on the value of a covariate, e.g., ‘ Z ’. Thus,
λ ( u ) = ρ ( Z ( u ) )
where Z ( u ) is the value of the covariate at the location u .
As we attempted to assess the effect of both the covariate ‘microsite type’ and of the overstorey pine trees on the seedling intensity simultaneously, we understood the underlying process to be a Gibbs point process. Gibbs point processes are an important model class that exhibits dependence between points (chapter 13 [64]). They are typically best suited to modelling spatial inhibition (pp. 138, 157, 171 [62]). In our case, the interaction between the points, i.e., between the positions of the old pine trees and the positions of the pine seedlings, is crossed, meaning that we aimed to model dependence between two types of points in a multitype spatial point process. We chose the ‘multitype Strauss hard-core point process model’ (MSH) as a hybrid of the multitype Strauss process (MS) and the multitype hard-core process (MH) to represent the interaction.
The model was evaluated within a generalised linear model (GLM) framework with the intensity function
λ ( u | X ) = e η Τ   Z ( u ) + φ Τ T ( u , X )
with λ ( u | X ) being the conditional intensity and X a spatial point process. The function Z ( u ) is specified by the trend formula and T ( u , X ) is specified by the interaction argument. η and φ are canonical parameters.
In a multitype Strauss hard-core point process model (MSH) it is necessary to specify the irregular or nuisance parameters such as the pairwise interaction distance. The interaction distance of the Strauss part of the model was given by prior knowledge, taking into account the fact that the statistical theory for estimating such parameters is not really clear (p. 516 [64]). We assumed an interaction distance of 2.5 m, which is roughly the lower limit used in previous modelling of the effects of overstorey pine trees on regeneration, and corresponded to the mean crown radius of the overstorey pine trees in all our study sites [34,65]. The pairwise interaction parameter of the multiple hard-core process (MH), however, was estimated using the maximum profile pseudolikelihood method (p. 518 [64]). Computations were performed using the package ‘spatstat’ (2.2-0) in R (4.1.1).

3. Results

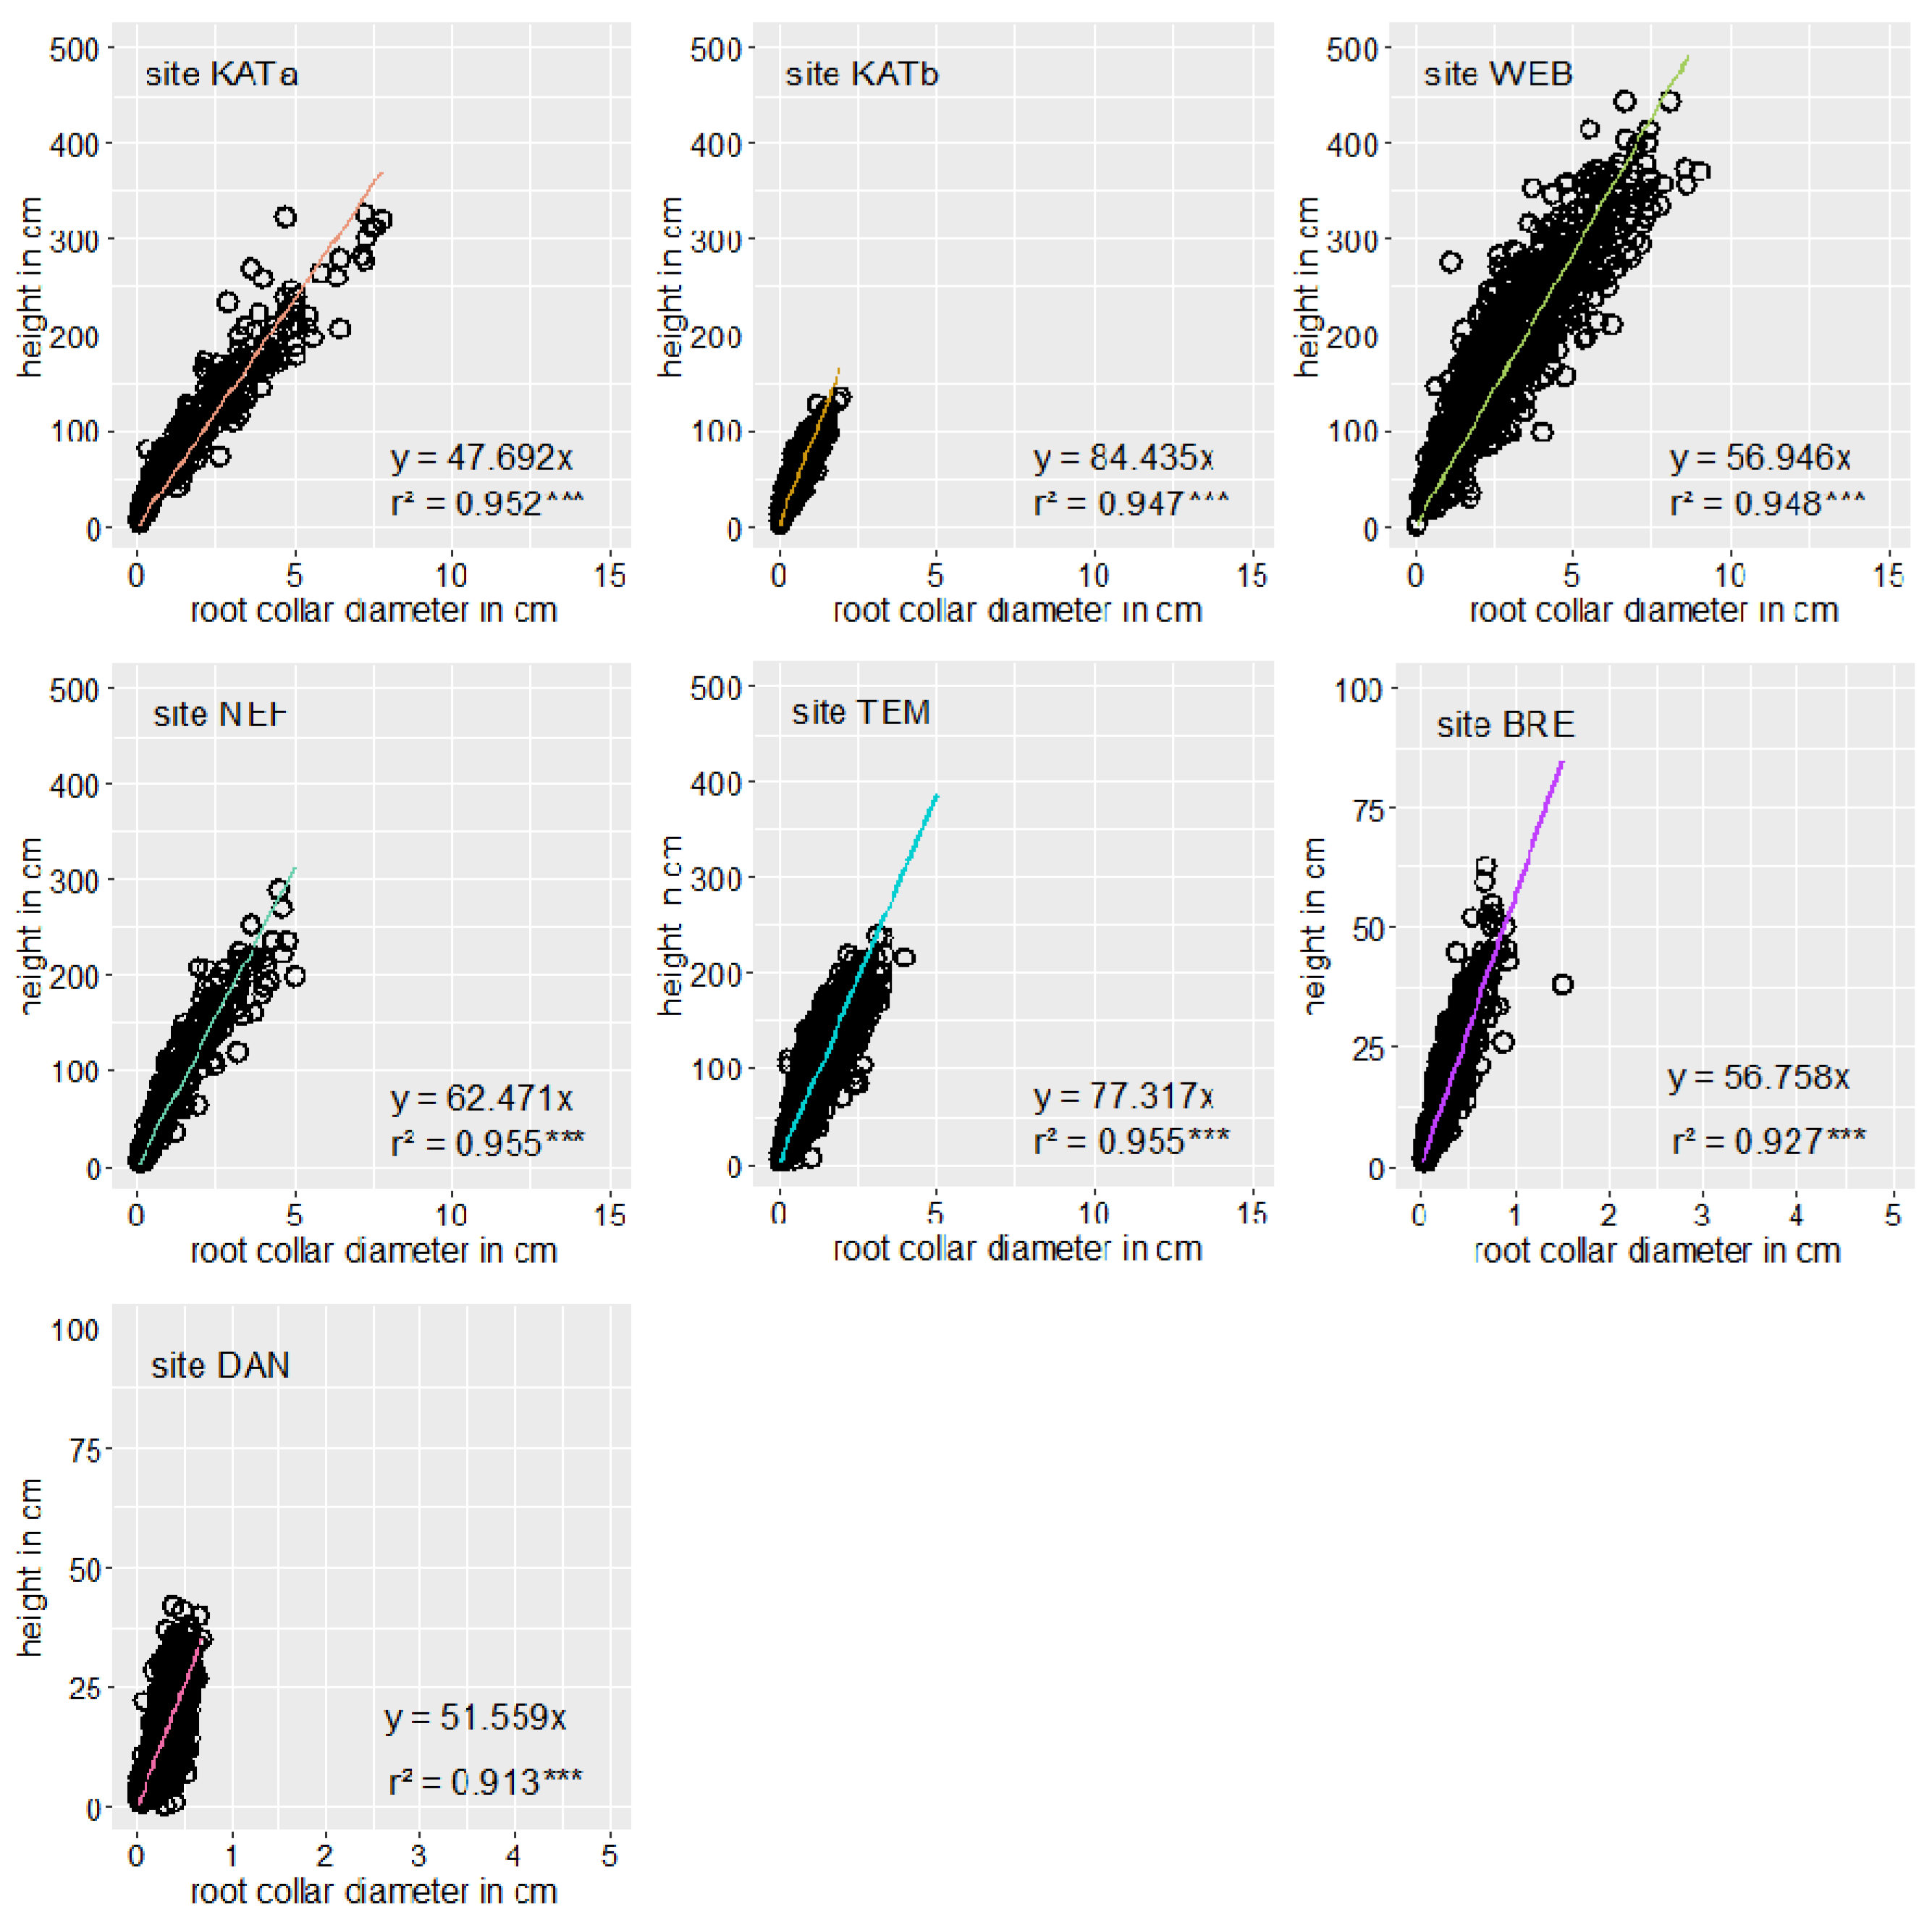
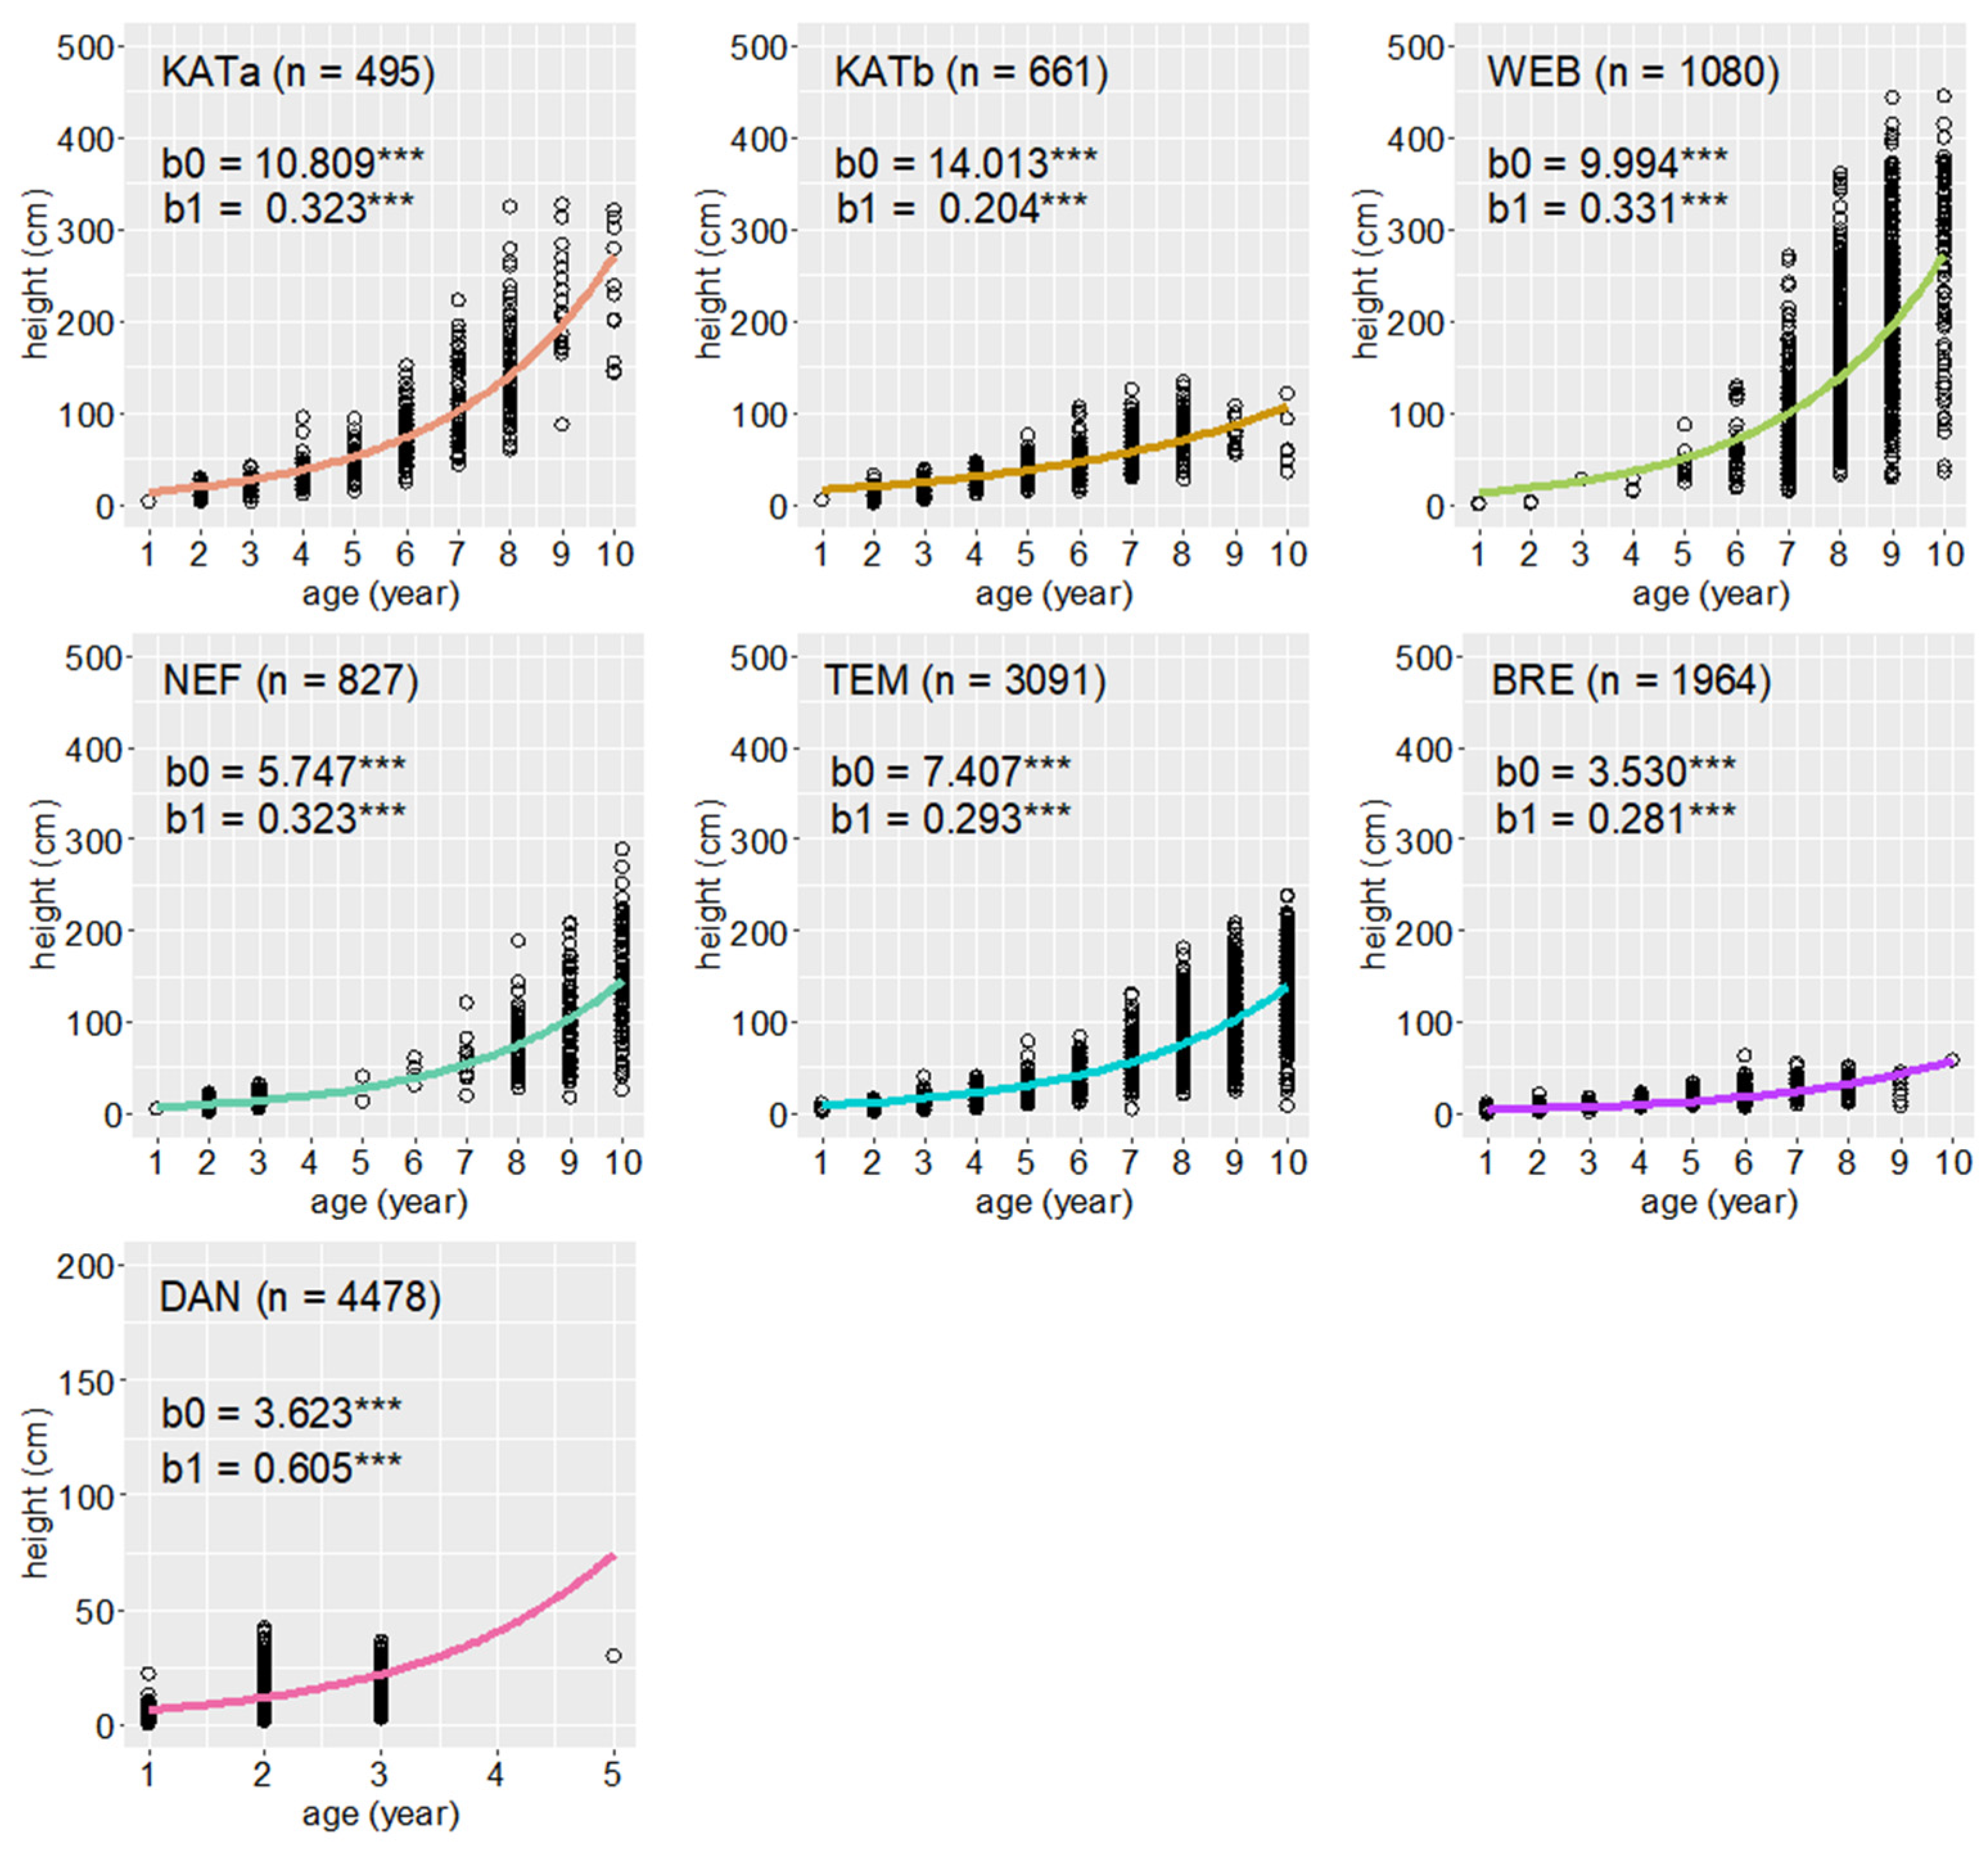
3.1. Densities and Growth Characteristics of Pine Regeneration

The seedling densities ranged between 5900 and 199,070 plants per hectare, with higher densities recorded on the study sites TEM, BRE, and DAN, where soil scarification occurred. The overarching consideration of microsite types across all stand types and age groups of seedlings revealed only weakly significant differences between seedling densities (Kruskal-Wallis, df = 5, p ≤ 0.49). Mean seedling age values of between 5 and 8 years were recorded on five study sites. Only on the sites BRE and DAN were the seedlings considerably younger (Table 2). However, the coefficient of variation illustrates the highest variations of seedling ages on the sites KATb, BRE, and NEF. The maximum proportion of seedlings older than 10 years was 13.2% on the site NEF.
Due to their higher mean ages, the seedlings at the site WEB had the highest values of the growth parameters height, rcd, crown length, and diameter, followed by the seedlings on site KATa (Table 3). Pine seedlings there exhibited higher growth than the seedlings on the sites KATb and TEM with comparable mean ages. The pine seedlings on the sites KATb and TEM were characterised by higher mean values of slenderness, 10.47 and 8.20, respectively, whereas live crown ratios were highest on the sites KATa (64%) and WEB (67%).
The crown profile values showed that for all pine seedlings, the crown lengths were higher than the crown diameters, but this relationship was particularly pronounced on the sites KATb (2.6) and DAN (2.7). The relationships between rcd and seedling height could be described as highly significant (p-value ≤ 0.000) by linear functions (Figure 2). As was mentioned for the variable slenderness, the increase to the total seedling height represented by the linear function was highest for pine seedlings on site KATb (a = 84.435, r2 = 0.947, p-value ≤ 0.000), followed by site TEM (a = 77.137, r2 = 0.955, p-value ≤ 0.000).
The age-dependent height growth functions (Figure 3) were highly significant (p-value ≤ 0.000) for pine seedlings between 1 and 10 years of age on all study sites. The slopes of the curves characterise the steep increase of height growth on the sites KATa and WEB. After 10 years of development, juvenile pines on these two sites reached mean heights of 230 cm and 257 cm, respectively. In contrast, pine seedlings on the site BRE exhibited a very low increase in height growth with increasing age. This becomes clear based on the significant differences between the heights of pine seedlings older than 5 years on the site BRE compared to all other study sites (Mann-Whitney test, p-values ≤ 0.001). One-year-old seedlings exhibited comparable height growth across all study sites (Mann-Whitney test, p-values > 0.05). It appears that seedlings of the same study site exhibit greater variation in their individual height growth with increasing age (Figure 3).
It could be demonstrated that most of the variables relevant for pine seedling growth were directly correlated with the basal area of the overstorey pine trees. These correlations become effective with pine seedling ages of 5 years and upwards, as shown in Table 4.
The strength of the correlation and the level of significance increased concurrently with increasing ages of the seedlings. The slenderness of pine seedlings was significantly correlated with the basal areas of overstorey trees only for pine seedlings 10 years of age.

3.2. Density, Spatial Distribution and Growth of Pine Seedlings Relative to Ground Vegetation and Microsite Type

It was assumed that the establishment of pine seedlings and their spatial distributions are determined by overstorey trees, microsite conditions, and natural processes. The small-scale spatial patterns of pine seedling densities on the sites reflected the courses of skid trails and the particular soil scarification technique (Figure 4). The frequency and seedling-related proportions of microsite types differed between the study sites in spite of comparable stands or soil preparation. The most frequent vegetation types representing the typical microsite type in zones without soil scarification were pine litter (77.0%) and mosses (59.5%). The sites without soil scarification were dominated by Vaccinium vitis-idaea (42.5%) and Vaccinium myrtillus (31.4%). More than 90% of the pine seedlings on the site BRE grew in pine litter, in moss on site TEM and amongst Vaccinium spec. on site KATb. The highest coverages of mosses were recorded on the sites KATb (67.7%), NEF (62.3%), and TEM (62.0%). The ground cover around seedlings on the site DAN was predominately mineral soil (59.8%). The highest proportions of pine litter cover were observed on the sites WEB (62.4%) and KATa (50.6%). Pine seedlings were found only sporadically amongst all of the other vegetation types, at proportions of between less than 1% and 9%.
The calculated RCE confirmed the basic tendency to aggregated/clumped pine seedling distributions on all study sites, with all microsite types included. The strongest aggregations, with a RCE of approximately 0.6, were identified for the sites KATa, KATb, and NEF without soil scarification (Table 5). The lowest tendency towards seedling aggregation (RCE = 0.8) was found on site DAN, where the soil was scarified over the entire area using a plough pulled by a tractor. The resulting RCE values show strongly aggregated seedling distributions (RCE 0.2–0.3) along skid trails (m2, m3), stand edges (m6), and on the small hollows or mounds created by the cultivator (m4, m5) on site BRE (Table 5).
The mean growth spaces occupied by individual pine seedlings revealed tendencies toward certain site and microsite conditions. The growth spaces of individual pine seedlings were very small on the sites DAN and BRE. Pine seedlings on the sites KATa and KATb occupied the largest mean growth space per seedling. The linear regression models revealed significant relationships between the growth space occupied and the overall growth of pine seedlings (Table 6). An increase in the values of the various growth parameters led to an increase in individual seedling growth spaces and vice versa.
Taking into account the fact that microsite type affects the early growth of pine seedlings, the results of the statistical analyses underlined the significance of the differences in pine seedling development between microsite types (Kruskal-Wallis, df = 5, p ≤ 0.000).
Further analyses of microsite type without scarification (m1) revealed that only on pine litter did the density of pine seedlings decrease significantly with an increasing basal area of the overstorey pine trees (a = −1.323, b = 59.076, r2 = 0.734, p-value = 0.029). The more age-specific analyses illustrated significant relationships between the ground vegetation or ground cover types as part of m1 and the presence of pine seedlings (Table 7). The linear regressions were used to check the relationships between seedling age and the cover of the most frequent ground cover types as part of m1.
The proportion of moss as ground cover type decreased significantly with the increasing age of the pine seedlings, whereas the cover of pine litter and both Vaccinium species increased with increasing seedling age.

3.3. Effects of Overstorey Trees and Microsite Conditions on Regeneration Density

The final step in the analysis was to combine the effects of overstorey trees and the six microsite types (m1 to m6) determining the presence of pine seedlings on small spatial scales. The following maps generated from the empirical microsite information illustrate the individual spatial distributions of microsite types for each study site (Figure 5).
The graphic displays an extensive expanse of areas without scarification (m1) on the sites KATa, KATb, WEB, NEF, and TEM, with some patches characterised by stand edge conditions and skid trails. The highest spatial heterogeneity of microsite types was found on site BRE, scarified by the cultivator. The microsite structure on site DAN was clearly divided into linear courses of furrows (m4) and mounds (m5) as a result of scarification by the plough. Significant interactions between overstorey pine trees and different growth parameters of pine seedlings were already demonstrated (see Section 3.1, Table 4), but to prove the relationships on a spatial level we applied different pairwise interaction functions (see Table 8). The intensities of overstorey pines and pine seedlings ranged between values of 0.004 and 0.03, and 0.49 and 15.8, respectively. Different radii were applied in the two functions to represent interaction. In the non-stationary multitype Strauss (MS) process a value of 2.5 m was applied for all study sites (see methods). The interaction radii of the multitype hard-core (MH) processes were estimated to much smaller values between 0.1 m and 0.5 m using the maximum profile pseudolikelihood method.
The following graphs depicting overstorey tree effect zones (Figure 5) underline the results of the multitype Strauss hard-core process calculations (MSH) in Table 9. These effects were particularly evident on study sites with few trees (KATa, WEB, and NEF). With the exception of the site WEB (Table 9), the skid trail microsite type (m2) exhibited the highest pine seedling intensities compared to all the other microsite types (m1, m3 to m6). The parameters of the hollows or furrows microsite type (m4) revealed higher seedling intensities than for the mounds microsite type (m5) on the scarified sites DAN and BRE.
The MSH calculations produced negative parameters for the interactions between overstorey trees and seedling densities for all sites except DAN (Table 9). All were highly significant (p-value = 0.000). However, the parameters of interaction between overstorey pine trees and seedlings were of varying intensity. With the exception of the site KATb, the observation that the higher the seedling intensity of microsite type with undisturbed soil conditions (m1), the lower the interaction parameter, holds. Thus, when favourable ground conditions prevail, indicated by high seedling densities, the additional effect of the overstorey trees on seedling density is low. There was no interaction effect of microsite and overstorey trees on the high seedling density on the strongly scarified site DAN.

4. Discussion

4.1. Pine Seedling Density and Growth Affected by Overstorey Trees and Microsites

The silvicultural management of Scots pine stands is based on the combined use of overstorey trees as shelter trees and mature pine trees as seed trees. A higher seed input can be assumed in pine stands with higher basal areas [14,28], but at the same time, the number of cones is strongly related to the crown surface area [66]. This means that continuous crown maintenance is necessary to support seed production. The number of mature trees per hectare must be limited to ensure the free development of crowns, without intraspecific crown competition, to allow for optimal seed production. A highly significant negative relationship between stand density and the number of cones produced per tree was described for longleaf pine (Pinus palustris Mill.) and Aleppo pine (Pinus halepensis Mill.) [67,68]. A moderate 100 mature trees per hectare was declared the most effective stocking density to stimulate cone production in stone pine (Pinus pinea L.) [69]. Our study sites represent a wide range of densities of overstorey trees and, consequently, basal areas. The sites KATa and WEB possessed few overstorey trees (<50 per hectare) so that seedlings could clearly be assigned to a seed tree. The remaining sites were characterised by denser stand conditions (>50 trees per hectare), more typical of shelterwood systems. Overstorey trees act as shelter trees, representative of the highest hierarchical level of vertical forest structures. Shelter or overstorey trees affect small-scale environmental conditions like the climate of the stand interior or the availability of light and water, which is relevant for the germination and growth of seedlings within the lower hierarchical levels [14]. These conditions are also crucial for the species constellations, and their seedling abundance, on the ground and in the midst of different ground cover types [12,70,71]. Experimental studies have shown the rapid and nearly complete recolonisation of the ground four years after soil preparation at clear-felled sites compared to 50% recolonisation of the ground where shelterwood cuts retain 200 stems per hectare [14]. The combination of seed-producing trees and shelter effects are the basic principles of seed tree and shelterwood cuts, the silvicultural systems are mainly used to establish pine seedlings naturally [40,46,72,73]. Clear differentiation between both systems based on the number of seed trees per hectare is not possible because the transition between both systems is usually fluid and adapted to the site conditions [18], but each system follows different silvicultural procedures and management targets. The seed tree system aims to maximise the use of the overstorey trees, followed by very short regeneration periods producing adequate seedling densities [35]. The fast removal of seed trees is recommended, especially on dryer sites, because the seedling growth may decline quickly as a result of competition pressure [18]. There are greater risks inherent in the seed tree system should natural regeneration fail due to extremes of weather, a lack of fructification, or the rapid establishment of expansive ground vegetation [6,74]. The silvicultural options available to control the growth of seedlings by manipulating the remaining seed trees are also low. In contrast, the shelterwood system guarantees a continuous input of sufficient seeds under favourable micro-climate conditions, while depressing the expansion of competing ground vegetation [14,28]. The densities of between 5900 and 199,000 pine seedlings observed per hectare indicated that, on the basis of the regional silvicultural targets for natural pine seedling regeneration densities, regeneration was successful on all study sites [46]. However, the fact that the age of the seedlings differed between the sites must be taken into account. On the sites BRE and DAN especially, with the youngest pine seedlings, significant mortality rates can still be expected. Taking all of our study sites and the observed seedling ages into account, the pine seedling densities on the microsite type representative of stand conditions without soil scarification (m1) showed no significant relationship between basal area and seedling density. The seedling densities in these areas were significantly influenced by the specific ground cover and microsite types [36,46,71]. Typically, the quantity of pine litter increases with increasing stand density or basal area [75], but overall, the pine seedling densities observed were only slightly related to increasing proportions of litter or moss [21,28]. An increase in the proportions of both Vaccinium species was significantly negatively correlated to pine seedling density and hampered the early process of pine seedling establishment [21,76,77,78]. This accords with the findings of previous studies that have mentioned the great importance of soil scarification on sites dominated by Vaccinium species [23]. Apart from the above-ground competition, the main part of the root zone of Vaccinium myrtillus extends to 30 cm [42], creating considerable below-ground competition. However, interactions between seedling density and the microsite type without soil scarification (m1), dominated by different ground covers, become more explicit when the age of seedlings is taken into account. It could be shown that older seedlings grow in ground cover types dominated by pine litter and Vaccinium species significantly more often than younger seedlings. It should be noted that seedlings of higher ages directly shape their surroundings, whereas seedlings with an age of only 1 or 2 years are representative of the current ground cover and microsite conditions [79]. Hence, these small-scale conditions can be interpreted as safe sites [80,81,82]. Mosses offer advantageous germination and growth conditions but only where there is sufficient precipitation and the shelter effect reduces drying [45].
The coefficients of variation produced by the analyses of the seedling ages, lower on the sites managed employing the seed tree system (KATa and WEB), highlight the theoretical approaches underlying both silvicultural systems. The variation in seedling ages is much higher on the study sites with higher basal areas, the result of longer regeneration periods with the participation of several seed years. Correspondingly, the risks are lower in terms of management [23]. The higher pool of seed trees can be seen as favourable in terms of the genetic diversity and the associated resistance and resilience of seedlings to abiotic and biotic influences [83,84]. By exploiting different seed years, the shelterwood system increases the probability of a more structured natural pine regeneration, which is also shown by the higher variations in the growth parameters. It is well known, however, that it is difficult to establish highly structured and uneven-aged pine regeneration under mono-layered pure pine forests by means solely of the manipulation of the overstorey trees [5]. Continuous, highly structured and uneven-aged forests are not typical of pure pine stands, being a light-demanding, pioneer tree species [8,85]. The development of well-structured pine stands depends on natural disturbances, often combined with soil scarification occurring as a result of fire or windthrow [21,81,86]. Well-known historical analyses of near-natural forest management concepts for pine forests in Germany demonstrated that the increased variation in the structure of pine regeneration achieved solely through periodic overstorey treatment necessitates elaborate, sophisticated management [87,88]. Another study demonstrated that the creation of gaps leads to different seedling densities and modified ground cover conditions [21]. The highest seedling densities were observed within gaps with diameters of 20 m, proving more suitable than gaps with diameters of 40 m and 80 m. It was demonstrated in four different Scots pine forest stands that selection systems should mimic natural disturbances and be focused on a continuous ingrowth of smaller trees [4]. Without soil scarification, heavy reductions of the basal area followed by periods of several decades without thinning are considered beneficial for the creation of multi-layered pine forests.
Our results clearly show the direct effects of overstorey density on pine seedling growth. The findings of the age-dependent analyses demonstrated the strongly reduced height growth of seedlings sheltered by stands with higher basal areas. The strength of the effects on seedling growth was also found to depend on the duration of seedling development under specific stand densities. Although these factors have been identified as being the most important for height growth in pine seedlings, it could be shown that soil scarification increases height growth by 1 m after 10 years of development [18]. A further intensification of soil scarification has been found to lead to reduced seedling height growth [89]. The shelter-dependent differences in total regeneration height can reach 2–3 m after 10 years [36,90,91,92]. A reduction in the annual height growth in pine seedlings has also been documented in the northeast German lowlands [71]. The authors described a mean reduction in annual shoot lengths in seedlings of 50 cm along a basal area gradient of old pine forests between 0 and 35 m2 per hectare. In the first years of development, the seedlings on our study sites exhibited comparable growth parameters, but from an age of 5 years, the influence of the basal area of the overstorey trees could be proven to be significant. Although recent studies have documented changes to the growth of Scots pine strongly linked to climate and site [93], an early culmination in height increment between the ages of 15 and 30 years is typical in the study region and limits any extension of the regeneration timeframe [94]. A strong depression in pine seedling growth was also described for sites in the Netherlands [76], leading to the conclusion that thinning is necessary approximately 5 years after successful seedling establishment in order to avoid growth losses and to maintain vitality. Growth indices like slenderness and live crown radius can also be used to recognise vitality and stability problems in pine seedlings, helping to identify whether the period of high shelter might be proving too long for light-demanding tree species [4,56].

4.2. Supporting Spatially Heterogenous Pine Seedling Patterns

In addition to total pine seedling densities, the spatial distribution of seedlings is also of great importance for close-to-nature silvicultural concepts aiming for higher structural diversity and keeping open the option to integrate other tree species [95]. From studies of natural forests, it is known that regeneration success and the spatial patterns of pine seedlings are strongly dependent on natural disturbances and an abundant seed fall [23], strongly related to the position of adult trees and the prevailing weather conditions [85,96,97]. Those disturbances that create canopy gaps tend to damage unfavourable ground vegetation types like grasses and shrubs (see Vaccinium species above) and generate surfaces dominated by mineral soil, conditions beneficial for the early stages of pine regeneration [21,45]. Under natural conditions, the creation and distribution of these disturbed areas are initiated by random abiotic and biotic processes [8]. Silvicultural management is oriented towards mimicking these processes by creating patches of exposed mineral soil using different technical methods like cultivators or light ploughs with high manoeuvrability pulled by horses. Especially the latter is more in line with the natural and more irregular soil disturbances that often occur, e.g., due to wild boars or windthrows. In principle, light ploughs are used, which do not interfere or do not interfere deeply with the mineral soil. Thus, only the humus layer is removed. These ploughs often have two shares and may have been developed by the company itself, e.g., double mould-board forest ploughs. Studies of natural pine regeneration under pine shelters have described different distribution patterns (clumped, regular, or irregular) for pine saplings absent prior soil scarification [5], but unfortunately, specific information about microsites or the spatial patterns of overstorey trees is lacking. Particularly high seedling densities were observed on the study sites BRE and DAN, where soil scarification was practised approximately 3 years prior to data collection, using a cultivator and a plough, respectively. On both sites, the comparatively young age of the pine seedlings, about 2 years, was a direct result of the soil scarification treatments [23]. Comparable seedling densities of more than 100,000 pine seedlings per hectare were observed on fully ploughed forest areas [36,76,98]. Both soil scarification techniques helped to establish high seedling densities, particularly in the first 2 years after scarification. The seedling densities and their distributions differed strongly, however, in accordance with the spatial distribution of the scarified surfaces. The use of a cultivator created small aggregates, and there were additional differences in seedling densities between the resultant pits and mounds. This served to increase the spatial heterogeneity (RCE 0.3) within the regeneration layer of the pine stands [47,76]. The complete scarification of the site DAN led to less clumped spatial patterns (RCE 0.7) of pine seedlings and a more homogeneous age structure. The gentler soil scarification of the site TEM, achieved using a horse-drawn plough, occurred sometime earlier and was no longer visible amongst the microsite types, but the high seedling densities (29,000 seedlings per hectare) on m1 proved a continuous success of regeneration. The seedling densities on hollows (BRE) and furrows (DAN) were higher than on mounds, in particular on the site BRE, with small patches prepared using a cultivator. An explanation is provided by the higher soil moisture in these hollows and furrows, combined with the immediate soil contact achieved by the radicle [14,45]. These conditions form safe sites favourable for seed germination and the fast development of roots, which can increase the probability of survival [28,81,99].
Skid trails lead to strongly aggregated and dense patches of seedlings (m2 and m3), but with no relevance for the future regeneration success of the forest stands. The low mean ages of the pine seedlings (1.5 to 2.0 years) on the scarified sites BRE and DAN only allowed for a provisional assessment of the success of regeneration, because typically the mortality rates can reach up to 90% during the early stages of pine seedling development, mostly influenced by factors like drought or the competition exerted by expansive ground vegetation [45,49,100]. Successful rapid and dense regeneration is typically characterised by a few age classes [23].
Finally, the spatial effects of overstorey trees were assessed in combination with different microsite conditions by using different interaction radii analyses. Our findings, achieved using multitype Strauss hard-core process (MSH), show a negative interaction between overstorey trees and pine seedling densities. Countering to some extent the positive sheltering effect of overstorey trees, in particular during long-term extreme climate events, the superior root competition of overstorey pine trees impacts regeneration [39,40,70]. Mycorrhiza associated with overstorey trees have also been shown to impact the development of Pinus radiata D. Don seedlings [101]. The spatial effect zone of adult pine trees, indicated by the crown projection on the ground, either prevents regeneration entirely or reduces the density and the growth of seedlings [70,102], because of the competition for water and nutrients. The dominance of mature Scots pine trees within 3.5 m to 5 m of the surrounding upper soil layer area was also discussed by Valkonen [40] resulting in lower seedling densities. A drastic decrease in pine seedling height growth was observed at distances of between 0.5 and 1.2 m from adult Scots pine trees [103]. Such effect zones in the surrounding of adult pine trees create heterogenous spatial distributions of pine seedlings. The calculated interaction parameters of the MSH process revealed stronger effects on study sites with low numbers of overstorey trees. This effect is low on sites where the overstorey trees cast dense shelter. On the sites with intensive soil scarification and young seedlings (site DAN), the root zone effect is reduced or fully negated due to the seedlings’ shallow rooting depth.

5. Conclusions

The findings of the study demonstrate that both silvicultural systems—seed tree and shelterwood cuts—are fundamentally suitable to initiate sufficiently dense natural regeneration (>5000 seedlings per hectare) in Scots pine. The regeneration densities could be further increased by adopting soil scarification methods. However, the soil scarification method chosen has a significant influence on the spatial distribution of pine seedlings and on future intraspecific competition. On sites without soil scarification, the species composition and ground vegetation patterns, and the microsites as a whole, determine the localised success of seedling establishment. Vaccinium species severely inhibit the growth of pine in the establishment phase. The number of overstorey stems has little impact on the absolute regeneration density, but a significant effect on the growth of seedlings. Higher stem numbers (>200 stems per hectare) guarantee high regeneration density initially but lead to significant growth and vitality losses after a period of about 5 years if the shelter is maintained. The spatial interaction of overstorey trees and microsites had a significant negative effect on seedling density on all study sites. The spatial heterogeneity of the microsites and the overstorey trees should be given greater consideration in subsequent silvicultural treatments to produce age- and growth-related structures in the regeneration and to allow for small-scale regeneration of additional tree species.

Author Contributions

Conceptualisation, F.H. and A.W.; methods, F.H. and A.W.; software, validation and formal analysis, S.W., F.H. and A.W.; writing—original draft preparation and review and editing, F.H., A.W. and. S.W.; visualisation, F.H., A.W. and. S.W.; project administration, A.W. and F.H.; funding acquisition, A.W. and F.H. All authors have read and agreed to the published version of the manuscript.

Funding

This research was funded by the German Federal Environmental Foundation (Deutsche Bundesstiftung Umwelt, DBU), grant number AZ: 32370/01-33/0.

Data Availability Statement

The data presented in this study are available on request from the corresponding author.

Acknowledgments

We would like to thank the forestry practitioners on site for their professional support. A special thanks goes to our proofreader David Butler Manning.

Conflicts of Interest

The authors have no conflict of interest to declare.

References

  1. Spathelf, P.; Ammer, C. Forest management of Scots pine (Pinus sylvestris L.) in northern Germany a brief review of the history and current trends. Forstarchiv 2015, 86, 59–66. [Google Scholar]
  2. Lust, N.; Geudens, G.; Nachtergale, L. Aspects of biodiversity of Scots pine forests in Europe. Silva Gandav. 2001, 66, 16–39. [Google Scholar] [CrossRef] [Green Version]
  3. Bolte, A.; Ammer, C.; Löf, M.; Madsen, P.; Nabuurs, G.-J.; Schall, P.; Spathelf, P.; Rock, J. Adaptive forest management in central Europe: Climate change impacts, strategies and integrative concept. Scand. J. For. Res. 2009, 24, 473–482. [Google Scholar] [CrossRef]
  4. Lundqvist, L.; Ahlström, M.A.; Petter Axelsson, E.; Mörling, T.; Valinger, E. Multi-layered Scots pine forests in boreal Sweden result from mass regeneration and size stratification. For. Ecol. Manag. 2019, 441, 176–181. [Google Scholar] [CrossRef]
  5. Zawadzka, A.; Słupska, A. Under-Canopy Regeneration of Scots Pine (Pinus sylvestris L.) as Adaptive Potential in Building a Diverse Stand Structure. Sustainability 2022, 14, 1044. [Google Scholar] [CrossRef]
  6. Miina, J.; Saksa, T. Predicting establishment of tree seedlings for evaluating methods of regeneration for Pinus sylvestris. Scand. J. For. Res. 2008, 23, 12–27. [Google Scholar] [CrossRef]
  7. Löf, M.; Ammer, C.; Coll, L.; Drössler, L.; Huth, F.; Madsen, P.; Wagner, S. Regeneration Patterns in Mixed-Species Stands; Springer: Cham, Switzerland, 2018; p. 420. [Google Scholar]
  8. Edwards, C.; Mason, W.L. Stand structure and dynamics of four native Scots pine (Pinus sylvestris L.) woodlands in northern Scotland. For. Int. J. For. Res. 2006, 79, 261–277. [Google Scholar] [CrossRef] [Green Version]
  9. Vacek, S.; Vacek, Z.; Bílek, L.; Simon, J.; Remeš, J.; Hůnová, I.; Král, J.; Putalová, T.; Mikeska, M. Structure, regeneration and growth of Scots pine (Pinus sylvestris L.) stands with respect to changing climate and environmental pollution. Silva Fenn. 2016, 50, 1564. [Google Scholar] [CrossRef] [Green Version]
  10. Nyland, R.D. Silviculture: Concepts and Applications, 2nd ed.; Waveland Press, Inc.: Long Grove, IL, USA, 2007; p. 682. [Google Scholar]
  11. Çoban, S.; Çolak, A.H.; Rotherham, I.D.; Özalp, G.; Çalışkan, A. Effects of canopy gap size on the regeneration of Scots pine (Pinus sylvestris L.) in Eskişehir-Çatacık region of Turkey. Austrian J. For. Sci. 2018, 135, 183–212. [Google Scholar]
  12. Brichta, J.; Bílek, L.; Linda, R.; Vítámvás, J. Does shelterwood regeneration on natural Scots pine sites under changing environmental conditions represent a viable alternative to traditional clear-cut management? Cent. Eur. For. J. 2020, 66, 104–115. [Google Scholar] [CrossRef]
  13. Zhou, W. Optimal natural regeneration of Scots pine with seed trees. J. Environ. Manag. 1998, 53, 263–271. [Google Scholar] [CrossRef]
  14. Béland, M.; Agestam, E.; Ekö, P.M.; Gemmel, P.; Nilsson, U. Scarification and Seedfall affects Natural Regeneration of Scots Pine under Two Shelterwood Densities and a Clear-cut in Southern Sweden. Scand. J. For. Res. 2000, 15, 247–255. [Google Scholar] [CrossRef]
  15. Barbeito, I.; Fortin, M.-J.; Montes, F.; Cañellas, I. Response of Pine Natural Regeneration to Small-Scale Spatial Variation in a Managed Mediterranean Mountain Forest. Appl. Veg. Sci. 2009, 12, 488–503. [Google Scholar] [CrossRef]
  16. Huth, F.; Wagner, S. Ökosystemleistungen von Dauerwäldern–eine aktuelle Analyse des Waldbaus. Schweiz. Z. Forstwes. 2013, 164, 27–36. [Google Scholar] [CrossRef]
  17. Ackzell, L. A comparison of planting, sowing and natural regeneration for Pinus sylvestris (L.) in boreal Sweden. For. Ecol. Manag. 1993, 61, 229–245. [Google Scholar] [CrossRef]
  18. Hyppönen, M.; Alenius, V.; Valkonen, S. Models for the establishment and height development of naturally regenerated Pinus sylvestris in Finnish Lapland. Scand. J. For. Res. 2005, 20, 347–357. [Google Scholar] [CrossRef]
  19. Lehto, J. Tutkimuksia männyn uudistamisesta Pohjois-Suomessa siemenpuu-ja suojuspuumenetelmällä. Summary: Studies conducted in northern Finland on the regeneration of Scots pine by means of the seed tree and shelterwood method. Commun. Inst. For. Fenn. 1969, 67, 1–140, (In Finnish with English summary). [Google Scholar]
  20. Kint, V.; Geudens, G.; Mohren, G.M.J.; Lust, N. Silvicultural interpretation of natural vegetation dynamics in ageing Scots pine stands for their conversion into mixed broadleaved stands. For. Ecol. Manag. 2006, 223, 363–370. [Google Scholar] [CrossRef]
  21. Hallikainen, V.; Hökkä, H.; Hyppönen, M.; Rautio, P.; Valkonen, S. Natural regeneration after gap cutting in Scots pine stands in northern Finland. Scand. J. For. Res. 2019, 34, 115–125. [Google Scholar] [CrossRef]
  22. Heinsdorf, M. Kiefernnaturverjüngung–ein historischer Abriss. Beitr. Forstwirtsch. Landsch. 1994, 28, 62–65. [Google Scholar]
  23. Karlsson, C.; Örlander, G. Soil Scarification Shortly before a Rich Seed Fall Improves Seedling Establishment in Seed Tree Stands of Pinus sylvestris. Scand. J. For. Res. 2000, 15, 256–266. [Google Scholar] [CrossRef]
  24. Hallingbäck, H.R.; Burton, V.; Vizcaíno-Palomar, N.; Trotter, F.; Liziniewicz, M.; Marchi, M.; Berlin, M.; Ray, D.; Benito Garzón, M. Managing Uncertainty in Scots Pine Range-Wide Adaptation under Climate Change. Front. Ecol. Evol. 2021, 9, 724051. [Google Scholar] [CrossRef]
  25. Muffler, L.; Schmeddes, J.; Weigel, R.; Barbeta, A.; Beil, I.; Bolte, A.; Buhk, C.; Holm, S.; Klein, G.; Klisz, M.; et al. High plasticity in germination and establishment success in the dominant forest tree Fagus sylvatica across Europe. Glob. Ecol. Biogeogr. J. Macroecol. 2021, 30, 1583–1596. [Google Scholar] [CrossRef]
  26. Szmyt, J. Spatial statistics in ecological analysis: From indices to functions. Silva Fenn. 2014, 48, 1008. [Google Scholar] [CrossRef] [Green Version]
  27. Wehnert, A.; Wagner, S.; Huth, F. Effects of Pure and Mixed Pine and Oak Forest Stands on Carabid Beetles. Diversity 2021, 13, 127. [Google Scholar] [CrossRef]
  28. Dovčiak, M.; Reich, P.B.; Frelich, L.E. Seed rain, safe sites, competing vegetation, and soil resources spatially structure white pine regeneration and recruitment. Can. J. For. Res. 2003, 33, 1892–1904. [Google Scholar] [CrossRef]
  29. Karlsson, C. Effects of Release Cutting and Soil Scarification on Natural Regeneration in Pinus sylvestris Shelterwoods. Ph.D. Thesis, Swedish University of Agricultural Sciences Alnarp, Alnarp, Sweden, 2000; p. 102. [Google Scholar]
  30. Mukassabi, T.A.; Polwart, A.; Coleshaw, T.; Thomas, P.A. Scots pine seed dynamics on a waterlogged site. Trees 2012, 26, 1305–1315. [Google Scholar] [CrossRef]
  31. Hannerz, M.; Almqvist, C.; Hörnfeldt, R. Timing of seed dispersal in Pinus sylvestris stands in central Sweden. Silva Fenn. 2002, 36, 518. [Google Scholar] [CrossRef] [Green Version]
  32. Kellomäki, S.; Hänninen, H.; Kolström, T.; Kotisaari, A.; Pukkala, T. A tentative model for describing the effects of some regenerative processes on the properties of natural seedlings stands. Silva Fenn. 1987, 21, 1–10. [Google Scholar] [CrossRef] [Green Version]
  33. Suchockas, V. Distribution of Scots Pine (Pinus sylvestris) Naturally Regenerating Seedlings on Abandoned Agricultural Land at Forest Edges. Balt. For. 2001, 7, 79–83. [Google Scholar]
  34. Wagner, S.; Herrmann, I.; Dempe, S. Spatial optimization for dispersion of remnant trees in seed-tree cuttings and retention-tree stands of Scots pine. Scand. J. For. Res. 2010, 25, 432–445. [Google Scholar] [CrossRef]
  35. Valkonen, S.; Ruuska, J.; Siipilehto, J. Effect of retained trees on the development of young Scots pine stands in Southern Finnland. For. Ecol. Manag. 2002, 166, 227–243. [Google Scholar] [CrossRef]
  36. Dohrenbusch, A. Die Natürliche Verjüngung der Kiefer (Pinus silvestris L.) in Nordwestdeutschen Pleistozän; Schriften aus der Forstlichen Fakultät der Universität Göttingen und der Niedersächsischen Forstlichen Versuchsanstalt Bd. 123; J.D. Sauerländer’s Verlag: Frankfurt am Main, Germany, 1997; p. 269. [Google Scholar]
  37. Sonohat, G.; Balandier, P.; Ruchaud, F. Predicting solar radiation transmittance in the understory of even-aged coniferous stands in temperate forests. Ann. For. Sci. 2004, 61, 629–641. [Google Scholar] [CrossRef] [Green Version]
  38. Gaudio, N.; Balandier, P.; Perret, S.; Ginisty, C. Growth of understorey Scots pine (Pinus sylvestris L.) saplings in response to light in mixed temperate forest. Forestry 2011, 84, 187–195. [Google Scholar] [CrossRef] [Green Version]
  39. Kuuluvainen, T.; Linkosalo, T. Estimation of a spatial tree-influence model using iterative optimization. Ecol. Model. 1998, 106, 63–75. [Google Scholar] [CrossRef]
  40. Valkonen, S. Effect of Retained Scots Pine Trees on Regeneration, Growth, Form, and Yield of Forest Stands. For. Syst. 2000, 9, 121–145. [Google Scholar] [CrossRef]
  41. Siipilehto, J. Height distributions of Scots pine sapling stands affected by retained tree and edge stand competition. Silva Fenn. 2006, 40, 473–486. [Google Scholar] [CrossRef] [Green Version]
  42. Anders, S.; Beck, W.; Bolte, A.; Hofmann, G.; Jenssen, M.; Krakau, U.; Müller, J. Ökologie und Vegetation der Wälder Nordostdeutschlands: Einfluß von Niederschlagsarmut und Erhöhtem Stickstoffeintrag auf Kiefern-, Eichen- und Buchen-Wald- und Forstökosysteme des Nordostdeutschen Tieflandes, 1st ed.; Dr. Kessel: Oberwinter, Germany, 2002; p. 283. [Google Scholar]
  43. Örlander, G.; Gemmel, P.; Hunt, J.A. Site Preparation: A Swedish Overview; FRDA Report; BC Ministry of Forests: Victoria, BC, Canada, 1990; Volume 105, p. 61.
  44. Jäärats, A.; Sims, A.; Seemen, H. The Effect of Soil Scarification on Natural Regeneration in Forest Microsites in Estonia. Balt. For. 2012, 18, 133–143. [Google Scholar]
  45. Oleskog, G.; Sahlén, K. Effects of Seedbed Substrate on Moisture Conditions and Germination of Pinus sylvestris Seeds in a Clearcut. Scand. J. For. Res. 2000, 15, 225–236. [Google Scholar] [CrossRef]
  46. Hafemann, E.; Stähr, F. Zur Verjüngung der Kiefer. Eberswalder Forstl. Schr. 2007, 32, 414–420. [Google Scholar]
  47. Posselt, K.; Huth, F.; Wagner, S.; Müller, M. Kulla-Kultivator fördert Kiefern-Naturverjüngung. AFZ-DerWald 2011, 20, 27–32. [Google Scholar]
  48. Aleksandrowicz-Trzcińska, M.; Drozdowski, S.; Studnicki, M.; Żybura, H. Effects of Site Preparation Methods on the Establishment and Natural-Regeneration Traits of Scots Pines (Pinus sylvestris L.) in Northeastern Poland. Forests 2018, 9, 717. [Google Scholar] [CrossRef] [Green Version]
  49. Mäkitalo, K. Effect of Site Preparation and Reforestation Method on Survival and Height Growth of Scots Pine. Scand. J. For. Res. 1999, 14, 512–525. [Google Scholar] [CrossRef]
  50. Nohrstedt, H.-Ö. Effects of soil scarification and previous N fertilisation on pools of inorganic N in soil after clear-felling of a Pinus sylvestris (L.) stand. Silva Fenn. 2000, 34, 625. [Google Scholar] [CrossRef] [Green Version]
  51. Forest Inventory Brandenburg. 2013. Available online: https://bwi.info/start.aspx (accessed on 21 November 2021).
  52. Climate Data Center (CDC). Available online: https://cdc.dwd.de/portal (accessed on 8 January 2022).
  53. MLuR (Ministerium für Landwirtschaft, Umweltschutz und Raumordnung des Landes Brandenburg). Waldbau-Richtlinie 2004 „Grüner Ordner“ der Landesforstverwaltung Brandenburg; vierC digitalprint—Mediafabrik GmbH: Potsdam, Germany, 2004; Available online: https://forst.brandenburg.de/lfb/de/service/publikationen/detail/~01-05-2004-waldbaurichtlinie-gruener-ordner (accessed on 17 March 2022).
  54. Ammer, C.; Brang, P.; Knoke, T.; Wagner, S. Methoden zur waldbaulichen Untersuchung von Jungwüchsen. Forstarchiv 2004, 75, 83–110. [Google Scholar]
  55. Hedderich, J.; Sachs, L. Angewandte Statistik-Methodensammlung mit R-; Springer Spektrum: Berlin/Heidelberg, Germany, 2020; p. 1053. [Google Scholar] [CrossRef]
  56. Ameztegui, A.; Coll, L. Tree dynamics and co-existence in the montane—Sub-alpine ecotone: The role of different light-induced strategies. J. Veg. Sci. 2011, 22, 1049–1061. [Google Scholar] [CrossRef] [Green Version]
  57. Clark, P.J.; Evans, F.C. Distance to nearest neighbor as a measure of spatial relationships in populations. Ecology 1954, 35, 445–453. [Google Scholar] [CrossRef]
  58. Krebs, C.J. Ecological Methodology, 2nd ed.; Addison Wesley Longman Inc.: Menlo Park, CA, USA, 1999; p. 620. [Google Scholar]
  59. Horvitz, C.C.; Le Corff, J. Spatial scale and dispersion pattern of ant- and bird-dispersed herbs in two tropical lowland rain forests. Vegetatio 1993, 15, 351–362. [Google Scholar] [CrossRef]
  60. Pommerening, A.; Grabarnik, P. Individual-Based Methods in Forest Ecology and Management; Springer Nature: Cham, Switzerland, 2019; p. 411. [Google Scholar]
  61. Dale, M.R.T.; Dixon, P.; Fortin, M.-J.; Legendre, P.; Myers, D.E.; Rosenberg, M.S. Conceptual and mathematical relationships among methods for spatial analysis. Ecography 2002, 25, 558–577. [Google Scholar] [CrossRef]
  62. Illian, J.; Penttinen, A.; Stoyan, H.; Stoyan, D. Statistical Analysis and Modelling of Spatial Point Patterns; John Wiley & Sons, Ltd.: Hoboken, NJ, USA, 2009; p. 534. [Google Scholar]
  63. Wiegand, T.; Moloney, K.A. Handbook of Spatial Point-Pattern Analysis in Ecology; Taylor & Francis Group: London, UK; Chapmann & Hall: New York, NY, USA; CRC Press: Boca Raton, FL, USA, 2014; p. 510. [Google Scholar]
  64. Baddeley, A.; Rubak, E.; Turner, R. Spatial Point Patterns. Methodology and Applications with R; Chapman & Hall/CRC Interdisciplinary Statistics Series; CRC Press: Boca Raton, FL, USA; Taylor & Francis Group: London, UK; A Chapman & Hall Book: New York, NY, USA, 2016; p. 810. [Google Scholar]
  65. Pukkala, T.; Kolström, T. A stochastic spatial regeneration model for Pinus sylvestris. Scand. J. For. Res. 1992, 7, 377–385. [Google Scholar] [CrossRef]
  66. Karlsson, C. Fertilization and release cutting increase seed production and stem diameter growth in Pinus sylvestris seed trees. Scand. J. For. Res. 2006, 21, 317–326. [Google Scholar] [CrossRef]
  67. Croker, T.C.; Boyer, W.D. Regenerating Longleaf Pine Naturally; U.S. Department of Agriculture Forest Service Research Paper SO-105; US Department of Agriculture, Forest Service, Southern Forest Experiment Station: New Orleans, LA, USA, 1975; 26p.
  68. Ayari, A.; Zubizarreta-Gerendiain, A.; Tome, M.; Tome, J.; Garchi, S.; Henchi, B. Stand, tree and crown variables affecting cone crop and seed yield of Aleppo pine forests in different bioclimatic regions of Tunisia. For. Syst. 2012, 21, 128–140. [Google Scholar] [CrossRef] [Green Version]
  69. Moreno-Fernández, D.; Cañellas, I.; Calama, R.; Gordo, J.; Sánchez-González, M. Thinning increases cone production of stone pine (Pinus pinea L.) stands in the Northern Plateau (Spain). Ann. For. Sci. 2013, 70, 761–768. [Google Scholar] [CrossRef] [Green Version]
  70. Kuuluvainen, T.; Pukkala, T. Effect of Scots pine seed trees on the density of ground vegetation and tree seedlings. Silva Fenn. 1989, 23, 159–167. [Google Scholar] [CrossRef] [Green Version]
  71. Eisenhauer, D.-R.; Irrgang, S.; Behrens, S.; Ritter, K. Integration der Kiefern-Naturverjüngung in einen ökologisch orientierten Waldbau—Geotope, Bodenvegetation, Bodenbearbeitung, Konkurrenz des Oberbestandes. Eberswalder Forstl. Schr. 2004, 21, 20–30. [Google Scholar]
  72. Wagner, S. About a spatial optimization technique in seed-tree cuttings to optimize for dispersion of remnant trees. Forst. Holz. 2008, 63, 29–33, (In German with English Abstract). [Google Scholar]
  73. Rosenvald, R.; Rosenvald, K.; Kaart, T.; Soolmann, E. Effects of stand parameters on conifer regeneration success in pine shelterwood stands in Estonia. Eur. J. For. Res. 2020, 139, 29–40. [Google Scholar] [CrossRef]
  74. Karlsson, M. Natural Regeneration of Broadleaved Tree Species in Southern Sweden-Effects of Silvicultural Treatments and Seed Dispersal from Surrounding Stands. Ph.D. Thesis, Swedish University of Agricultural Sciences, Alnarp, Sweden, 2001; p. 124. [Google Scholar]
  75. Çömez, A.; Tolunay, D.; Güner, Ş.T. Litterfall and the effects of thinning and seed cutting on carbon input into the soil in Scots pine stands in Turkey. Eur. J. For. Res. 2019, 138, 1–14. [Google Scholar] [CrossRef]
  76. Kuper, J.H. Sustainable Development of Scots Pine Forest; Wageningen Agricultural University Papers Nr.; Wageningen University and Research: Wageningen, The Netherlands, 1994; Volume 94-2. [Google Scholar]
  77. Hille, M.; den Ouden, J. Improved recruitment and early growth of Scots pine (Pinus sylvestris L.) seedlings after fire and soil scarification. Eur. J. For. Res. 2004, 123, 213–218. [Google Scholar] [CrossRef]
  78. Köhler, F. Einflussfaktoren auf das Ankommen von Kiefern-Naturverjüngung–vorläufige Ergebnisse von Untersuchungen im Land Brandenburg. Eberswalder Forstl. Schr. 2004, 21, 48–58. [Google Scholar]
  79. Castro, J.; Leverkus, A.B. Effect of Herbaceous Layer Interference on the Post-Fire Regeneration of a Serotinous Pine (Pinus pinaster Aiton) across Two Seedling Ages. Forests 2019, 10, 74. [Google Scholar] [CrossRef] [Green Version]
  80. Harper, J.L. Population Biology of Plants; Academic Press: London, UK; New York, NY, USA; San Francisco, CA, USA, 1977; p. 892. [Google Scholar]
  81. Lamont, B.B.; Witkowski, E.T.F.; Enright, N.J. Post-Fire Litter Microsites: Safe for Seeds, Unsafe for Seedlings. Ecology 1993, 74, 501–512. [Google Scholar] [CrossRef] [Green Version]
  82. Schupp, E.W. Seed-Seedling Conflicts, Habitat Choice, and Patterns of Plant Recruitment. Am. J. Bot. 1995, 82, 399–409. [Google Scholar] [CrossRef]
  83. Yazdani, R.; Lindgren, D. Gene Dispersion after Natural Regeneration under a Widely-Spaced Seed-Tree Stand of Pinus sylvestris (L.). Silvae Genet. 1992, 41, 1–5. [Google Scholar]
  84. Aspe, P. Dynamique de la Régénération Naturelle chez le pin Sylvestre, Pinus sylvestris L.: Impacts de la Structure des Peuplements et des Flux de Gènes à Différentes Échelles Spatiales sur la Diversité Génétique. Ph.D. Thesis, Université d’Orléans, Orléans, France, 2009. [Google Scholar]
  85. Vacek, Z.; Vacek, S.; Bílek, L.; Král, J.; Ulbrichová, I.; Simon, J.; Bulušek, D. Impact of applied silvicultural systems on spatial pattern of hornbeam-oak forests. Cent. Eur. For. J. 2018, 64, 33–45. [Google Scholar] [CrossRef] [Green Version]
  86. Adámek, M.; Hadincová, V.; Wild, J. Long-term effect of wildfires on temperate Pinus sylvestris forests: Vegetation dynamics and ecosystem resilience. For. Ecol. Manag. 2016, 380, 285–295. [Google Scholar] [CrossRef]
  87. Wiebecke, E. Der Dauerwald in 16 Fragen und Antworten; der Landwirtschaftskammer für die Provinz Pommern: Stettin, Poland, 1920; p. 51. [Google Scholar]
  88. Weiß, J. Regeneration of Pine on small areas or under shelter. Allg. Forstzeitschr. 1959, 14, 460–464. [Google Scholar]
  89. Saursaunet, M.; Mathisen, K.M.; Skarpe, C. Effects of Increased Soil Scarification Intensity on Natural Regeneration of Scots Pine Pinus sylvestris L. and Birch Betula spp. L. Forests 2018, 9, 262. [Google Scholar] [CrossRef] [Green Version]
  90. González-Martínez, S.C.; Bravo, F. Density and population structure of the natural regeneration of Scots pine (Pinus sylvestris L.) in the High Ebro Basin (Northern Spain). Ann. For. Sci. 2001, 58, 277–288. [Google Scholar] [CrossRef] [Green Version]
  91. Gerelbaatar, S.; Baatarbileg, N.; Batsaikhan, G. Density and growth performance of Scots pine (Pinus sylvestris L.) understory saplings in logged forests of Tujiin Nars National Park in the Western Khentii Mountains, Case study from Northern Mongolia. Glob. Adv. Res. J. Agric. Sci. 2015, 4, 17–25. [Google Scholar]
  92. Coban, S.; Colak, A.H.; Rotherham, I.D. Interactions between canopy cover density and regeneration cores of older saplings in Scots pine (Pinus sylvestris L.) stands. For. Syst. 2016, 25, e073. [Google Scholar] [CrossRef] [Green Version]
  93. Socha, J.; Tymińska-Czabańska, L.; Bronisz, K.; Zięba, S.; Hawryło, P. Regional height growth models for Scots pine in Poland. Sci. Rep. 2021, 11, 10330. [Google Scholar] [CrossRef] [PubMed]
  94. Lembcke, G.; Knapp, E.; Dittmar, O. Ertragstafel für die Kiefer (Pinus sylvestris L.) im Nordostdeutschen Tiefland; Vieth Verlag GmbH: Eberswalde, Germany, 2000; p. 107. [Google Scholar]
  95. Ara, M.; Barbeito, I.; Kalén, C.; Nilsson, U. Regeneration failure of Scots pine changes the species composition of young forests. Scand. J. For. Res. 2021, 37, 14–22. [Google Scholar] [CrossRef]
  96. Behrens, L. Past and Present Scots Pine (Pinus sylvestris L.) Regeneration along Site Type Gradients in Bialowieza Forest, Poland. Ph.D. Thesis, Swedish University of Agricultural Sciences, SLU, Southern Swedish Forest Research Centre, Alnarp, Sweden, 2011. [Google Scholar]
  97. Eriksson, A.-M.; Olsson, J.; Jonsson, B.G.; Toivanen, S.; Edman, M. Effects of restoration fire on dead wood heterogeneity and availability in three Pinus sylvestris forests in Sweden. Silva Fenn. 2013, 47, 954. [Google Scholar] [CrossRef] [Green Version]
  98. Aleksandrowicz-Trzcińska, M.; Drozdowski, S.; Brzeziecki, B.; Rutkowska, P.; Jabłońska, B. Effects of different methods of site preparation on natural regeneration of Pinus sylvestris in Eastern Poland. Dendrobiology 2014, 71, 73–81. [Google Scholar] [CrossRef] [Green Version]
  99. Kuuluvainen, T.; Juntunen, P. Seedling Establishment in Relation to Microhabitat Variation in a Windthrow Gap in a Boreal Pinus sylvestris Forest. J. Veg. Sci. 1998, 9, 551–562. [Google Scholar] [CrossRef]
  100. Juntunen, V.; Neuvonen, S. Natural regeneration of Scots pine and Norway spruce close to the timberline in northern Finland. Silva Fenn. 2006, 40, 329. [Google Scholar] [CrossRef] [Green Version]
  101. Booth, M.G.; Hoeksema, J.D. Mycorrhizal networks counteract competitive effects of canopy trees on seedling survival. Ecology 2010, 91, 2294–2302. [Google Scholar] [CrossRef]
  102. Brockway, D.G.; Outcalt, K.W. Gap-phase regeneration in longleaf pine wiregrass ecosystems. For. Ecol. Manag. 1998, 106, 125–139. [Google Scholar] [CrossRef]
  103. Niemistö, P.; Lappalainen, E.; Isomäki, A. Growth of Scots pine seed bearers and the development of seedlings during a protracted regeneration period. Folia For. 1993, 826, 1–26. [Google Scholar]
Figure 1. Locations of the study sites in the Federal State Brandenburg (Germany) and photos showing the study sites with different soil scarification types.
Forests 13 00817 g001
Figure 2. Linear models to show the relationships between the root collar diameter (cm) and height (cm) of pine seedlings up to an age of 10 years (signif. code: 0 ‘***’). Note the different scales for the sites BRE and DAN.
Forests 13 00817 g002
Figure 3. Age-dependent height growth functions for Scots pine up to an age of 10 years depicted separately for each site (non-linear regression model, nls model: height.cm ~ b0 ×-exp (b1 ×- age)). Note the different scale for the site DAN.
Forests 13 00817 g003
Figure 4. Spatial distribution and densities (level) of pine seedlings on the different sites.
Forests 13 00817 g004
Figure 5. Maps showing the spatial patterns of microsite types on each study site (microsite types: m1—stand without soil scarification, m2—skid trail, m3—skid trail border, m4—hollows or furrows, m5—mounds, m6—stand edge). Visualisation of the results of multitype Strauss hard-core process (MSH) calculations showing the spatial effects of overstorey pine trees and different microsite types on pine seedling densities. Note the different scales of intensities.
Forests 13 00817 g005
Table 1. Overview of the stands, overstorey pine trees, and the characteristics of the study sites. (The coefficients of variation (CV) are specified in brackets and the spatial patterns are characterised by the aggregation index according to Clark & Evans (RCE)).
ParametersKATaKATbWEBNEFTEMBREDAN
stand area (ha)4.578.411.896.393.083.7713.8
number of trees (n/ha)442334414415631189
age (years)120120120125139128106
basal area (m2/ha)3.921.14.117.516.922.312.9
mean height (m)20.5
(0.047)
20.2
(0.712)
22.1
(0.108)
24.9
(0.056)
24.8
(0.067)
22.0
(0.096)
28.0
(0.110)
CV of height
mean dbh (cm)36.0
(0.124)
33.3
(0.874)
41.4
(0.285)
38.9
(0.123)
38.2
(0.168)
30.0
(0.197)
46.0
(0.226)
CV of dbh
mean crown length (m)8.6
(0.184)
5.2
(0.697)
8.3
(0.329)
8.6
(0.317)
13.4
(0.431)
7.8
(0.221)
11.0
(0.282)
CV of crown length
mean crown diameter (m)5.1
(0.242)
3.3
(0.635)
2.9
(0.338)
5.1
(0.218)
6.0
(0.204)
3.5
(0.318)
6.6
(0.332)
CV of crown diameter
RCE1.030.890.771.031.081.201.14
Table 2. Mean values and coefficients of variation (in brackets) of total pine seedling densities, separated by microsite types (m—microsite, m1—stand conditions without soil scarification, m2—skid trail, m3—skid trail border, m4—hollows or furrows, m5—mounds, m6—stand edge).
ParametersKATaKATbWEBNEFTEMBREDAN
total seedling density (n/ha)5900784412,08910,58935,85687,511199,067
proportion of pine seedlings with an age up to 10 years (%)93.293.699.386.896.6100.0100.0
m1 seedling density (n/ha)4222196711,489578929,24424,000-
m2 seedling density (n/ha)103345005333967430027,378-
m3 seedling density (n/ha)-13783383323009911-
m4 seedling density (n/ha)-----22,622105,422
m5 seedling density (n/ha)-----360093,644
m6 seedling density (n/ha)644-33----
Table 3. Mean values and coefficients of variation (CV in brackets) of the growth characteristics of pine seedlings (slenderness (height/rcd), live crown ratio (crown length relative to tree height), crown profile for all trees with established branches (crown length/crown diameter)).
ParametersKATaKATbWEBNEFTEMBREDAN
mean age (years)6.14
(0.443)
6.85
(0.983)
8.16
(0.178)
5.39
(0.714)
7.32
(0.347)
2.02
(0.983)
1.51
(0.349)
CV of age
mean height (cm)97.40
(0.925)
59.59
(1.321)
158.16
(0.582)
63.72
(1.206)
77.25
(0.668)
7.44
(1.177)
10.37
(0.761)
CV of height
mean rcd (cm)1.892
(1.134)
0.705
(1.553)
2.575
(0.695)
1.000
(1.327)
0.97
(0.726)
0.13
(1.088)
0.20
(0.847)
CV of rcd
mean crown length (cm)85.13
(0.994)
37.76
(1.186)
115.48
(0.703)
73.84
(0.923)
52.18
(0.718)
14.19
(0.639)
13.38
(0.498)
CV of crown length
mean crown diameter (cm)55.891
(0.987)
26.34
(1.210)
75.79
(0.624)
53.92
(0.849)
41.21
(0.659)
10.18
(0.710)
5.95
(0.476)
CV of crown diameter
mean slenderness7.07
(0.444)
10.47
(0.361)
6.83
(0.353)
7.51
(0.348)
8.20
(0.300)
5.64
(0.341)
6.21
(0.558)
CV of slenderness
mean live crown ratio64.44
(0.413)
49.60
(0.488)
67.38
(0.285)
39.50
(0.879)
54.22
(0.668)
54.86
(0.348)
37.29
(1.100)
CV of live crown ratio
mean crown profile2.30
(1.588)
2.63
(2.007)
1.58
(0.524)
1.65
(0.983)
1.40
(0.438)
2.01
(1.069)
2.69
(0.632)
CV of crown profile
Table 4. Results of Pearson’s correlation analyses of overstorey trees (basal area (BA), m2/ha) and age-dependent seedling parameters (h—height in cm, rcd—root collar diameter in cm, crown length in cm, crown diameter in cm).
BA~HeightBA~rcdBA~Crown LengthBA~Crown DiameterBA~Slenderness
Agerp-Valuerp-Valuerp-Valuerp-Valuerp-Value
1−0.5820.171−0.5850.167NANANANA0.3860.392
2−0.6070.202−0.0520.912−0.1500.810−0.9530.1960.2690.559
3−0.7070.075−0.0390.934−0.4650.353−0.1250.875−0.0830.876
4−0.4430.455−0.4490.448−0.3290.589−0.3570.555−0.2580.674
5−0.8330.039−0.9200.009−0.8950.016−0.9470.0040.1720.712
6−0.8690.025−0.9160.010−0.8630.027−0.8870.0180.4160.412
7−0.9040.013−0.9010.014−0.8770.022−0.8840.0200.3420.507
8−0.9690.001−0.9540.003−0.9550.003−0.9490.0040.5040.308
9−0.9800.001−0.9700.001−0.9710.001−0.9570.0030.5470.261
10−0.9750.001−0.9940.000−0.9910.000−0.9790.0010.8720.023
Table 5. Calculated aggregation indices (RCE) and mean growth spaces (TESS) per pine seedling (all ages included) separated by microsite type (m—microsite, m1—stand conditions without soil scarification, m2—skid trail, m3—skid trail border, m4—hollows or furrows, m5—mounds, m6—stand edge) for each study site. All RCE values are highly significant.
Microsite TypesIndicesKATaKATbWEBNEFTEMBREDAN
m1RCE0.5810.5370.7460.5780.7020.526-
TESS2.7463.6590.9821.8100.4030.239-
m2RCE0.2360.3460.2370.2280.2650.357-
TESS1.0631.0151.7190.5210.2830.108-
m3RCE-0.3510.0330.2580.2040.326-
TESS-1.55112.8060.9050.4470.170-
m4RCE-----0.3020.517
TESS-----0.1390.045
m5RCE-----0.3160.742
TESS-----0.1910.101
m6RCE0.236-0.035----
TESS2.270-9.073----
totalRCE0.5980.5950.7700.5730.7360.6840.810
TESS2.4011.7771.0651.2710.3920.1630.071
Table 6. Growth space of individual seedlings calculated by tessellation in relation to seedling growth parameters; all study sites included.
FunctionsEstimateStd. Errort-ValueAdj. r2p-Value
lm(age~tess.area-1)1.0720.2534.230.4240.000
lm(height~tess.area-1)13.3233.1884.180.4170.000
lm(rcd~tess.area-1)2.4870.5214.770.4860.000
lm(crown.diameter~tess.area-1)6.8111.5534.390.4420.000
Table 7. Relationships between the proportion of different ground cover types and pine seedling age; all study sites included.
FunctionEstimateStd. Errort-ValueAdj. r2p-Value
lm(pine.litter~age-1)6.0160.43413.8800.7710.000
lm(moss~age-1)7.7700.8039.6800.6230.000
lm(vaccinium.vitis~age-1)2.6380.2948.9650.5820.000
lm(vaccinium.myrt~age-1)2.9010.26710.8500.6720.000
Table 8. Calculations with optimised radii, interaction radii of non-stationary multitype Strauss (MS) and multitype hard-core (MH) processes, and calculated frequencies, proportions, and intensities of overstorey pine trees and seedings (≤10 years).
SiteMSMHOverstorey Pine TreesPine Tree Regeneration
Radii (m)Radii (m)Freq.ProportionIntensityFreq.ProportionIntensity
KATa2.50.5040.007390.003945010.992080.49342
KATb2.50.11320.042610.031676740.954670.66694
WEB2.50.2650.004190.0049910800.995391.07853
NEF2.50.10140.016650.014218270.983350.83937
TEM2.50.10170.005430.0166131130.994573.04099
BRE2.50.17100.005050.0344419690.994956.78124
DAN--20.000440.0069345790.9995615.87229
Table 9. Parameters of the calculated multitype Strauss hard-core process (MSH) (m—microsite, m1 (intercept)—stand conditions without scarification, m2—skid trail, m3—skid trail border, m4—hollows or furrows, m5—mounds, m6—stand edge, markX1xX2—interaction between overstorey pine trees and pine seedlings, signif. codes: 0 ‘***’, 0.001 ‘**’, 0.01 ‘*’, 0.1 ‘n.s.’).
SiteMicrosite Type ParameterEstimateStd. ErrorCI95.loCI95.hiZtestZval
KATam1−1.04164560.05252133−1.1445855−0.9387056***−19.832808
m20.08638550.11610683−0.24411960.4168907***9.715459
m6−0.07255470.15514918−0.47958140.3344714***6.246188
markX1xX2−0.66600550.04577624−0.7557253−0.5762857***−14.549154
KATbm1−1.29182000.07544377−1.4396871−1.1439530***−17.122951
m20.17994920.09434293−0.15288310.5127250***15.600207
m3−0.47821910.11767162−0.8567093−0.0997110***6.914241
markX1xX2−0.17480970.00615304−0.1868695−0.1627500***−28.410310
WEBm10.08422160.029985210.02545160.1429915**2.808770
m2−0.31857800.14891511−0.66921620.0320601**−2.704894
m3−0.94000140.55854394−2.09349770.2134942n.s.−1.833738
m6−2.36395420.57812840−3.5558351−1.1726635***−4.234658
markX1xX2−0.39526730.01691281−0.4284158−0.3621188***−1.833738
NEFm1−0.63365480.04722066−0.7262056−0.5411040***−13.419017
m20.75999280.071921980.52647750.9935081***19.377215
m3−0.10411600.14754053−0.48584100.2776089***3.589107
markX1xX2−0.55882860.02523363−0.5093716−0.5093716***−22.146181
TEMm11.09291960.018599531.05646521.1293740***58.760602
m21.30219700.054674211.15858311.4458109***3.827718
m30.91258700.074056740.73098411.0941900*−2.435060
markX1xX2−0.17137020.00277762−0.1768142−0.1659262***−61.696738
BREm11.57656520.042177261.49389931.6592311***37.379510
m22.33970870.058902072.14159692.5378205***12.956141
m31.95920900.079605891.72051842.1978996***4.806727
m42.04767530.061579341.84431612.2510345***7.650457
m51.76686500.120014741.44897452.0847554n.s.1.585637
markX1xX2−0.06622590.00246044−0.0710482−0.0614035***−26.916310
DANm43.39118200.020227833.35153603.4308280***167.64930
m52.64636000.021642182.60394202.6887780***122.27790
markX1xX2------
Publisher’s Note: MDPI stays neutral with regard to jurisdictional claims in published maps and institutional affiliations.

