
The Resilience of Vegetation to the 2009/2010 Extreme Drought in Southwest China


1
Key Laboratory of Forest Ecology and Environment of National Forestry and Grassland Administration, Ecology and Nature Conservation Institute, Chinese Academy of Forestry, Beijing 100091, China
2
Institute of Ecology, School of Applied Meteorology, Nanjing University of Information Science & Technology, Nanjing 210044, China
3
Research Center for Global Changes and Ecosystem Carbon Sequestration & Mitigation, Nanjing University of Information Science & Technology, Nanjing 210044, China
4
Key Laboratory of Dryland Agriculture, Institute of Environment and Sustainable Development in Agriculture, Chinese Academy of Agricultural Sciences, Beijing 100081, China
*
Author to whom correspondence should be addressed.
Forests 2022, 13(6), 851; https://0-doi-org.brum.beds.ac.uk/10.3390/f13060851
Submission received: 26 April 2022
/
Revised: 23 May 2022
/
Accepted: 27 May 2022
/
Published: 30 May 2022
(This article belongs to the Section Natural Hazards and Risk Management)
Abstract
:The 2009/2010 extreme drought in southwest China (SWC) was a “once-in-a-century” drought event, which caused unprecedented damage to the regional ecology and socioeconomic development. The event provided a chance to explore the resilience of vegetation growth and productivity to the extreme drought. Here, we used the self-calibrating Palmer drought severity index (scPDSI) to describe the characteristics of the extreme drought. Vegetation growth and productivity indices, including the normalized difference vegetation index (NDVI), leaf area index (LAI), and gross primary productivity (GPP), were applied to analyze the resilience of different vegetation types to the extreme drought. Our results showed that the extreme drought event occurred mainly in Yunnan Province, Guizhou Province, central and northern Guangxi Zhuang Autonomous Region, and northwestern Sichuan Province. The spatial heterogeneity of the extreme drought was related to the temperature increase and water deficit. During the extreme drought, the vegetation growth and productivity of evergreen broadleaf forest were the least suppressed, whereas cropland was greatly suppressed. The recovery of cropland was higher than that of evergreen broadleaf forest. NDVI and LAI were recovered in more than 80% of the drought-affected area within 5 months, whereas GPP required a longer time to recover. Moreover, the results of multiple linear regression showed that an increase in surface soil moisture was able to significantly improve the resistance of vegetation NDVI and LAI in evergreen broadleaf forest, evergreen needleleaf forest, evergreen broadleaf shrubland, deciduous broadleaf shrubland, and grassland. Our study highlights the differences in the resilience of different vegetation types to extreme drought and indicates that surface soil moisture is an important factor affecting vegetation resistance in SWC.
1. Introduction
Global warming caused by rising atmospheric CO2 concentrations has become one of the most serious issues threatening the sustainable development of human society [1,2]. Associated with global warming, weather events such as floods, heat waves, extreme droughts, and ice storms occur more frequently, especially extreme droughts, which have been widely observed in various parts of the world [3]. Extreme drought will reduce vegetation growth and weaken the ability to sequester carbon and may even cause a net loss of ecosystem carbon stocks [4,5]. Therefore, analyzing the characteristics of extreme drought and exploring the responses of vegetation to extreme drought are of great importance for promoting vegetation stability and reducing eco-economic losses in the future.
The occurrence of extreme drought disrupts the growth of vegetation due to temperature increases and a lack of moisture [6], and when climate conditions improve, vegetation resumes growth. The process of the response of vegetation to extreme drought can be quantified using the concept of resilience. Resilience represents the capacity of vegetation to remain in a stable state in the face of extreme drought [7] and can be characterized in terms of resistance, which refers to the ability of vegetation to persist during extreme drought and recovery, which quantifies the ability of vegetation to return to the original state after extreme drought [8,9]. Resilience analysis provides a better understanding of the impact of extreme drought on vegetation and is a prerequisite for vegetation management to adapt to climate change [10]. At present, observation data sourced from tree-ring sampling, flux towers, remote sensing, etc., are used to study the resilience of vegetation. In Spain [11], the Tibetan Plateau [12], Central Asia [13], and even on a global scale [14], researchers have found that the resilience is related to vegetation types, and resistance and recovery generally have displayed an opposite pattern. Previous studies were mostly focused on trees, using tree-ring data. However, radial growth is further reduced due to trees allocating more photosynthate to their roots during extreme drought events, which means that tree-ring data are not a good indicator of primary productivity [15]. However, the resilience of different vegetation types to extreme drought has rarely been evaluated using remote sensing data, which can reliably reflect vegetation growth and productivity variations with spatial continuity [16].
Southwest China (SWC) is the main carbon storage area and one of the most ecologically vulnerable areas in China [3]. In recent decades, extreme drought events have frequently occurred and the intensity and duration of droughts have increased greatly [17,18]. During 2009/2010, SWC experienced a “once-in-a-century” extreme drought event [19]. This extreme drought event caused a tremendous decrease in vegetation growth and productivity [18,20,21]. However, the resilience of different vegetation types to the extreme drought in SWC has seldom been systematically considered in previous studies. Analyzing how different vegetation types resist extreme droughts and measuring the recovery time from extreme droughts are crucial in order to reduce drought impacts and maintain the stability of the ecosystem in SWC.
Hence, we used the self-calibrating Palmer drought severity index (scPDSI), water indices (precipitation, surface soil moisture, and root-zone soil moisture) and temperature indices (moderate resolution imaging spectroradiometer (MODIS), land surface temperature (LST), and mean air temperature) to describe the characteristics of the extreme drought and variations of water and temperature in SWC during 2009/2010. Vegetation growth and productivity indices (the normalized difference vegetation index (NDVI), leaf area index (LAI), and gross primary productivity (GPP)) were applied to assess the resilience of vegetation to the extreme drought event in SWC. The main purposes of our study were to (1) describe the characteristics of the 2009/2010 extreme drought and analyze the water availability and temperature change during the extreme drought event; (2) explore the resilience of different vegetation types to the extreme drought; (3) quantify the recovery time of different vegetation types from the extreme drought event.
2. Materials and Methods
2.1. Study Area
SWC is composed of the Guangxi Zhuang Autonomous Region, Yunnan Province, Guizhou Province, Sichuan Province, and Chongqing Municipality (Figure 1a,b). The terrain in the region is complex, including the Hengduan Mountains, Yunnan–Guizhou Plateau, Sichuan Basin, and Guangxi Basin, and karst landforms are widely distributed [19]. The climate of SWC is mainly dominated by the subtropical monsoon and is also influenced by alpine and tropical monsoons [22]. The vegetation distribution in SWC has obvious regional geographical differences. Grassland is the dominant vegetation in the high-altitude areas in west Sichuan, shrubland and forest are mainly distributed in the middle-altitude areas, and low-altitude areas such as the Sichuan and Guangxi Basins are suitable for farming.
The vegetation map of SWC shown in Figure 1 was obtained from the Land Cover Atlas of the People’s Republic of China (1:1,000,000) [23,24]. The vegetation distribution and the percentage of each type can be seen in Figure 1a,c. Here, the main vegetation types were considered in SWC, including evergreen broadleaf forest (12.58%), deciduous broadleaf forest (2.19%), evergreen needleleaf forest (24.82%), broadleaf and needleleaf mixed forest (1.09%), evergreen broadleaf shrubland (8.29%), deciduous broadleaf shrubland (6.83%), grassland (14.84%), and cropland (22.03%).
2.2. Datasets
In our study, scPDSI was used to analyze the extent and duration of the extreme drought in SWC during 2009/2010. Proposed by Wells et al. [25], scPDSI can automatically refit the parameters required for calculation according to the local climate, soil moisture, streamflow, potential evapotranspiration, and other related characteristics. The value range of scPDSI is close to −5 to 5. Values below −4 and above 4 represent extreme dry spells and extreme wet spells, respectively, and values between −1 and 1 represent normal environments. The scPDSI used in our study was developed at the University of East Anglia (https://crudata.uea.ac.uk/cru/data/drought/, accessed on 22 March 2021). The precipitation and mean air temperature were downloaded from National Tibetan Plateau Data Center (https://data.tpdc.ac.cn/en/data, accessed on 26 May 2021), which were posted by Peng et al. [26]. Surface soil moisture and root-zone soil moisture were obtained from the Global Land Evaporation Amsterdam Model (https://www.gleam.eu/, accessed on 29 August 2021).
Satellite data were derived from MODIS (https://ladsweb.modaps.eosdis.nasa.gov, accessed on 23 April 2020). LST, which reflects the energy exchange between the land surface and the atmosphere, and which is a key index used to monitor extreme drought [27], was estimated based on brightness temperature using the generalized split-window algorithm [28]. NDVI, LAI, and GPP are widely used to assess vegetation greenness, cover, and carbon sequestration capacity, respectively [29]. NDVI is calculated using a combination of near-infrared band and red band data [30]. The three-dimensional radiative transfer model was applied to generate LAI [31]. GPP was estimated by using the light use efficiency approach [32]. Table 1 presents all the data indexes used in our study.
2.3. Methods
2.3.1. Data Pre-Processing
First, the monthly LST was calculated by averaging all pixels collected over an 8 day period; the maximum value composite method was used to generate the monthly NDVI and LAI; and the monthly GPP was the cumulative value for each 8 days. LAI and GPP were re-sampled into 1 km using the bilinear interpolation algorithm [33]. In addition, we calculated the differences in water indices and temperature indices between the period of the extreme drought and 4 years before the extreme drought, respectively. After that, min-max normalization was carried out to standardize all data, including vegetation growth and productivity indices, scPDSI, water indices, and temperature indices, to eliminate the effects of dimensions among variables. Finally, similarly to Zhang et al. [34], we detrended the standardized NDVI, standardized LAI, and standardized GPP as the indices had an increased long-term trend under climate warming and the increases in CO2 concentrations [35].
2.3.2. Identification of the Extreme Drought
Previous studies indicated that the extreme drought during 2009/2010 occurred mainly in the winter of 2009 and the spring of 2010 [18,36]. Thus, according to the temporal changes in the standardized scPDSI index from August 2009 to July 2010, we selected 0.28 as the extreme drought threshold to determine the drought-affected area (Figure 2a). The first month with a standardized scPDSI below the threshold was considered the beginning of the extreme drought and the standardized scPDSI above the threshold was defined as the end of the extreme drought. Moreover, the detrended NDVI was taken as an example to show how vegetation changed in the drought-affected area. The change in the detrended NDVI was consistent with the standardized scPDSI during the extreme drought (Figure 2a). The standardized scPDSI and detrended NDVI values in the 4 years before the extreme drought were higher than those during the extreme drought (Figure 2b).
2.3.3. The Calculation of Vegetation Resilience and Recovery Time
To assess the response of vegetation to the extreme drought, we adopted the vegetation resistance, recovery, and resilience indices, which were proposed by Lloret et al. (2011) [37]. Firstly, we calculated the ratios of detrended indexes (i.e., NDVI, LAI, and GPP) in each month during the extreme drought to those of the same month before and after the extreme drought in the regions where the extreme drought occurred. Then, the mean values of resistance, recovery, and resilience in the base periods of 4 years were calculated. At the same time, to compare the spatial heterogeneity and determine the stability with time, we also calculated the mean values of resistance, recovery, and resilience in the base periods of 2 years and 8 years. The formulas of resistance, recovery, and resilience are as follows:
is resistance, is recovery, is resilience, is the value of the detrended index for each month during the extreme drought, is the value of the detrended index for each month before the extreme drought, is the value of the detrended index for each month after the extreme drought, is the detrended index, is the month in the 2 years, 4 years, and 8 years before or after the extreme drought, which corresponds to the same month during the extreme drought. The lower , the more seriously the vegetation was affected by the extreme drought. The lower , the worse the vegetation recovered after the extreme drought. Resilience was determined based on resistance and recovery.
Moreover, vegetation resistance, recovery, and resilience are closely related to water availability and temperature changes during the extreme drought [38]. First, we calculated the variance inflation factor (VIF) values of all water indices and temperature indices. If there were any indices with VIF values greater than 10, this indicated that multicollinearity existed, which needed to be eliminated. Then, we deleted the indices with the largest VIF values and recalculated the VIF values of the remaining indices until all the VIF values of the remaining indices were less than 10 [39,40]. Finally, the contribution percentages of water indices and temperature indices to vegetation resistance, recovery, and resilience were calculated based on the standardized regression coefficients using multiple linear regression. The formulas are as follows:
where is the resistance, recovery, and resilience of vegetation to the extreme drought based on 2, 4, and 8 years, respectively; is precipitation; is surface soil moisture; is root-zone soil moisture; is LST; is mean air temperature; is the standardized regression coefficient; and is the contribution percentage.
3. Results
3.1. Extreme Drought during 2009/2010
Spatially, the extreme drought occurred mainly in Yunnan, Guizhou, central and northern Guangxi, and northwestern Sichuan (Figure 3a). The spatial differences of the extreme drought were related to the changes in water and temperature (Figure 3b–f). In the drought-affected area, 96.95%, 87.46%, and 86.50% of the regions received less precipitation, surface soil moisture, and root-zone soil moisture than those of the 4 year period before the extreme drought, respectively, which led to a large area of water deficit. Moreover, over 55% and 65% of the regions experienced an increase in LST and mean air temperature, respectively. In November 2009, the drought-affected area in SWC was 90.24 × 10⁴ km2 (accounting for 57.16% of the total area), and in February 2010, the drought-affected area had increased to 112.60 × 10⁴ km2 (accounting for 71.33% of the total area) (Figure S1).
3.2. The Resilience of Vegetation Growth and Productivity to the Extreme Drought
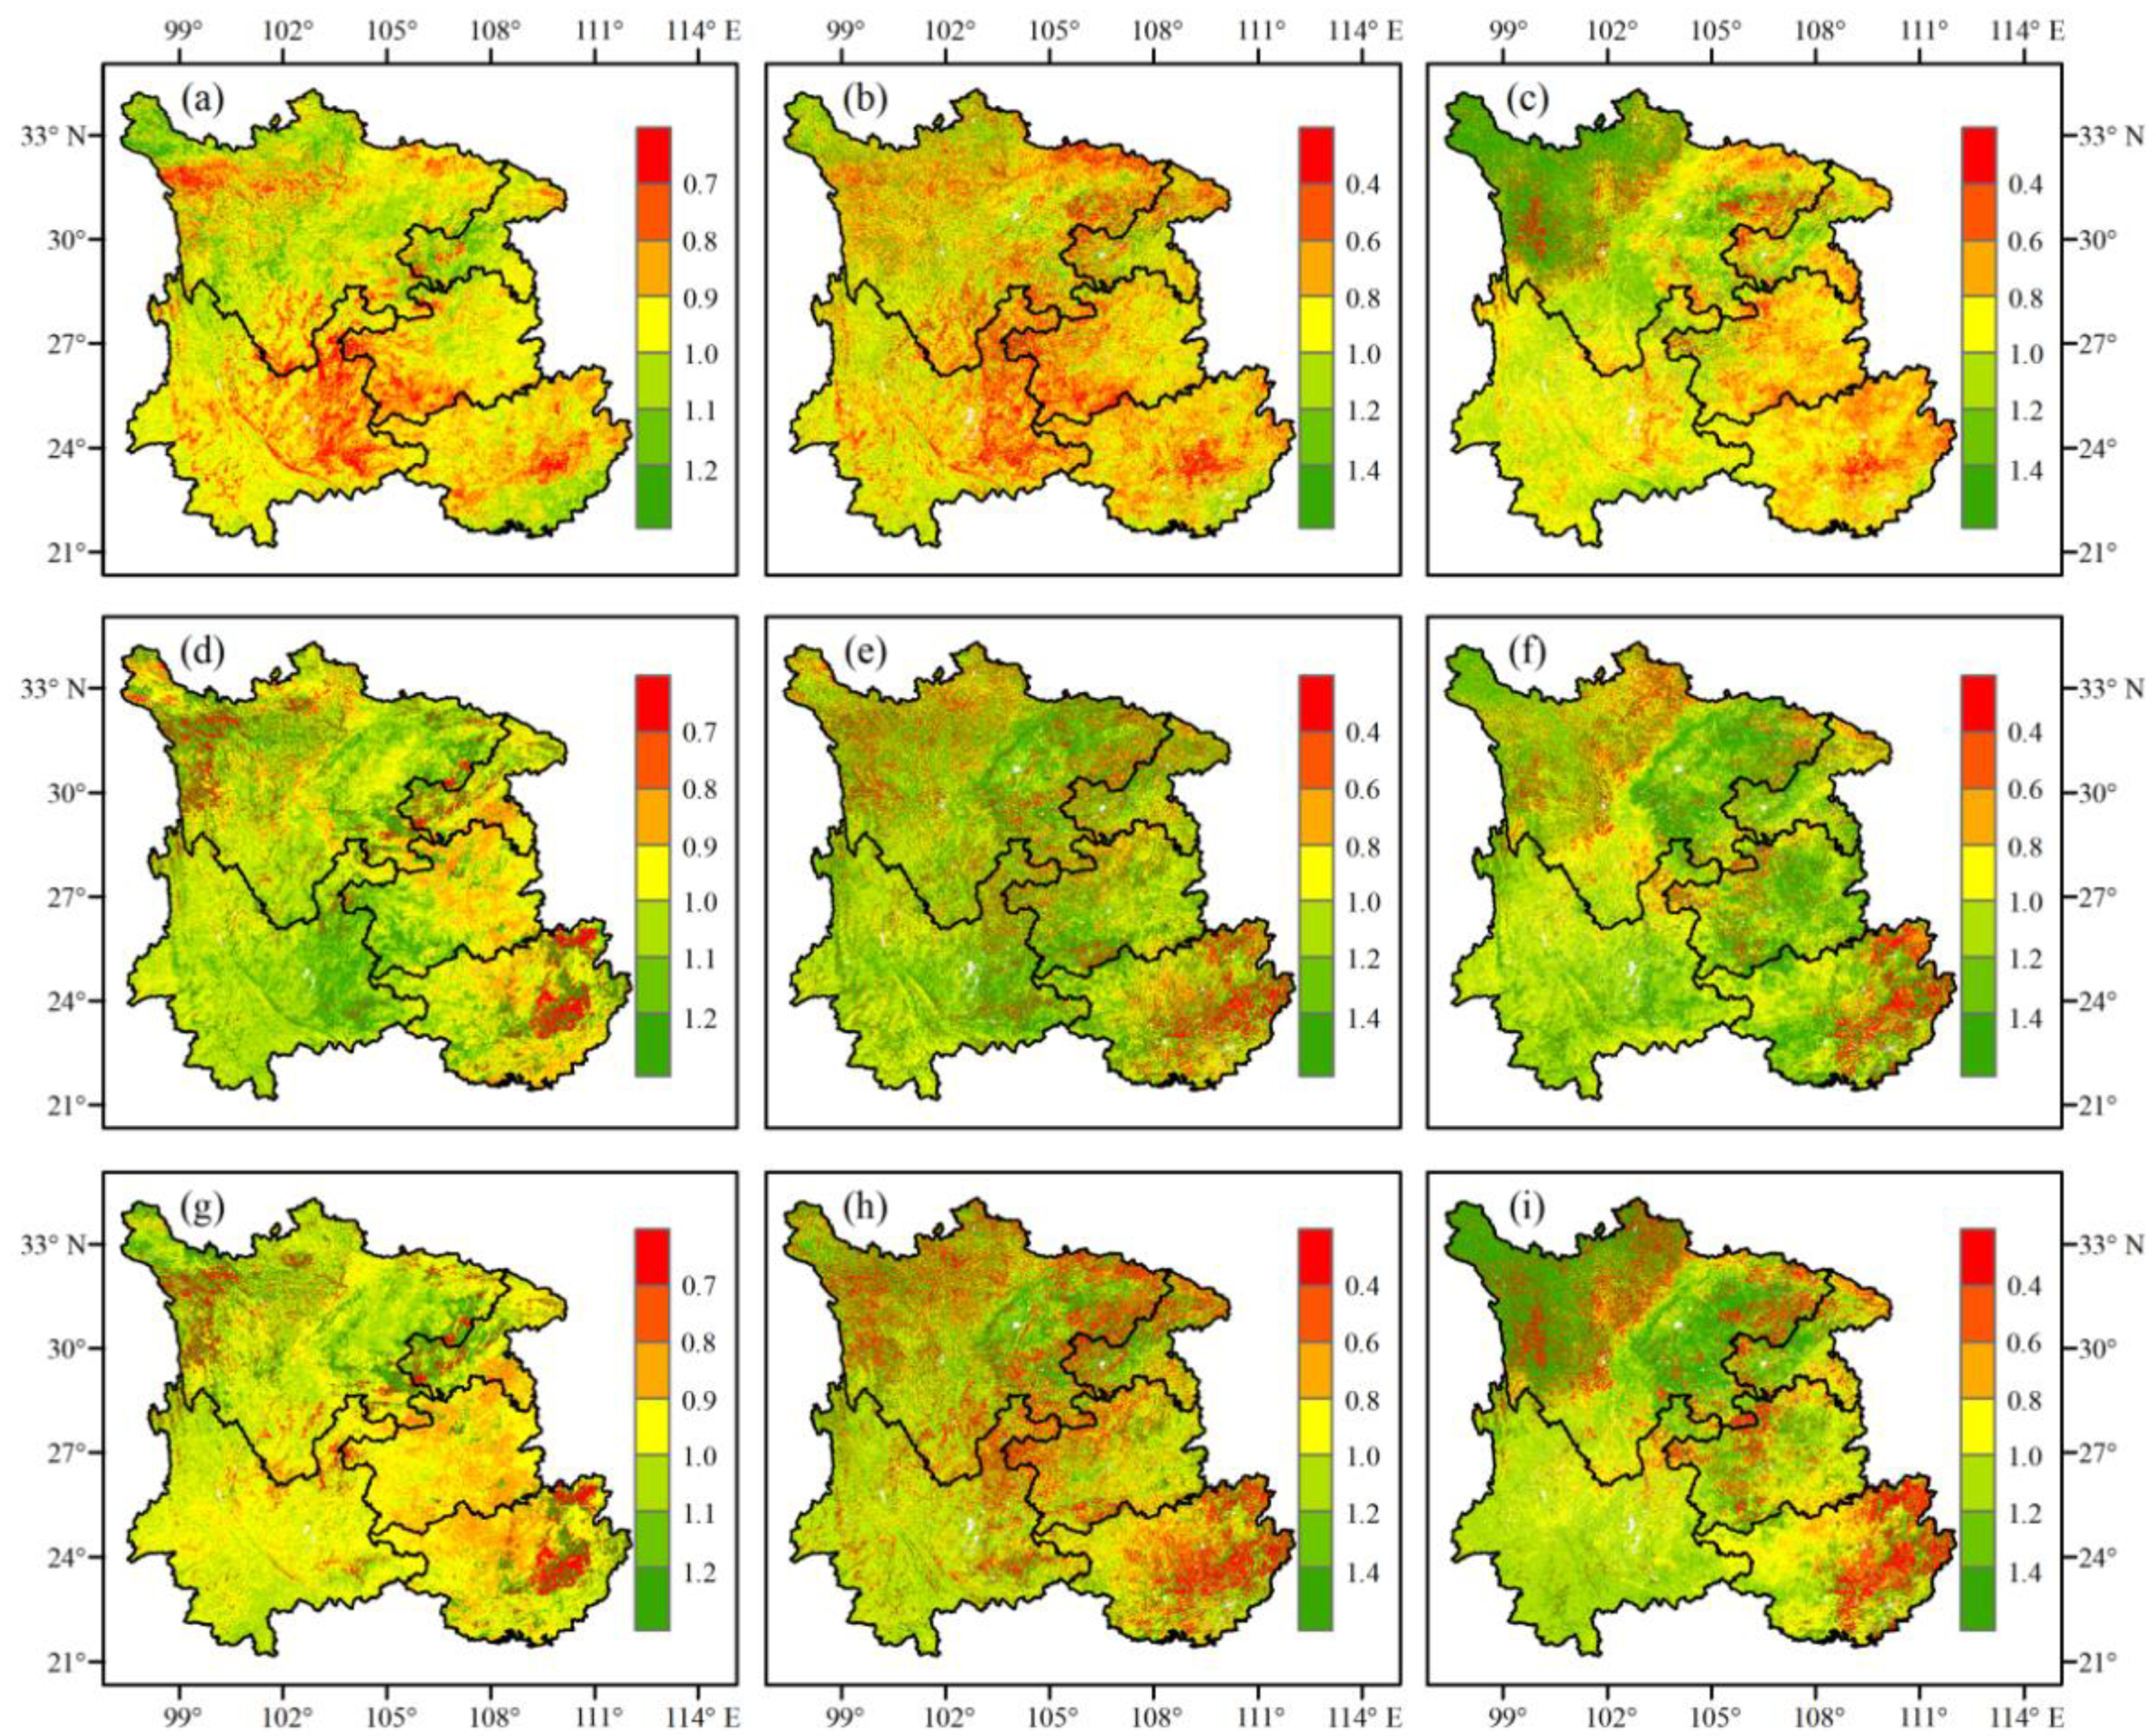
The extreme drought event during 2009/2010 significantly inhibited vegetation growth and productivity in the 4 year base period (Figure 4a–c). Regions that suffered from intensive NDVI reductions were found in eastern Yunnan, western Guizhou, and central Guangxi, whereas the central and eastern Guizhou and western Yunnan were less affected. The spatial distribution of the LAI reduction was similar to that of NDVI, but the magnitudes of change were larger. Unlike NDVI and LAI, decreases in GPP were mainly found in Guangxi and Guizhou, and Yunnan was less affected. The spatial distribution of NDVI, LAI, and GPP resistance calculated with 2 year and 8 year base periods was similar to that of the 4 year base period (Figures S2a–c and S3a–c).
Generally, resistance and recovery showed opposite spatial distribution patterns. Using the 4 year base period, we found that the recovery of NDVI, LAI, and GPP was high in Yunnan and Guizhou, where the resistance was low (Figure 4a–f). Such patterns were also found in the resistance and recovery of NDVI, LAI, and GPP in the 2 year and 8 year base periods (Figures S2a–f and S3a–f). The spatial distribution of resilience showed that the values of NDVI, LAI, and GPP after the extreme drought were lower than those before the extreme drought in Yunnan and Guizhou (Figure 4g–i, Figures S2g–i and S3g–i).
The resistance, recovery, and resilience of different vegetation types to the extreme drought showed large differences (Figure 5, Figures S4 and S5). Evergreen broadleaf forest suffered the least suppression during the extreme drought period. Cropland was greatly susceptible to the extreme drought and suffered the most dramatically negative impact (Figure 5a, Figures S4a and S5a). The recovery of NDVI, LAI, and GPP was relatively higher in cropland than in other vegetation types (Figure 5b, Figures S4b and S5b). The resilience results showed that the NDVI and LAI values of all vegetation after the extreme drought were lower than those from before the extreme drought, indicating that vegetation showed successively low growth after the extreme drought (Figure 5c, Figures S4c and S5c).
3.3. Vegetation Recovery Time
The recovery time of vegetation growth and productivity varied with vegetation types (Figure 6). The percentages of the NDVI and LAI recovery times showed that more than 80% of all vegetation recovered from the extreme drought within 5 months, but for GPP, vegetation took more time to recover. Deciduous broadleaf forest recovered faster than the other forest types, with more than 90% of the deciduous broadleaf forest recovering within 5 months for NDVI, LAI, and GPP. For evergreen broadleaf forest, 87.84%, 88.44%, and 62.17% of NDVI, LAI, and GPP recovered to pre-drought levels within 5 months, respectively. The NDVI, LAI, and GPP in deciduous broadleaf shrubland, grassland, and cropland took less time to recover from the extreme drought than that of evergreen broadleaf forest, evergreen needleleaf forest, and broadleaf and needleleaf mixed forest.
4. Discussion
4.1. Vegetation Resistance, Recovery, and Resilience
Previous studies showed opposing trends in tree resistance and recovery to extreme drought, that is, the higher the resistance, the lower the recovery, which was possibly due to the changes in the strategies of trees to extreme drought [12,14]. This phenomenon was also observed in southern Germany and Austria [41] and central Spain [42]. In our study, the value of recovery was relatively high with low resistance values, especially in Yunnan and Guizhou, where vegetation suffered from the most intensive drought (Figure 4a–f, Figures S2a–f and S3a–f).
The resistance and recovery of different vegetation types to extreme drought are divergent. In our study, we found that vegetation resistance and recovery to the extreme drought varied with vegetation types in SWC (Figure 5a,b, Figures S4a,b and S5a,b). Forests, especially evergreen broadleaf forest, displayed a higher resistance than other vegetation, whereas their recovery process was slow from the extreme drought. Cropland was susceptible to the extreme drought, but its level of recovery was higher. Evergreen broadleaf shrubland and deciduous broadleaf shrubland showed a moderate resistance and recovery, based on NDVI, LAI, and GPP, which was consistent with other studies [14]. Previous studies suggested that evergreen broadleaf forest could accelerate the loss of old leaves and maintain the growth of young leaves in the dry season to maintain photosynthetic utilization efficiency [43,44], which could be the reason why evergreen broadleaf forest displayed a higher resistance. Grassland demonstrated a strong ability to regrow from extreme drought [45] and it could recover quickly as long as the precipitation and temperature returned to the pre-drought conditions [46]. In comparison with grassland, the higher level of recovery of cropland was related with human cultivation and irrigation [3]. The values of NDVI and LAI after the extreme drought were lower than those before the extreme drought (Figure 5c, Figures S4c and S5c), which may be because the extreme drought affected xylem growth and reduced water transport rates, leading to low growth [10].
4.2. Factors Affecting Vegetation Resistance, Recovery, and Resilience
Vegetation resistance, recovery, and resilience indices are related to many factors, such as water availability [47], temperature [38], altitude [48], biodiversity [49,50], tree age [51], and tree density [52]. Water scarcity and warming are important factors affecting vegetation growth [48,53]. In our study, the normalized regression coefficients of surface soil moisture and the resistance of vegetation, NDVI and LAI, in evergreen broadleaf forest, evergreen needleleaf forest, evergreen broadleaf shrubland, deciduous broadleaf shrubland, and grassland were positive and significant, that is, the increase in surface soil moisture could significantly improve the resistance of vegetation (Figure S6). Previous studies also showed that the ability of vegetation to resist drought was closely linked to the moisture availability under conditions of water stress [51,52]. A sharp decline in soil water impeded vegetation growth, reducing their ability to withstand the extreme drought [54,55]. When extreme drought continues, vegetation growth and productivity are further reduced [56].
4.3. Limitations and Perspectives
Estimation of the influences of extreme drought on vegetation critically relies on the data sources used [57]. However, remote sensing data have some common shortcomings, for example, the measurement is indirect; electromagnetic waves can be contaminated by clouds or aerosols during transmission, resulting in dead pixels; and there are artifacts associated with sensor malfunctioning [58]. In addition, NDVI, LAI, and GPP have their own shortcomings, for example, a significant limitation of NDVI is the saturation effect at high levels of vegetation cover [30]. When estimating the LAI of needleleaf forest, shoot clumping is not taken into account [31]. Furthermore, the algorithm used to estimate GPP has the limitation of the inappropriate characterization of light use efficiency [59], which may lead to an inaccurate estimation of resilience.
At present, there are many drought indices that can be used to characterize extreme drought, for example, extreme drought can be quantified based on the changes in environmental factors (such as precipitation and temperature) or vegetation indices (such as NDVI and the enhanced vegetation index (EVI)) [60]. Moreover, the effects of extreme drought events on vegetation are related with the season. Song et al. [18] revealed that vegetation growth and productivity decreased during the 2009/2010 winter-spring extreme drought, but were enhanced during the 2011 summer drought in SWC. Zhang and Zhang [61] also found that extreme drought did not always inhibit vegetation and its influence on vegetation was related to the local hydroclimate in China. In future studies, multiple drought indices can be used to describe the characteristics of extreme drought and the effects of different drought events on vegetation resilience should be compared.
In SWC, the government has implemented some ecological protection projects, such as the Natural Forest Protection Project and the Grain for Green Program [62]. Vegetation coverage and productivity in SWC has been improved and previous studies have indicated that the mean annual NDVI, LAI, and GPP in SWC showed an increasing trend from 2000 to 2018, with rates of 0.003, 0.04 m2 m−2, and 10.58 g C m−2, respectively [35]. Since human activities greatly influence vegetation growth and productivity [63], they should be considered in future studies. However, it is not always easy to distinguish between natural and human-induced environmental factors, because the occurrence of extreme drought events and the accompanying changes in meteorological variables are linked to human-driven climate change.
Our results showed that the NDVI and LAI values of vegetation in SWC were able to recover by more than 80% within 5 months. However, the vegetation showed low growth after the extreme drought. Thus, we should not ignore the negative impact of extreme drought on vegetation growth and productivity. Government managers can formulate appropriate policies to better cope with extreme drought, such as protecting local vegetation, supporting precise agriculture irrigation, and maintaining and planting highly drought-resilient plants.
5. Conclusions
The ecosystem in SWC is highly sensitive to climate change and extreme weather events have increased significantly in the past few decades. The 2009/2010 extreme drought in SWC was a “once-in-a-century” drought event. We analyzed the resilience of different vegetation types to this extreme drought. The extreme drought event occurred mainly in Yunnan and Guizhou. The resistance, recovery, and resilience of vegetation to extreme drought were related to vegetation types. The resistance of evergreen broadleaf forest to the extreme drought was high, but cropland was more sensitive to the extreme drought. The NDVI and LAI values of vegetation were able to recover within 5 months, whereas GPP took a longer time to recover from the extreme drought. Our study underscores that surface soil moisture is an important factor affecting the ability of vegetation to resist the extreme drought in SWC compared with other water and temperature indices and may help government managers to formulate appropriate measures according to the responses of different vegetation types to extreme drought to reduce the damage caused by extreme droughts in the future.
Supplementary Materials
The following supporting information can be downloaded at: https://0-www-mdpi-com.brum.beds.ac.uk/article/10.3390/f13060851/s1, Figure S1 shows the statistical results for the drought-affected area in SWC. Figures S2 and S3 show the spatial distribution of resistance, recovery, and resilience in the 2 year and 8 year base periods, respectively. Figures S4 and S5 show the resistance, recovery, and resilience of different vegetation types to the extreme drought in the 2 year and 8 year base periods, respectively. Figures S6–S8 show the contribution percentages of water indices and temperature indices to resistance, recovery, and resilience of the different vegetation types, respectively.
Author Contributions
Conceptualization, H.S. and Y.Z.; methodology, H.S. and Y.Z.; software, H.S.; writing—original draft preparation, H.S.; writing—review and editing, Y.Z., Z.Y., F.G. and Z.P. All authors have read and agreed to the published version of the manuscript.
Funding
This study was supported by the National Key Research and Development Program of China (No.2021YFD2200401) and the National Natural Science Foundation of China (No.31971460).
Institutional Review Board Statement
Not applicable.
Informed Consent Statement
Not applicable.
Data Availability Statement
The data presented in this study are available on request from the corresponding author.
Conflicts of Interest
The authors declare no conflict of interest.
References
- Connolly, R.; Connolly, M.; Carter, R.M.; Soon, W. How Much Human-Caused Global Warming Should We Expect with Business-As-Usual (BAU) Climate Policies? A Semi-Empirical Assessment. Energies 2020, 13, 1365. [Google Scholar] [CrossRef] [Green Version]
- Mikhaylov, A.; Moiseev, N.; Aleshin, K.; Burkhardt, T. Global climate change and greenhouse effect. Entrep. Sustain. Iss. 2020, 7, 2897–2913. [Google Scholar] [CrossRef]
- Li, X.; Li, Y.; Chen, A.; Gao, M.; Slette, I.J.; Piao, S. The impact of the 2009/2010 drought on vegetation growth and terrestrial carbon balance in Southwest China. Agric. For. Meteorol. 2019, 269, 239–248. [Google Scholar] [CrossRef]
- Reichstein, M.; Bahn, M.; Ciais, P.; Frank, D.; Mahecha, M.D.; Seneviratne, S.I.; Zscheischler, J.; Beer, C.; Buchmann, N.; Frank, D.C.; et al. Climate extremes and the carbon cycle. Nature 2013, 500, 287–295. [Google Scholar] [CrossRef] [PubMed]
- Gentilesca, T.; Camarero, J.J.; Colangelo, M.; Nolè, A.; Ripullone, F. Drought-induced oak decline in the western Mediterranean region: An overview on current evidences, mechanisms and management options to improve forest resilience. iForest 2017, 10, 796–806. [Google Scholar] [CrossRef] [Green Version]
- Gheyret, G.; Zhang, H.; Guo, Y.; Liu, T.; Bai, Y.; Li, S.; Schmid, B.; Bruelheide, H.; Ma, K.; Tang, Z. Radial growth response of trees to seasonal soil humidity in a subtropical forest. Basic Appl. Ecol. 2021, 55, 74–86. [Google Scholar] [CrossRef]
- Ingrisch, J.; Bahn, M. Towards a Comparable Quantification of Resilience. Trends Ecol. Evol. 2018, 33, 251–259. [Google Scholar] [CrossRef]
- Keersmaecker, W.D.; Lhermitte, S.; Tits, L.; Honnay, O.; Somers, B.; Coppin, P. A model quantifying global vegetation resistance and resilience to short-term climate anomalies and their relationship with vegetation cover. Glob. Ecol. Biogeogr. 2015, 24, 539–548. [Google Scholar] [CrossRef]
- Huang, K.; Xia, J. High ecosystem stability of evergreen broadleaf forests under severe droughts. Glob. Change Biol. 2019, 25, 3494–3503. [Google Scholar] [CrossRef]
- DeSoto, L.; Cailleret, M.; Sterck, F.; Jansen, S.; Kramer, K.; Robert, E.M.R.; Aakala, T.; Amoroso, M.M.; Bigler, C.; Camarero, J.J.; et al. Low growth resilience to drought is related to future mortality risk in trees. Nat. Commun. 2020, 11, 545. [Google Scholar] [CrossRef]
- Gazol, A.; Camarero, J.J.; Vicente-Serrano, S.M.; Sánchez-Salguero, R.; Gutiérrez, E.; Luis, M.D.; Sangüesa-Barreda, G.; Novak, K.; Rozas, V.; Tíscar, P.A.; et al. Forest resilience to drought varies across biomes. Glob. Change Biol. 2018, 24, 1–16. [Google Scholar] [CrossRef] [PubMed]
- Fang, O.; Zhang, Q. Tree resilience to drought increases in the Tibetan Plateau. Glob. Change Biol. 2019, 25, 1–9. [Google Scholar] [CrossRef] [PubMed]
- Fan, X.; Hao, X.; Hao, H.; Zhang, J.; Li, Y. Comprehensive Assessment Indicator of Ecosystem Resilience in Central Asia. Water 2021, 13, 124. [Google Scholar] [CrossRef]
- Li, X.; Piao, S.; Wang, K.; Wang, X.; Wang, T.; Ciais, P.; Chen, A.; Lian, X.; Peng, S.; Peñuelas, J. Temporal trade-off between gymnosperm resistance and resilience increases forest sensitivity to extreme drought. Nat. Ecol. Evol. 2020, 4, 1075–1083. [Google Scholar] [CrossRef] [PubMed]
- Kannenberg, S.A.; Novick, K.A.; Alexander, M.R.; Maxwell, J.T.; Moore, D.J.P.; Phillips, R.P.; Anderegg, W.R.L. Linking drought legacy effects across scales: From leaves to tree rings to ecosystems. Glob. Change Biol. 2019, 25, 2978–2992. [Google Scholar] [CrossRef] [PubMed]
- Keyserlingk, J.V.; Hoop, M.D.; Mayor, A.G.; Dekker, S.C.; Rietkerk, M.; Foerster, S. Resilience of vegetation to drought: Studying the effect of grazing in a Mediterranean rangeland using satellite time series. Remote Sens. Environ. 2021, 255, 112270. [Google Scholar] [CrossRef]
- Liu, C.; Liu, Y.; Fan, D.; Guo, K. Plant drought tolerance assessment for re-vegetation in heterogeneous karst landscapes of southwestern China. Flora 2012, 207, 30–38. [Google Scholar] [CrossRef]
- Song, L.; Li, Y.; Ren, Y.; Wu, X.; Guo, B.; Tang, X.; Shi, W.; Ma, M.; Han, X.; Zhao, L. Divergent vegetation responses to extreme spring and summer droughts in Southwestern China. Agric. For. Meteorol. 2019, 279, 107703. [Google Scholar] [CrossRef]
- Lai, P.; Zhang, M.; Ge, Z.; Hao, B.; Song, Z.; Huang, J.; Ma, M.; Yang, H.; Han, X. Responses of Seasonal Indicators to Extreme Droughts in Southwest China. Remote Sens. 2020, 12, 818. [Google Scholar] [CrossRef] [Green Version]
- Wang, W.; Wang, W.; Li, J.; Wu, H.; Xu, C.; Liu, T. The Impact of Sustained Drought on Vegetation Ecosystem in Southwest China Based on Remote Sensing. Procedia Environ. Sci. 2010, 2, 1679–1691. [Google Scholar] [CrossRef] [Green Version]
- Ge, W.; Han, J.; Zhang, D.; Wang, F. Divergent impacts of droughts on vegetation phenology and productivity in the Yungui Plateau, southwest China. Ecol. Indic. 2021, 127, 107743. [Google Scholar] [CrossRef]
- Wang, M.; Ding, Z.; Wu, C.; Song, L.; Ma, M.; Yu, P.; Lu, B.; Tang, X. Divergent responses of ecosystem water-use efficiency to extreme seasonal droughts in Southwest China. Sci. Total Environ. 2020, 760, 143427. [Google Scholar] [CrossRef] [PubMed]
- Wu, B. China’s Land Cover; Science Press: Beijing, China, 2017. [Google Scholar]
- Wu, B.; Qian, J.; Zeng, Y. Land Cover Atlas of the People’s Republic of China (1:1,000,000); SinoMaps Press: Beijing, China, 2017. [Google Scholar]
- Wells, N.; Goddard, S.; Hayes, M.J. Self-Calibrating Palmer Drought Severity Index. J. Clim. 2004, 17, 2335–2351. [Google Scholar] [CrossRef]
- Peng, S.; Ding, Y.; Wen, Z.; Chen, Y.; Cao, Y.; Ren, J. Spatiotemporal change and trend analysis of potential evapotranspiration over the Loess Plateau of China during 2011–2100. Agric. For. Meteorol. 2017, 233, 183–194. [Google Scholar] [CrossRef] [Green Version]
- Son, N.T.; Chen, C.F.; Chen, C.R.; Chang, L.Y.; Minh, V.Q. Monitoring agricultural drought in the Lower Mekong Basin using MODIS NDVI and land surface temperature data. Int. J. Appl. Earth Obs. 2012, 18, 417–427. [Google Scholar] [CrossRef]
- Zhang, G.; Yao, T.; Xie, H.; Qin, J.; Ye, Q.; Dai, Y.; Guo, R. Estimating surface temperature changes of lakes in the Tibetan Plateau using MODIS LST data. J. Geophys Res. Atmos. 2014, 119, 8552–8567. [Google Scholar] [CrossRef]
- Ding, Z.; Peng, J.; Qiu, S.; Zhao, Y. Nearly Half of Global Vegetated Area Experienced Inconsistent Vegetation Growth in Terms of Greenness, Cover, and Productivity. Earth’s Future 2020, 8, e2020EF001618. [Google Scholar] [CrossRef]
- Lange, M.; Dechant, B.; Rebmann, C.; Vohland, M.; Cuntz, M.; Doktor, D. Validating MODIS and Sentinel-2 NDVI Products at a Temperate Deciduous Forest Site Using Two Independent Ground-Based Sensors. Sensors 2017, 17, 1855. [Google Scholar] [CrossRef] [Green Version]
- Yan, K.; Park, T.; Yan, G.; Liu, Z.; Yang, B.; Chen, C.; Nemani, R.R.; Knyazikhin, Y.; Myneni, R.B. Evaluation of MODIS LAI/FPAR Product Collection 6. Part 2: Validation and Intercomparison. Remote Sens. 2016, 8, 460. [Google Scholar] [CrossRef] [Green Version]
- Tao, J.; Mishra, D.R.; Cotten, D.L.; O’Connell, J.; Leclerc, M.; Nahrawi, H.B.; Zhang, G.; Pahari, R. A Comparison between the MODIS Product (MOD17A2) and a Tide-Robust Empirical GPP Model Evaluated in a Georgia Wetland. Remote Sens. 2018, 10, 1831. [Google Scholar] [CrossRef] [Green Version]
- Zhu, X.; Liu, Y.; Xu, K.; Pan, Y. Effects of Drought on Vegetation Productivity of Farmland Ecosystems in the Drylands of Northern China. Remote Sens. 2021, 13, 1179. [Google Scholar] [CrossRef]
- Zhang, Y.; Liu, C.; Tang, Y.; Yang, Y. Trends in pan evaporation and reference and actual evapotranspiration across the Tibetan Plateau. J. Geophys. Res. Atmos. 2007, 112, D12110. [Google Scholar] [CrossRef]
- Shao, H.; Zhang, Y.; Gu, F.; Shi, C.; Miao, N.; Liu, S. Impacts of climate extremes on ecosystem metrics in southwest China. Sci. Total Environ. 2021, 776, 145979. [Google Scholar] [CrossRef]
- Chen, S.; Huang, Y.; Wang, G. Detecting drought-induced GPP spatiotemporal variabilities with sun-induced chlorophyll fluorescence during the 2009/2010 droughts in China. Ecol. Indic. 2020, 121, 107092. [Google Scholar] [CrossRef]
- Lloret, F.; Keeling, E.G.; Sala, A. Components of tree resilience: Effects of successive low-growth episodes in old ponderosa pine forests. Oikos 2011, 120, 1909–1920. [Google Scholar] [CrossRef]
- Panisset, J.S.; Libonati, R.; Gouveia, C.M.P.; Machado-Silva, F.; França, D.A.; França, J.R.A.; Peres, L.F. Contrasting patterns of the extreme drought episodes of 2005, 2010 and 2015 in the Amazon Basin. Int. J. Climatol. 2018, 38, 1096–1104. [Google Scholar] [CrossRef]
- Marudas, N.P.; Hahn, T.; Jacobs, F.A. An improved model of effects of accounting measures of inefficiency on donations. J. Financ. Account. 2014, 15, 1. [Google Scholar]
- Salmeron, R.; Garcia, C.; Lopez, M. A note about the variance inflation factor and the ridgeregression. In Proceedings of the Conference of Informatics and Management Sciences, Economy and Business Economics, Zilina, Slovakia, 25–29 March 2013. [Google Scholar]
- Zang, C.; Hartl-Meier, C.; Dittmar, C.; Rothe, A.; Menzel, A. Patterns of drought tolerance in major European temperate forest trees: Climatic drivers and levels of variability. Glob. Change Biol. 2015, 20, 3767–3779. [Google Scholar] [CrossRef]
- Zas, R.; Sampedro, L.; Solla, A.; Vivas, M.; Lombardero, M.J.; Alía, R.; Rozas, V. Dendroecology in common gardens: Population differentiation and plasticity in resistance, recovery and resilience to extreme drought events in Pinus pinaster. Agric. For. Meteorol. 2020, 291, 108060. [Google Scholar] [CrossRef]
- Wu, J.; Albert, L.P.; Lopes, A.P.; Restrepo-Coupe, N.; Hayek, M.; Wiedemann, K.T.; Guan, K.; Stark, S.C.; Christoffersen, B.; Prohaska, N.; et al. Leaf development and demography explain photosynthetic seasonality in Amazon evergreen forests. Science 2016, 351, 972–976. [Google Scholar] [CrossRef] [Green Version]
- Wei, S.; Yi, C.; Fang, W.; Hendrey, G. A global study of GPP focusing on light-use efficiency in a random forest regression model. Ecosphere 2017, 8, e01724. [Google Scholar] [CrossRef]
- Chen, N.; Zhang, Y.; Zu, J.; Zhu, J.; Zhang, T.; Huang, K.; Cong, N.; Wang, Z.; Li, J.; Zheng, Z.; et al. The compensation effects of post-drought regrowth on earlier drought loss across the tibetan plateau grasslands. Agric. For. Meteorol. 2020, 281, 107822. [Google Scholar] [CrossRef]
- Shinoda, M.; Nachinshonhor, G.U.; Nemoto, M. Impact of drought on vegetation dynamics of the Mongolian steppe: A field experiment. J. Arid Environ. 2010, 74, 63–69. [Google Scholar] [CrossRef]
- Liu, Y.; You, C.; Zhang, Y.; Chen, S.; Zhang, Z.; Li, J.; Wu, Y. Resistance and resilience of grasslands to drought detected by SIF in inner Mongolia, China. Agric. For. Meteorol. 2021, 308, 108567. [Google Scholar] [CrossRef]
- Gazol, A.; Camarero, J.J.; Anderegg, W.R.L.; Vicente-Serrano, S.M. Impacts of droughts on the growth resilience of Northern Hemisphere forests. Glob. Ecol. Biogeogr. 2017, 26, 166–176. [Google Scholar] [CrossRef]
- Sakschewski, B.; Bloh, W.V.; Boit, A.; Poorter, L.; Peña-Claros, M.; Heinke, J.; Joshi, J.; Thonicke, K. Resilience of Amazon forests emerges from plant trait diversity. Nat. Clim. Chang. 2016, 6, 1032–1036. [Google Scholar] [CrossRef]
- Anderegg, W.R.L.; Konings, A.G.; Trugman, A.T.; Yu, K.; Bowling, D.R.; Gabbitas, R.; Karp, D.S.; Pacala, S.; Sperry, J.S.; Sulman, B.N.; et al. Hydraulic diversity of forests regulates ecosystem resilience during drought. Nature 2018, 561, 538–541. [Google Scholar] [CrossRef] [Green Version]
- Gazol, A.; Ribas, M.; Gutiérrez, E.; Camarero, J.J. Aleppo pine forests from across Spain show drought-induced growth decline and partial recovery. Agric. For. Meteorol. 2017, 232, 186–194. [Google Scholar] [CrossRef]
- Serra-Maluquer, X.; Mencuccini, M.; Martínez-Vilalta, J. Changes in tree resistance, recovery and resilience across three successive extreme droughts in the northeast Iberian Peninsula. Oecologia 2018, 187, 343–354. [Google Scholar] [CrossRef]
- Yu, Z.; Wang, J.; Liu, S.; Rentch, J.S. Global gross primary productivity and water use efficiency changes under drought stress. Environ. Res. Lett. 2017, 12, 014016. [Google Scholar] [CrossRef] [Green Version]
- Allen, C.R.; Angeler, D.G.; Cumming, G.S.; Folke, C.; Twidwell, D.; Uden, D.R. Quantifying spatial resilience. J. Appl. Ecol. 2016, 53, 625–635. [Google Scholar] [CrossRef]
- Liou, Y.A.; Mulualem, G.M. Spatio-temporal Assessment of Drought in Ethiopia and the Impact of Recent Intense Droughts. Remote Sens. 2019, 11, 1828. [Google Scholar] [CrossRef] [Green Version]
- Koppel, J.V.D.; Rietkerk, M. Spatial interactions and resilience in arid ecosystems. Am. Nat. 2004, 163, 113–121. [Google Scholar] [CrossRef] [PubMed] [Green Version]
- Ng, M.K.P.; Yuan, Q.; Yan, L.; Sun, J. An Adaptive Weighted Tensor Completion Method for the Recovery of Remote Sensing Images With Missing Data. IEEE Trans. Geosci. Remote Sens. 2017, 55, 3367–3381. [Google Scholar] [CrossRef]
- Xu, H.; Wang, X.; Zhao, C.; Yang, X. Diverse responses of vegetation growth to meteorological drought across climate zones and land biomes in northern China from 1981 to 2014. Agric. For. Meteorol. 2018, 262, 1–13. [Google Scholar] [CrossRef]
- Liu, Z.; Wang, L.; Wang, S. Comparison of Different GPP Models in China Using MODIS Image and ChinaFLUX Data. Remote Sens. 2014, 6, 10215–10231. [Google Scholar] [CrossRef] [Green Version]
- Vicente-Serrano, S.M. Foreword: Drought Complexity and Assessment Under Climate Change Conditions. Cuadernos de Investigación Geográfica 2016, 42, 7–11. [Google Scholar] [CrossRef]
- Zhang, X.; Zhang, B. The responses of natural vegetation dynamics to drought during the growing season across China. J. Hydrol. 2019, 574, 706–714. [Google Scholar] [CrossRef]
- Zhao, A.; Zhang, A.; Liu, J.; Feng, L.; Zhao, Y. Assessing the effects of drought and “Grain for Green” Program on vegetation dynamics in China’s Loess Plateau from 2000 to 2014. Catena 2019, 175, 446–455. [Google Scholar] [CrossRef]
- Jiang, H.; Xu, X.; Guan, M.; Wang, L.; Huang, Y.; Jiang, Y. Determining the contributions of climate change and human activities to vegetation dynamics in agro-pastural transitional zone of northern China from 2000 to 2015. Sci. Total Environ. 2020, 718, 134871. [Google Scholar] [CrossRef]
Figure 1.
The spatial distribution of vegetation (a), geographical location (b), and percentages of vegetation (c) in SWC. EBF is evergreen broadleaf forest, DBF is deciduous broadleaf forest, ENF is evergreen needleleaf forest, DNF is deciduous needleleaf forest, MXF is broadleaf and needleleaf mixed forest, EBS is evergreen broadleaf shrubland, DBS is deciduous broadleaf shrubland, ENS is evergreen needleleaf shrubland, GRS is grassland, and CRP is cropland.

Figure 2.
The temporal changes of standardized scPDSI and detrended NDVI. The gray and green areas represent the period of the extreme drought (a) and the 4 year mean value before the extreme drought (b), respectively. A threshold of 0.28 was used for the beginning and end of the extreme drought.
Figure 2.
The temporal changes of standardized scPDSI and detrended NDVI. The gray and green areas represent the period of the extreme drought (a) and the 4 year mean value before the extreme drought (b), respectively. A threshold of 0.28 was used for the beginning and end of the extreme drought.

Figure 3.
The spatial distribution of standardized scPDSI (a) and the differences in precipitation (b), surface soil moisture (c), root-zone soil moisture (d), LST (e), mean air temperature (f) between the period of the extreme drought and the 4 year period before the extreme drought, respectively.
Figure 3.
The spatial distribution of standardized scPDSI (a) and the differences in precipitation (b), surface soil moisture (c), root-zone soil moisture (d), LST (e), mean air temperature (f) between the period of the extreme drought and the 4 year period before the extreme drought, respectively.

Figure 4.
Spatial distribution of resistance, recovery, and resilience (4 year base period). (a–c) show the resistance of the detrended NDVI, LAI, and GPP, respectively. (d–f) show the recovery of the detrended NDVI, LAI, and GPP, respectively. (g–i) show the resilience of the detrended NDVI, LAI, and GPP, respectively.

Figure 5.
Resistance (a), recovery (b), and resilience (c) of different vegetation types to the extreme drought in the 4 year base period.
Figure 5.
Resistance (a), recovery (b), and resilience (c) of different vegetation types to the extreme drought in the 4 year base period.

Figure 6.
The percentages of recovery time for different vegetation types, characterized by NDVI (a), LAI (b), and GPP (c).
Figure 6.
The percentages of recovery time for different vegetation types, characterized by NDVI (a), LAI (b), and GPP (c).


Table 1.
The data indexes used in our study.
| Variables | Temporal Resolution | Spatial Resolution | |
|---|---|---|---|
| Vegetation growth and productivity | MOD13 NDVI | 16 days | 1 km |
| MOD15A2 LAI | 8 days | 500 m | |
| MOD17A2 GPP | 8 days | 500 m | |
| Drought index | scPDSI | 1 month | 0.5° |
| Water indices | precipitation | 1 month | 1 km |
| surface soil moisture | 1 month | 0.25° | |
| root-zone soil moisture | 1 month | 0.25° | |
| Temperature indices | MOD11A2 LST | 8 days | 1 km |
| mean air temperature | 1 month | 1 km | |
Publisher’s Note: MDPI stays neutral with regard to jurisdictional claims in published maps and institutional affiliations. |
© 2022 by the authors. Licensee MDPI, Basel, Switzerland. This article is an open access article distributed under the terms and conditions of the Creative Commons Attribution (CC BY) license (https://creativecommons.org/licenses/by/4.0/).
Share and Cite
MDPI and ACS Style
Shao, H.; Zhang, Y.; Yu, Z.; Gu, F.; Peng, Z. The Resilience of Vegetation to the 2009/2010 Extreme Drought in Southwest China. Forests 2022, 13, 851. https://0-doi-org.brum.beds.ac.uk/10.3390/f13060851
AMA Style
Shao H, Zhang Y, Yu Z, Gu F, Peng Z. The Resilience of Vegetation to the 2009/2010 Extreme Drought in Southwest China. Forests. 2022; 13(6):851. https://0-doi-org.brum.beds.ac.uk/10.3390/f13060851
Chicago/Turabian StyleShao, Hui, Yuandong Zhang, Zhen Yu, Fengxue Gu, and Zhongtong Peng. 2022. "The Resilience of Vegetation to the 2009/2010 Extreme Drought in Southwest China" Forests 13, no. 6: 851. https://0-doi-org.brum.beds.ac.uk/10.3390/f13060851
Note that from the first issue of 2016, this journal uses article numbers instead of page numbers. See further details here.