
Effects of Litter Input on Temperature Sensitivity of Soil Organic Carbon Mineralization along a Forest Elevation Gradient


1
School of Forestry & Landscape Architecture, Anhui Agricultural University, Hefei 230036, China
2
Huitong Experimental Station of Forest Ecology, CAS Key Laboratory of Forest Ecology and Management, Institute of Applied Ecology, Shenyang 110016, China
*
Author to whom correspondence should be addressed.
Forests 2022, 13(8), 1250; https://0-doi-org.brum.beds.ac.uk/10.3390/f13081250
Submission received: 30 May 2022
/
Revised: 18 July 2022
/
Accepted: 5 August 2022
/
Published: 7 August 2022
(This article belongs to the Special Issue Carbon Fluxes and Production in Forest Ecosystems)
Abstract
:The mineralization of soil organic carbon (SOC) is generally stimulated under global warming, known as temperature sensitivity (Q10), which is critical for predicting terrestrial C-climate feedback. However, how Q10 varies in different elevations, particularly with litter input, constraining the establishment of accurate models remains poorly understood. Here, the soil samples of three elevations (750, 950, and 1150 m) were collected from the transition zone of subtropical and warm temperate forests in China for incubation. Soils were incubated with and without 13C-labeled Cunninghamia lanceolata litter at 15 °C and 17.4 °C for 97 days. Incubation process was divided into two stages (0–37 days and 38–97 days) according to the dynamics of CO2 emission. The results showed that Q10 did not change significantly with elevation in the first stage, but Q10 at 950 m was significantly higher than that at 1150 m in the second stage. The variations in Q10 with elevation were regulated by pH in the first stage, while soil C/N was the primary factors that regulated Q10 in the second stage. Q10 showed no response to litter input at 750 m, while it decreased at 950 m in both stages. Following litter input, Q10 at 1150 m increased in the first stage but kept stable in the second stage. The change in Q10 with litter input was mainly affected by the restriction of soil P availability. Overall, our findings emphasized the importance of vertical spatial heterogeneity of Q10 of SOC mineralization in order to improve the prediction accuracy of C dynamics in terrestrial ecosystems.
1. Introduction
The mineralization of soil organic carbon (SOC) is the second-largest carbon (C) flux in terrestrial ecosystem [1], releasing 98 ± 12 Pg C every year, thus its tiny changes may greatly affect the concentration of CO2 in the atmosphere [2,3]. Under the global warming scenario, the accelerated mineralization of SOC and ultimately releasing the largest amount of CO2 from soils to the atmosphere. This feedback was termed as Q10 quantified, a factor by which the rate of SOC mineralization is multiplied when temperature rises by 10 °C [4,5]. Furthermore, there has been promoted plant growth by warming, increasing the amount of litter imported into the soil. The increase of litter input mainly changed Q10 through nutrient changes and microbial community composition and activity [3,6]. However, soil nutrients and microbial community composition and activity may differ along the elevation gradient. Thus, there has been considerable uncertainties in the response of Q10 to litter input, especially over different spatial gradients. Therefore, it is necessary to determine the vertical heterogeneity of Q10 and its response to litter input, in order to improve the prediction of the magnitude and direction of soil C-climate feedback in terrestrial ecosystems.
Q10 has been widely studied in terrestrial ecosystems [6,7], yet great uncertainties in the spatial heterogeneity of Q10 constrain the establishment of accurate C-climate models [8]. So far, most studies concerning the spatial distribution of Q10 focus on the horizontal pattern [7,8,9]. In contrast, less attention paid to the vertical variations in Q10. However, a growing body of studies demonstrated that the Q10 of SOC mineralization varies greatly along vertical spatial gradient, with significant increases [10], decreases [11] or no change in Q10 with elevation [12]. In addition, the critical role of soil properties, microbial community composition and activity in regulating Q10 have been emphasized in previous studies, however, the mechanism and regulatory factors of the vertical heterogeneity of Q10 are not clear [12,13].
In this field, the Q10 of SOC mineralization is closely associated with substrate availability, which could be impacted by litter input [14]. Generally, litter input stimulates the mineralization of SOC by stimulating soil microbial activity, which is termed as priming effect [15]. However, whether litter input affects the Q10 of SOC mineralization remains unclear [16,17]. Labile organic carbon (LOC) is enriched [18,19] and nutrient availability is altered [20] following litter input, affecting soil extracellular enzyme activity [21], which may lead to changes in Q10 [22]. For instance, some recent studies found that litter was recalcitrant to soil microorganisms and thus reduces Q10 value [23,24]. Moreover, litter input was affected by differences in microbial community composition at different elevations. Consequently, it is a complicated task to understand the response of Q10 to litter input, particularly along elevation gradients. In particular, it is not clear how Q10 will react to garbage input at different elevations.
Most previous studies on Q10 mainly focused on subtropical zone and warm temperate zone [25,26]. In addition, transition zones are more sensitive to changes in global change, due to their relatively unstable composition. However, few studies concerned the C dynamics in transition zone with greater vegetation and microbial diversity under global change. Thus, soil C cycling and their responses to climate might be different from those in subtropical zones and warm temperate zones. In this study, soils from three elevations in the transition zone of subtropical and warm temperate forests were collected and incubated with and without 13C-labelled litter at 15 °C and 17.4 °C, respectively. The main objectives of this study were: (1) to reveal the spatial pattern of Q10 of SOC mineralization at different elevations; (2) to clarify the response of Q10 to litter input at different elevations.
2. Materials and Methods
2.1. Site Description and Soil Sampling
The soil used in this experiment was collected at the Mazongling experimental forestry station in Anhui province (115°31′~115°50′ E, 31°10′~31°20′ N). The climate type is a subtropical humid monsoon climate, with a mean annual temperature (MAT) that range from 13–15 °C and a mean annual precipitation (MAP) of about 1510 mm. The soils of three elevations (750; 950; 1150 m) are sandy loam, loamy sandy and loam, respectively, with distinct soil properties (Table 1). Cunninghamia lanceolata is the dominant species.
The soil samples were collected at a layer of 0–20 cm from four 20 × 20 m plots at three elevations after removing the litter on the soil surface. Twenty soil cores were randomly collected from each plot using a metal sampler and mixed as composite samples. Fresh soil samples were stored in sealed bags and immediately transported to the laboratory and sieved through a 2 mm mesh after removing visible organic debris, roots, and stones. There are four samples with spatially independent samples from each elevation, respectively. In total, 12 soil samples were collected in our study. Part of the soil samples were air-dried naturally for analysis of physical and chemical properties, and the other part was stored in a refrigerator at 4 °C. Samples for PLFA were freeze-dried and stored at −20 °C prior to lipid extraction.
2.2. Experimental Design and Soil Incubation
In this study, the elevation represents an increase of MAT, and the temperature increase interval of 2.4 °C was set according to according to temperature decrease by 0.6 m for every 100 m increase. Therefore, four treatments were set up, with four replicates at each elevation: (1) soil without litter at 15 °C; (2) soil with litter added at 15 °C; (3) soil without litter at 17.4 °C; (4) soil with litter added at 17.4 °C. A total of 100 g of soil (dry weight) for each replicate of each treatment was placed in a 1 L Mason jar for incubation. The litter is cut into a 2 mm sieve and mixed evenly with the soil. The added litter is 5% SOC Chinese fir litter, which are labeled 13C and the abundance was 255‰. The temperature is increased by 2.4 °C using a fully automatic incubator. The soil moisture is maintained at 50% of water hold capacity during incubation. Close air compressor pump and the valve on the bottle cap after 1 min ventilation. The Mason jar is sealed for 24 h and then air is collected. Air is collected after 1, 4, 7, 11, 15, 21, 27, 37, 47, 57, 67, 77, 87 and 97 days of the incubation. Soil moisture was supplemented regularly (every 15 days) to ensure that the soil water loss rate is less than 2%.
2.3. Determination of Soil Physical and Chemical Properties
Soil texture (<53 µm, 53–250 µm, >250 µm) was measured by wet screening method [27]. The pH at a soil: water ratio of 1:2.5 (w/v) was measured using soil pH meter (PB-10C, Sartorius, Germany). SOC and total nitrogen (N) contents were determined by elemental analyzer (Elemementar Vario ELIII, Germany). The contents of exchangeable cations (K+, Na+, Ca2+, Mg2+) in soil, mineral N (NH4+-N and NO3−-N), total P and available P concentrations were determined using a continuous flow analyzer (AA3, Seal Analytical, Germany), according to Lu (2000) [28]. LOC content was determined through KMnO4 oxidation as described by Blair et al. (1995) [29]. DOC was determined by total organic carbon analyzer (TOC-VCPH, Shimadzu, Kyoto, Japan). Simply, soil solution was shaken by in a shaker (300 r/min) for 30 min to filter and obtain supernatant for measurement.
2.4. 13C labeled Litter Preparation
The two-year old Chinese fir seedlings were planted in a closed incubator with constant temperature and humidity for 5 months. During the incubation period, CO2 gas labeled with 13C was introduced. After that, the leaves were picked, deactivation of enzymes at 105 °C for 2 h, and dried to constant weight at 80 °C. Finally, the leaves were crushed for subsequent incubation experiments. The basic properties of Chinese fir leaves are as follows: total C content is 465.77 g/kg, total N content is 14.91 g/kg, C/N is 31.4, and δ13C value is 255‰.
2.5. Partitioning CO2 Sources and Q10 Calculations
In order to calculate the amount of carbon dioxide removed from the soil organic matter and the original organic carbon mineralization during the cultivation period, the following formula was used:
CF = CT(δT − δS/(δF − δS)
CS = CT − CF
In the Equations (1) and (2), CT (CT = CL + CS) is the total amount of CO2–C during the considered time interval and δT is the corresponding isotopic composition. δT corresponds to the isotopic composition; CF is the carbon amount produced by fresh organic matter (FOM); δF is the added FOM isotopic composition; CS is the carbon amount obtained from SOC; δS is the control soil 13C abundance of exhaled CO2. To determine the temperature sensitivity of mineralization rate of SOC, the following formula was used:
Q10 = (F1/F2)10/(T1-T2)
F1 is the mineralization rate of SOC at a higher temperature [mg(C–CO2)·kg−1·h−1], F2 is the mineralization rate of SOC at a lower temperature [mg(C–CO2)·kg−1·h −1]; T1 and T2 are the incubation temperature (°C).
2.6. PLFA Analysis
PLFA extraction was used to determine the abundance of microbial communities, and analyses were carried out, according to Wang et al. (2013b) [30]. In short, 5 g of freeze-dried soil was extracted for 2 h with a chloroform:methanol:phosphate buffer (1:2:0.8), and the phospholipids were separated from the other lipids on a silicic acid column. Samples were analyzed on an Agilent 6890 gas chromatograph with a flame ionization detector and an Ultra-2 column after the addition of fatty acid 19:0 as an internal standard. To identify the peaks, we employed the fatty acid methyl ester and BAME controls. Biomarkers PLFAs were used to access the major taxa of microorganisms and classify them according to Joergensen (2021) [31]. The i14:0, i15:0, a15:0, i16:0, i17:0, i18, a15:0, a16:0, a17:0, a18:0 and a 19:0 PLFAs served as markers for gram-positive (G+) bacteria, whereas the cy17:0, cy19:0, 16:1ω7, 16:1ω9, 17:1ω8 and 18:1ω7 functioned as markers for gram-negative (G-) bacteria. Besides, fungi were designated by the letters 16:1ω5c, 18:1ω9c, 18:2ω6c and 18:3ω6,9,12 and the 10Me 16:0, 10Me, 17:0 and 10Me 18:0 PLFAs were markers for actinomycetes. The total number of PLFA biomarkers was considered to be representative of the microbial biomass.
2.7. Enzyme Kinetics
β-glucosidase (BG), N-acetyl aminopeptidase (NAG), Cellulase (Cello), Xylanase (Xyl), Leucine aminopeptidase (Leu) and Tyrosinase (Tyr) were determined by 96-well enzyme plate. According to the method provided by German et al. (2011) [32] and Razavi et al. (2015) [33]. The specific steps are as follows: 1 g fresh soil was weighed in a hydrolytic flask, 50 mL ultra-pure water was added, and the soil was shaken on a shaker for 40 min, followed by low energy ultrasound (40 J S−1 output energy) 2 min. Then add 50 µL soil solution, 100 µL substrate solution and 50 µL buffer solution [MES (C6H13NO4SNA0.5), (pH:6.5) for MUF substrate, TRIZMA (C4H11NO3 HCl, C4H11NO3), (pH: 7.2) for AMC substrates]. The plate was put into the microplate reader and measured at 0 min, 1 h and 2 h under the excitation wavelength of 360 nm and emission wavelength of 460 nm. Enzyme activity was expressed as MUF or AMC release in nmol per g dry soil per hour (nmol g−1 soil h−1). The enzyme activity was calculated by Michaelis–Menten equation, designated as formula:
V = Vmax[S]/(Km + [S])
Vmax is the maximum rate of enzyme activity. Km is the half-full sum constant, the concentration of the substrate at 1/2 Vmax, and [S] is the concentration of the substrate.
2.8. Statistical Analysis
One-way ANOVA was used to analyze differences in soil’s physical and chemical properties and microbial community composition among different elevations. Repeated measurement ANOVA was used to analyze the influence of elevation, litter input and their interaction to Q10, and Tukey’s HSD test was used to test the significance of differences at p = 0.05 level. Pearson correlation was used to detect the relationship between Q10 and soil’s physical and chemical properties and microbial community composition. Besides, Origin (2021) was used to perform linear fitting of Q10 with soil’s physical and chemical properties and Km of N enzyme, respectively, the linear fitting of SOC cumulative mineralization and available nutrients were also carried out. SPSS Version 23.0 (SPSS Inc., Chicago, IL, USA) was used for statistical analysis of the data.
3. Results
3.1. Soil Environmental Conditions at Different Elevations
The content of SOC, TN, mineral N, LOC and DOC were generally lower at medium elevation (950 m) than 750 m and 1150 m (Table 1). The soil samples at medium elevation have the highest sand content (p < 0.05). Furthermore, fungal PLFA were significantly higher at 750 m than those at medium elevation (Table 2, p < 0.05). The gram-negative bacteria at medium elevation were significantly lower than those at 750 m and 1150 m (p < 0.05).
3.2. The Influence of Elevations on Q10
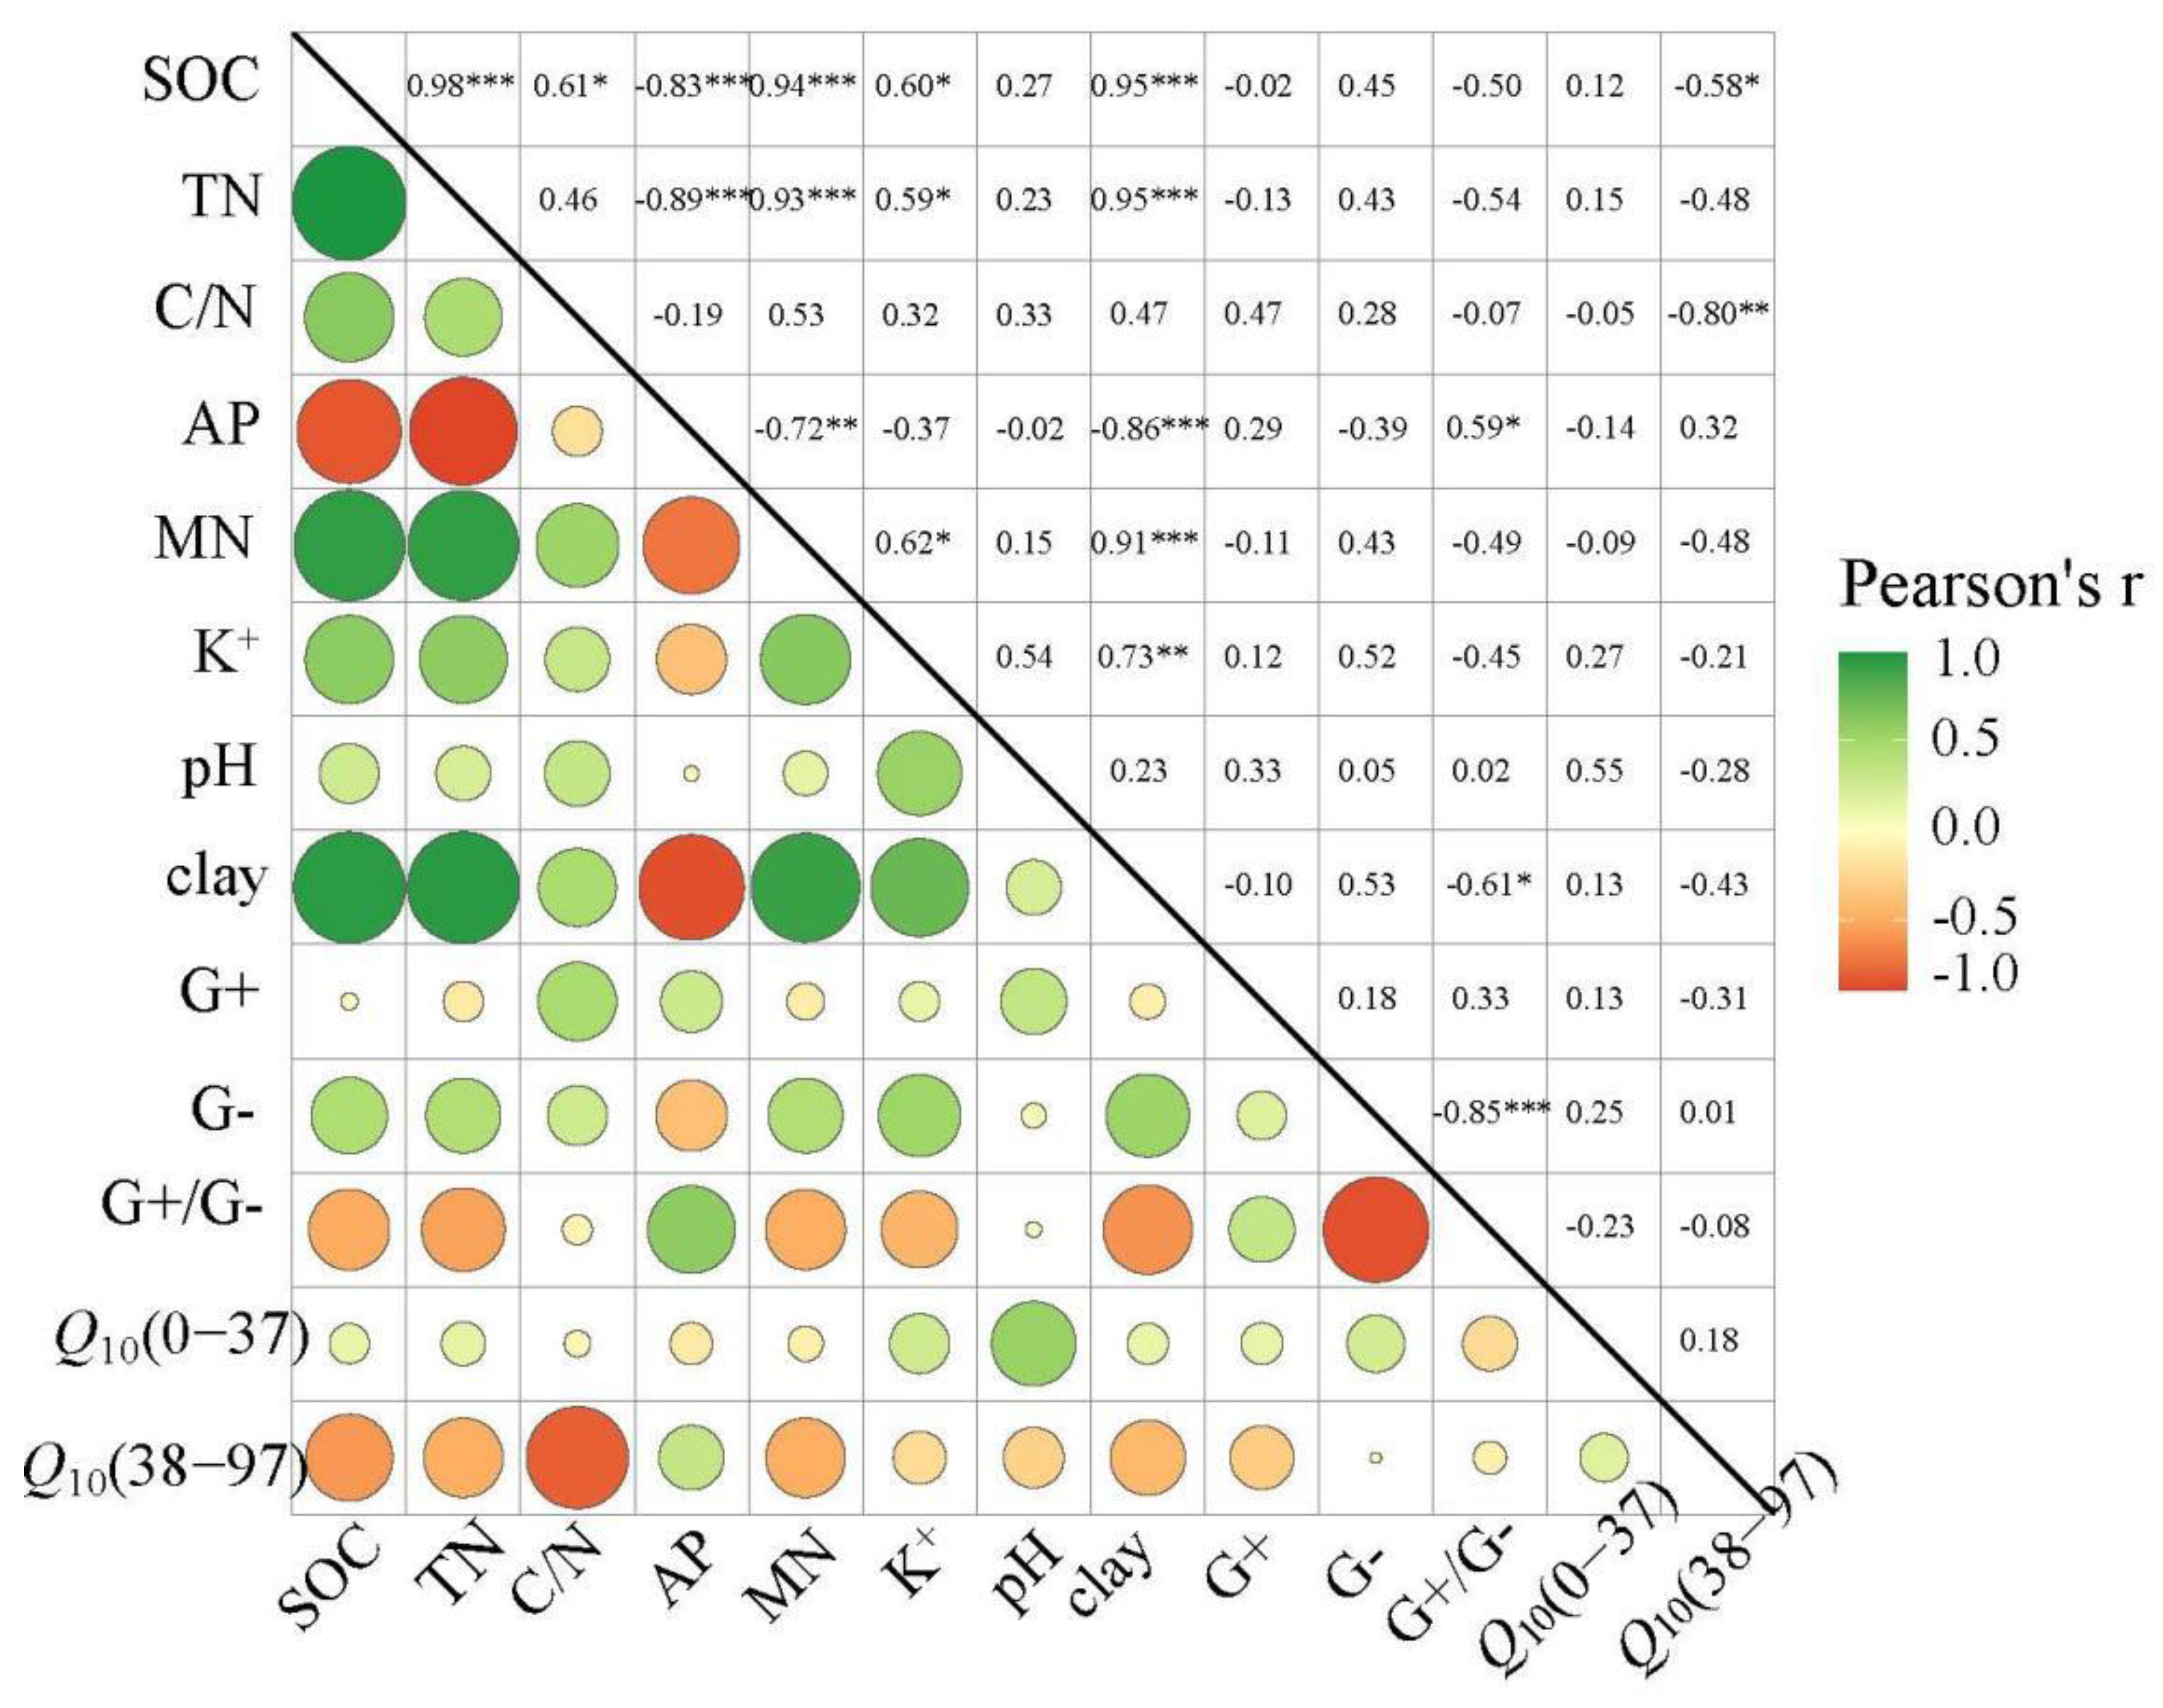
The CO2 emission rate roughly showed a similar trend in the whole incubation period at different elevations. It declined gradually during the first 37 days, and then remained basically unchanged with some fluctuations (Figure 1). Hence, incubation process was divided into two stages (0–37 days and 38–97 days), according to the dynamics of CO2 emission. The Q10 of SOC mineralization at different elevations varied from 1.92 to 4.15 in two stages (Figure 2). Q10 kept stable with elevation in the first stage (Figure 2A), while Q10 at medium elevation was significantly higher than at high elevation during the second stage (Figure 2B, p < 0.05). Q10 was mainly influenced by soil’s physical and chemical properties (Figure 3). Specifically, Q10 was positively related to pH in the first stage (Figure 3 and Figure 4A, p < 0.05), while negatively correlated with C/N and soil fertility (SOC, TN, mineral N) in the second stage (Figure 3 and Figure 4B, p < 0.05).
3.3. The Influence of Litter Input on Q10 at Different Elevations
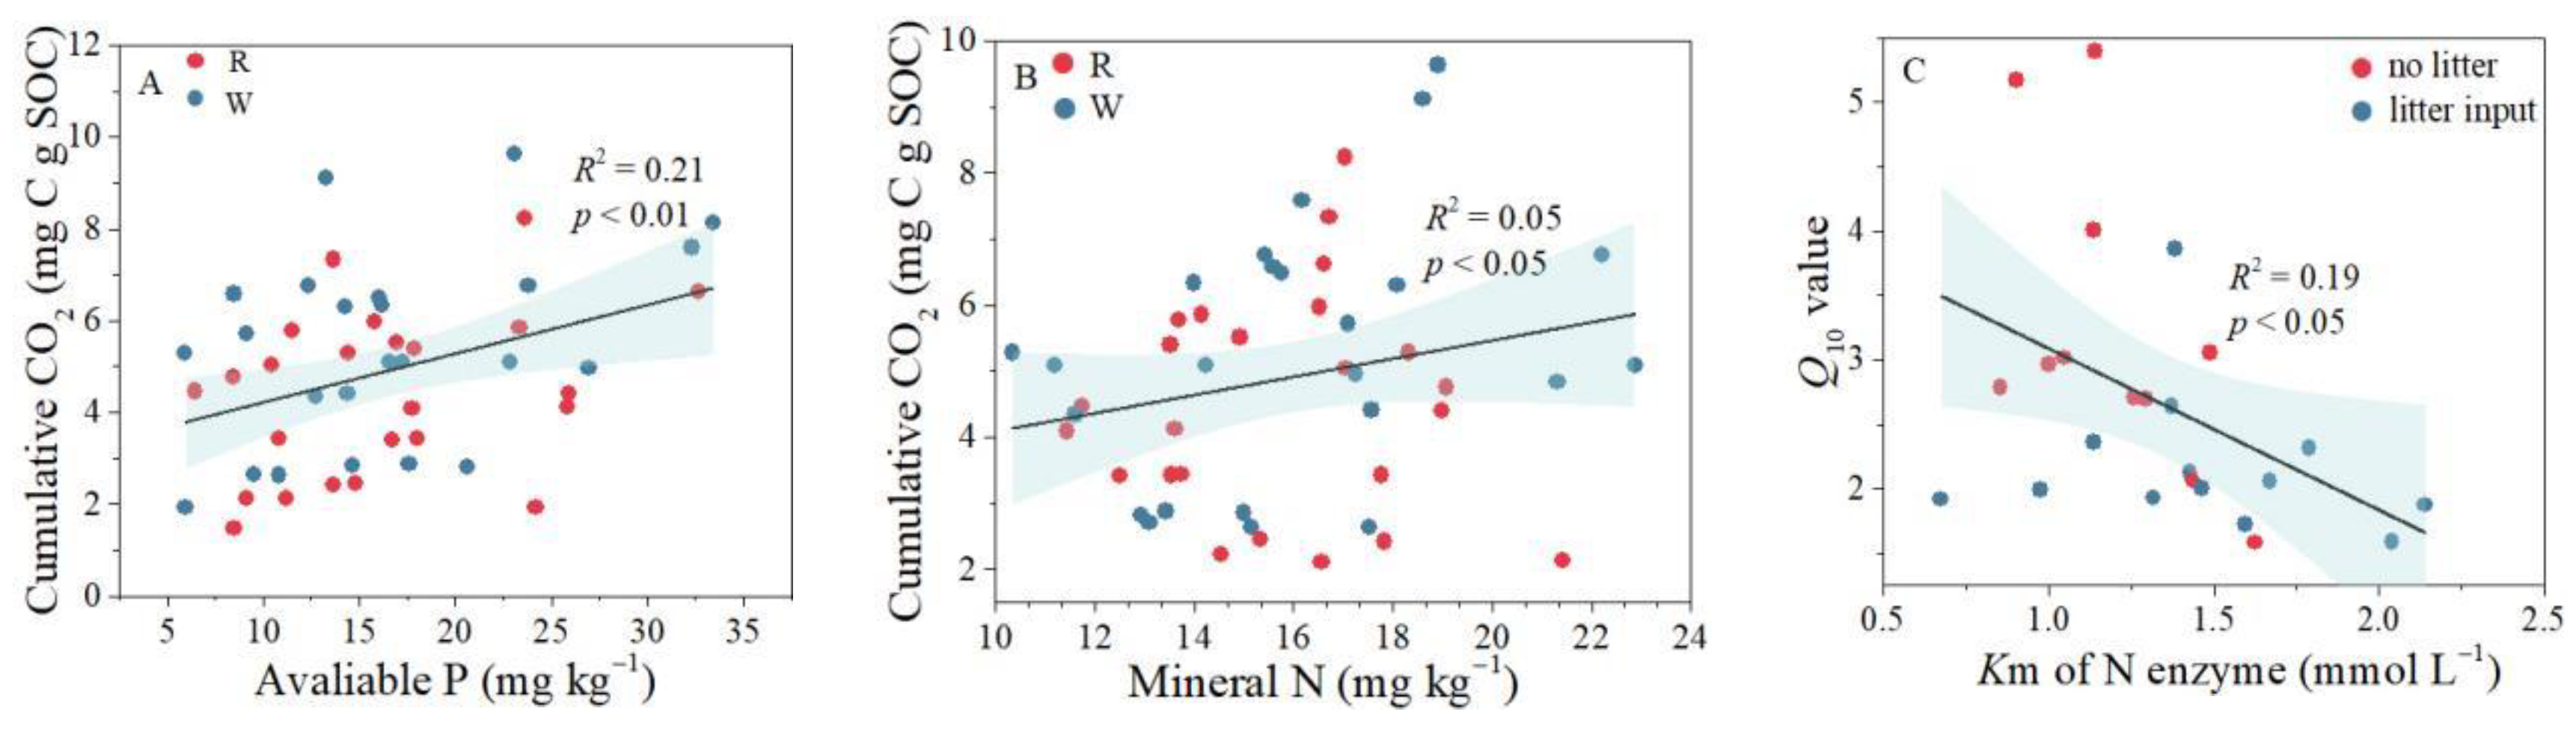
The effects of litter input on Q10 differed in soils of different elevations (Figure 2). Specifically, Q10 at medium elevation (950 m) decreased significantly in both stages, whereas Q10 at low elevation kept stable after litter input (Figure 2). The responses of Q10 to litter input at high elevation changed with incubation: litter input increased Q10 in the first stage, whereas it derived no impact on Q10 in the second stage. The response to litter input was closely related to nutrient availability, with cumulative CO2 positively correlated with available P, mineral N (Figure 5A,B). Besides, Km of the N-acquisition enzyme was negatively correlated with Q10 (Figure 5C).
4. Discussion
In this study, a 2.4 °C interval of incubation temperature, which was different from the previous experiment with 5 or 10 °C [33,34]. It has been evidenced that the intervals of incubation temperatures significantly affect the Q10 values, mainly from substrate consumption and microbial thermal adaptability [35] A growing number of studies have shown that warming temperature increases microbial activity and accelerates substrate consumption, which may reduce the Q10 of SOC mineralization [36]. On the other hand, the thermal adaptability of microorganisms can also have a certain impact [37]. Therefore, a 2.4 °C range we chose, which is based on the fact that every 100 m of elevation will decrease by 0.6°C, was used for the accurate assessment of Q10 values. Meanwhile, a 2.4 °C range is closer to the predicted increase in the global mean temperature at the end of the 21st century [38]. In addition, in many studies of SOC dynamics, the incubation time is less than 100 days, such as 10 days in Li et al. (2017) [18], 14 days in Liu et al. (2021) [39] and 90 days in Zhou et al. (2021) [40]. Therefore, time is not an absolute factor, and we pay more attention to the dynamic change of CO2. We can see the CO2 release rate has stabilized (Figure 1). So, 100 days is not a short period of time and can be a solid result. Additionally, longer incubation means more measurements, which is likely to introduce larger measuring error in cumulative SOC mineralization given the large number of jars measured a time in combination with the decrease in SOC mineralization rate. The priming effect after litter input also influenced the selection of incubation days. Ultimately, a short-term incubation (i.e., 97 days) was adopted in our experiment accordingly.
4.1. Q10 Response to Elevations
The Q10 values ranging from 2.04 to 4.15 in this study meet the global Q10 range from 1.9 to 5.7 [41]. Q10 did not respond to elevation in the first stage, however, varied significantly along the elevation gradient in the second stage (Figure 2). Elevation mainly affects Q10 through soil’s physical and chemical properties, based on empirical results [9]. Our results are in line with this idea because soil pH is more correlated with Q10 than other factors in the first stage (Figure 3). Previous studies reported that pH is considered to be an important determinant of microbial activity and composition [42]. Given the forest soils in our study are acidic (Table 1), the increase of microbial activity with soil pH could promote SOC mineralization, so Q10 was significantly positively correlated with pH (Figure 4A). This means that a range of soil acidification reduce the risk of C loss under the global warming scenario. In addition, no variation was detected in Q10 among soils of different elevation with similar pH values. In contrast, the soil C/N and clay content are key explanatory variables to Q10 in the second stage (Figure 3). Soil C/N has long been recognized as an indicator of soil C quality [39]. We found that Q10 was significantly and negatively correlated with soil C quality (Figure 4B), in line with the C-quality temperature hypothesis, which suggested that decomposition of higher quality organics has lower Q10 than that of lower quality organics [43]. Besides, given no significant variations in the C/N ratio at different elevations, the weaker physical protection by clay particles at medium elevation could be the primary cause of the higher Q10 [44,45]. Furthermore, SOC, TN and Mineral N, representing soil fertility, were negatively correlated with Q10 in the second stage. This finding indicated that the abundance of microorganisms groups (gram-positive bacteria) in soil with distinct fertilities could regulate the risk of soil C loss in response to global warming. Thus, soil carbon sequestration can be enhanced by improving soil fertility.
4.2. Q10 Response to Litter Input with Different Elevations
Q10 response to litter input varied along the elevation gradient (Figure 2). Specifically, Q10 response to litter input was not observed at 750 m, while a decrease in Q10 was detected at 950 m. These two distinct reactions may be owing to the decreased availabilities of nutrients in soil, differentiating the responses of SOC mineralization to global warming [46]. Changes in soil nutrients and subsequent microbial community composition and activity following litter input, result in different rates of SOC mineralization. Well supporting this suggestion, the mineralization of SOC closely associated with soil mineral N and available P at the second stage of incubation, with closer association between SOC mineralization and available P (Figure 5A,B). Furthermore, decrease in the affinity of N enzyme to substrate (increased Km of N-acquisition enzyme) makes Q10 decrease (Figure 5C), indicating that microorganisms will increase their relative investment in enzymes that require P rather than N following litter input in order to maintain a stable stoichiometry of microbial nutrients [47]. Together, these findings indicated that soil P availability regulated the response of Q10 to litter input, which was in agreement with previous studies [48,49]. Therefore, in medium elevation soil with abundant P, activated microbial community by litter input would mine less SOC to acquire P, resulting in lower Q10 with litter input at 950 m. Compared with decreased Q10 at 950 m, Q10 at 750 m has no response to litter input because of the lower availability of soil P (Table 1). In addition to the change of available nutrients by litter input, soil texture may also limit microbial access to available P. Studies have shown that sand particles have higher available P accumulation [50], and litter input does not increase sand particles content in the short term. Furthermore, there was a significant negative correlation between clay particles and available P (Figure 3), which further verified that the higher the content of clay particles, the less available P content (Table 1). As a result, microbes could not obtain more available P, and thus Q10 at 1150 m did not significantly increase following litter input.
5. Conclusions
In this study, the vertical spatial heterogeneity between subtropical and warm temperate transitional zones at different elevations was studied in laboratory. The pH and C/N are the main factors regulating the vertical heterogeneity of Q10 in forest ecosystems. The negative C/N-Q10 correlations in the second stage imply that improving soil fertility contributed to the enhancement of soil carbon sequestration, which partly supports the soil C-quality temperature hypothesis. In addition, the Q10 of second stage response to litter input was regulated by available P along the elevation gradient. Overall, our results emphasize the importance of vertical spatial heterogeneity in Q10 of SOC mineralization. Therefore, in order to improve the prediction of the magnitude and direction of soil C-climate feedback in terrestrial ecosystems, it should be considered in the earth system model.
Author Contributions
This specific study was designed by P.T.; P.T. collected soil samples; J.W. conducted the laboratory analysis and analyzed the data with the assistance of Q.Z.; J.W. wrote the manuscript with assistance from P.T. and Q.W. All authors commented preliminary versions of the manuscript and contributed to improve the final version. All authors have read and agreed to the published version of the manuscript.
Funding
This work was supported by the National Natural Science Foundation of China (grant no. 32101334).
Institutional Review Board Statement
Not applicable.
Informed Consent Statement
Not applicable.
Data Availability Statement
Data will be made available on request.
Acknowledgments
This work was supported by the National Natural Science Foundation of China (grant no. 32101334).
Conflicts of Interest
The authors declare that they have no conflict of interest.
References
- Bond-Lamberty, B.; Thomson, A. Temperature-associated increases in the global soil respiration record. Nature 2010, 464, 579–582. [Google Scholar] [CrossRef] [PubMed]
- Liu, Y.; He, N.; Zhu, J.; Xu, L.; Wen, X. Regional variation in the temperature sensitivity of soil organic matter decomposition in China’s forests and grasslands. Glob. Chang. Biol. 2017, 23, 3393–3402. [Google Scholar] [CrossRef] [PubMed]
- Xiao, H.; Shi, Z.; Li, Z.; Wang, L.; Wang, J. Responses of soil respiration and its temperature sensitivity to nitrogen addition: A meta-analysis in China. Appl. Soil Ecol. 2020, 150, 103484. [Google Scholar] [CrossRef]
- Moinet, G.Y.K.; Hunt, J.E.; Kirschbaum, M.U.F.; Morcom, C.P.; Midwood, A.J.; Millard, P. The temperature sensitivity of soil organic matter decomposition is constrained by microbial access to substrates. Soil Biol. Biochem. 2018, 116, 333–339. [Google Scholar] [CrossRef]
- Schmidt, M.; Vereecken, H.; Post, H.; Hendricks Franssen, H.; Han, X.J.; Baatz, R.; Montzlza, C. Evaluation and uncertainty analysis of regional-scale CLM4.5 net carbon flux estimates. Biogeosciences 2018, 15, 187–208. [Google Scholar]
- Qin, S.Q.; Chen, L.y.; Fang, K.; Zhang, Q.W.; Wang, J. Temperature sensitivity of SOM decomposition governed by aggregate protection and microbial communities. Sci. Adv. 2019, 5, eaau1218. [Google Scholar] [CrossRef] [Green Version]
- Zhao, X.C.; Tian, P.; Liu, S.G.; Sun, Z.L.; Zeng, Z.; Wang, Q.K. Cunninghamia lanceolata and understory ferns had positive rhizosphere effects on the temperature sensitivity of soil microbial respiration in a subtropical forest. Geoderma 2022, 408, 115593. [Google Scholar] [CrossRef]
- Wang, Q.K.; Liu, S.G.; Tian, P. Carbon quality and soil microbial property control the latitudinal pattern in temperature sensitivity of soil microbial respiration across Chinese forest ecosystems. Glob. Change Biol. 2018, 24, 2841–2849. [Google Scholar] [CrossRef]
- Li, J.; Pei, J.; Pendall, E.; Fang, C.; Nie, M. Spatial heterogeneity of temperature sensitivity of soil respiration: A global analysis of field observations. Soil Biol. Biochem. 2020, 141, 107675. [Google Scholar] [CrossRef]
- Schlesinger, W.H.; Andrews, J.A. Soil respiration and the global carbon cycle. Biogeochemistry 2000, 48, 7–20. [Google Scholar] [CrossRef]
- Qi, Y.; Xu, M. Separating the effects of moisture and temperature on soil CO2 efflux in a coniferous forest in the Sierra Nevada mountains. Plant Soil 2001, 237, 15–23. [Google Scholar] [CrossRef]
- Wang, Q.K.; Zhao, X.C.; Chen, L.C.; Yang, Q.P.; Chen, S.; Zhang, W.D. Global synthesis of temperature sensitivity of soil organic carbon decomposition: Latitudinal patterns and mechanisms. Func. Ecol. 2019, 33, 514–523. [Google Scholar] [CrossRef]
- Tian, P.; Zhao, X.C.; Liu, S.L.; Sun, Z.L.; Jing, Y.; Wang, Q.K. Soil microbial respiration in forest ecosystems along a north-south transect of eastern China: Evidence from laboratory experiments. Catena 2022, 211, 105980. [Google Scholar] [CrossRef]
- Nottingham, A.T.; Griffiths, H.; Chamberlain, P.M.; Stott, A.W.; Tanner, E.V.J. Soil priming by sugar and leaf-litter substrates: A link to microbial groups. Appl. Soil Ecol. 2009, 42, 183–190. [Google Scholar] [CrossRef]
- Fontaine, S.; Bardoux, G.; Abbadie, L.; Mariotti, A. Carbon input to soil may decrease soil carbon content. Ecol. Lett. 2010, 7, 314–320. [Google Scholar] [CrossRef]
- Chen, X.; Chen, H.Y.H. Global effects of plant litter alterations on soil CO2 to the atmosphere. Glob. Chang. Biol. 2018, 24, 3462–3471. [Google Scholar] [CrossRef]
- Yan, W.; Peng, Y.; Zhang, C.; Chen, X. The manipulation of aboveground litter input affects soil CO2 efflux in a subtropical liquidambar forest in China. iForest 2019, 12, 181–186. [Google Scholar] [CrossRef] [Green Version]
- Li, Q.R.; Tian, Y.Q.; Zhang, X.Y.; Xu, X.G.; Wang, H.M.; Kuzyakov, Y. Labile carbon and nitrogen additions affect soil organic matter decomposition more strongly than temperature. Appl. Soil Ecol. 2022, 114, 152–160. [Google Scholar] [CrossRef]
- Xiong, Y.; Zeng, H.; Xia, H.; Guo, D. Interactions between leaf litter and soil organic matter on carbon and nitrogen mineralization in six forest litter-soil systems. Plant Soil 2014, 379, 217–229. [Google Scholar] [CrossRef]
- Weintraub, S.R.; Wieder, W.R.; Cleveland, C.C.; Townsend, A.R. Organic matter inputs shift soil enzyme activity and allocation patterns in a wet tropical forest. Biogeochemistry 2013, 114, 313–326. [Google Scholar] [CrossRef]
- Tan, X.P.; Machmuller, M.B.; Huang, F.; He, J.H.; Chen, J.; Cotrufo, M.F.; Shen, W.J. Temperature sensitivity of ecoenzyme kinetics driving litter decomposition: The effects of nitrogen enrichment, litter chemistry, and decomposer community. Soil Biol. Biochem. 2020, 148, 107878. [Google Scholar] [CrossRef]
- Thiessen, S.; Gleixner, G.; Wutzler, T.; Reichstein, M. Both priming and temperature sensitivity of soil organic matter decomposition depend on microbial biomass—An incubation study. Soil Biol. Biochem. 2013, 57, 739–748. [Google Scholar] [CrossRef] [Green Version]
- Wang, Q.; Wang, Y.; Wang, S.; He, T.; Liu, L. Fresh carbon and nitrogen inputs alter organic carbon mineralization and microbial community in forest deep soil layers. Soil Biol. Biochem. 2014, 72, 145–151. [Google Scholar] [CrossRef]
- Li, X.J.; Xie, J.S.; Zhang, Q.F.; Lyu, M.K.; Xiong, X.; Liu, X.L.; Lin, T.C.; Yang, Y.S. Substrate availability and soil microbes drive temperature sensitivity of soil organic carbon mineralization to warming along an elevation gradient in subtropical Asia. Geoderma 2020, 364, 114198. [Google Scholar] [CrossRef]
- Wang, Q.; Liu, S.; Wang, Y.; Tian, P.; Sun, T. Influences of N deposition on soil microbial respiration and its temperature sensitivity depend on N type in a temperate forest. Agr. Forest Meteorol. 2018, 260–261, 240–246. [Google Scholar] [CrossRef]
- Michael, S.; Martin, H.G.; Ellen, K. Organic matter and enzyme activity in particle-size fractions of soils obtained after low-energy sonication. Soil Biol. Biochem. 1998, 30, 9–17. [Google Scholar]
- Lu, R.K. Methods for Soil Agrochemistry Analysis; Chinese Agricultural Science and Technology Press: Beijing, China, 2000. [Google Scholar]
- BlairZ, G.Z.; Lefroy, R.; Lisle, L. Soil carbon fractions based on their degree of oxidation, and the development of a carbon management index for agricultural systems. Aust. J. Agr. Res. 1995, 46, 393–406. [Google Scholar]
- Wang, Q.; He, T.; Wang, S.; Liu, L. Carbon input manipulation affects soil respiration and microbial community composition in a subtropical coniferous forest. Agr. Forest Meteorol. 2013, 178–179, 152–160. [Google Scholar] [CrossRef]
- Joergensen, R.G. Phospholipid fatty acids in soil—drawbacks and future prospects. Biol. Fert. Soils 2021, 58, 1–6. [Google Scholar] [CrossRef]
- German, D.P.; Weintraub, M.N.; Grandy, A.S.; Lauber, C.L.; Rinkes, Z.L.; Allison, S.D. Optimization of hydrolytic and oxidative enzyme methods for ecosystem studies. Soil Biol. Biochem. 2011, 43, 1387–1397. [Google Scholar] [CrossRef]
- Razavi, B.S.; Evgenia, B.; Yakov, K. Nonlinear temperature sensitivity of enzyme kinetics explains canceling effect—a case study on loamy haplic Luvisol. Front. Microbiol. 2015, 6, 1126. [Google Scholar] [CrossRef] [PubMed] [Green Version]
- Feng, C.X.; Sun, H.L.; Zhang, Y.D. The magnitude and direction of priming were driven by soil moisture and temperature in a temperate forest soil of China. Pedobiol.-J. Soil Ecol. 2021, 89, 150769. [Google Scholar] [CrossRef]
- Zhu, B.; Cheng, W. Rhizosphere priming effect increases the temperature sensitivity of soil organic matter decomposition. Glob. Change Biol. 2011, 17, 2172–2183. [Google Scholar] [CrossRef]
- Liu, Y.; He, N.; Xu, L.; Tian, J.; Gao, Y.; Zheng, S.; Wang, Q.; Wen, X.F.; Xu, X.L.; Yakov, K. A new incubation and measurement approach to estimate the temperature response of soil organic matter decomposition. Soil Biol. Biochem. 2019, 138, 107596. [Google Scholar] [CrossRef]
- Davidson, E.A.; Janssens, I.A. Temperature sensitivity of soil carbon decomposition and feedbacks to climate change. Nature 2006, 440, 165–173. [Google Scholar] [CrossRef] [PubMed]
- Li, J.; Baath, E.; Pei, J.; Fang, C.; Nie, M. Temperature adaptation of soil microbial respiration in alpine, boreal and tropical soils: An application of the square root (Ratkowsky) model. Glob. Change Biol. 2021, 27, 1281–1292. [Google Scholar] [CrossRef]
- Masson-Delmotte, V.; Zhai, P.; Pirani, A.; Connors, S.L.; Péan, C.; Berger, S.; Caud, N.; Chen, Y.; Goldfarb, L.; Gomis, M.I.; et al. Climate Change 2021: Mitigation of Climate Change; Working Group III Contribution to the IPCC Sixth Assessment Report; Cambridge University Press: Cambridge, UK, 2021. [Google Scholar]
- Liu, Y.; Xu, L.; Zheng, S.; Chen, Z.; Cao, Y.Q.; Wen, X.F.; He, N.P. Temperature sensitivity of soil microbial respiration in soils with lower substrate availability is enhanced more by labile carbon input. Soil Biol. Biochem. 2021, 154, 108148. [Google Scholar] [CrossRef]
- Zhou, S.; Lin, J.; Wang, P.; Zhu, P.; Zhu, B. Resistant soil organic carbon is more vulnerable to priming by root exudate fractions than relatively active soil organic carbon. Plant Soil 2021, 470, 1573–5036. [Google Scholar] [CrossRef]
- Bahn, M.; Rodeghiero, M.; Anderson-Dunn, M.; Dore, S.; Gimeno, C.; Drösler, M.; Williams, M.; Ammann, C.; Berninger, F.; Flechard, C.; et al. Soil Respiration in European Grasslands in Relation to Climate and Assimilate Supply. Ecosystems 2008, 11, 1352–1367. [Google Scholar] [CrossRef] [Green Version]
- Niklińska, M.; Chodak, M.; Laskowski, R. Characterization of the forest humus microbial community in a heavy metal polluted area. Soil Biol. Biochem. 2005, 37, 2185–2194. [Google Scholar] [CrossRef]
- Li, H.; Yang, S.; Semenov, M.V.; Yao, F.; Kuzyakov, Y. Temperature sensitivity of SOM decomposition is linked with a K-selected microbial community. Glob. Change Biol. 2021, 27, 2763–2779. [Google Scholar] [CrossRef] [PubMed]
- Rasmussen, C.; Heckman, K.; Wieder, W.R.; Keiluweit, M.; Wagai, R. Beyond clay: Towards an improved set of variables for predicting soil organic matter content. Biogeochemistry 2018, 137, 297–306. [Google Scholar] [CrossRef]
- Liu, X.J.A.; Pold, G.; Domeignoz-Horta, L.A.; Geyer, K.M.; Caris, H.; Nicolson, H.; Kemner, K.M.; Frey, S.D.; Melillo, J.M.; De Angelis, K.M. Soil aggregate-mediated microbial responses to long-term warming. Soil Biol. Biochem. 2021, 152, 108055. [Google Scholar] [CrossRef]
- Wang, Q.K.; He, T.X.; Liu, J. Litter input decreased the response of soil organic matter decomposition to warming in two subtropical forest soils. Sci. Rep. 2016, 6, 33814. [Google Scholar] [CrossRef] [PubMed]
- Cleveland, C.C.; Liptzin, D. C:N:P stoichiometry in soil: Is there a “Redfield ratio” for the microbial biomass? Biogeochemistry 2007, 85, 235–252. [Google Scholar] [CrossRef]
- Hu, B.; Bing, Y.; Pang, X.; Bao, W.; Tian, G. Responses of soil phosphorus fractions to gap size in a reforested spruce forest. Geoderma 2016, 279, 61–69. [Google Scholar] [CrossRef]
- Gallardo, A.; Schlesinger, W.H. Factors limiting microbial biomass in the mineral soil and forest floor of a warm-temperate forest. Soil Biol. Biochem. 1994, 26, 1409–1415. [Google Scholar] [CrossRef]
- Tian, S.Y.; Zhu, B.J.; Yin, R.; Wang, M.G.; Jiang, Y.J.; Zhang, C.Z.; Li, D.M.; Chen, X.Y.; Kardol, P.; Liu, M.Q. Organic fertilization promotes crop productivity through changes in soil aggregation. Soil Biol. Biochem. 2022, 165, 108533. [Google Scholar] [CrossRef]
Figure 1.
Dynamics of CO2 efflux rate from control (A) and litter-mended soils (B) along the different elevations (750, 950, 1150 m) during the 97 day incubation period. R and W represent room temperature and warming temperature, respectively. The vertical bars are standard errors.
Figure 1.
Dynamics of CO2 efflux rate from control (A) and litter-mended soils (B) along the different elevations (750, 950, 1150 m) during the 97 day incubation period. R and W represent room temperature and warming temperature, respectively. The vertical bars are standard errors.

Figure 2.
Temperature sensitivity (Q10) of SOC in the control (no litter) and treated (litter input) soils from different elevations (750 m, 950 m, 1150 m) during the 0–37 days (A) and 37–97 days (B) incubation period, respectively. Values are expressed as the means ± SE (n = 4). Lower case letters and the capital letters indicate significant differences between elevations and litter, respectively (p < 0.05).

Figure 3.
Pearson’s correlation coefficient matrix of Q10 with key important influencing variables. Soil properties include soil organic carbon (SOC), total N (TN), C/N, Available P (AP), Mineral N (MN), pH, clay content, Soil microorganisms include Gram-positive (G+), Gram-negative (G-), Gram-positive / Gram-negative (G+/G−). *, ** and *** Denote significant difference at p < 0.05, 0.01 and 0.001, respectively.

Figure 4.
Relationships between the Q10 without litter and pH (A) during the 0–37 days incubation period. Relationships between the Q10 and C/N (B) during the 38–97 days incubation period.
Figure 4.
Relationships between the Q10 without litter and pH (A) during the 0–37 days incubation period. Relationships between the Q10 and C/N (B) during the 38–97 days incubation period.

Figure 5.
Relationships between the cumulative CO2 (38–97 days) and available P (A) and mineral N (B) after 97 days incubation. The relationship between Km of N enzyme and Q10 (C) in the second stage. R and W represent room temperature and warming temperature, respectively.
Figure 5.
Relationships between the cumulative CO2 (38–97 days) and available P (A) and mineral N (B) after 97 days incubation. The relationship between Km of N enzyme and Q10 (C) in the second stage. R and W represent room temperature and warming temperature, respectively.


Table 1.
Properties of soils at different elevations. The data are expressed as the means ±SE (n = 4). Different letters followed data in the same row denote significant difference at p < 0.05.
Table 1.
Properties of soils at different elevations. The data are expressed as the means ±SE (n = 4). Different letters followed data in the same row denote significant difference at p < 0.05.
| Soil Properties | Elevation (m) | ||
|---|---|---|---|
| 750 | 950 | 1150 | |
| SOC (g kg−1) | 48.56 ± 6.03 b | 37.86 ± 2.54 b | 70.67 ± 1.9 a |
| TN (g kg−1) | 3.60 ± 0.27 b | 2.97 ± 0.19 b | 5.28 ± 0.20 a |
| C/N | 13.36 ± 0.67 a | 12.75 ± 0.14 a | 13.41 ± 0.15 a |
| TP (mg kg−1) | 0.14 ± 0.01 b | 0.29 ± 0.03 a | 0.12 ± 0.01 b |
| Available P (mg kg−1) | 39.66 ± 4.63 b | 56.85 ± 4.60 a | 10.22 ± 1.33 c |
| Mineral N (mg kg−1) | 13.34 ± 4.22 b | 6.94 ± 0.34 b | 26.90 ± 4.18 a |
| LOC (mg kg−1) | 12.22 ± 2.35 b | 9.49 ± 0.52 b | 18.43 ± 0.58 a |
| DOC (mg kg−1) | 1.22 ± 0.24 b | 0.95 ± 0.06 b | 1.85 ± 0.06 a |
| pH | 5.07 ± 0.01 a | 5.25 ± 0.12 a | 5.26 ± 0.11 a |
| K+ (mg kg−1) | 141.90 ± 34.36 a | 111.31 ± 23.63 a | 201.12 ± 47.44 a |
| Mg2+ (mg kg−1) | 57.06 ± 24.06 a | 37.92 ± 10.03 a | 70.41 ± 26.47 a |
| Ca2+ (g kg−1) | 1.23 ± 0.48 a | 0.72 ± 0.13 a | 1.18 ± 0.34 a |
| Na+ (mg kg−1) | 5.74 ± 4.08 a | 4.26 ± 1.42 a | 6.42 ± 2.68 a |
| Sand content (%) | 64.90 ± 4.91 b | 81.51 ± 1.38 a | 47.53 ± 2.71 c |
| Silt content (%) | 23.12 ± 3.56 b | 11.61 ± 1.32 c | 41.49 ± 2.57 a |
| Clay content (%) | 11.98 ± 1.82 a | 6.88 ± 0.30 b | 10.99 ± 0.56 a |
Table 2.
PLFAs of soils at different elevations. The data are expressed as the means ± SE (n = 4). Different letters followed data in the same row denote significant difference at p < 0.05.
Table 2.
PLFAs of soils at different elevations. The data are expressed as the means ± SE (n = 4). Different letters followed data in the same row denote significant difference at p < 0.05.
| PLFAs | Elevation (m) | ||
|---|---|---|---|
| 750 | 950 | 1150 | |
| Fungi (nmol g−1) | 7.65 ± 0.63 a | 3.27 ± 1.83 b | 6.13 ± 0.33 ab |
| Bacteria (nmol g−1) | 24.67 ± 3.26 a | 19.36 ± 3.97 a | 21.76 ± 1.27 a |
| Fungi/Bacteria | 0.32 ± 0.04 a | 0.15 ± 0.07 b | 0.28 ± 0.03 ab |
| Gram-positive bacteria (nmol g−1) | 7.51 ± 0.86 a | 7.01 ± 0.96 a | 6.30 ± 0.40 a |
| Gram-negative bacteria (nmol g−1) | 12.82 ± 0.96 a | 7.48 ± 1.58 b | 11.15 ± 0.32 a |
| Gram-positive/Gram-negative bacteria | 0.59 ± 0.05 b | 1.07 ± 01.7 a | 0.57 ± 0.04 b |
| Actinomycetes (nmol g−1) | 2.77 ± 0.47 a | 2.15 ± 0.51 a | 2.58 ± 0.46 a |
| AM Fungi (nmol g−1) | 1.00 ± 0.01 a | 0.76 ± 0.10 a | 0.81 ± 0.06 a |
| Total microbial PLFA (nmol g−1) | 27.35 ± 5.20 a | 22.23 ± 6.27 a | 23.81 ± 1.97 a |
Publisher’s Note: MDPI stays neutral with regard to jurisdictional claims in published maps and institutional affiliations. |
© 2022 by the authors. Licensee MDPI, Basel, Switzerland. This article is an open access article distributed under the terms and conditions of the Creative Commons Attribution (CC BY) license (https://creativecommons.org/licenses/by/4.0/).
Share and Cite
MDPI and ACS Style
Wei, J.; Zhang, Q.; Wang, Q.; Tian, P. Effects of Litter Input on Temperature Sensitivity of Soil Organic Carbon Mineralization along a Forest Elevation Gradient. Forests 2022, 13, 1250. https://0-doi-org.brum.beds.ac.uk/10.3390/f13081250
AMA Style
Wei J, Zhang Q, Wang Q, Tian P. Effects of Litter Input on Temperature Sensitivity of Soil Organic Carbon Mineralization along a Forest Elevation Gradient. Forests. 2022; 13(8):1250. https://0-doi-org.brum.beds.ac.uk/10.3390/f13081250
Chicago/Turabian StyleWei, Junlan, Qianqian Zhang, Qingkui Wang, and Peng Tian. 2022. "Effects of Litter Input on Temperature Sensitivity of Soil Organic Carbon Mineralization along a Forest Elevation Gradient" Forests 13, no. 8: 1250. https://0-doi-org.brum.beds.ac.uk/10.3390/f13081250
Note that from the first issue of 2016, this journal uses article numbers instead of page numbers. See further details here.