
Scale Effects on the Relationship between Plant Diversity and Ecosystem Multifunctionality in Arid Desert Areas

1
College of the Ecology and Environment, Xinjiang University, Urumqi 830017, China
2
College of Life Science, Northwestern University, Xi’an 710069, China
*
Author to whom correspondence should be addressed.
Forests 2022, 13(9), 1505; https://0-doi-org.brum.beds.ac.uk/10.3390/f13091505
Submission received: 27 August 2022
/
Revised: 9 September 2022
/
Accepted: 14 September 2022
/
Published: 16 September 2022
(This article belongs to the Special Issue Plant Adaptation to Extreme Environments in Drylands)
Abstract
:Understanding the relationship between biodiversity and ecosystem multifunctionality is popular topic in ecological research. Although scale is an important factor driving changes in biodiversity and ecosystem multifunctionality, we still know little about the scale effects of the relationship between the different dimensions of biodiversity and ecosystem multifunctionality. Using plant communities in the northwest of the Qira Desert Ecosystem National Field Research Station of the Chinese Academy of Sciences in Qira County, Xinjiang, as the study object, we explored the scale effects of plant diversity and ecosystem multifunctionality at different sampling scales (5 m × 5 m, 20 m × 20 m, and 50 m × 50 m) and the relative contribution of different dimensions of diversity (species diversity, functional diversity, and phylogenetic diversity) to variation in ecosystem multifunctionality. At different scales, a significant scale effect was observed in the relationship between plant diversity and ecosystem multifunctionality. Species diversity dominated ecosystem multifunctionality at large scales (50 m × 50 m), and species diversity and ecosystem multifunctionality varied linearly between scales. Functional diversity made the greatest contribution in small scales (5 m × 5 m), and the relationship between phylogenetic diversity and ecosystem multifunctionality tended to show a single-peaked variation between scales, with a dominant effect on multifunctionality at the mesoscale (20 m × 20 m). The results of the study deepen the understanding of the scale effect of the relationship between plant diversity and ecosystem multifunctionality in arid desert areas, and help to further conserve plant diversity and maintain ecosystem multifunctionality.
1. Introduction
Global climate change and habitat fragmentation play a significant negative role in biodiversity conservation and the sustainability of ecosystem functions. [1,2]. The study of the relationship between biodiversity and ecosystem function is important to enhance biodiversity and restore ecosystem function. Biodiversity includes species diversity, functional diversity, and phylogenetic diversity [3]. Early studies on the relationship between biodiversity and ecosystem function mostly considered the relationship between species diversity and single ecosystem function [4,5]. With the progress in research, scholars have found that functional diversity and phylogenetic diversity have significant effects on ecosystem function and cannot be replaced by species diversity, and considering only single ecosystem functions may underestimate the role of biodiversity in ecosystem function [6,7]. Therefore, the study of the relationship between multidimensional biodiversity and ecosystem multifunctionality contributes to a deeper understanding of the biodiversity maintenance mechanisms.
Studies on biodiversity in China and elsewhere tended to focus on different environmental gradients, disturbance levels and successional stages [8,9], with less attention paid to the scale dependence of biodiversity. However, biodiversity depends on the number, composition and distribution of community species, and these factors are scale-dependent. [10,11]. The earliest studies on the relationship between plant diversity and ecosystem multifunctionality at different scales showed that alpha diversity was significantly positively correlated with ecosystem multifunctionality, with alpha diversity playing a dominant role [12]. Studies in subtropical regions further demonstrated that the positive correlation also showed a trend of rapid increase followed by a gentle increase [13,14], but the effect of α-diversity on single ecosystem function is not significant in forest ecosystem studies [15]. Functional and phylogenetic diversity is also being studied in greater depth by researchers. A study by Dang et al. (2018) [16] in desert ecosystems has shown that functional diversity indices vary significantly between scales and shape different community structures. Changes in sampling scale have a significant effect on the divergence and aggregation of genealogical structure and the level of genealogical diversity [17]. Studies on cave plants have also shown significant differences in genealogical diversity between large and small scales [18]. Ecosystem multifunctionality and biodiversity interactions are also scale-dependent [19]. First, different species play different roles between scales, allowing inter-scale differences in ecosystem multifunctionality [20,21]. Second, as the scale increases, community differences lead to a constant exchange of materials and energy flows between communities, which affects ecosystem multifunctionality [22]. Finally, the composition and distribution of functional traits among species vary by scale. As scale changes, functional traits segregating or overlapping in trait space as scale changes, making ecosystem multifunctionality change in response [19].
Arid desert ecosystems are sensitive areas of global change and priority areas for biodiversity conservation. As an important part of terrestrial ecosystems, arid zones have distinctive climatic environments, geographical locations, and resource distribution patterns that make them unique in terms of biodiversity and ecosystem multifunctionality [23].
Located at the southern edge of the Taklamakan Desert, Xinjiang’s Qira County has a dry climate with little rain and wind, and its ecosystem type is a typical temperate desert ecosystem. Due to its geographical location and topographical constraints, the region is ecologically fragile, and desertification is severe, which has led to a reduction in biodiversity and diminished ecosystem function services [24]. Considering the scale dependence of biodiversity and ecosystem multifunctionality, this study explored the relationship between multidimensional biodiversity and ecosystem multifunctionality based on three sampling scales (5 m × 5 m, 20 m × 20 m, and 50 m × 50 m), aiming to address the following scientific questions: (1) How do plant diversity and ecosystem multifunctionality relate to scale? (2) How do the relative contributions of species diversity, functional diversity, and phylogenetic diversity to ecosystem multifunctionality vary at different scales?
2. Materials and Methods
2.1. Overview of Experimental Area
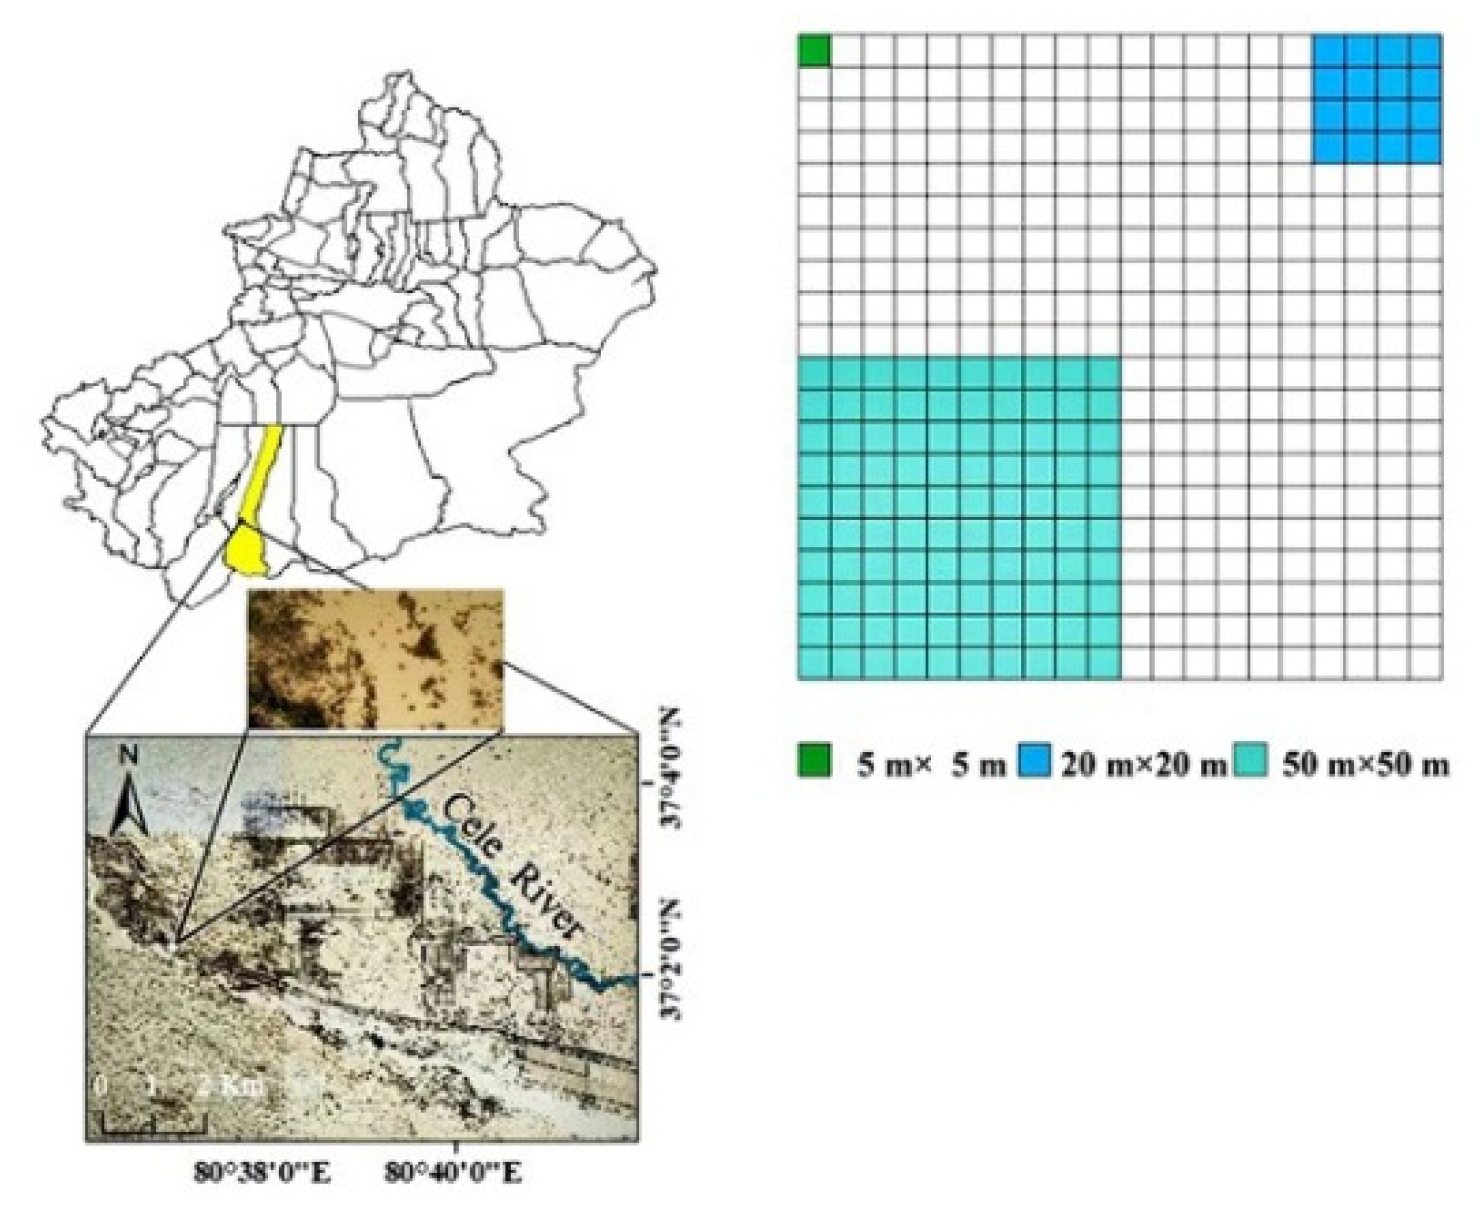
The study area is located on the northern foot of the Kunlun Mountains and on the periphery of the oasis at the southern edge of the Tarim Basin (80°37′12″ E, 37°2′0″ N). The climate in the reserve is extremely arid, and water resources are scarce, with an average annual precipitation of 35.1 mm and a potential annual evaporation of 2595.3 mm [25]. The main types of soil are gray-brown desert soil, gray desert soil, and wind-sand soil, with a high degree of soil salinity [26]. The natural vegetation is dominated by perennial desert plants, with the main species including Populus euphratica, Tamarix chinensis, Alhagi sparsifolia, Salsola collina, and Hexinia polydichotoma.
2.2. Research Method
2.2.1. Sample Setting
A 100 m × 100 m sample plot was set up in the northwest of the Qira Desert Ecosystem National Field Research Station of the Chinese Academy of Sciences in July 2019, where quadrats of three scales (50 m × 50 m, 20 m × 20 m, and 5 m × 5 m) were set up. Using the 5 m × 5 m quadrat as the basic unit, 100 quadrats were randomly selected at each scale within the sample plots. Where each 20 m × 20 m quadrat contains 16 quadrats of 5 m × 5 m and each 50 m × 50 m quadrat contains 100 quadrats of 5 m × 5 m (Figure 1).
Qira.
2.2.2. Collection of Plant Samples
Plant species information, abundance, and plant height were recorded in the field at a minimum sampling scale of 5 m × 5 m. Three 1 m2 samples were selected on the diagonal of each 5 m × 5 m square to record and calculate the herbaceous abundance within the 5 m × 5 m square. In a 5 m × 5 m sample, approximately 30 mature leaves were collected from each plant species, and three were selected to measure leaf length (LL), leaf width (LW), leaf thickness (LT), and fresh leaf weight. All leaves were taken back to the laboratory to be dried, ground, and used for the measurement of leaf dry matter content (LDMC), leaf carbon content (LC), leaf nitrogen content (LN), and leaf phosphorus content (LP) indexes.
2.2.3. Collection of Soil Samples
The soil was sampled in 5 m × 5 m units, with the diagonal method of taking a 0–20 cm surface layer of soil at the center, using an aluminum box to store the soil and calculate the soil water content, and then taking a sample in a sealing bag for the determination of other soil physical and chemical properties. The method of determination [27] is shown in Table 1.
2.3. Data Calculation and Analysis
2.3.1. Calculation of Plant Diversity
In this study, we selected species diversity indices, namely Shannon–Wiener diversity index, Simpson diversity index, Margalef richness index, and Pielou evenness index ([28]; functional diversity indices, including FRic richness index, FEve evenness index, FDiv divergence index, and RaoQ quadratic entropy index [29,30]; and phylogenetic diversity indices, including the mean interspecific distance index (MPD), mean nearest interspecific distance (MNTD), and Faith diversity index (PD) (for calculation methods, see Supplementary Table S1) [31,32].
2.3.2. Calculation of Ecosystem Multifunctionality
In this study, soil environmental factors (total nitrogen, total phosphorus, ammonium nitrogen, nitrate nitrogen, fast-acting phosphorus, and organic matter) were used as indicators of ecosystem multifunctionality, and the “Z-score” mean method was used to calculate ecosystem multifunctionality, represented by the formula [33,34]:
In the above equation, MFa represents ecosystem multifunctionality, fi represents the measured value of function i, ri is the mathematical function that converts fi into a positive value, g represents the normalization of all measured values, and F represents the number of functions measured.
2.3.3. Data Analysis
Excel 2019 was used for the initial processing and calculation of the data. Differences in plant diversity and ecosystem multifunctionality between the three scales (5 m × 5 m, 20 m × 20 m, 50 m × 50 m) were analyzed in SPSS 26.0 using one-way analysis of variance (ANOVA). When the variance was equal, the least significant difference (LSD) method was used for the results of multiple comparisons; when the variance was not uniform, the results of multiple comparisons were tested using a non-parametric test. The Kolmogorov–Smirnov test (K–S test) were used to test the normality of ecosystem multifunctionality. Random sampling of the sample plot is done in R4.1.3. A community phylogenetic tree was created in R4.1.3 using the “V.PhyloMaker” package [35]. The species diversity index, functional diversity index, and phylogenetic diversity index were calculated using the “vegan”, “FD”, and “picante” packages, respectively.
The model was selected in R4.1.3 using the function “dredge” from the “MuMin” package [36], based on the corrected Akaike’s information criterion (AICc; ΔAICc < 2) [37]. A selection procedure was used to select the best predictor of ecosystem multifunctionality, and when multiple models were selected, model averaging was performed based on AICc weights. The model residuals were inspected for constant variance and normality. All predictors and response variables were standardized before the model was constructed. Predictors were log-transformed as necessary before analysis to meet the assumptions. The model calculated relative explanatory rates for each diversity index and compared them with the total explanatory rates for all diversity indicators in the model, after which the explanatory rates for the indices in the model were categorized and summed by species diversity, functional diversity, and phylogenetic diversity to obtain the relative importance of different diversity dimensions (species diversity, functional diversity, and phylogenetic diversity) as drivers of ecosystem multifunctionality.
3. Results
3.1. Characteristics of Plant Diversity
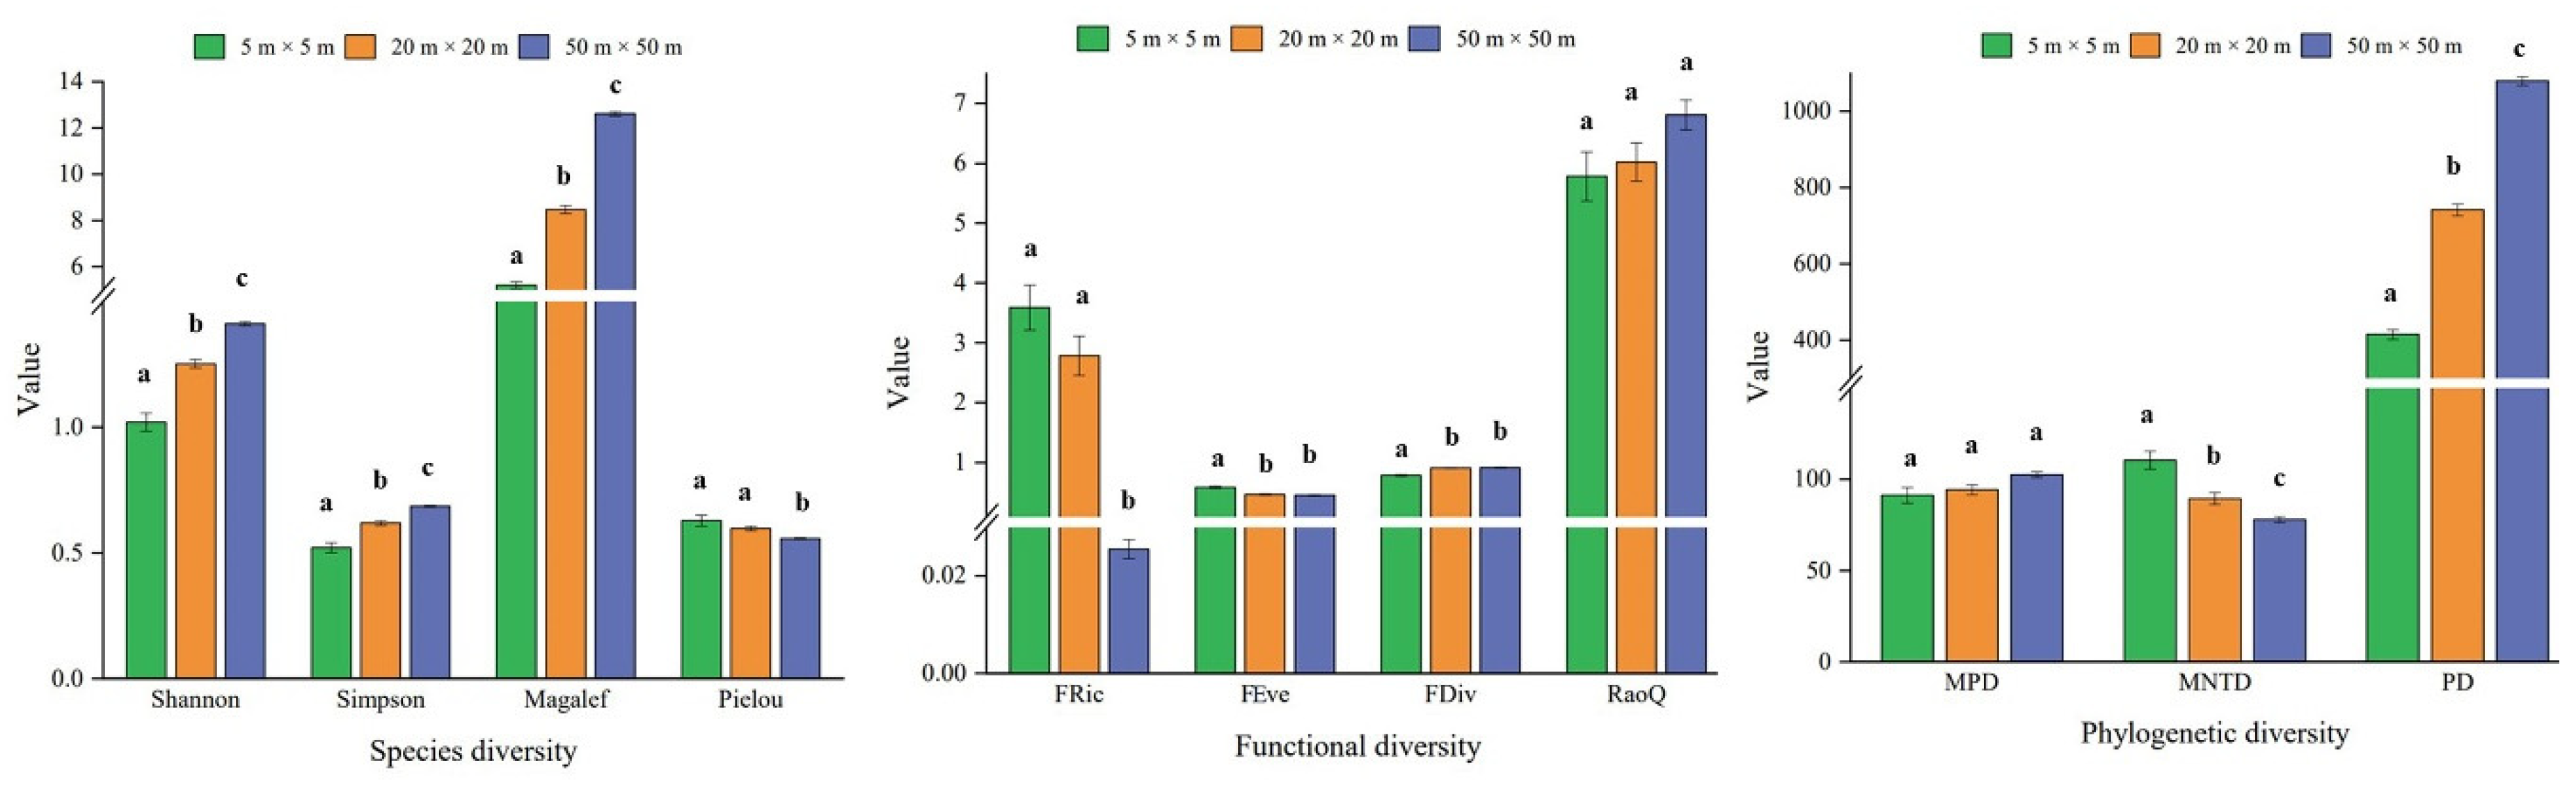
Among the species diversity indices, the Shannon diversity index, Simpson diversity index, and Margalef richness index tended to increase with scale and showed significant differences between scales (p < 0.05), and the Pielou evenness at large scales (50 m × 50 m) was significantly smaller than at small (5 m × 5 m) and medium scales (20 m × 20 m). For the functional diversity index, the RaoQ index showed an increasing trend from small to large scales. The FRic richness index, FEve evenness index, and FDiv divergence index were significantly different between small and large scales. The MNTD index of phylogenetic diversity showed a decreasing trend with increasing scale. The PD index showed an opposite trend and was significantly different between scales, while the MPD index was not significantly different between scales (p > 0.05) (Figure 2).
3.2. Characteristics of Ecosystem Multifunctionality
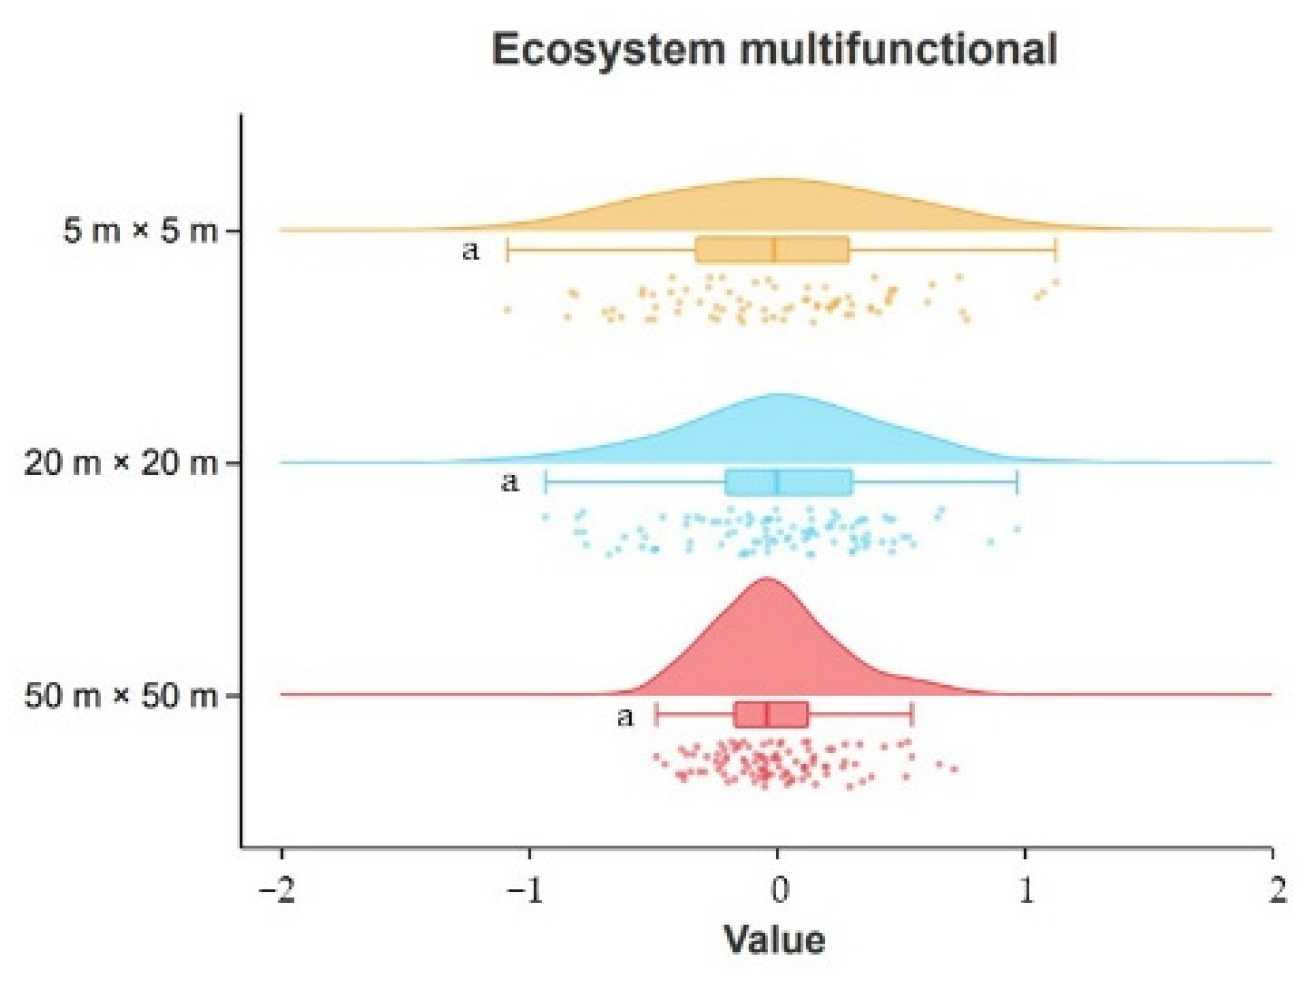
Using the K–S test and Raincloud plot (Figure 3), the ecosystem multifunctionality index calculated by the mean method was distributed normally at all three scales, with the values of the multifunctionality index varying from −1.085 to 1.129 for small-scale samples, −0.931 to 0.973 for medium-scale samples, and −0.484 to 0.718 for large-scale samples, but the ecosystem multifunctionality index did not vary significantly between scales (p > 0.05).
3.3. Characterization of the Relationship between Diversity and Multifunctionality
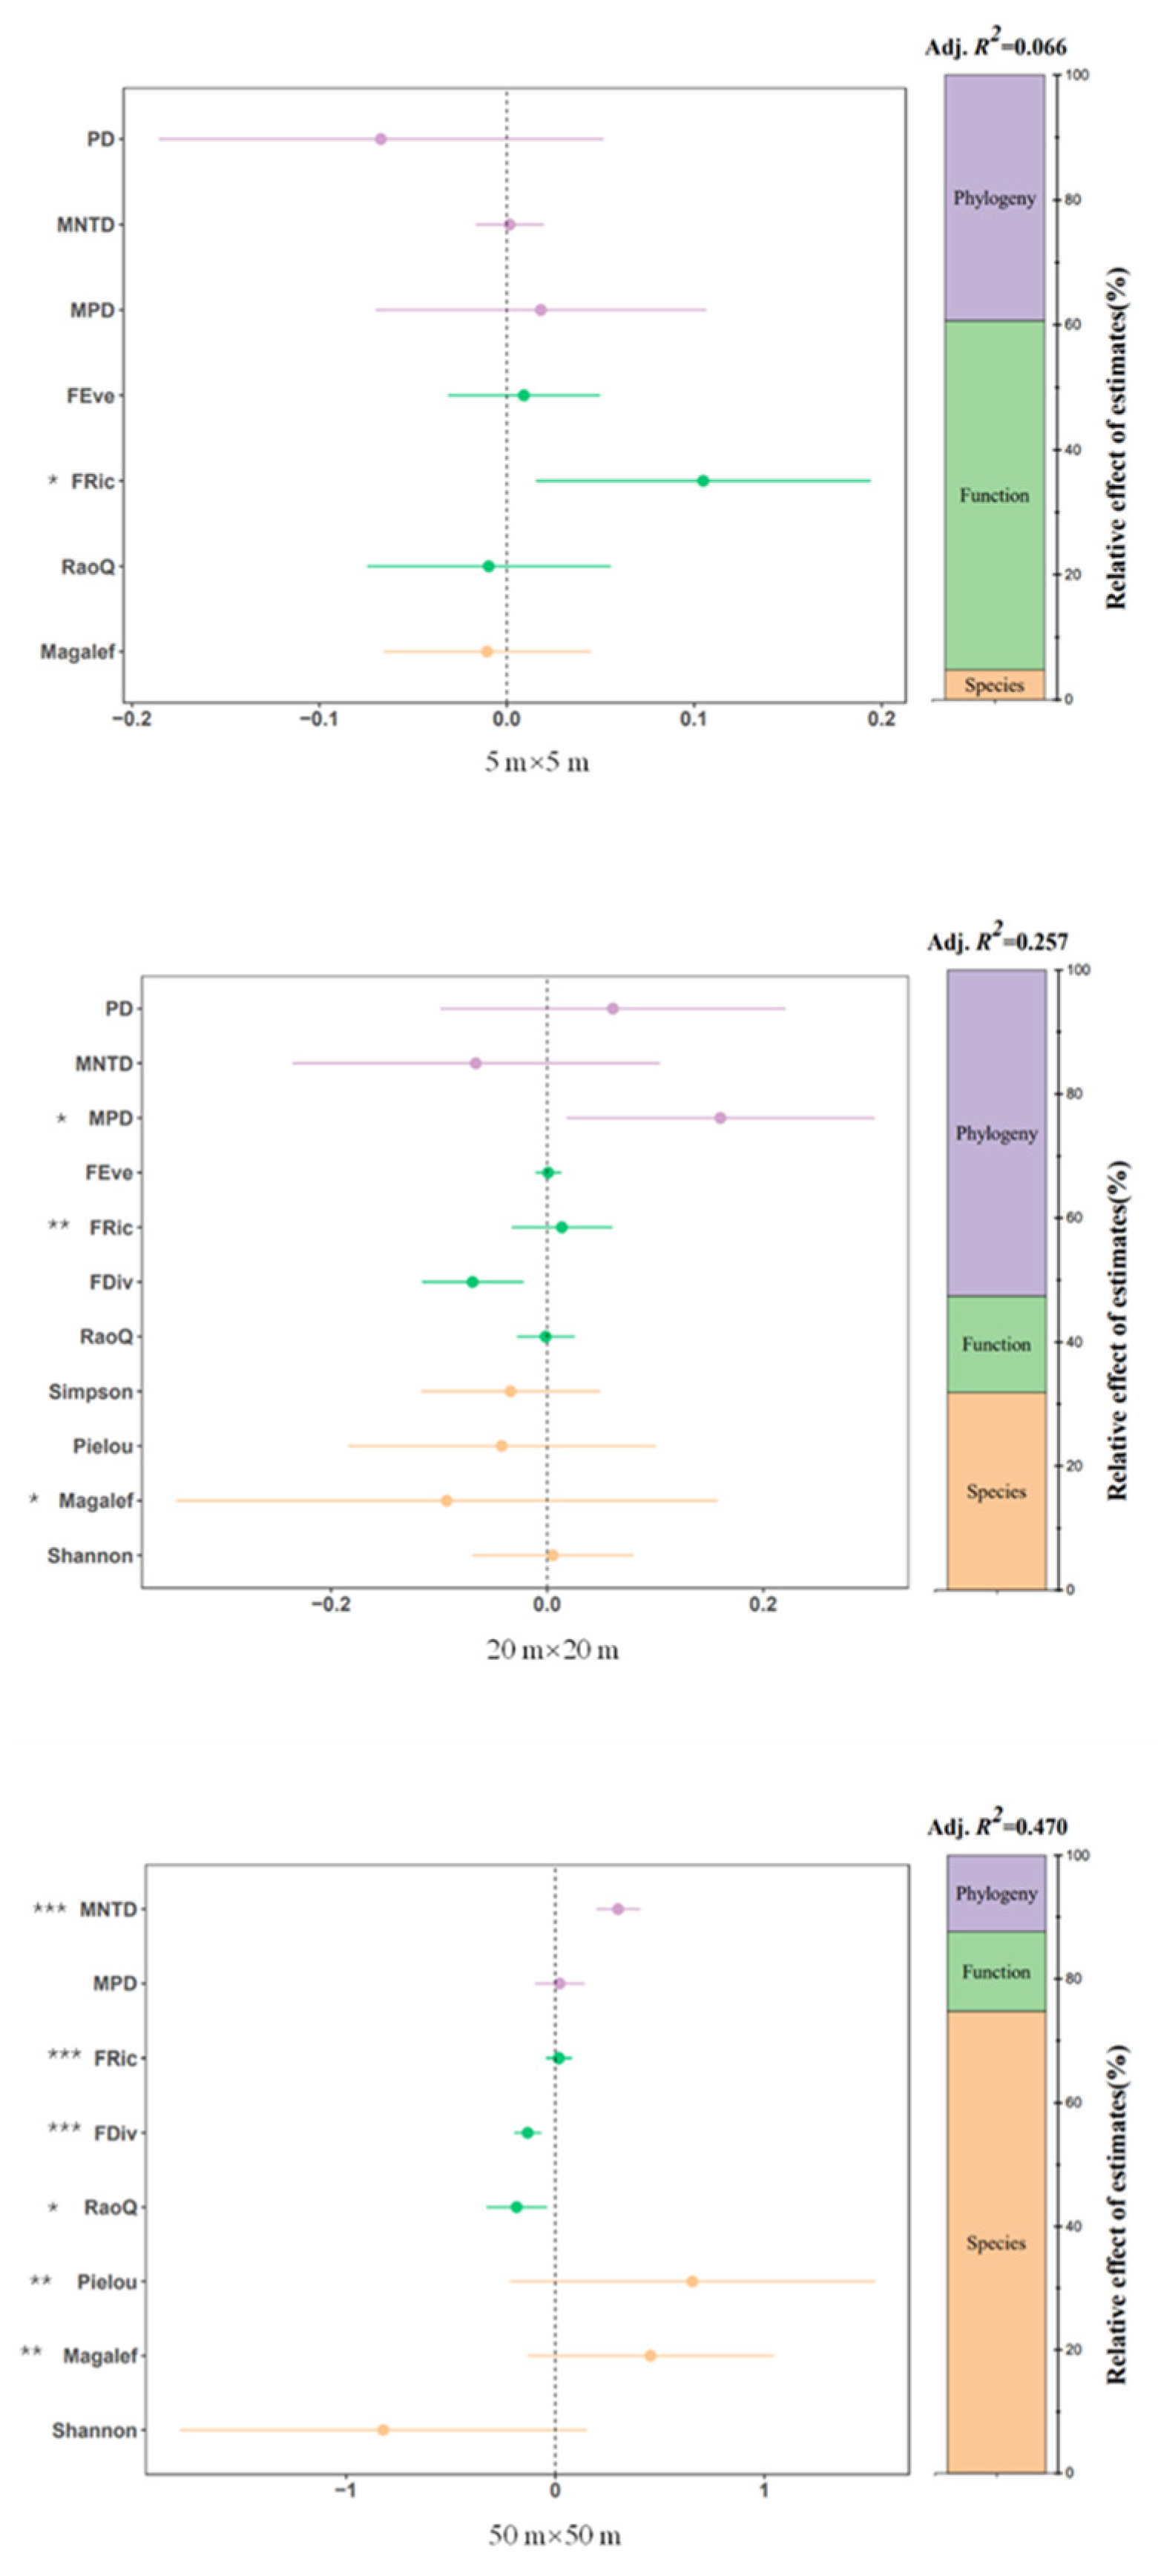
The results of the variance decomposition showed that there was a scale effect on the contribution of different dimensions of diversity to ecosystem multifunctionality. The FRic, FEve, and RaoQ indexes of plant functional diversity explained 56% of the variation in multifunctionality together on small scales, and they were the main factors driving ecosystem multifunctionality. The FRic index was significantly correlated with ecosystem multifunctionality.
However, at the mesoscale, phylogenetic diversity was the main factor shaping multifunctionality, with the MPD, MNTD, and PD indices accounting for 53% of multifunctionality. The MPD index was significantly correlated with multifunctionality, while the functional diversity of plants explained less of multifunctionality, but the FRic index was still significantly correlated with multifunctionality. Species diversity had a stronger influence on multifunctionality, with the Margalef index being significantly correlated with multifunctionality.
The contribution of species diversity to multifunctionality reached a maximum of 75% on large scales, and it was the main explanatory factor for ecosystem multifunctionality. The Margalef and Pielou indexes were significantly correlated with multifunctionality. Among the functional diversity indices, the FRic, FDiv, and RaoQ indexes together contributed to 13% of the variation in multifunctionality and were all significantly correlated with multifunctionality. Among the phylogenetic diversity indices, the MNTD index was significantly correlated with multifunctionality (Figure 4).
4. Discussion
4.1. Plant Diversity at Different Scales
Plants are driven by interspecific interaction and environmental influence, resulting in certain spatial distribution patterns [38]. When spatial scales change, plant community structure and diversity characteristics also change. Exploring the relationship between sampling scale and plant diversity can contribute to a more comprehensive understanding of community diversity trends and species coexistence mechanisms [39]. Our study found that species diversity was strongly scale-dependent [40]. The Margalef richness index showed an increasing trend with increasing scale. This is because the study site is highly windy and sandy, and water resources are scarce; thus, plants are clumped and aggregated to avoid wind and sand attacks and water scarcity [40], which limits the number of plant species that can be accommodated at small scales. As the sampling scale increases, the number of plant species increases, the composition of dominant species at each level becomes more diverse, and the Margalef index also increases. The Shannon diversity index and Simpson diversity index also increased with expansion in scale because, as the scale increases, habitat heterogeneity, the number of plants that can be accommodated, the number of species, and the level of species increases, and the structure of plant communities becomes more integrated and complex [41]. In addition, the Shannon diversity, Simpson diversity, and Margalef richness indexes showed a rapid increase and then a steady climb with the expansion of the scale, which is similar to the results of Deng et al. (2015) [14] in mixed coniferous forests of Pinus radiata. This indicates that the diversity of desert plant species increases with scale and plateaus after reaching a certain threshold [42].
Functional diversity is an extremely important part of plant diversity and plays an irreplaceable role in shaping the structure of plant communities and altering ecosystem functions [43]. Previous studies have shown that functional diversity varies with scale due to phenotypic plasticity [44,45,46]. Similar results were obtained in our study. The FEve evenness index and the FRic richness index both showed a decreasing trend with increasing scale and were opposite the trend in species richness, with significant differences between scales (p < 0.05); this indicates that species diversity and functional diversity have relatively independent trends [47]. This may be attributed to the obvious environmental filtering effect of the arid zone, where the functional composition of species is restricted to a certain range of functional traits, resulting in a more homogeneous pool of functional traits in this study area and an increase in species richness, leading to a more refined division of ecological niches rather than greater functional diversity [48], thus producing a different trend in functional diversity from that of species diversity [49,50].
The FDiv divergence index shows the degree of overlap in ecological niches between species within a community; that is, the heterogeneity of community character values [51], and a higher FDiv index indicates a high degree of ecological niche differentiation and higher resource use [52,53]. In our study, the FDiv index was significantly greater at large scales than at small scales, probably because, as scale increases, plant competition for the same or several habitat-specific resources diminishes, and ecological niches diverge further; thus, the FDiv index increases. The results of this study showed that the FRic richness index tended to decrease with increasing scale and was negatively correlated with the Shannon diversity index. This may be because functional richness is influenced not only by the functional ecological niche of the species but also by the range of functional trait values [54]. To overcome extreme drought conditions, functional traits of species in the study area are prioritized in response to selection pressure to adapt to drought [48,55], and functional traits tend to develop homogeneously, with increasing scale leading to a continuous increase in species richness followed by a deepening of functional redundancy [56,57], the FRic richness index declines, and the results of previous studies in Pinus oak forests in the Qinling Mountains are consistent with our study [58]. The negative correlation between species diversity and functional diversity because of scale expansion suggests that species diversity alone should not be considered when extrapolating functional diversity but also species differences and functional redundancy between scales [58].
In our study, the PD and MNTD indices varied significantly with scale, with the PD index increasing and the MNTD index decreasing with scale. This is probably because there is a significant correlation between the PD index and the Margalef index [59], with species richness increasing with scale, which is conducive to the maintenance of genealogical diversity at large scales. Genealogical structure is one of the most important expressions of community structure, as it reflects the process of community construction and evolution. Numerous studies have shown that the divergence or aggregation of genealogical structure is related to scale size [60,61,62]. The MNTD index in our study decreases with increasing scale and is significantly different between the three scales, suggesting that the community genealogical structure gradually moves from divergence to aggregation with increasing scale [63]. Therefore, the community is composed of more distantly related species on small scales and more closely related species on large scales. This is probably because of the low variation in habitat conditions on a small scale, combined with the harsh environmental conditions in the study area, where competition for a particular resource between species makes competitive exclusion the dominant community-building process. Therefore, the genealogical structure tends to diverge. At large scales, habitat heterogeneity increases, habitat-filtering ecological processes begin to dominate [64], and the genealogical structure gradually tends to agglomerate. Studies in the evergreen broadleaf forests of the Gutian Mountains and in the tropical rainforests of Panama [61,65] have also shown that competitive exclusion at small scales has a negative effect on the coexistence of closely related species, and that there is a tendency for the genealogical structure of communities to change from divergence to aggregation with increasing scale, but when the spatial scale exceeds a certain area, there is no correlation between genealogical structure and scale, and the genealogical structure becomes aggregated [66].
4.2. Ecosystem Multifunctionality at Different Scales
Early studies of ecosystem multifunctionality focused on the effects of species diversity on a single ecosystem function on the same scale [50,67,68,69,70]. As research has progressed, researchers have realized that differences in the choice of scale of study influence the expression of ecosystem multifunctionality [20]. However, the results of this study showed that ecosystem multifunctionality did not diverge significantly among the three scales. This is probably because variations in ecosystem multifunctionality in this study area are more related to changes in species composition, environmental conditions, or temporal scales than to spatial scales [33,71,72]. Our study area is located in an arid desert region where plant species composition is highly dependent on soil water and salinity conditions, which has led to a high degree of similarity in the overall community species composition of the region; however, significant differences in ecosystem multifunctionality between scales depend not only on significant differences in species diversity between scales but also on diverse community structure [73]. In addition, this study did not consider climatic conditions and time scales when discussing ecosystem multifunctionality, but numerous studies have shown that ecosystem multifunctionality varies significantly depending on the climatic conditions or time span of the study [12,74]. Finally, although three scales—large, medium, and small—were chosen for this study, the largest scale was only 50 m × 50 m. There is still much potential to expand the area of the sampling scale; thus, work on larger scales should be carried out in the future.
4.3. Relationship between Plant Diversity and Ecosystem Multifunctionality at Different Scales
The relationship between plant diversity and ecosystem multifunctionality varies with scale. Our study found that the highest levels of species diversity at large scales explained the greatest amount of variation in ecosystem multifunctionality, suggesting that the maintenance of multiple ecosystem functions simultaneously in this study area required a greater number of species and higher levels of species diversity to support them and that high species diversity could effectively support the maintenance of ecosystem multifunctionality. This is probably due to ecological niche differences on large scales when different species or functional groups coexist in resource-limited communities [75], where larger scales have more species and therefore have complementary advantages in resource use and, thus, the greatest explanatory power for ecosystem multifunctionality. The relationship between species diversity indices and multifunctionality also varied between scales, with the Margalef index being significantly correlated with ecosystem multifunctionality at the meso- and macro-scales but not at the small-scale, and the Pielou index was significantly correlated with ecosystem multifunctionality at the macro-scale. This demonstrated that under the dimension of species diversity, species richness and species evenness played a dominant role in driving multifunctionality. This likely results from the fact that the maintenance of ecosystem multifunctionality requires a high level of species diversity [72,76], and a smaller quantity of species cannot support all ecosystem functions [77]. Domestic and international studies have shown that larger vegetation communities and a larger number of species increase the use of habitat resources by plants and play an important role in maintaining high levels of ecosystem multifunctionality [69,78,79,80,81]. Species are relatively sparse in desert areas, and when the scale is small, the number of species in the sample is relatively infrequent, the Margalef index is comparatively low, the level of species diversity is not high, and the impact on ecosystem multifunctionality is limited. When the scale increases, the spatial ecosystem heterogeneity of the sample increases, it can accommodate a larger number and more species of plant samples, the Margalef index and Pielou indexes increase, and the explanatory power of species diversity on multifunctionality is strengthened, which is consistent with the hypothesis that species diversity is positively correlated with ecosystem multifunctionality [82].
Studies have shown that species diversity is no substitute for functional diversity to simply quantify multifunctionality [70], and in recent years, many studies have demonstrated that functional diversity has a stronger explanatory role for multifunctionality [83,84,85]. In our study, functional diversity contributes most to multifunctionality at a small scale, which is determined by a combination of species composition and structure. At small scales, species richness is low to allow for an increase in ecological niche space, which facilitates the expansion of the range of functional plant traits [86], so functional richness is at a higher level at small scales, which indicates a higher proportion of available resources [79], thus allowing functional diversity to dominate variations in ecosystem multifunctionality at small scales. In addition, the FRic index of functional diversity was significantly correlated with ecosystem multifunctionality at all three scales (p < 0.05), and the FDiv index was highly significantly correlated with ecosystem multifunctionality at large scales. The FRic index is a dominant driver of ecosystem multifunctionality at different scales, probably because plant species are limited in desert areas, and changes in species community composition and structure directly alter functional richness [87], which in turn affects single ecosystem functions and thus ecosystem multifunctionality. In addition, functional dispersion is significantly correlated with ecosystem multifunctionality at large scales, probably because as habitat heterogeneity increases on larger scales, variation in functional traits increases, competition among species decreases, complementarity of functional traits for resource use increases, overlap of species’ ecological niches decreases, and the overall degree of resource use within scales increases, which also has a positive effect on the maintenance of ecosystem multifunctionality [86]. The results are also similar to the findings of Huang et al. (2019) [79] in Yunnan.
Genealogical diversity reflects the historical course of species evolution [88], can express community information not represented by species diversity and functional diversity, and is an important component in the study of the relationship between plant diversity and ecosystem multifunctionality [89,90,91]. In our study, genealogical diversity played a dominant role in ecosystem multifunctionality at the mesoscale, probably because habitat heterogeneity has an important influence on the maintenance of genealogical diversity. The results of the study on typical areas of karst landscapes showed that phylogenetic diversity had a single-peaked change with increasing habitat heterogeneity and was greatest in areas of moderate habitat heterogeneity [59]. In addition, a study by Li et al. (2021) [92] in the Daiyun Mountains also showed that phylogenetic diversity showed an intermediate peak with altitude, which was similar to the results of our study. At the mesoscale, habitat heterogeneity is at a moderate level compared to the large and small scales, which contributes more to genealogical diversity, and higher levels of genealogical diversity increase the rate of explanation for ecosystem multifunctionality. Our study also showed that the MPD index was significantly correlated with ecosystem multifunctionality on the large scale, and the PD index was not significantly correlated with ecosystem multifunctionality on any scale, indicating that the proximity of affinities among species plays a major role in maintaining ecosystem multifunctionality at different scales. Although the PD index increases with the number of species, the total number of plant species in the desert area is limited, and when the PD index reaches a certain value, it will not continue to promote the maintenance of ecosystem multifunctionality. In our study area, species relatedness tended to change from distant to close, based on scale expansion. This is likely because the habitat filtering effect in the study area increases with scale, the extreme arid habitat conditions make it easier for species with similar life history strategies to survive [93,94], and similar survival strategies and close affinities use resources in similar ways, allowing limited resources to be fully utilized [95]. Genealogical structure has a strong influence on ecosystem multifunctionality, so the correlation between MNTD and MPD indexes and ecosystem multifunctionality is also stronger than that between PD indices.
5. Conclusions
We uncovered a significant scale effect in the relationship between plant diversity and ecosystem multifunctionality. Differences in sampling scales altered the composition and distribution of species in plant communities. The relative contribution of plant diversity to ecosystem multifunctionality also changed consequently. This highlights the close coupling between scale effects and ecosystem multifunctionality in the plant communities of this study area. Therefore, we will continue to expand the sampling scale in the next research work, aiming to better enhance plant diversity and maintain ecosystem function.
Supplementary Materials
The following supporting information can be downloaded at: https://0-www-mdpi-com.brum.beds.ac.uk/article/10.3390/f13091505/s1, Table S1: Calculation formula of plant diversity indexes.
Author Contributions
Conceptualization, J.L. and G.L.; methodology, J.L.; software, J.L., H.W. and D.H.; writing—original draft preparation, J.L.; writing—review and editing, J.L., L.J. and D.H.; supervision, G.L. funding acquisition, G.L. All authors have read and agreed to the published version of the manuscript.
Funding
This research was supported by the National Natural Science Foundation of China (42171026) and Xinjiang Uygur Autonomous Region innovation environment Construction special project & Science and technology innovation base construction project (PT2107).
Institutional Review Board Statement
Not applicable.
Informed Consent Statement
Not applicable.
Data Availability Statement
Not available.
Conflicts of Interest
The authors declare that they have no conflict of interest.
References
- Cardinale, B.J. Biodiversity loss and its impact on humanity. Nature 2012, 489, 59. [Google Scholar] [CrossRef] [PubMed]
- Srivastava, D.S.; Vellend, M. Biodiversity-Ecosystem Function Research: Is It Relevant to Conservation? Annu. Rev. Ecol. Evol. Syst. 2005, 36, 267–294. [Google Scholar] [CrossRef]
- Swenson, N.G. The role of evolutionary processes in producing biodiversity patterns, and the interrelationships between taxonomic, functional and phylogenetic biodiversity. Am. J. Bot. 2011, 98, 472–480. [Google Scholar] [CrossRef] [PubMed]
- Grace, J.B.; Anderson, T.M.; Smith, M.D.; Seabloom, E.; Andelman, S.J.; Meche, G.; Weiher, E.; Allain, L.K.; Jutila, H.; Sankaran, M. Does species diversity limit productivity in natural grassland communities? Ecol. Lett. 2007, 10, 680–689. [Google Scholar] [CrossRef] [PubMed]
- Ma, W.J.; Zhang, Q.; Niu, J.M.; Kang, S.; Liu, P.T.; He, X.; Yan, Y.; Zhang, Y.N.; Wu, J.G. Relationship of ecosystem primary productivity to species diversity and functional group diversity: Evidence from Stipa breviflora grassland in Nei Mongol. Chin. J. Plant Ecol. 2013, 37, 620–630. [Google Scholar] [CrossRef]
- Manning, P.; van der Plas, F.; Soliveres, S.; Allan, E.; Maestre, F.T.; Mace, G.; Whittingham, M.J.; Fischer, M. Redefining ecosystem multifunctionality. Nat. Ecol. Evol. 2018, 2, 427–436. [Google Scholar] [CrossRef]
- Garland, G.; Banerjee, S.; Edlinger, A.; Oliveira, E.M.; Herzog, C.; Wittwer, R.; Philippot, L.; Maestre, F.T.; Van Der Heijden, M.G.A. A closer look at the functions behind ecosystem multifunctionality: A review. J. Ecol. 2021, 109, 600–613. [Google Scholar] [CrossRef]
- Wang, K.; Wang, C.; Feng, X.M.; Wu, X.; Fu, B.J. Research progress on the relationship between biodiversity and ecosystem versatility. Acta Ecol. Sin. 2022, 42, 11–23. [Google Scholar]
- Zhang, L. Influence Mechanism of Typical Desert Plant Diversity on Ecosystem Function. Master’s Thesis, Xinjiang University, Ürümqi, China, 2019. [Google Scholar]
- Meng, B.; Wang, J. A Review on the Methodology of Scaling with Geo-Data. Acta Geogr. Sin. 2005, 60, 12. [Google Scholar]
- Stürck, J.; Verburg, P.H. Multifunctionality at what scale? A landscape multifunctionality assessment for the European Union under conditions of land use change. Landsc. Ecol. 2017, 32, 481–500. [Google Scholar] [CrossRef]
- Pasari, J.R.; Levi, T.; Zavaleta, E.S.; Tilman, D. Several scales of biodiversity affect ecosystem multifunctionality. Proc. Natl. Acad. Sci. USA 2013, 110, 10219–10222. [Google Scholar] [CrossRef] [PubMed]
- Ye, W.H.; Wang, Z.G.; Cao, H.L.; Lian, J.Y. Spatial distribution of species diversity indices in a monsoon evergreen broadleaved forest at Dinghushan Mountain. Biodivers. Sci. 2008, 16, 454–461. [Google Scholar]
- Deng, H.J.; Li, W.Z.; Cao, Z.; Wang, Q.; Wang, G.R. Species diversity based on sample size in a mixed forest. J. Zhejiang A F Univ. 2015, 32, 67–75. [Google Scholar]
- Pedro, M.S.; Rammer, W.; Seidl, R. A disturbance-induced increase in tree species diversity facilitates forest productivity. Landsc. Ecol. 2016, 31, 989–1004. [Google Scholar] [CrossRef]
- Dang, H. Research on Multi-Scale Construction Mechanism of Desert Communities Based on Traits in Arid Region. Master’s Thesis, Northwest University, Shanxi, China, 2018. [Google Scholar]
- Wang, S.Y.; Lv, G.H.; Jiang, L.M.; Wang, H.F.; Li, Y.; Wang, J.L. Functional diversity and phylogenetic diversity of typical plant communities in Ebi Lake at different scales. J. Ecol. Environ. 2020, 29, 889–900. [Google Scholar]
- Huang, Z.P. Patterns and Mechanisms of Phylogenetic Diversity of Limestone Cave Plant Communities in Guangxi. Master’s Thesis, Guangxi Normal University, Guilin, China, 2019. [Google Scholar]
- Grman, E.; Zirbel, C.R.; Bassett, T.; Brudvig, L.A. Ecosystem multifunctionality increases with beta diversity in restored prairies. Oecologia 2018, 188, 837–848. [Google Scholar] [CrossRef]
- Isbell, F.; Calcagno, V.; Hector, A.; Connolly, J.; Harpole, W.S.; Reich, P.B.; Scherer-Lorenzen, M.; Schmid, B.; Tilman, D.; Van Ruijven, J.; et al. High plant diversity is needed to maintain ecosystem services. Nature 2011, 477, 199–202. [Google Scholar] [CrossRef]
- Van der Plas, F.; Manning, P.; Soliveres, S.; Allan, E.; Scherer-Lorenzen, M.; Verheyen, K.; Wirth, C.; Zavala, M.A.; Ampoorter, E.; Baeten, L.; et al. Biotic homogenization can decrease landscape-scale forest multifunctionality. Proc. Natl. Acad. Sci. USA 2016, 113, 3557–3562. [Google Scholar] [CrossRef]
- Hautier, Y.; Isbell, F.; Borer, E.T.; Seabloom, E.W.; Harpole, W.S.; Lind, E.M.; MacDougall, A.S.; Stevens, C.J.; Adler, P.B.; Alberti, J.; et al. Local loss and spatial homogenization of plant diversity reduce ecosystem multifunctionality. Nat. Ecol. Evol. 2018, 2, 50–56. [Google Scholar] [CrossRef]
- Whitford, W.G. Ecology of Desert Systems; Academic Press: New York, NY, USA, 2002. [Google Scholar]
- Zou, C.; Fan, Z.A. Effects of wind and sand disasters on Photosynthetic Characteristics of cotton in Qira Oasis. J. Chuzhou Univ. 2019, 21, 10–14. [Google Scholar]
- Mao, D.; Lei, J.; Li, S.; Zeng, F.; Zhou, J. Characteristics of Meteorological Factors over Different Landscape Types During Dust Storm Events in Cele, Xinjiang, China. J. Meteorol. Res. 2014, 28, 576–591. [Google Scholar] [CrossRef]
- Qie, Y.D.; Jiang, L.M.; Lv, G.H.; Yang, X.D.; Wang, H.F.; Teng, D.X. Response ofPlant Leaf Functional Traits to Soil Aridity and Salinity in Temperate Desert Ecosystem. Ecol. Environ. Sci. 2018, 27, 24–34. [Google Scholar]
- Bao, S.D. Soil Agrochemical Analysis, 3rd ed.; China Agricultural Press: Beijing, China, 2000. [Google Scholar]
- Zhang, J.T. Quantitative Ecology, 2nd ed.; Science Press: Beijing, China, 2011. [Google Scholar]
- Ricotta, C. A note on functional diversity measures. Basic Appl. Ecol. 2005, 6, 479–486. [Google Scholar] [CrossRef]
- Song, Y.T.; Wang, P.; Zhou, D.W. Methods of measuring plant community functional diversity. Chin. J. Ecol. 2011, 30, 2053–2059. [Google Scholar]
- Faith, D.P. Phylogenetic Diversity: A General Framework for the Prediction of Feature Diversity; Clarendon Press: Oxford, UK, 1994; Volume 50. [Google Scholar]
- Balvanera, P.; Pfisterer, A.B.; Buchmann, N.; He, J.S.; Nakashizuka, T.; Raffaelli, D.; Schmid, B. Quantifying the evidence for biodiversity effects on ecosystem functioning and services. Ecol. Lett. 2006, 9, 1146–1156. [Google Scholar] [CrossRef]
- Maestre, F.T.; Castillo-Monroy, A.P.; Bowker, M.A.; Ochoa-Hueso, R. Species richness effects on ecosystem multifunctionality depend on evenness, composition and spatial pattern. J. Ecol. 2012, 100, 317–330. [Google Scholar] [CrossRef]
- Bowker, M.A.; Maestre, F.T.; Mau, R.L. Diversity and Patch-Size Distributions of Biological Soil Crusts Regulate Dryland Ecosystem Multifunctionality. Ecosystems 2013, 16, 923–933. [Google Scholar] [CrossRef]
- R Team; R Core Team. R: A Language and Environment for Statistical Computing 2014; R Foundation for Statistical Computing: Vienna, Austria, 2008. [Google Scholar]
- Bartoń, K. MuMIn: Multi-Model Inference, Version 1.9; R Package; R Foundation for Statistical Computing: Vienna, Austria, 2013. [Google Scholar]
- Burnham, K.P.; Anderson, D.R. Formal Inference from More Than One Model: Multimodellnference (MMT) 4.1; Springer: New York, NY, USA, 2002. [Google Scholar]
- Hou, J.H.; Mi, X.C.; Liu, C.R.; Ma, K.P. Spatial patterns and associations in a Quercus-Betula forest in northern China. J. Veg. Sci. 2004, 15, 407–414. [Google Scholar]
- Wiegand, T.; Moloney, K.A. A Handbook of Spatial Point Pattern Analysis in Ecology, 5th ed.; CRC Press: Boca Raton, FL, USA, 2013. [Google Scholar]
- He, Z.B.; Zhao, W.Z.; Chang, X.X.; Chang, X.L. Scale dependence in desert plant biodiversity. Acta Ecol. Sin. 2004, 24, 4. [Google Scholar]
- Jia, Z.T.; Yang, J.Y.; Sun, Y.X.; Chen, Q.; Yan, R.Q.; Li, N.N. Species diversity and its correlation with environmental factors in the Alxa Plateau, China. Chin. J. Grassl. 2021, 43, 1–9. [Google Scholar]
- Huang, Z.L.; Kong, G.H.; He, D.Q. Plant community diversity in Dinghushan Nature Reserve. Acta Ecol. Sin. 2000, 20, 193–198. [Google Scholar]
- Violle, C.; Enquist, B.J.; Mcgill, B.J.; Jiang, L.; Cécile, H.A.; Hulshof, C.; Jung, V.; Messier, J. The return of the variance: Intraspecific variability in community ecology. Trends Ecol. Evol. 2012, 27, 244–252. [Google Scholar] [CrossRef] [PubMed]
- Violle, C.; Castro, H.; Richarte, J.; Navas, M.L. Intraspecific seed trait variations and competition: Passive or adaptive response? Funct. Ecol. 2010, 23, 612–620. [Google Scholar] [CrossRef]
- Gubsch, M.; Buchmann, N.; Schmid, B.; Schulze, E.D.; Lipowsky, A.; Roscher, C. Differential effects of plant diversity on functional trait variation of grass species. Ann. Bot. 2011, 107, 157–169. [Google Scholar] [CrossRef]
- García-Cervigón, A.I.; Linares, J.C.; Aibar, P.; Olano, J.M. Facilitation promotes changes in leaf economics traits of a perennial forb. Oecologia 2015, 179, 103–116. [Google Scholar] [CrossRef]
- Vesk, P.A.; Leishman, M.R.; Westoby, M. Simple traits do not predict grazing response in Australian dry shrublands and woodlands. J. Appl. Ecol. 2010, 41, 22–31. [Google Scholar] [CrossRef]
- Díaz, S.; Cabido, M. Vive la difference: Plant functional diversity matters to ecosystem processes. Trend. Ecol Evolut. 2001, 16, 646–655. [Google Scholar] [CrossRef]
- Saugier, B. Plant Strategies, Vegetation Processes, and Ecosystem Properties. Plant Sci. 2001, 161, 813. [Google Scholar] [CrossRef]
- Hooper, D.U.; Chapin, F.S.; Ewel, J.J.; Hector, A.; Setala, H. Effects of biodiversity on ecosystem functioning: A consensus of current knowledge: Ecological Monog. Ecol. Monogr. 2004, 75, 95–105. [Google Scholar]
- Li, X.; Tian, P.; Cheng, X.Q. The species diversity and functional diversity of the typical forest of Taiyue Mountain Shanxi, China. J. Shanxi Agric. Univ. Nat. Sci. Ed. 2017, 9, 1671–8151. [Google Scholar]
- Clark, C.M.; Flynn, D.; Butterfield, B.J.; Reich, P.B.; Cahill, J.F. Testing the Link between Functional Diversity and Ecosystem Functioning in a Minnesota Grassland Experiment. PLoS ONE 2012, 7, e52821. [Google Scholar] [CrossRef] [PubMed]
- Zuo, X.; Jing, Z.; Lv, P.; Wang, S.; Yang, Y.; Yue, X.; Zhou, X.; Li, Y.; Chen, M.; Lian, J. Effects of plant functional diversity induced by grazing and soil properties on above- and belowground biomass in a semiarid grassland. Ecol. Indic. 2018, 93, 555–561. [Google Scholar] [CrossRef]
- Zhang, Q.D.; Duan, X.M.; Bai, Y.F.; Wang, W.L.; Zhang, J.T. Functional diversity of Ulmus lamellosa community in the Taiyue Mountain of Shanxi. Chin. Bull. Bot. 2016, 51, 218–225. [Google Scholar]
- Sasaki, T.; Okubo, S.; Okayasu, T.; Jamsran, U.; Ohkuro, T.; Takeuchi, K. Two-phase functional redundancy in plant communities along a grazing gradient in Mongolian rangelands. Ecology 2009, 90, 2598–2608. [Google Scholar] [CrossRef]
- Chen, C.; Zhu, Z.; Yingnian, L.I.; Yao, T.; Pan, S.; Wei, X.; Kong, B.; Jiali, D.U. Effects of interspecific trait dissimilarity and species evenness on the relationship between species diversity and functional diversity in an alpine meadow. Acta Ecol. Sin. 2016, 36, 661–674. [Google Scholar]
- Dong, S.K.; Tang, L.; Liu, S.L.; Liu, Q.R.; Sun, X.K.; Zhang, Y.; Wu, X.Y.; Zhao, Z.Z.; Li, Y.; Sha, W. Relationship between plant species diversity and functional diversity in alpine grasslands. Acta Ecol. Sin. 2018, 37, 1472–1483. [Google Scholar]
- Wu, H.; Xiao, N.N.; Lin, T.T. Coupling relationship between functional diversity, species diversity and environmental heterogeneity of Pinus oak forest in Qinling Mountains. Eco-Environ. Sci. 2020, 29, 1090–1100. [Google Scholar]
- Tan, Q.Y. Distribution Patterns of Species and Lineage Diversity of Karst Plant Communities Based on Habitat Heterogeneity. Master’s Thesis, Guizhou University, Guiyang, China, 2021. [Google Scholar]
- Cavender-Bares, J.; Keen, A.; Miles, B. Phylogenetic structure of Floridian plant communities depends on taxonomic and spatial scale. Ecology 2006, 87, 109–122. [Google Scholar] [CrossRef] [Green Version]
- Kembel, S.W.; Hubbell, S.P. The phylogenetic structure of a neotropical forest tree community. Ecology 2006, 87, 86–99. [Google Scholar] [CrossRef]
- Sweson, N.G.; Enquist, B.J.; Pither, J.; Thompson, J.; Zimmerman, J.K. The Problem and Promise of Scale Dependency in Community Phylogenetics. Ecology 2006, 87, 2418–2424. [Google Scholar] [CrossRef]
- Swenson, N.G.; Enquist, B.J.; Thompson, J.; Zimmerman, J.K. The influence of spatial and size scale on phylogenetic relatedness in tropical forest communities. Ecology 2007, 88, 1770–1780. [Google Scholar] [CrossRef] [PubMed]
- Willis, C.G.; Halina, M.; Lehman, C.; Reich, P.B.; Keen, A.; McCarthy, S.; Cavender-Bares, J. Phylogenetic community structure in Minnesota oak savanna is influenced by spatial extent and environmental variation. Ecography 2010, 33, 565–577. [Google Scholar] [CrossRef]
- Huang, J.X.; Zheng, F.Y.; Mi, X.C. Influence of environmental factors on phylogenetic structure at multiple spatial scales in an evergreen broad-leaved forest of China. Chin. J. Plant Ecol. 2010, 34, 309–315. [Google Scholar]
- Vamosi, S.M.; Heard, S.B.; Vamosi, J.C.; Webb, C.O. Emerging patterns in the comparative analysis of phylogenetic community structure. Mol. Ecol. 2010, 18, 572–592. [Google Scholar] [CrossRef] [PubMed]
- Loreau, M.; Naeem, S.; Inchausti, P.; Bengtsson, J.; Grime, J.P.; Hector, A.; Hooper, D.U.; Huston, M.A.; Raffaelli, D.; Schmid, B.; et al. Biodiversity and ecosystem functioning: Current knowledge and future challenges. Science 2001, 294, 804–808. [Google Scholar] [CrossRef]
- Cardinale, B.J.; Srivastava, D.S.; Emmett Duffy, J.; Wright, J.P.; Downing, A.L.; Sankaran, M.; Jouseau, C. Effects of biodiversity on the functioning of trophic groups and ecosystems. Nature 2006, 443, 989–992. [Google Scholar] [CrossRef]
- Hector, A.; Bagchi, R. Biodiversity and ecosystem multifunctionality. Nature 2007, 448, 188. [Google Scholar] [CrossRef]
- Tilman, D.; Knops, J.; Wedin, D.; Reich, P.; Ritchie, M.; Siemann, E. The Influence of Functional Diversity and Composition on Ecosystem Processes. Science 1997, 277, 1300–1302. [Google Scholar] [CrossRef]
- Hillebrand, H.; Matthiessen, B. Biodiversity in a complex world: Consolidation and progress in functional biodiversity research. Ecol. Lett. 2010, 12, 1405–1419. [Google Scholar] [CrossRef]
- Byrnes, J.E.K.; Gamfeldt, L.; Isbell, F.; Lefcheck, J.S.; Griffin, J.N.; Hector, A.; Cardinale, B.J.; Hooper, D.U.; Dee, L.E.; Duffy, J.E. Investigating the relationship between biodiversity and ecosystem multifunctionality: Challenges and solutions. Methods Ecol. Evol. 2014, 5, 111–124. [Google Scholar] [CrossRef]
- Zavaleta, E.S.; Pasari, J.R.; Hulvey, K.B.; Tilman, G.D. Sustaining multiple ecosystem functions in grassland communities requires higher biodiversity. Proc. Natl. Acad. Sci. USA 2010, 107, 1443–1446. [Google Scholar] [CrossRef] [PubMed]
- Perkins, D.M.; Bailey, R.A.; Dossena, M.; Gamfeldt, L.; Reiss, J.; Trimmer, M.; Woodward, G. Higher biodiversity is required to sustain multiple ecosystem processes across temperature regimes. Glob. Change Biol. 2015, 21, 396–406. [Google Scholar] [CrossRef] [PubMed]
- Xie, H.; Wang, G.G.; Yu, M. Ecosystem multifunctionality is highly related to the shelterbelt structure and plant species diversity in mixed shelterbelts of eastern China. Glob. Ecol. Conserv. 2018, 16, e00470. [Google Scholar] [CrossRef]
- Gamfeldt, L.; Hillebrand, H.; Jonsson, P.R. Multiple functions increase the importance of biodiversity for overall ecosystem functioning. Ecology 2008, 89, 1223–1231. [Google Scholar] [CrossRef]
- Lohbeck, M.; Bongers, F.; Martinez-Ramos, M.; Poorter, L. The importance of biodiversity and dominance for multiple ecosystem functions in a human-modified tropical landscape. Ecology 2016, 97, 2772–2779. [Google Scholar] [CrossRef]
- Soliveres, S.; Maestre, F.T.; Eldridge, D.J.; Delgado-Baquerizo, M.; Quero, J.L.; Bowker, M.A.; Gallardo, A. Plant diversity and ecosystem multifunctionality peak at intermediate levels of woody cover in global drylands. Glob. Ecol. Biogeogr. J. Macroecology 2014, 23, 1408–1416. [Google Scholar] [CrossRef]
- Huang, X.B.; Su, J.R.; Li, S.F.; Liu, W.D.; Lang, X.D. Functional diversity drives ecosystem multifunctionality in a Pinus yunnanensis natural secondary forest. Sci. Rep. 2019, 9, 6979. [Google Scholar] [CrossRef]
- Xiong, D.P.; Zhao, G.S.; Wu, J.S.; Shi, P.L.; Zhang, X.Z. Relationship between species diversity and ecosystem multifunction in Qiangtang Alpine grassland. Acta Ecol. Sin. 2016, 36, 3362–3371. [Google Scholar]
- Chen, T.; Zhang, Z.W.; Liang, S.M.; Lv, Y.H.; Zhang, Y.; Zhao, J.J. Relationship between plant species diversity and ecosystem function in water-level-fluctuation zone of Xiaolangdi Reservoir area. J. Shanxi Norm. Univ. Nat. Sci. Ed. 2022, 36, 80–88. [Google Scholar]
- Maestre, F.T.; Quero, J.L.; Gotelli, N.J.; Escudero, A.; Ochoa, V.; Delgado-Baquerizo, M.; García-Gómez, M.; Bowker, M.A.; Soliveres, S.; Escolar, C.; et al. Plant species richness and ecosystem multifunctionality in global drylands. Science 2012, 335, 214–218. [Google Scholar] [CrossRef]
- Roscher, C.; Schumacher, J.; Gubsch, M.; Lipowsky, A.; Weigelt, A.; Buchmann, N.; Schmid, B.; Schulze, E.D. Using plant functional traits to explain diversity-productivity relationships. PLoS ONE 2012, 7, e36760. [Google Scholar] [CrossRef] [PubMed]
- Chanteloup, P.; Bonis, A. Functional diversity in root and above-ground traits in a fertile grassland shows a detrimental effect on productivity. Basic Appl. Ecol. 2013, 14, 208–216. [Google Scholar] [CrossRef]
- Fu, H.; Zhong, J.Y.; Yuan, G.X.; Ni, L.Y.; Xie, P.; Cao, T. Functional traits composition predict macrophytes community productivity along a water depth gradient in a freshwater lake. Ecol. Evol. 2014, 4, 1516–1523. [Google Scholar] [CrossRef] [PubMed]
- Song, Y.T.; Wang, P.; Li, G.D.; Zhou, D.W. Relationships between functional diversity and ecosystem functioning: A review. Acta Ecol. Sin. 2014, 34, 85–91. [Google Scholar] [CrossRef]
- Liu, M.X.; Zhang, G.J.; Li, L.; Mu, R.L.; Xu, L.; Yu, R.X. Relationship between functional diversity and ecosystem multifunctionality of alpine meadow along an altitude gradient in Gannan, China. Chin. J. Appl. Ecol. 2022, 33, 1291–1299. [Google Scholar]
- Knapp, S.; Kühn, I.; Schweiger, O.; Klotz, S. Challenging urban species diversity: Contrasting phylogenetic patterns across plant functional groups in Germany. Ecol. Lett. 2008, 11, 1054–1064. [Google Scholar] [CrossRef]
- Cadotte, M.W.; Cardinale, B.J.; Oakley, T.H. Evolutionary history and the effect of biodiversity on plant productivity. Proc. Natl. Acad. Sci. USA 2008, 105, 17012–17017. [Google Scholar] [CrossRef]
- Yuan, Z.; Wang, S.; Gazol, A.; Mellard, J.; Lin, F.; Ye, J.; Hao, Z.; Wang, X.; Loreau, M. Multiple metrics of diversity have different effects on temperate forest functioning over succession. Oecologia 2016, 182, 1175–1185. [Google Scholar] [CrossRef]
- Cadotte, M.W. Phylogenetic diversity and productivity: Gauging interpretations from experiments that do not manipulate phylogenetic diversity. Funct. Ecol. 2015, 29, 1603–1606. [Google Scholar] [CrossRef]
- Li, M.J.; He, Z.S.; Jiang, L.; Gu, X.G.; Jin, M.R.; Chen, B.; Liu, J.F. Distribution patterns and driving factors of altitudinal gradients of species diversity and phylogenetic diversity in Daiyun Mountain. Acta Ecol. Sin. 2021, 41, 1148–1157. [Google Scholar]
- Meng, Q.X. Distribution Pattern of Plant Community DIversity and Its Response to Environmental Factors in Taihang Mountain. Master’s Thesis, Shanxi University, Taiyuan, China, 2020. [Google Scholar]
- Xiao, Y.M.; Yang, L.C.; Nie, X.Q.; Chang-Bin, L.I.; Xiong, F.; Zhou, G.Y. Phylogenetic patterns of shrub communities along the longitudinal and latitudinal gradients on the northeastern Qinghai–Tibetan Plateau. J. Mt. Sci. Engl. Ed. 2020, 17, 9. [Google Scholar] [CrossRef]
- Lin, H.L. Analysis on Community Structure and Pedigree Structure of Deciduous Broadleaved Forest in Karst Stone Mountain of Guilin. Master’s Thesis, Guangxi Normal University, Guilin, China, 2021. [Google Scholar]
Figure 1.
Location of the study area and the investigated plots.

Figure 2.
Characteristics and differences in plant diversity between scales (Mean ± SE). Note: error lines are standard errors; different lowercase letters on the error line for the same diversity index indicate highly significant differences between data (p < 0.05).
Figure 2.
Characteristics and differences in plant diversity between scales (Mean ± SE). Note: error lines are standard errors; different lowercase letters on the error line for the same diversity index indicate highly significant differences between data (p < 0.05).

Figure 3.
Characteristics and differences in ecosystem multifunctionality between scales. Note: Error lines are standard errors; same lowercase letters on the error line indicate no significant differences between data (p > 0.05).
Figure 3.
Characteristics and differences in ecosystem multifunctionality between scales. Note: Error lines are standard errors; same lowercase letters on the error line indicate no significant differences between data (p > 0.05).

Figure 4.
Relationship between plant diversity and ecosystem multifunction at different scales. Note: *, ** and *** represent p < 0.05, p < 0.01 and p < 0.001.
Figure 4.
Relationship between plant diversity and ecosystem multifunction at different scales. Note: *, ** and *** represent p < 0.05, p < 0.01 and p < 0.001.


Table 1.
Soil index and determination method.
| Soil Factor | Method |
|---|---|
| Soil water content | Drying and weighing method |
| pH | Acidimeter |
| Electrical conductivity | Residue method |
| Organic carbon | Potassium dichromate dilution heating method |
| Total phosphorus | Molybdenum antimony colorimetric method |
| Available phosphorus | Spectrophotometry |
| Total nitrogen | Kjeldahl method |
| Nitrate nitrogen | UV spectrophotometry |
| Ammonium nitrogen | UV spectrophotometry |
Publisher’s Note: MDPI stays neutral with regard to jurisdictional claims in published maps and institutional affiliations. |
© 2022 by the authors. Licensee MDPI, Basel, Switzerland. This article is an open access article distributed under the terms and conditions of the Creative Commons Attribution (CC BY) license (https://creativecommons.org/licenses/by/4.0/).
Share and Cite
MDPI and ACS Style
Liu, J.; Hu, D.; Wang, H.; Jiang, L.; Lv, G. Scale Effects on the Relationship between Plant Diversity and Ecosystem Multifunctionality in Arid Desert Areas. Forests 2022, 13, 1505. https://0-doi-org.brum.beds.ac.uk/10.3390/f13091505
AMA Style
Liu J, Hu D, Wang H, Jiang L, Lv G. Scale Effects on the Relationship between Plant Diversity and Ecosystem Multifunctionality in Arid Desert Areas. Forests. 2022; 13(9):1505. https://0-doi-org.brum.beds.ac.uk/10.3390/f13091505
Chicago/Turabian StyleLiu, Jiaxin, Dong Hu, Hengfang Wang, Lamei Jiang, and Guanghui Lv. 2022. "Scale Effects on the Relationship between Plant Diversity and Ecosystem Multifunctionality in Arid Desert Areas" Forests 13, no. 9: 1505. https://0-doi-org.brum.beds.ac.uk/10.3390/f13091505
Note that from the first issue of 2016, this journal uses article numbers instead of page numbers. See further details here.