Article

Changes in Soil Microbial Communities under Mixed Organic and Inorganic Nitrogen Addition in Temperate Forests

1
College of Ecology and Environment, Xinjiang University, 777 Huarui Road, Urumqi 830017, China
2
Key Laboratory of Oasis Ecology, Xinjiang University, 777 Huarui Road, Urumqi 830017, China
3
Xinjiang Jinghe Observation and Research Station of Temperate Desert Ecosystem, Ministry of Education, Xinjiang University, 777 Huarui Road, Urumqi 830017, China
4
College of Tourism, Xinjiang University, 777 Huarui Road, Urumqi 830017, China
*
Author to whom correspondence should be addressed.
Submission received: 14 October 2022 / Revised: 14 December 2022 / Accepted: 20 December 2022 / Published: 22 December 2022
(This article belongs to the Special Issue Plant Adaptation to Extreme Environments in Drylands)

Abstract

:
Investigating the response of soil microbial communities to nitrogen (N) deposition is critical to understanding biogeochemical processes and the sustainable development of forests. However, whether and to what extent different forms of N deposition affect soil microbial communities in temperate forests is not fully clear. In this work, a field experiment with three years of simulated nitrogen deposition was conducted in temperate forests. The glycine and urea were chosen as organic nitrogen (ON) source, while NH4NO3 was chosen as inorganic nitrogen (IN) source. Different ratios of ON to IN (CK = 0:0, Mix-1 = 10:0, Mix-2 = 7:3, Mix-3 = 5:5, Mix-4 = 3:7, Mix-5 = 0:10) were mixed and then used with equal total amounts of 10 kg·N·ha−1·a−1. We determined soil microbial diversity and community composition for bacteria and fungi (16S rRNA and ITS), and soil parameters. Different forms of N addition significantly changed the soil bacterial and fungal communities. Mixed N sources had a positive effect on soil bacterial diversity and a negative effect on fungal diversity. Bacterial and fungal community structures were significantly separated under different forms of N addition. Soil pH was the main factor affecting the change in fungal community structure, while bacterial community structure was mainly controlled by STN. We also found that Proteobacteria, Acidobacteriota, Basidiomycota and Ascomycota were the most abundant phyla, regardless of the form of N addition. RDA showed that C/P and NH4+ were the main factors driving the change in bacterial community composition, and C/P, pH and C/N were the main factors driving the change in fungal community composition. Our results indicate that different components of N deposition need to be considered when studying the effects of N deposition on soil microorganisms in terrestrial ecosystems.

1. Introduction

Human activities (energy production, industry, agricultural practices, and intensive animal husbandry) have led to a substantial increase in nitrogen (N) deposition in terrestrial ecosystems [1]. The increased N deposition has alleviated the demand for N in terrestrial ecosystems and has led to a shift from N deficiency to N loading in some ecosystems [2,3]. However, most forest ecosystems, particularly northern temperate forests, are still considered N-limited [4]. Therefore, the potential effects of N deposition on temperate forest ecosystems, such as changes in soil pH, nutrients, biodiversity, and primary productivity, have attracted much attention [5,6,7]. Soil microbes play a critical role in soil functions, ecological processes, and ecosystem functions and may be very sensitive to N deposition [8,9]. Studies on the effect of N deposition on soil microbial communities have been conducted worldwide. However, research on the response of soil microbial communities to N deposition in temperate forests is limited.
N deposition has a profound impact on microbial communities in forest ecosystems, including their diversity, structure, and composition [9,10,11,12]. However, there is no consensus opinion on the effects of N addition on microbial communities due to differences in ecosystems, background N deposition, N application rates and experimental periods. N addition has negative, positive and neutral effects on soil microbial communities. In temperate forests, N-saturated subtropical and tropical forests, studies have found that N addition reduces soil microbial biomass and diversity [13,14,15]. In contrast, studies in N-limited temperate meadows and boreal forests have found that N addition promotes the growth of soil microorganisms [16,17]. In addition, it has also been reported that N addition has a neutral effect on soil microorganisms [18]. In general, N addition mainly affects soil microbial communities through two aspects. On the one hand, N addition alters the nutrient use strategy of soil microorganisms, thus affecting their community structure and composition [19]. On the other hand, N addition also alters abiotic variables that affect soil microbial community composition (e.g., available N, pH, C, and P) [20]. Most studies have linked the microbial response to N addition to soil pH, and argue that soil acidification is the main factor controlling these changes [21,22]. Many studies have shown that soil pH is a key factor in predicting soil microbial activity, and N addition significantly reduces soil pH in most ecosystems [15,23].
Recent studies have shown that plants and microbes display selective absorption characteristics for different forms of N resources [24,25,26]. Therefore, the forms of the N sources may be an important driving factor leading to soil microorganism community assembly. Previous studies have only examined the effects of different forms of inorganic nitrogen (IN) (e.g., NH4+ and NO3) on ecosystems, but rarely considered organic nitrogen (ON) [27,28,29]. In fact, atmospheric N deposition includes ON components (urea, glycine, etc.) in addition to IN components, accounting for approximately 30–36% and approximately 28% in China, and this proportion may continue to increase in the future [30,31]. ON sources have bioavailability similar to that of IN and are more likely to be bioavailable, especially in N-limited ecosystems [32]. Urea fertilizer increases soil microbial biomass faster than NH4NO3 fertilizer, indicating that ON may be the preferred N source for soil microbes [33]. Although ON was used as the N source in some field trials, it was used only as a single N source [25]. This approach may not provide complete information about the effect of atmospheric N deposition on soil microorganisms. Recent studies have also focused on the effects of different types of N sources on ecosystems. For example, in tropical forests, mixed N application enhances the ability of soil microorganisms to secrete enzymes, increases soil enzyme activity, and improves the tolerance of soil microorganisms to pH fluctuations [34]. An investigation in a temperate grassland and coniferous forest showed that mixed N application significantly increased the litter decomposition rate [26,35]. Studies have also pointed out that an increase in the ON ratio under mixed N source fertilization alleviates the inhibitory effect of N input on soil respiration, which may increase forest soil CO2 emissions [36]. In summary, the mixed N sources had positive effects in these investigations. However, these studies only provide limited information, and it is necessary to study the effects of different forms of N addition on soil microbial communities.
In April 2018, we established a N deposition simulation experiment site in a temperate forest in the Tianshan Mountains and carried out a N addition experiment for three years. Then, we applied high-throughput DNA sequencing techniques to determine the change in soil microbial communities under different forms of N addition. Our purposes were to: (1) compare the alteration of microbial community diversity and community structure under different forms of N addition and (2) determine the main soil parameters that cause microbial community diversity and community structure changes. We hypothesized that: (1) the response of microbial community to N addition is regulated by ON:IN ratio. (2) Mixed nitrogen addition has a positive effect on microbial community diversity and structure. (3) Soil pH is the main factor controlling the effects of different forms of N addition on bacterial and fungal communities.

2. Materials and Methods

2.1. Study Site

This research was carried out in a typical temperate forest located in the Tianshan Mountains, Xinjiang, China (42°25.96′ N, 87°28.17′ E; 1992 m.a.s.l.). Schrenk’s spruce (Picea schrenkiana) is the dominant tree and the stand mostly comprises pristine forest, with a height of approximately 16 m, an average diameter at breast height (DBH) of 17.6 cm, an average tree age of 78 a and a canopy density of 0.6–0.8. There were almost no associated herbaceous plants within the forest, with only sporadically distributed Geranium rotundifolium and Aegopodium podagraria [37]. The mean annual temperature is approximately 2.5 °C. The average annual precipitation is approximately 650 mm, with most falling during May to October. The annual total radiation is estimated to be 5.85 × 10⁵ J cm−2 a−1. The background N deposition is 10 kg·N·ha−1·a−1 [5,38]. The soil is a gray brown forest soil according to the soil classification of China [39].

2.2. Experimental Design and Sampling

The simulated N deposition experiment was established in April 2018. We referred to the experimental designs in previously published studies [34,36]. The glycine and urea were chosen as ON sources, while NH4NO3 was chosen as the IN source. Different ratios of ON to IN were mixed with equal total amounts with 10 kg·N·ha−1·a−1 for a total of six treatments: CK (ON:IN = 0:0), ON (ON:IN = 10:0), Mix-1 (ON:IN = 7:3), Mix-2 (ON:IN = 5:5), Mix-3 (ON:IN = 3:7), and IN (ON:IN = 0:10). Eighteen (5 m × 5 m) plots separated from each other by a buffer zone of >5 m were established, including six treatments with three replicates. All plots were equivalent in terms of altitude, slope (<15°), soil and vegetation types. The nitrogen fertilizer weighed in the laboratory was dissolved in 10L of water. During the growing season from May to October each year, the nitrogen fertilizer solution (1.667 kg·N·ha−1·a−1) was evenly sprayed on the surface with a backpack sprayer at the beginning of the month, and the CK plot was only sprayed with the same amount of deionized water obtained from the laboratory.
Topsoil (0–20 cm) samples were collected at the end of August 2021. The litter layer was removed before sampling. Five soil samples were collected from five random points using a soil sampler (0–20 cm deep with a 2 cm inner diameter) and mixed to obtain a composite sample for each plot. Fresh soil samples were stored in sterile closed polypropylene bags after removing impurities (vegetation residues and stones) and passage through a 2 mm sterile sieve. Each composite soil sample was divided into two parts: one was transported to the laboratory in liquid N and then stored in a freezer at −80 °C for DNA extraction. The second part was further divided into two subsamples: one subsample was stored at 4 °C, and used for the determination of NH4+ and NO3 contents within one week. The other subsample was air-dried for pH, soil total N (STN), soil organic carbon (SOC), and soil total phosphorus (STP) analyses.

2.3. Soil Property Determinations

Soil water content (SWC) was obtained by the gravimetric method. Soil pH was measured by a glass electrode (PHS-3E, Leici, Shanghai, China) in a soil-water solution (1:2.5). The SOC concentration was determined by performing potassium dichromate oxidation titration with an Fe2+ solution [40]. The STN was determined through acid digestion using the Kjeldahl method [41]. The STP was determined using the molybdenum-antimony colorimetric method after the soil samples were digested with H2SO4 [40]. The fresh soil samples were extracted from a 2 M KCl solution and filtered, and then the contents of NH4+ and NO3 were analyzed with a flow injection autoanalyzer (Bran and Luebbe, Norderstedt, Germany).

2.4. DNA Isolation and Illumina HiSeq Sequencing

Total genomic DNA was extracted from 0.5 g of soil by the CTAB method. A 1% agarose gel was used to verify DNA purity and concentration. The V4 region of the 16S rRNA gene was amplified using the primers 515F (GTGCCAGCMGCCGCGGTAA) and 806R (GGACTACHVGGGTWTCTAAT). The PCR primers ITS5–11737 (GGAAGTAAAAGTCGTAACAAGG) and ITS2–2043R were used to amplify the fungal ITS1 regions (GCTGCGTTCTTCATCG-ATGC). The PCR products were combined with an equivalent amount of 1× loading buffer (including SYBR Green), and DNA was detected by electrophoresis on a 2% agarose gel. The PCR products were purified using the Qiagen Gel Extraction Kit (Qiagen, Hilden, Germany) after being mixed in equal parts. The NEBNext® UltraTM IIDNA Library Prep Kit was used to create sequencing libraries according to the manufacturer’s instructions (Cat No. E7645). A Qubit@ 2.0 Fluorometer (Thermo Scientific, Waltham, Massachusetts, United States) and an Agilent Bioanalyzer 2100 system were used to assess the library’s quality. Finally, the Illumina NovaSeq platform was used to sequence the library. The original data were then spliced and filtered to produce useful tags (FLASH, Version 1.2.11, http://0-ccb-jhu-edu.brum.beds.ac.uk/software/FLASH/ (accessed on 24 November 2021)) [42].
To acquire initial amplicon sequence variants (ASVs), denoising of the effective tags obtained as described above was conducted with DADA2 in QIIME2 software (version QIIME2-202006), and then ASVs with abundances less than 5 were deleted. QIIME2 was used for species annotation. For 16S annotation, the Silva Database https://www.arbsilva.de/ (accessed on 24 November 2021) was utilized, and for ITS annotation, the Unite Database https://unite.ut.ee/ (accessed on 24 November 2021) was employed [43]. The species rarefaction curve reflected the community diversity at different sequencing numbers. With the increase of the number of sequencings, the dilution curve of samples finally tended to be gentle (Figure A1), indicating that the amount of sequencing data was sufficient, and the measured data could reflect the real situation of bacterial and fungal communities.

2.5. Statistical Analysis

Alpha diversity was assessed by calculating the Shannon and Chao1 index values (QIIME2 software. version 1.9.1). The differences in microbial community structures among treatments were determined using nonmetric multidimensional scaling (NMDS) analysis, and permutational multivariate analyses of variances (PERMANOVAs) based on the Bray–Curtis dissimilarity were conducted to test for the significant dissimilarity among different N additions. Both above analyses were processed in the “vegan” package of R software [44]. Random forest plots were constructed to determine soil parameters that play an important role in regulating microbial community structure, which was processed in the “random forest” package of R software [44]. One-way analysis of variance (One-way ANOVA) and least significant difference (LSD, p < 0.05) were used to detect the significant differences between treatments with different forms of nitrogen in SPSS v24.0 software (SPSS Inc., Chicago, IL, USA) [45]. In the CANOCO 5.0 software (Wageningen UR, Netherlands), Redundant analysis (RDA) was used to identify important soil parameters affecting soil microbial community composition. Graphs were drawn by Origin 2021b.

3. Results

3.1. Effects of N Addition on Soil Properties

N addition changed the soil parameters (Table 1). The ON treatment significantly increased SOC, STN, C/N, C/P, N/P and NO3. The IN treatment significantly increased SOC, STN, STP, NO3, and NH4+, but decreased pH. The Mix-1 treatment significantly increased STP, C/N, and NH4+, but decreased STN, C/P, N/P. The Mix-2 treatment significantly increased STP, NH4+ and SWC, but decreased C/P and N/P. The Mix-3 treatment significantly reduced SOC, STN, C/P, and N/P, but increased STP.

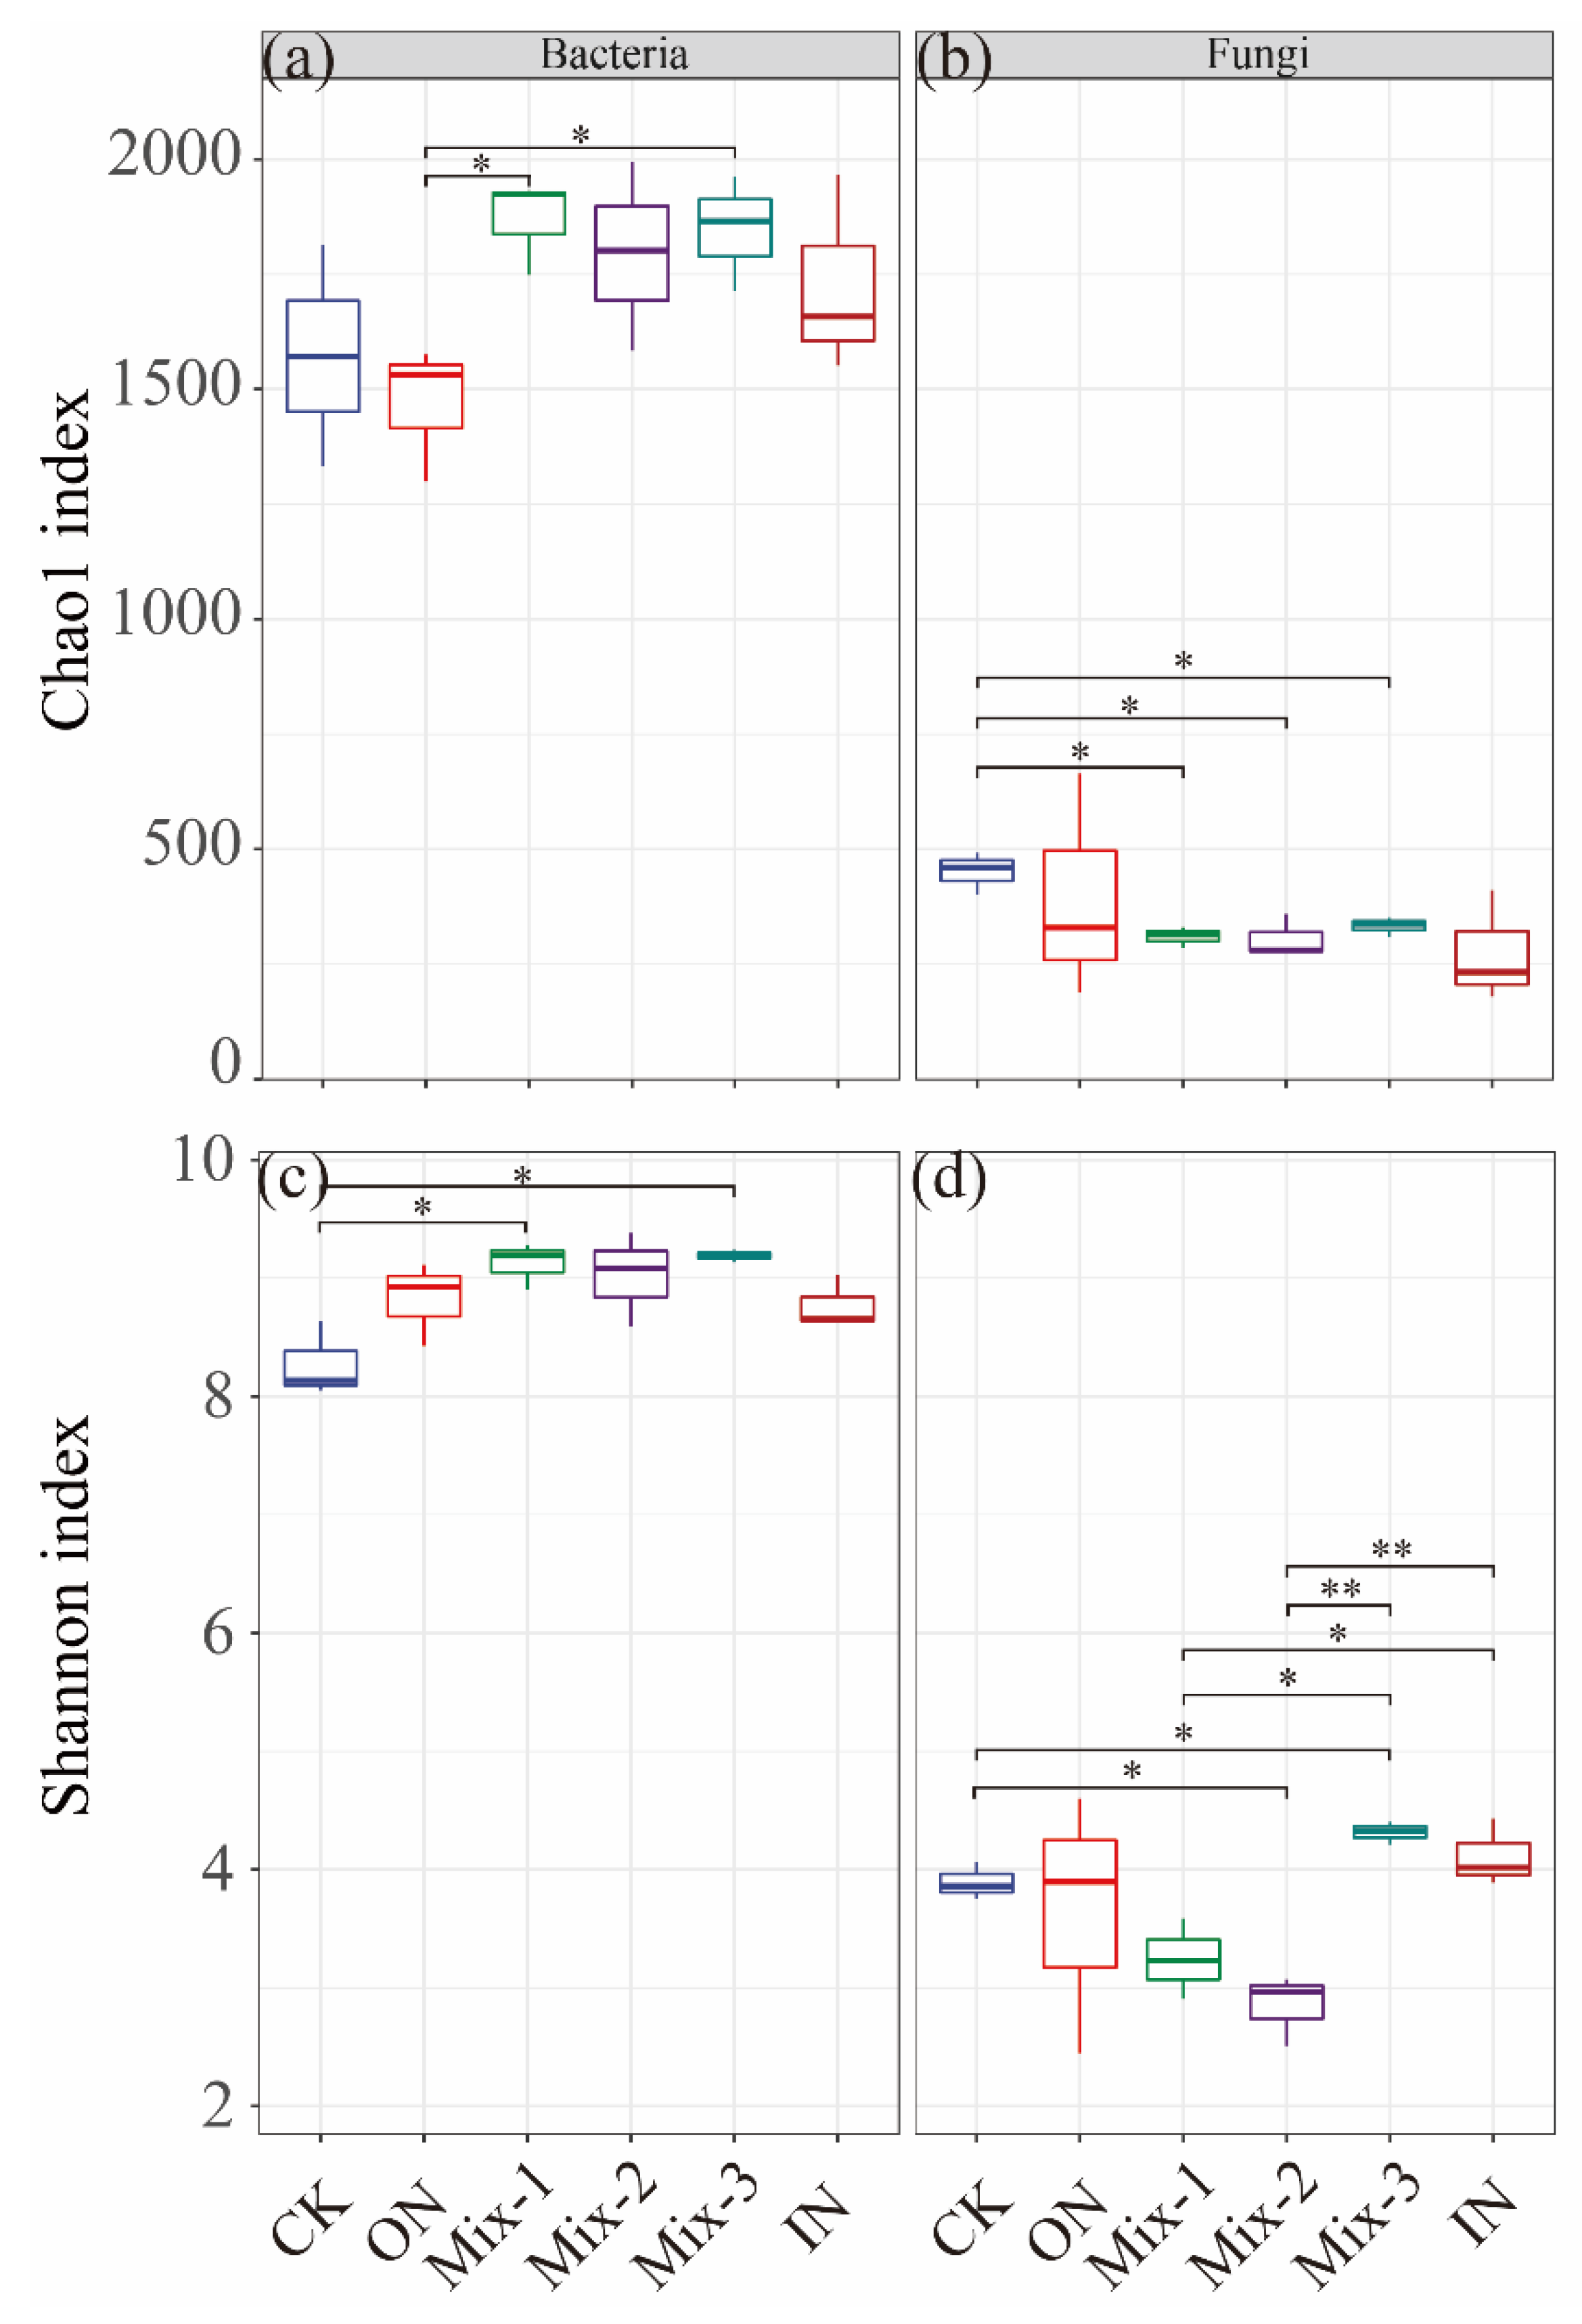
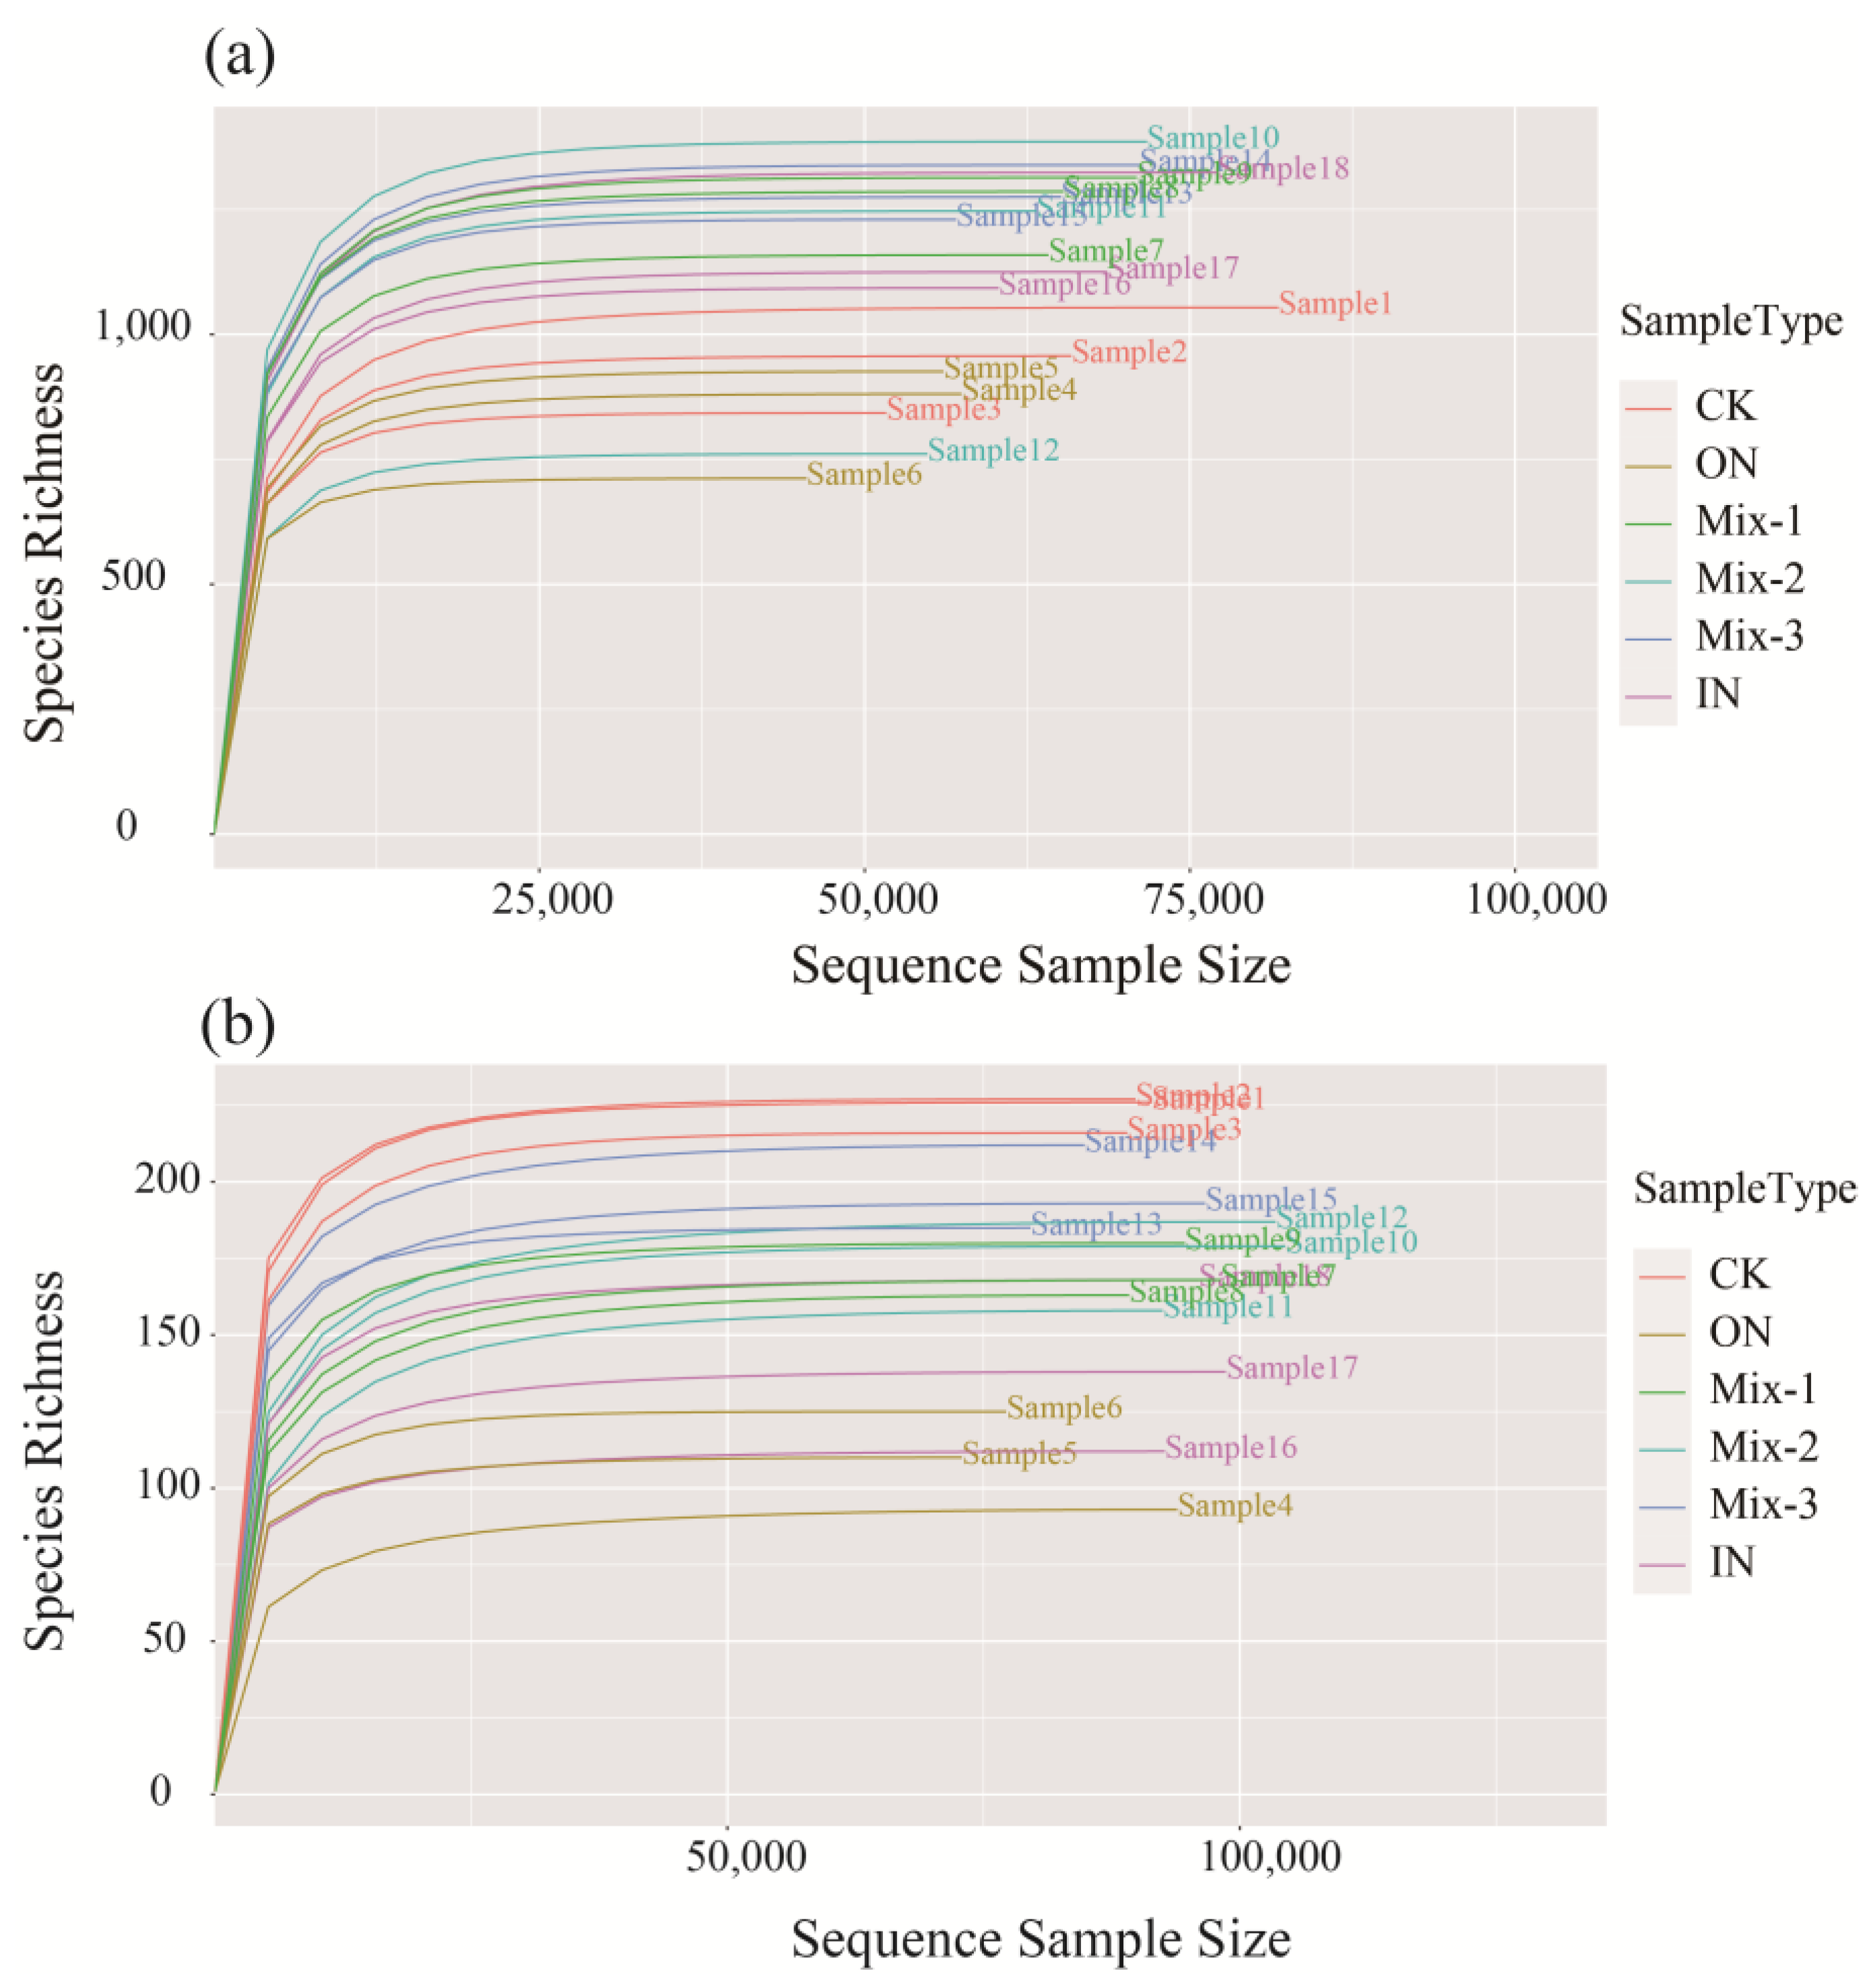
3.2. Soil Bacterial and Fungal Diversity

N addition had no significant effect on the Chao1 index of the bacterial community compared with that in the CK treatment. The Mix-1 and Mix-2 treatments had significantly higher values than the ON treatment (p < 0.05; Figure 1a). For fungi, the Chao1 index decreased significantly in the Mix-1, Mix-2 and Mix-3 treatments (p < 0.05; Figure 1b). The Mix-1 and Mix-2 treatments significantly increased the bacterial Shannon index (p < 0.05; Figure 1c). The Shannon index of fungi decreased significantly in Mix-2 treatment and increased significantly in Mix-3 treatment (p < 0.05; Figure 1d). According to Pearson analysis, the bacterial Chao1 index had a significant negative correlation with C/P and N/P (Figure A2; p < 0.05). The fungal Chao1 index was significantly positively correlated with soil pH (Figure A2; p < 0.05). The fungal Shannon index was significantly negatively correlated with STP (Figure A2; p < 0.05).

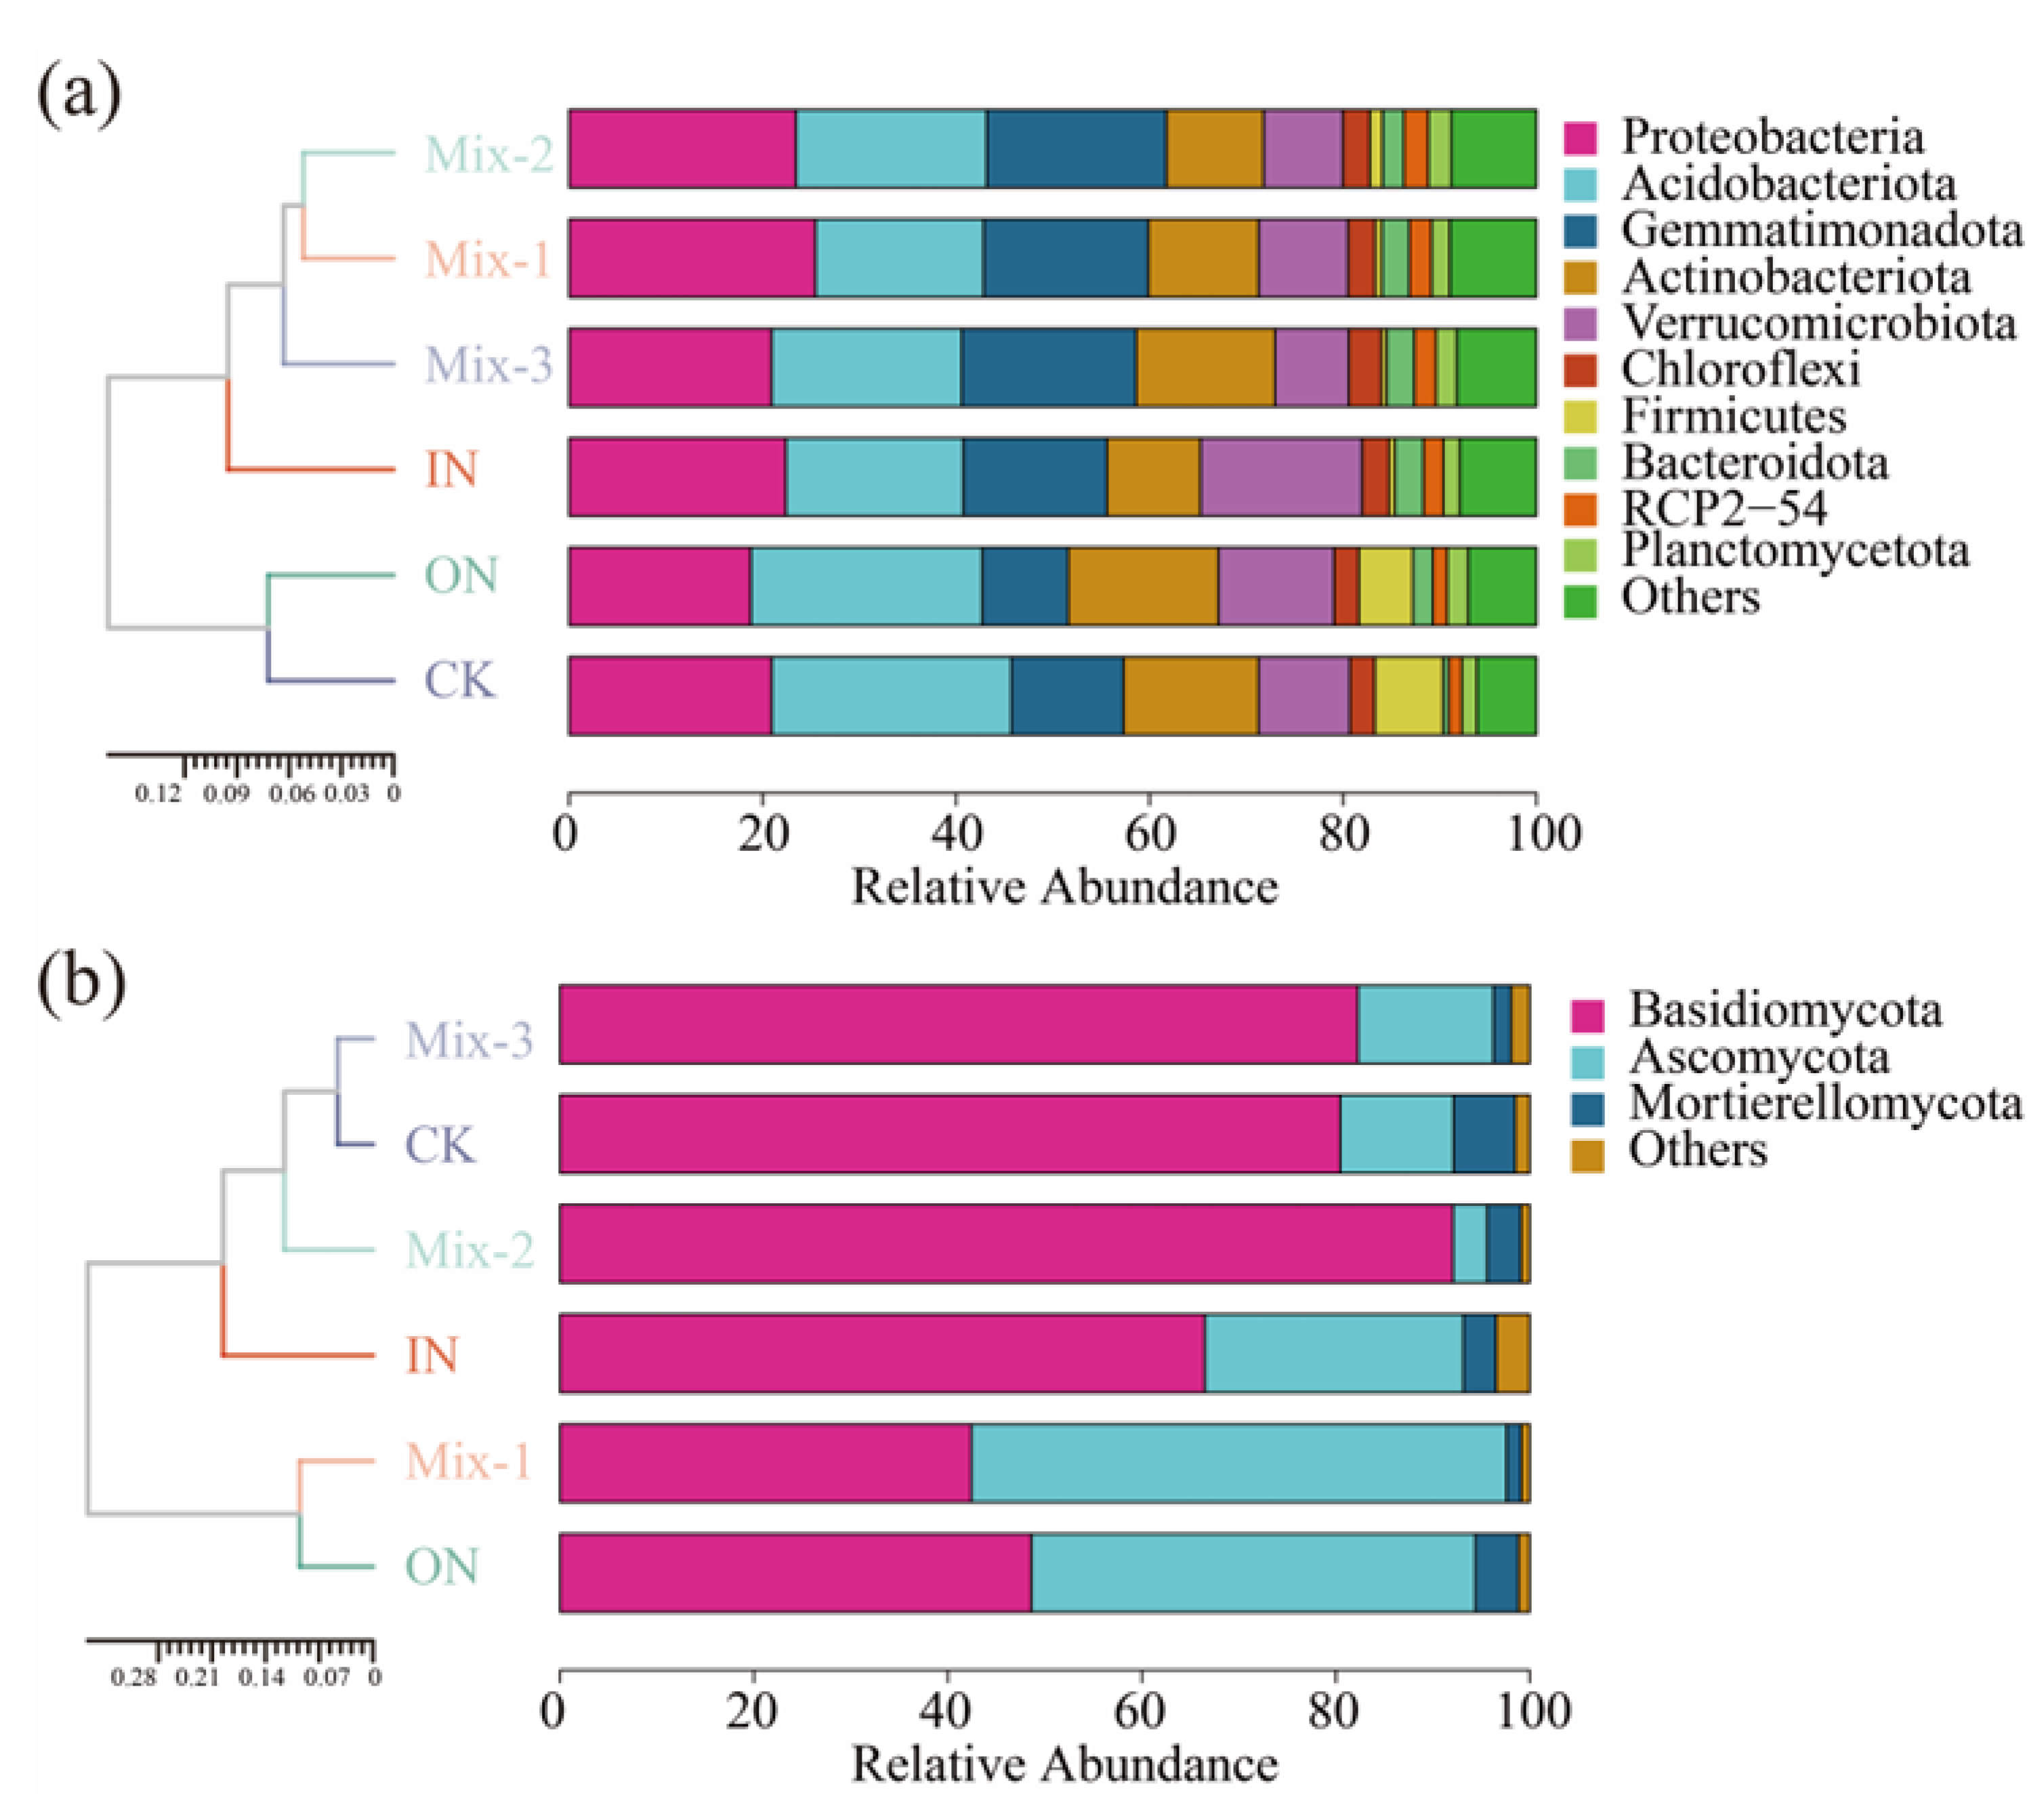
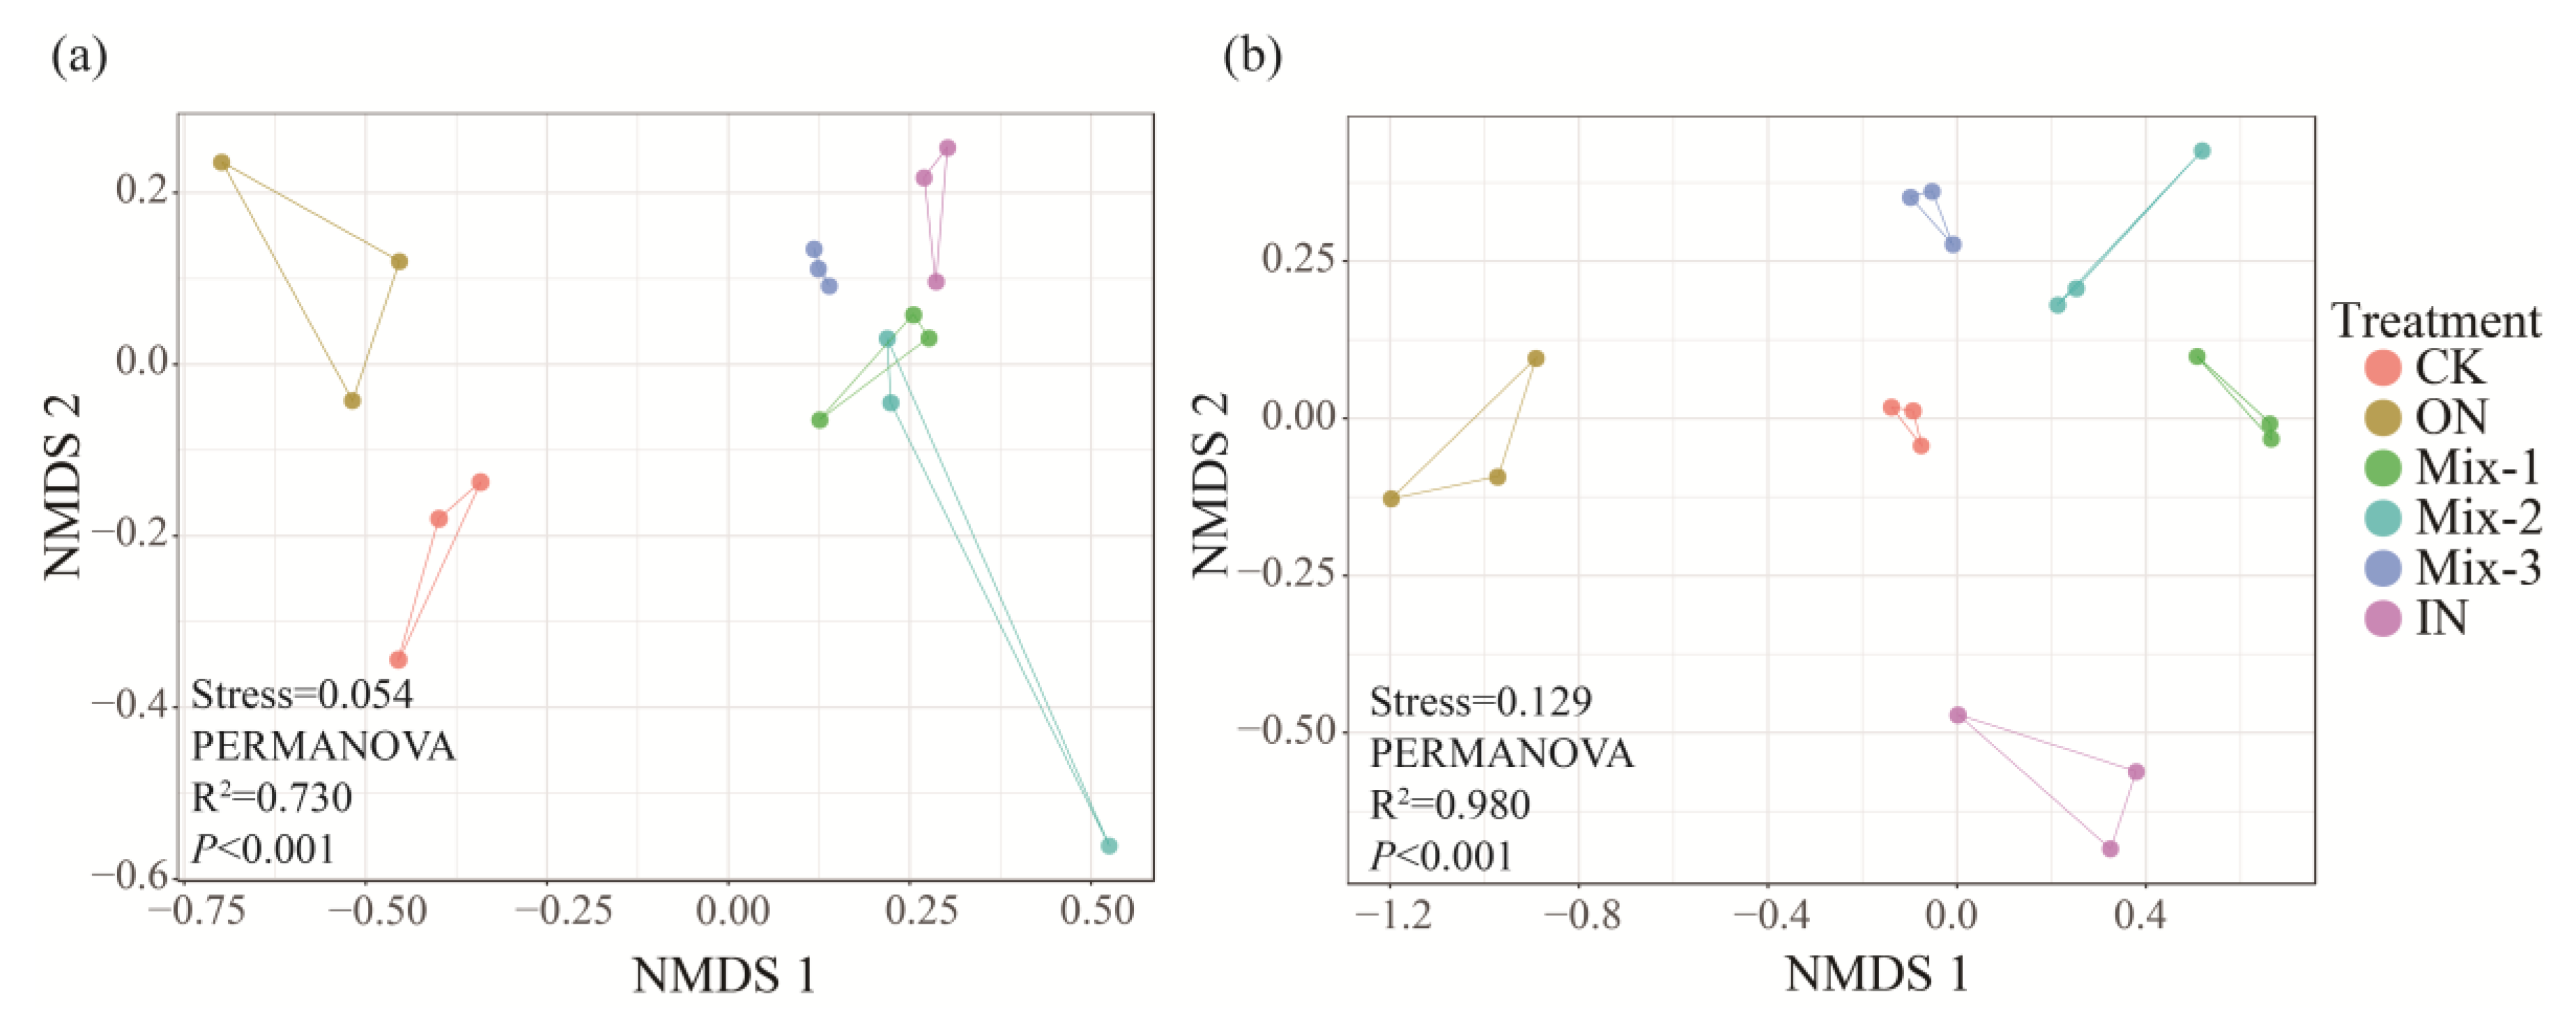
3.3. Soil Microbial Species Composition and Community Structure

For the bacterial community, the dominant phyla were Proteobacteria, Acidobacteriota, Gemmatimonadota, Actinobacteriota, and Verrucomicrobiota (Figure 2a). The dominant phyla in the fungal community were Basidiomycota and Ascomycota (Figure 2b). NMDS analysis showed that the community structures of bacteria (PERMANOVA, R2 = 0.730, p < 0.001; Figure 3a) and fungi (PERMANOVA, R2 = 0.980, p < 0.001; Figure 3b) varied significantly among the treatments (Figure 3).

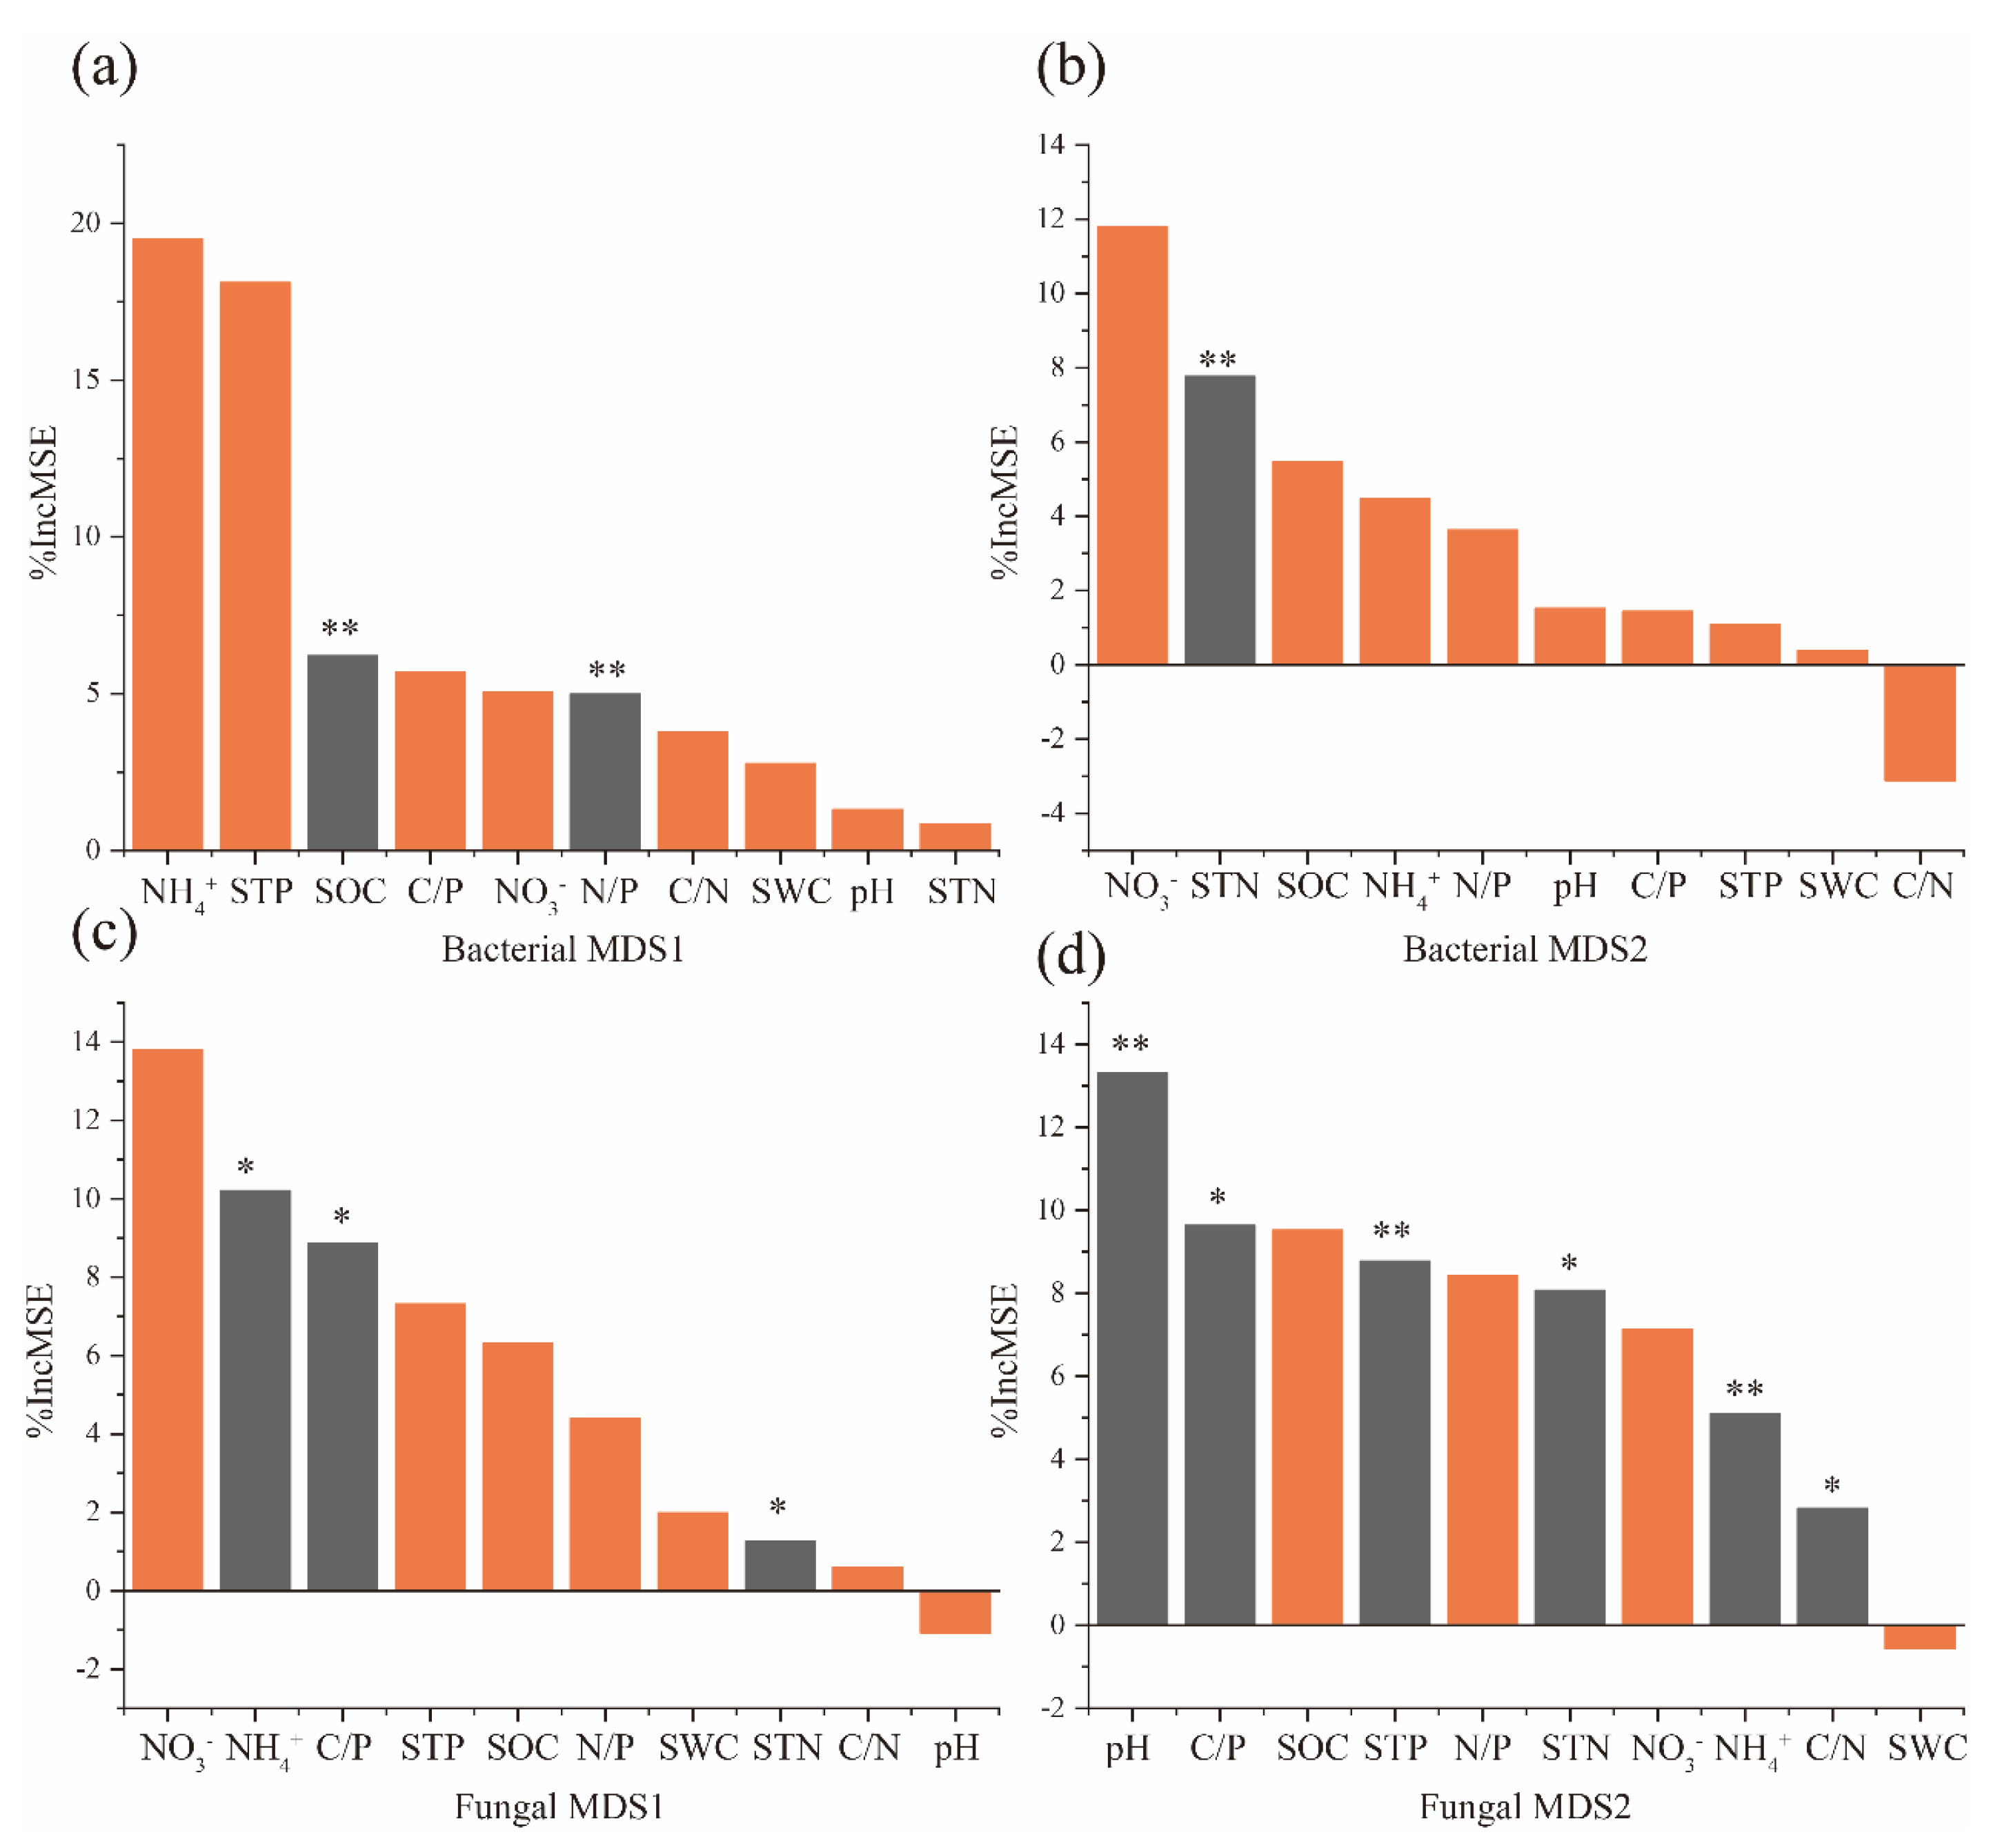
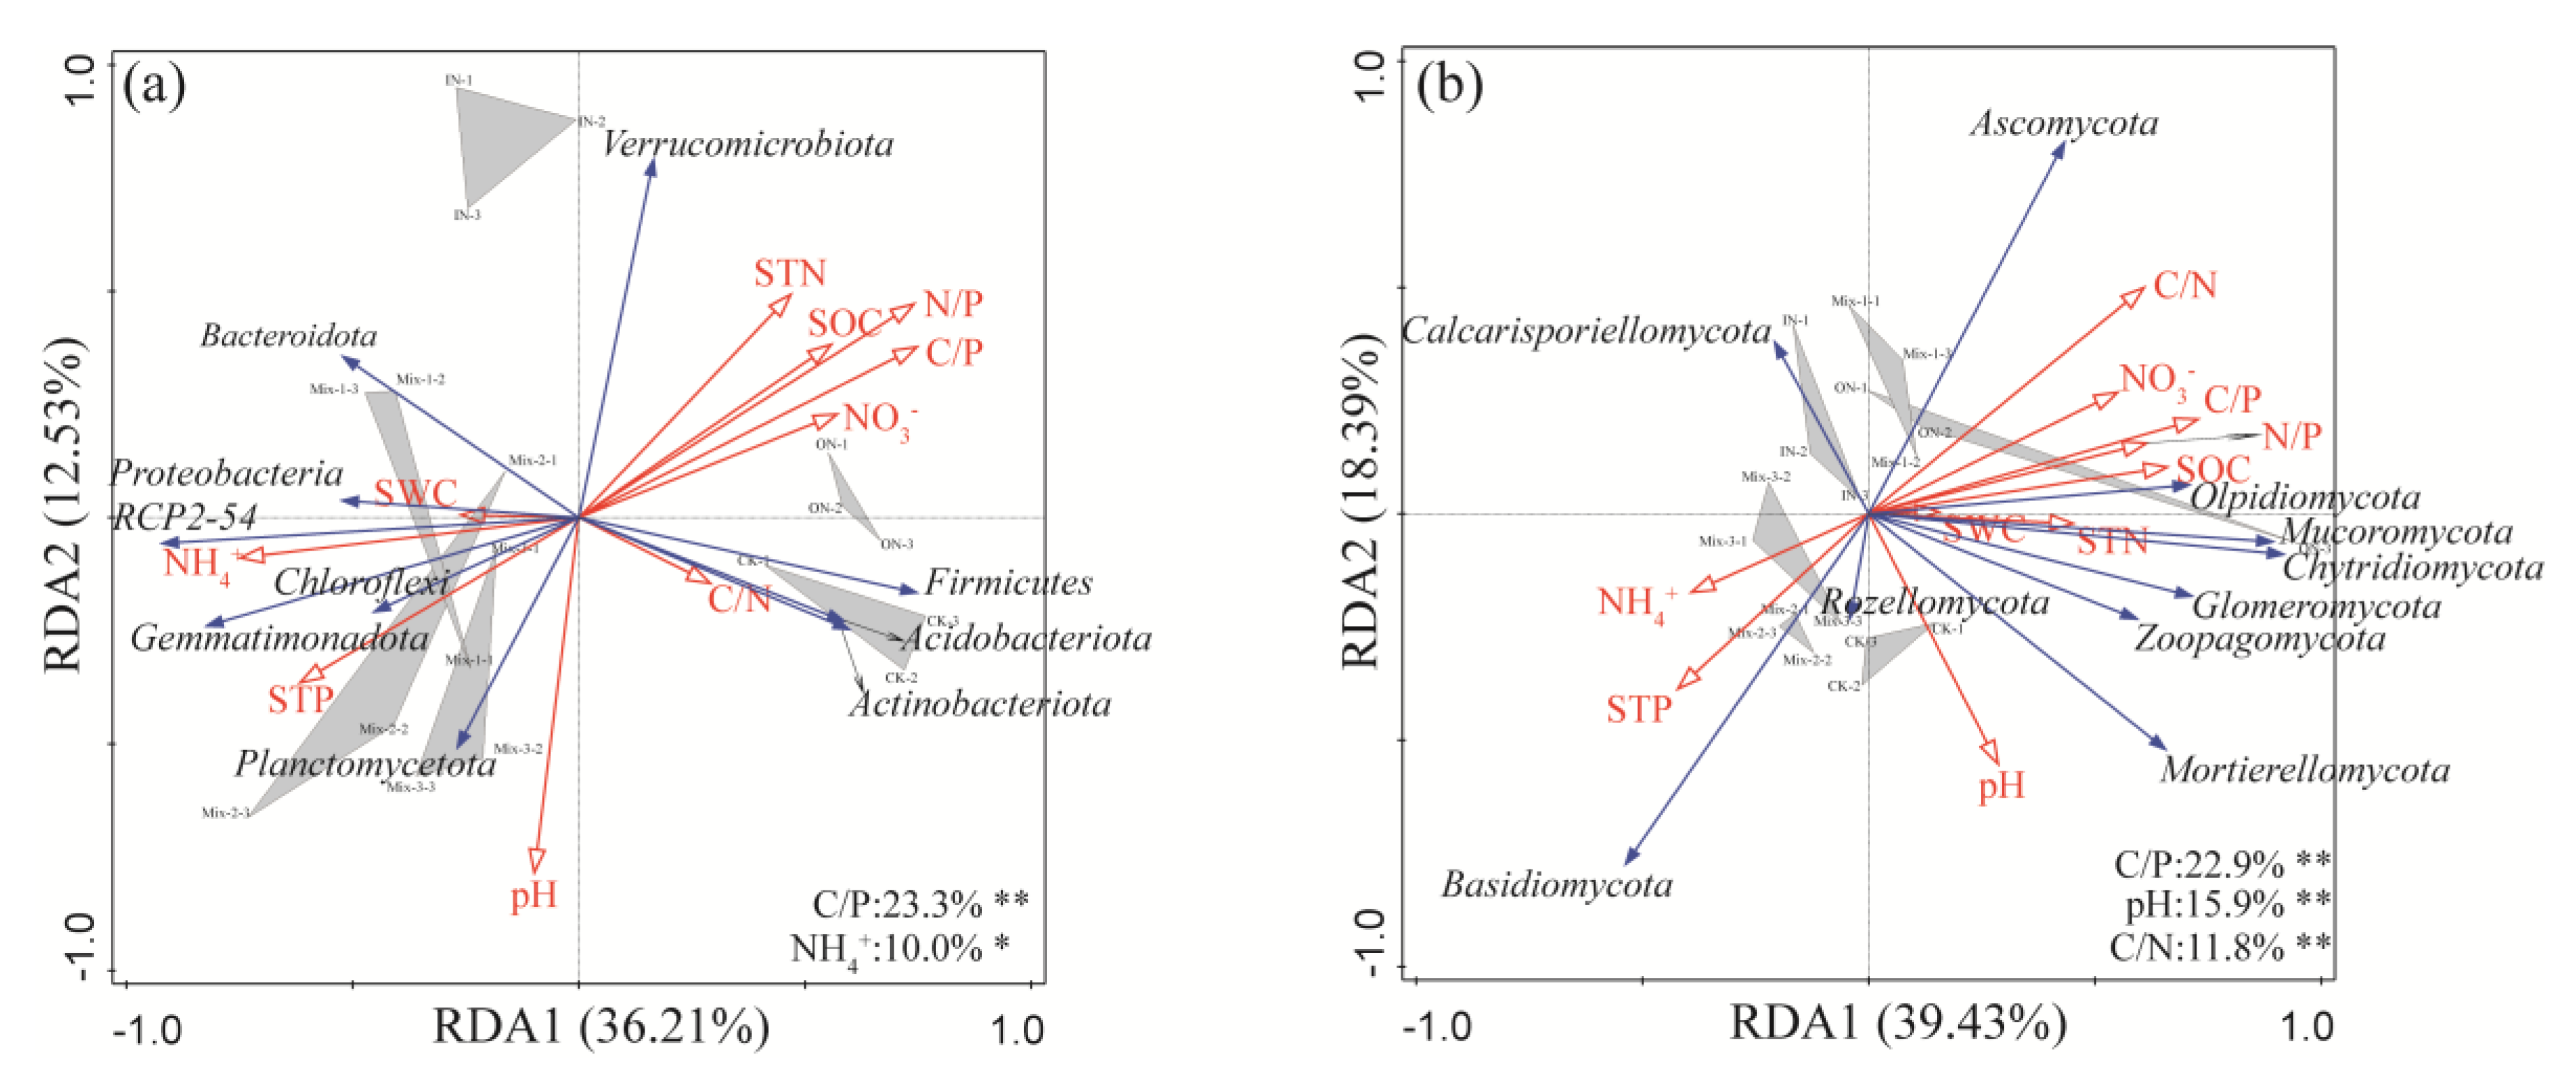
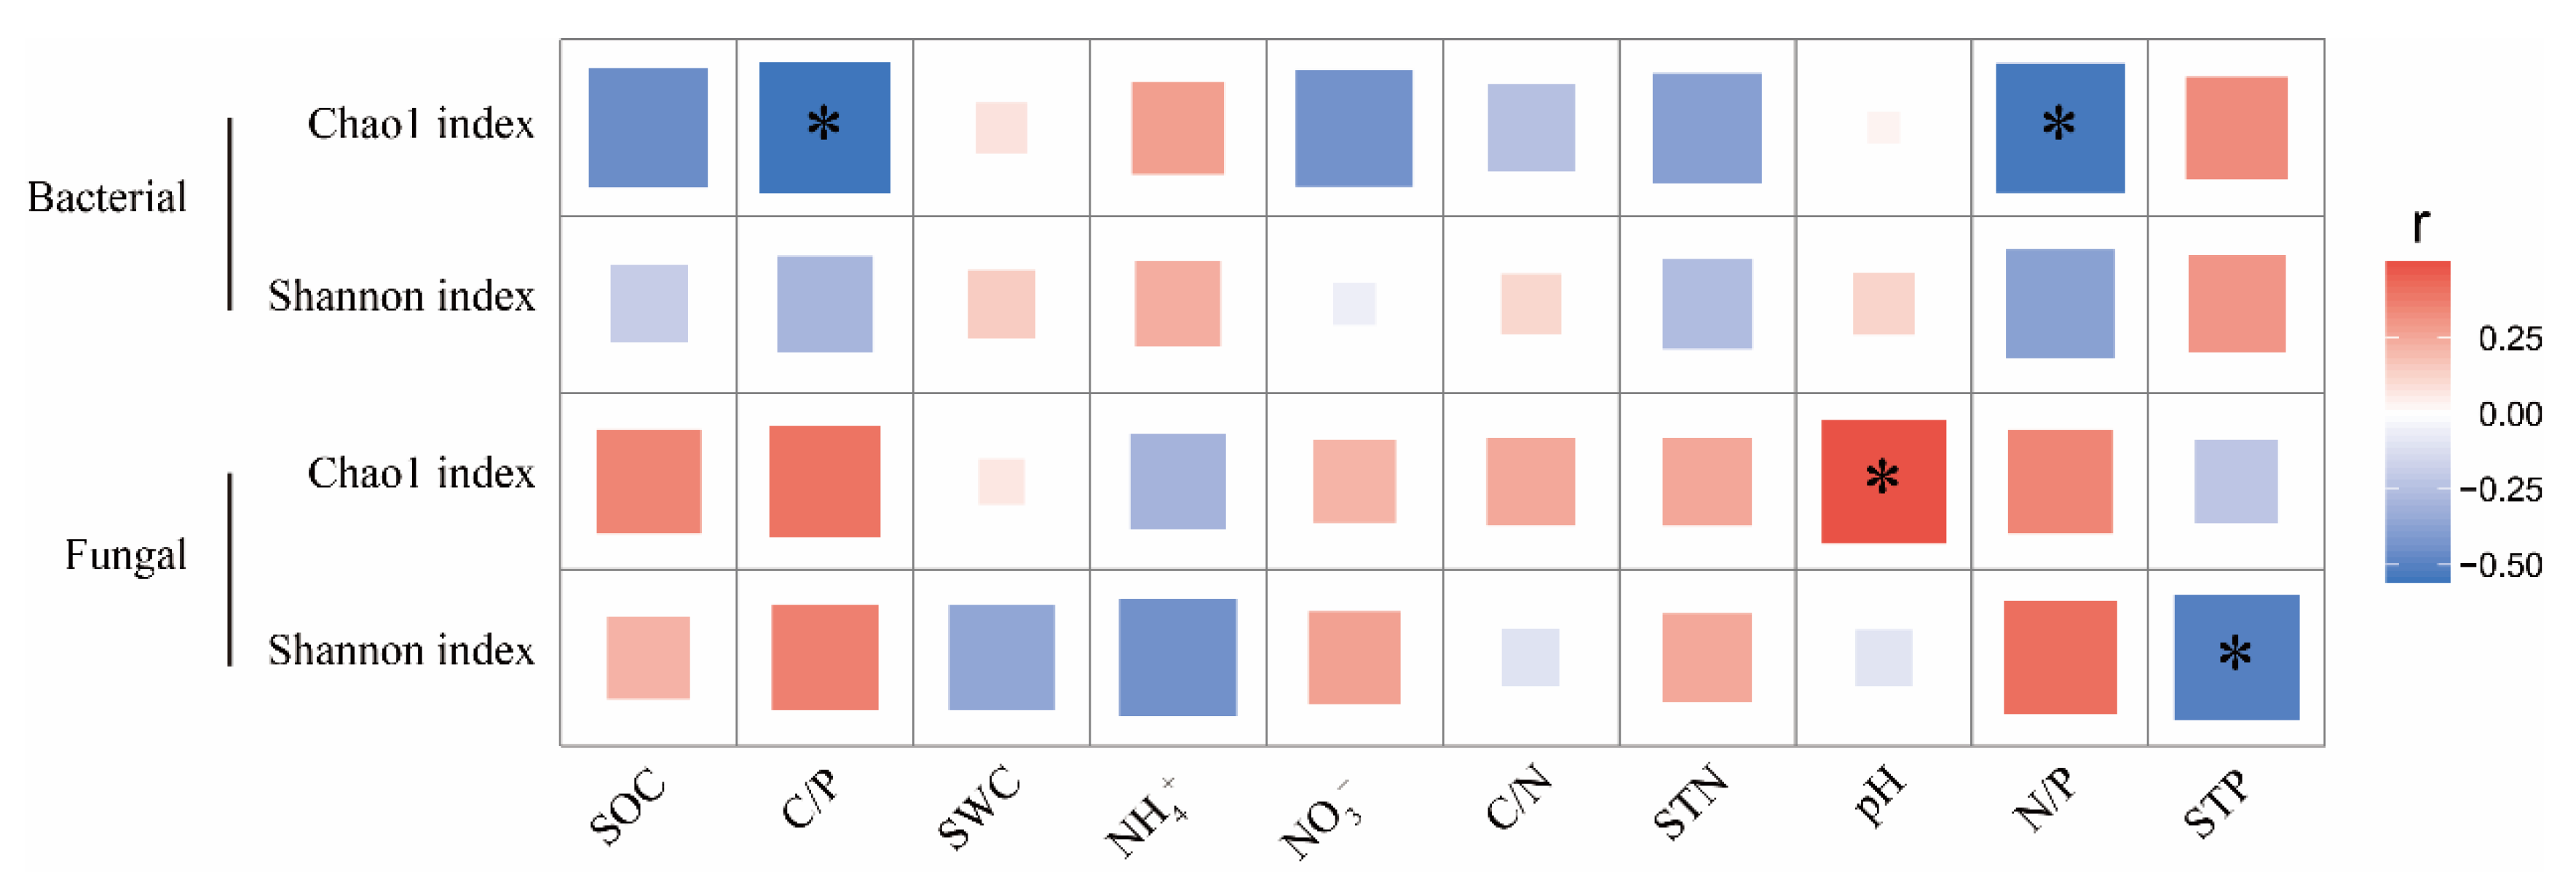
3.4. Relationship between Soil Factors and Microbial Communities

Random forest analysis revealed that SOC, STN, and N/P were main determinants of bacterial community structure. In contrast, fungal community structure was determined by STN, STP, C/P, C/N, NH4+, NO3, and pH (Figure 4). The result of RDA revealed the effects of soil parameters on the relative abundance of microbial taxa (Figure 5). For bacteria, the first two axes associated with the soil parameters together explained 48.74% of the variation in the dominant phyla. The primary variables influencing the soil bacterial community were C/P, and NH4+ (23.3%, p < 0.01; 10.0%, p < 0.05). For fungi, the first two axes associated with the soil parameters together explained 57.82% of the variation in the dominant phyla. C/P, pH, and C/N significantly affected the bacterial community (22.9%, p < 0.01; 15.9%, p < 0.01; 11.8%, p < 0.01).

4. Discussion

Consistent with our hypothesis (1), our results suggest that soil fungal and bacterial communities may change with different ON:IN ratios. Inconsistent with our hypothesis (2), our results showed that mixed N addition had a positive effect on bacterial community diversity while showing a negative effect on fungal community diversity. Our results also showed that soil parameters changed under N addition and that the changed soil parameters affected the soil microbial community. For example, as described in our hypothesis (3), soil pH is the main factor controlling the structure and composition of the bacterial community.

4.1. Effects of Different Forms of N Addition on Soil Parameters

Previous studies have shown that N addition significantly alters the physicochemical properties of forest soils [46]. In particular, soil acidification caused by N deposition is of great concern [15,21]. In this study, N addition decreased the soil pH (0.21–0.86) but the decrease was statistically significant in only the IN treatment (p < 0.05). Previous studies have reported similar results, suggesting that soil acidification mediated by IN is greater than that mediated by other N forms [21,34,47]. In addition, our study also showed that the soil pH in plots with IN added in isolation was significantly lower than that in plots with mixed N addition. Although there was no significant difference between the mixed N treatments, our data showed an increase trend for pH with a decrease in the organic N ratio. Previous studies have shown that soil pH increases after short-term urea additions but decreases after repeated IN additions [48,49]. Each urea molecule consumes one H+-ion during the conversion to NH4+, so the acidification capacity of urea is lower than that of other forms of N [50]. In addition, we also found that Mix-3 (ON:IN = 3:7) resulted in the smallest decrease in soil pH. This may be caused by the ratios of organic to inorganic N that are closer to those observed under natural conditions, where ON accounts for approximately 30% of total N deposition [30,51]. Therefore, with the increase in the N application cycle, mixed N sources can alleviate soil acidification caused by N enrichment. We found that the SOC, STN, and STP contents responded differently to the different forms of N addition (Table 1). Specifically, SOC and STN increased significantly in the ON and IN treatments but decreased in the mixed N addition plots. Previous studies have shown that mixed N fertilization promotes soil biological activity and thus increases N uptake [36]. Studies have suggested that mixed N increases the soil microbial biomass and soil enzyme activities (e.g., invertase, cellulase, and cellobiohydrolase), which promote litter decomposition [34,52]. Conversely, a single N source may inhibit the decomposition of SOM by reducing the soil pH, leading to an increase in the SOC content [15]. N and P are primary limiting elements in most terrestrial ecosystems [46,53]. N deposition alleviates N limitation while possibly increasing P limitation [54,55]. In general, a large increase in N leads to an increase in soil N/P, which may reduce the availability of soil P and aggravate P limitation [53,56]. However, our results showed that the N/P of the ON plots increased significantly, while those of the Mix-1, Mix-2 and Mix-3 plots decreased significantly. This suggests that the use of ON alone may increase soil P limitation, while the addition of mixed N sources may alleviate soil P limitation. This may be because the mixed N source increased soil microbial biomass and enhances soil microbial P fixation [16].

4.2. Effects of Different Forms of N Addition on the Alpha Diversity of Bacteria and Fungi

Our results provide some evidence that the different forms of N addition influence the diversity and richness of bacteria and fungi. The Mix-1 treatment and Mix-3 treatment significantly increased the bacterial Shannon index. In general, N addition leads to an overall decrease in forest soil bacterial alpha diversity [57,58,59]. However, the impact of N deposition on soil bacterial diversity may vary by habitat [11]. For example, N addition reduced soil bacterial diversity in N-saturated tropical forests [60], but increased soil microbial diversity in some N-deficient temperate and boreal forests [14,61]. The background value of N deposition in our study area is low compared to that globally and human activity is also low [5,62]. N deposition increased the N content of the soil and alleviated N limitation, thus stimulating the growth of bacterial communities. On the other hand, since most studies investigated only the effects of a single N source (NH4NO3, NH4Cl, or urea), differences in the effects of N addition on bacteria may be due to differences in N sources [28,63]. In contrast, our study examined different forms of N addition (ON:IN), which have rarely been considered. We observed that the Chao1 index of bacteria was significantly higher in the Mix-1-treated and Mix-3-treated plots than in the ON-treated plots. A single N source inhibits microbial activity by disrupting the original balance of ON and IN in the soil [34]. Our results showed that the bacterial Chao1 index was significantly and negatively correlated with C/P and N/P. This is consistent with the findings of previous studies that soil resource stoichiometry is an important driver of bacterial diversity and that low C/P and N/P typically promote bacterial abundance [64,65]. However, the Shannon index was not significantly correlated with the soil parameters. Therefore, we suggest that bacterial alpha diversity in this region may be responding to different forms of N addition through bacterial abundance (the Chao1 index) rather than community diversity (the Shannon index). Our results also indicate that there is no significant correlation between bacterial diversity and soil pH. However, previous studies have pointed out that a decrease in soil pH usually inhibits bacterial activity [66,67]. This may be caused by the small decrease in pH due to N addition that may not reach the threshold required to inhibit bacterial community activity. There is evidence that small changes in soil pH may have little effect on bacterial populations [68].
Here, the Mix-1, Mix-2 and Mix-3 treatments significantly reduced the Chao1 index of the fungi (Figure 2). However, there was no significant difference between a single N source (ON or IN) and the CK. A recent study showed that N addition increases fungal abundance in N-limited boreal forests [17]. Conversely, studies have also shown a significant decrease in fungal species richness due to N addition, but they have not considered the effects of changes in the ON:IN ratio [24]. In addition, Pearson’s correlation analysis showed a significant positive correlation between soil pH and the Chao1 index (Figure A1, p < 0.05). We hypothesized that changes in soil pH caused by N addition altered fungal abundance, specifically decreasing it with decreasing soil pH. Similar results have been reported in other investigations of fungal communities [11,13]. Some populations with weak acid tolerance may have become small or even disappeared as the soil pH decreased, resulting in a reduction in fungal species. Sufficient evidence may be obtained in the future as the duration of N application increases. As N increases in the soil, bacteria grow faster because they have increased access to resources [69]. Conversely, bacterial competition limits the development of fungi, which may lead to changes in communities dominated by bacterial taxa [70,71].

4.3. Effects of Different Forms of N Addition on Microbial Community Structure and Composition

The structure and species composition of soil microorganisms reflect their role in biogeochemical processes, and N input causes considerable changes in the microbial community structure [11,72]. NMDS analysis revealed that the community structure of bacteria and fungi changed significantly under different treatments, which reflected the response of soil microbial community structure to different ON:IN ratios. Previous studies have shown that soil environment dominate changes in soil microbial community structure [9,73]. Our study yielded the same results that changes in soil parameters caused by N addition affected the community structure of bacteria and fungi. We also found that the differences in fungal community structure among treatments were larger than those for bacteria. This is because fungal populations are more susceptible to changes in the soil environment caused by N addition.
We further investigated changes in the relative abundance of bacterial and fungal phyla. Proteobacteria (21.99%), Acidobacteriota (20.64%), Basidiomycota (68.74%), and Ascomycota (26.13%) were the most abundant phyla, regardless of N addition forms (Table A1). Acidobacteriota were shown to be more sensitive to changes in soil pH, and their relative abundance increased substantially as the soil pH decreased [74,75,76]. N addition has also been documented to reduce the relative abundance of Acidobacteria [77]. However, our results showed that only the Mix-1 treatment reduced the abundance of these bacteria. This may be because our study investigated different forms of N sources with the same amount of N. A slight decrease in soil pH may not affect such bacteria. Previous studies have indicated that the relative abundance of Acidobacteria may depend on nutrient effectiveness rather than pH [78]. RDA also showed that C/P and NH4+ were the main factors controlling the change in bacterial community composition (Figure 4). According to trophic strategies, Acidobacteriota are generally oligotrophic and prefer nutrient-poor environments [79]. N input usually prevents the development of oligotrophic microorganisms [80]. In contrast, Proteobacteria belong to the eutrophic microbiome, which increases in nutrient-rich environments [60]. Our results showed that Ascomycota was significantly more abundant in the ON and Mix-1 plots than in those with other treatments. Large ON inputs (e.g., urea and glycine) have been shown to increase the relative abundance of Ascomycetes and several saprophytic fungi (containing most of the Ascomycete genera) [24,81]. Therefore, the change in ON composition may be the main driving factor for the transformation of fungal community composition. Our study revealed that Basidiomycota was significantly reduced in single-N source treatments, and reached a maximum in the Mix-2 treatment. This may be because a single N source increases the abundance of Ascomycota, thereby reducing Basidiomycota’s competitiveness for resources.

5. Conclusions

The goal of this work was to investigate the effects of different forms of N addition on soil microbial communities and soil parameters in temperate forests. We found that the different effects of N addition on soil microbial communities in temperate forests may be attributed to the form of N addition. Compared with the application of a single N source, mixed N addition had a positive effect on bacterial diversity and a negative effect on fungal diversity. NMDS showed that soil microbial community structure changed significantly under different forms of N addition, and soil parameters played a dominant role. In addition, soil pH decreased with increasing IN proportion and was significantly reduced in the IN treatment. Changes in soil pH affected the composition of fungal communities but had no effect on bacteria. In summary, these results may contribute to a better understanding of the mechanisms underlying the effects of N addition on soil microbial community structure and diversity in temperate forests. Our results highlight that studies based on a single N source may underestimate the potential impact of N deposition on soil microbial communities. It is necessary to consider the importance of different components of N deposition.

Author Contributions

Conceptualization, L.G. and Z.D.; methodology, L.G.; investigation, Z.D.; H.Z. (Han Zhang), J.T., X.L. and H.Z. (Haiqiang Zhu); data curation, L.G.; writing—original draft preparation, Z.D.; writing—review and editing, L.G. and H.Z. (Haiqiang Zhu); visualization, Z.D.; funding acquisitional. L.G. and Z.D. All authors have read and agreed to the published version of the manuscript.

Funding

This research was funded by the Third Xinjiang Scientific Expedition Program (2021xjkk0903), the National Natural Science Foundation of China (31760142) and the Xinjiang Uygur Autonomous Region Graduate Research and Innovation Project (XJ2021G045).

Data Availability Statement

Not applicable.

Acknowledgments

The authors greatly acknowledge the help in soil sampling from Ruixi Li and Yuefeng Li. We appreciate the constructive comments and insightful suggestions from three anonymous reviewers that significantly improved this manuscript. We would also like to thank Novogene (Beijing, China) for analyzing high-throughput sequencing and AJE (www.aje.com, accessed on 14 December 2022) for its linguistic assistance during the preparation of this manuscript.

Conflicts of Interest

The authors declare no conflict of interest.

Appendix A

Table A1. Relative abundance of the dominant bacteria phylum and fungi phylum in different treatments. Different lowercase letters indicate significant differences between treatments (p < 0.05).
Taxonomic GroupsCKONMix-1Mix-2Mix-3INOne-Way ANOVA
BacterialProteobacteria0.209 ab0.188 b0.255 a0.234 ab0.209 ab0.224 abF = 2.094p = 0.137
Acidobacteriota0.248 a0.239 a0.174 b0.197 ab0.197 ab0.184 abF = 2.020p = 0.148
Gemmatimonadota0.116 bc0.089 c0.17 a0.186 a0.18 a0.149 abF = 6.527p = 0.004
Actinobacteriota0.14 abc0.155 a0.114 abc0.101 bc0.144 ab0.097 cF = 2.986p = 0.056
Verrucomicrobiota0.094 b0.119 b0.092 b0.082 b0.076 b0.167 aF = 4.98p = 0.011
FungalBasidiomycota0.805 b0.486 d0.424 d0.921 a0.823 b0.665 cF = 46.004p = <0.001
Ascomycota0.117 de0.458 b0.552 a0.035 e0.14 d0.267 cF = 54.469p = <0.001
Figure A1. Observed species rarefaction curves of the bacteria (a) and fungi (b) under different treatments.
Forests 14 00021 g0a1
Figure A2. Pearson correlation between alpha diversity and environmental factors. Blue indications a negative correlation, and red a positive correlation, and the strength of color reflects the strength of the correlation. Abbreviations: NO3, nitrate nitrogen; NH4+, ammonium nitrogen; STN, total nitrogen; SOC, soil organic carbon; STP, total phosphorus; SWC, soil water content. * p < 0.05.
Forests 14 00021 g0a2

References

  1. Kanakidou, M.; Myriokefalitakis, S.; Daskalakis, N.; Fanourgakis, G.; Nenes, A.; Baker, A.R.; Tsigaridis, K.; Mihalopoulos, N. Past, Present and Future Atmospheric Nitrogen Deposition. J. Atmos. Sci. 2016, 73, 2039–2047. [Google Scholar] [CrossRef] [PubMed] [Green Version]
  2. Mason, R.E.; Craine, J.M.; Lany, N.K.; Jonard, M.; Ollinger, S.V.; Groffman, P.M.; Fulweiler, R.W.; Angerer, J.; Read, Q.D.; Reich, P.B.; et al. Evidence, causes, and consequences of declining nitrogen availability in terrestrial ecosystems. Science 2022, 376, eabh3767. [Google Scholar] [CrossRef] [PubMed]
  3. Du, E.; Jiang, Y.; Fang, J.Y.; de Vries, W. Inorganic nitrogen deposition in China’s forests: Status and characteristics. Atmos. Env. 2014, 98, 474–482. [Google Scholar] [CrossRef]
  4. Bobbink, R.; Hicks, K.; Galloway, J.; Spranger, T.; Alkemade, R.; Ashmore, M.; Bustamante, M.; Cinderby, S.; Davidson, E.; Dentener, F.; et al. Global assessment of nitrogen deposition effects on terrestrial plant diversity: A synthesis. Ecol. Appl. 2010, 20, 30–59. [Google Scholar] [CrossRef] [PubMed] [Green Version]
  5. Liu, X.; Duan, L.; Mo, J.; Du, E.; Shen, J.; Lu, X.; Zhang, Y.; Zhou, X.; He, C.; Zhang, F. Nitrogen deposition and its ecological impact in China: An overview. Env. Pollut. 2011, 159, 2251–2264. [Google Scholar] [CrossRef] [PubMed]
  6. Payne, R.J.; Dise, N.B.; Field, C.D.; Dore, A.J.; Caporn, S.J.M.; Stevens, C.J. Nitrogen deposition and plant biodiversity: Past, present, and future. Front. Ecol. Env. 2017, 15, 431–436. [Google Scholar] [CrossRef]
  7. Gilliam, F.S. Responses of Forest Ecosystems to Nitrogen Deposition. Forests 2021, 12, 1190. [Google Scholar] [CrossRef]
  8. Delgado-Baquerizo, M.; Maestre, F.T.; Reich, P.B.; Jeffries, T.C.; Gaitan, J.J.; Encinar, D.; Berdugo, M.; Campbell, C.D.; Singh, B.K. Microbial diversity drives multifunctionality in terrestrial ecosystems. Nat. Commun. 2016, 7, 10541. [Google Scholar] [CrossRef] [Green Version]
  9. Zhou, Z.H.; Wang, C.K.; Zheng, M.H.; Jiang, L.F.; Luo, Y.Q. Patterns and mechanisms of responses by soil microbial communities to nitrogen addition. Soil Biol. Biochem. 2017, 115, 433–441. [Google Scholar] [CrossRef]
  10. Waldrop, M.P.; Zak, D.R.; Sinsabaugh, R.L. Microbial community response to nitrogen deposition in northern forest ecosystems. Soil Biol. Biochem. 2004, 36, 1443–1451. [Google Scholar] [CrossRef]
  11. Zhang, T.; Chen, H.Y.H.; Ruan, H. Global negative effects of nitrogen deposition on soil microbes. ISME J. 2018, 12, 1817–1825. [Google Scholar] [CrossRef] [PubMed] [Green Version]
  12. Liu, Y.; Tan, X.; Fu, S.; Shen, W. Canopy and Understory Nitrogen Addition Alters Organic Soil Bacterial Communities but Not Fungal Communities in a Temperate Forest. Front. Microbiol. 2022, 13, 888121. [Google Scholar] [CrossRef] [PubMed]
  13. Moore, J.A.M.; Anthony, M.A.; Pec, G.J.; Trocha, L.K.; Trzebny, A.; Geyer, K.M.; van Diepen, L.T.A.; Frey, S.D. Fungal community structure and function shifts with atmospheric nitrogen deposition. Glob. Chang. Biol. 2021, 27, 1349–1364. [Google Scholar] [CrossRef] [PubMed]
  14. Zechmeister-Boltenstern, S.; Michel, K.; Pfeffer, M. Soil microbial community structure in European forests in relation to forest type and atmospheric nitrogen deposition. Plant Soil 2010, 343, 37–50. [Google Scholar] [CrossRef]
  15. Lu, X.; Mao, Q.; Gilliam, F.S.; Luo, Y.; Mo, J. Nitrogen deposition contributes to soil acidification in tropical ecosystems. Glob. Chang. Biol. 2014, 20, 3790–3801. [Google Scholar] [CrossRef] [PubMed] [Green Version]
  16. Wei, K.; Sun, T.; Tian, J.H.; Chen, Z.H.; Chen, L.J. Soil microbial biomass, phosphatase and their relationships with phosphorus turnover under mixed inorganic and organic nitrogen addition in a Larix gmelinii plantation. For. Ecol. Manag. 2018, 422, 313–322. [Google Scholar] [CrossRef]
  17. Yan, Y.; Sun, X.; Sun, F.; Zhao, Y.; Sun, W.; Guo, J.; Zhang, T. Sensitivity of soil fungal and bacterial community compositions to nitrogen and phosphorus additions in a temperate meadow. Plant Soil 2021, 471, 477–490. [Google Scholar] [CrossRef]
  18. Allison, S.D.; Czimczik, C.I.; Treseder, K.K. Microbial activity and soil respiration under nitrogen addition in Alaskan boreal forest. Glob. Chang. Biol. 2008, 14, 1156–1168. [Google Scholar] [CrossRef] [Green Version]
  19. Lilleskov, E.A.; Kuyper, T.W.; Bidartondo, M.I.; Hobbie, E.A. Atmospheric nitrogen deposition impacts on the structure and function of forest mycorrhizal communities: A review. Env. Pollut. 2019, 246, 148–162. [Google Scholar] [CrossRef]
  20. Li, J.; Sang, C.P.; Yang, J.Y.; Qu, L.R.; Xia, Z.W.; Sun, H.; Jiang, P.; Wang, X.G.; He, H.B.; Wang, C. Stoichiometric imbalance and microbial community regulate microbial elements use efficiencies under nitrogen addition. Soil Biol. Biochem. 2021, 156, 108207. [Google Scholar] [CrossRef]
  21. Tian, D.S.; Niu, S.L. A global analysis of soil acidification caused by nitrogen addition. Env. Res. Lett. 2015, 10, 024019. [Google Scholar] [CrossRef]
  22. Zhang, X.M.; Liu, W.; Zhang, G.M.; Jiang, L.; Han, X.G. Mechanisms of soil acidification reducing bacterial diversity. Soil Biol. Biochem. 2015, 81, 275–281. [Google Scholar] [CrossRef]
  23. Chen, D.M.; Lan, Z.C.; Bai, X.; Grace, J.B.; Bai, Y.F. Evidence that acidification-induced declines in plant diversity and productivity are mediated by changes in below-ground communities and soil properties in a semi-arid steppe. J. Ecol. 2013, 101, 1322–1334. [Google Scholar] [CrossRef]
  24. Cline, L.C.; Huggins, J.A.; Hobbie, S.E.; Kennedy, P.G. Organic nitrogen addition suppresses fungal richness and alters community composition in temperate forest soils. Soil Biol. Biochem. 2018, 125, 222–230. [Google Scholar] [CrossRef]
  25. Lim, H.; Jamtgard, S.; Oren, R.; Gruffman, L.; Kunz, S.; Nasholm, T. Organic nitrogen enhances nitrogen nutrition and early growth of Pinus sylvestris seedlings. Tree Physiol. 2022, 42, 513–522. [Google Scholar] [CrossRef] [PubMed]
  26. Tian, J.; Wei, K.; Sun, T.; Jiang, N.; Chen, Z.; Feng, J.; Cai, K.; Chen, L. Different forms of nitrogen deposition show variable effects on soil organic nitrogen turnover in a temperate forest. Appl. Soil Ecol. 2022, 169, 104212. [Google Scholar] [CrossRef]
  27. Zhang, C.; Zhang, X.Y.; Zou, H.T.; Kou, L.; Yang, Y.; Wen, X.F.; Li, S.G.; Wang, H.M.; Sun, X.M. Contrasting effects of ammonium and nitrate additions on the biomass of soil microbial communities and enzyme activities in subtropical China. Biogeosciences 2017, 14, 4815–4827. [Google Scholar] [CrossRef] [Green Version]
  28. Qu, W.D.; Han, G.X.; Eller, F.; Xie, B.H.; Wang, J.; Wu, H.T.; Li, J.Y.; Zhao, M.L. Nitrogen input in different chemical forms and levels stimulates soil organic carbon decomposition in a coastal wetland. Catena 2020, 194, 104672. [Google Scholar] [CrossRef]
  29. Koulympoudi, L.; Papafilippou, A.; Tzanoudaki, M.; Chatzissavvidis, C.; Salamalikis, V. Effect of nitrogen form on trifoliate orange (Poncirus trifoliata (L.) Raf.) and sour orange (Citrus aurantium L.) plants grown under saline conditions. J. Plant Nutr. 2021, 44, 2546–2558. [Google Scholar] [CrossRef]
  30. Cornell, S.E. Atmospheric nitrogen deposition: Revisiting the question of the importance of the organic component. Env. Pollut. 2011, 159, 2214–2222. [Google Scholar] [CrossRef]
  31. Zhang, Y.; Song, L.; Liu, X.J.; Li, W.Q.; Lü, S.H.; Zheng, L.X.; Bai, Z.C.; Cai, G.Y.; Zhang, F.S. Atmospheric organic nitrogen deposition in China. Atmos. Env. 2012, 46, 195–204. [Google Scholar] [CrossRef]
  32. Moran-Zuloaga, D.; Dippold, M.; Glaser, B.; Kuzyakov, Y. Organic nitrogen uptake by plants: Reevaluation by position-specific labeling of amino acids. Biogeochemistry 2015, 125, 359–374. [Google Scholar] [CrossRef]
  33. Geisseler, D.; Horwath, W.R.; Joergensen, R.G.; Ludwig, B. Pathways of nitrogen utilization by soil microorganisms—A review. Soil Biol. Biochem. 2010, 42, 2058–2067. [Google Scholar] [CrossRef]
  34. Guo, P.; Wang, C.Y.; Jia, Y.; Wang, Q.A.; Han, G.M.; Tian, X.J. Responses of soil microbial biomass and enzymatic activities to fertilizations of mixed inorganic and organic nitrogen at a subtropical forest in East China. Plant Soil 2011, 338, 355–366. [Google Scholar] [CrossRef]
  35. Dong, L.L.; Berg, B.; Sun, T.; Wang, Z.W.; Han, X.G. Response of fine root decomposition to different forms of N deposition in a temperate grassland. Soil Biol. Biochem. 2020, 147, 107845. [Google Scholar] [CrossRef]
  36. Du, Y.; Guo, P.; Liu, J.; Wang, C.; Yang, N.; Jiao, Z. Different types of nitrogen deposition show variable effects on the soil carbon cycle process of temperate forests. Glob. Chang. Biol. 2014, 20, 3222–3228. [Google Scholar] [CrossRef]
  37. Zhu, H.; Gong, L.; Luo, Y.; Tang, J.; Ding, Z.; Li, X. Effects of Litter and Root Manipulations on Soil Bacterial and Fungal Community Structure and Function in a Schrenk’s Spruce (Picea schrenkiana) Forest. Front. Plant Sci. 2022, 13, 849483. [Google Scholar] [CrossRef]
  38. Zhao, J.J.; Gong, L. Response of Fine Root Carbohydrate Content to Soil Nitrogen Addition and Its Relationship with Soil Factors in a Schrenk (Picea schrenkiana) Forest. J. Plant Growth Regul. 2021, 40, 1210–1221. [Google Scholar] [CrossRef]
  39. Group, C. China Soil System Classification (Amendment Scheme); Agricultural Science and Technology Press of China: Beijing, China, 1995. [Google Scholar]
  40. Bao, S. Soil Agrochemical Analysis; China Agricultural Press: Beijing, China, 2000; p. 30. (In Chinese) [Google Scholar]
  41. Zhu, H.; Gong, L.; Ding, Z.; Li, Y. Effects of litter and root manipulations on soil carbon and nitrogen in a Schrenk’s spruce (Picea schrenkiana) forest. PLoS ONE 2021, 16, e0247725. [Google Scholar] [CrossRef]
  42. Magoc, T.; Salzberg, S.L. FLASH: Fast length adjustment of short reads to improve genome assemblies. Bioinformatics 2011, 27, 2957–2963. [Google Scholar] [CrossRef] [Green Version]
  43. Haas, B.J.; Gevers, D.; Earl, A.M.; Feldgarden, M.; Ward, D.V.; Giannoukos, G.; Ciulla, D.; Tabbaa, D.; Highlander, S.K.; Sodergren, E.; et al. Chimeric 16S rRNA sequence formation and detection in Sanger and 454-pyrosequenced PCR amplicons. Genome Res. 2011, 21, 494–504. [Google Scholar] [CrossRef] [PubMed] [Green Version]
  44. Team, R.C. R: A Language and Environment for Statistical Computing. R Foundation for Statistical Computing: Vienna, Austria. Available online: https://www.R-project.org/ (accessed on 20 September 2022).
  45. Yang, X.D.; Anwar, E.; Zhou, J.; He, D.; Gao, Y.C.; Lv, G.H.; Cao, Y.E. Higher association and integration among functional traits in small tree than shrub in resisting drought stress in an arid desert. Env. Exp. Bot. 2022, 201, 104993. [Google Scholar] [CrossRef]
  46. Zhang, Y.; Guo, Y.; Tang, Z.; Feng, Y.; Zhu, X.; Xu, W.; Bai, Y.; Zhou, G.; Xie, Z.; Fang, J. Patterns of nitrogen and phosphorus pools in terrestrial ecosystems in China. Earth Syst. Sci. Data 2021, 13, 5337–5351. [Google Scholar] [CrossRef]
  47. Wang, C.Y.; Zhou, J.W.; Liu, J.; Jiang, K.; Du, D.L. Responses of soil N-fixing bacteria communities to Amaranthus retroflexus invasion under different forms of N deposition. Agr. Ecosyst. Env. 2017, 247, 329–336. [Google Scholar] [CrossRef]
  48. Barak, P.; Jobe, B.O.; Krueger, A.R.; Peterson, L.A.; Laird, D.A. Effects of long-term soil acidification due to nitrogen fertilizer inputs in Wisconsin. Plant Soil 1997, 197, 61–69. [Google Scholar] [CrossRef]
  49. Martikainen, P.J.; Aarnio, T.; Taavitsainen, V.-M.; Päivinen, L.; Salonen, K. Mineralization of carbon and nitrogen in soil samples taken from three fertilized pine stands: Long-term effects. Plant Soil 1989, 114, 99–106. [Google Scholar] [CrossRef]
  50. Bai, T.S.; Wang, P.; Ye, C.L.; Hu, S.J. Form of nitrogen input dominates N effects on root growth and soil aggregation: A meta-analysis. Soil Biol. Biochem. 2021, 157, 108251. [Google Scholar] [CrossRef]
  51. Song, L.; Kuang, F.; Skiba, U.; Zhu, B.; Liu, X.; Levy, P.; Dore, A.; Fowler, D. Bulk deposition of organic and inorganic nitrogen in southwest China from 2008 to 2013. Env. Pollut. 2017, 227, 157–166. [Google Scholar] [CrossRef]
  52. Dong, L.L.; Sun, T.; Berg, B.; Zhang, L.L.; Zhang, Q.Q.; Wang, Z.W. Effects of different forms of N deposition on leaf litter decomposition and extracellular enzyme activities in a temperate grassland. Soil Biol. Biochem. 2019, 134, 78–80. [Google Scholar] [CrossRef]
  53. Du, E.Z.; Terrer, C.; Pellegrini, A.F.A.; Ahlstrom, A.; van Lissa, C.J.; Zhao, X.; Xia, N.; Wu, X.H.; Jackson, R.B. Global patterns of terrestrial nitrogen and phosphorus limitation. Nat. Geosci. 2020, 13, 221. [Google Scholar] [CrossRef]
  54. Liu, G.C.; Yan, G.Y.; Huang, B.B.; Sun, X.Y.; Xing, Y.J.; Wang, Q.G. Long-term nitrogen addition alters nutrient foraging strategies of Populus davidiana and Betula platyphylla in a temperate natural secondary forest. Eur. J. For. Res. 2022, 141, 307–320. [Google Scholar] [CrossRef]
  55. Vitousek, P.M.; Porder, S.; Houlton, B.Z.; Chadwick, O.A. Terrestrial phosphorus limitation: Mechanisms, implications, and nitrogen-phosphorus interactions. Ecol. Appl. 2010, 20, 5–15. [Google Scholar] [CrossRef] [PubMed] [Green Version]
  56. Peñuelas, J.; Poulter, B.; Sardans, J.; Ciais, P.; van der Velde, M.; Bopp, L.; Boucher, O.; Godderis, Y.; Hinsinger, P.; Llusia, J.; et al. Human-induced nitrogen–phosphorus imbalances alter natural and managed ecosystems across the globe. Nat. Commun. 2013, 4, 2934. [Google Scholar] [CrossRef] [PubMed] [Green Version]
  57. Huang, T.; Liu, W.; Long, X.E.; Jia, Y.; Wang, X.; Chen, Y. Different Responses of Soil Bacterial Communities to Nitrogen Addition in Moss Crust. Front. Microbiol. 2021, 12, 665975. [Google Scholar] [CrossRef] [PubMed]
  58. Nie, Y.; Wang, M.; Zhang, W.; Ni, Z.; Hashidoko, Y.; Shen, W. Ammonium nitrogen content is a dominant predictor of bacterial community composition in an acidic forest soil with exogenous nitrogen enrichment. Sci. Total Env. 2018, 624, 407–415. [Google Scholar] [CrossRef]
  59. Wang, J.; Shi, X.; Zheng, C.; Suter, H.; Huang, Z. Different responses of soil bacterial and fungal communities to nitrogen deposition in a subtropical forest. Sci. Total Env. 2021, 755, 142449. [Google Scholar] [CrossRef]
  60. Wang, Z.H.; Wang, Z.R.; Li, T.P.; Wang, C.; Dang, N.; Wang, R.Z.; Jiang, Y.; Wang, H.Y.; Li, H. N and P fertilization enhanced carbon decomposition function by shifting microbes towards an r-selected community in meadow grassland soils. Ecol. Indic. 2021, 132, 108306. [Google Scholar] [CrossRef]
  61. Turlapati, S.A.; Minocha, R.; Bhiravarasa, P.S.; Tisa, L.S.; Thomas, W.K.; Minocha, S.C. Chronic N-amended soils exhibit an altered bacterial community structure in Harvard Forest, MA, USA. FEMS Microbiol. Ecol. 2013, 83, 478–493. [Google Scholar] [CrossRef] [Green Version]
  62. Schwede, D.B.; Simpson, D.; Tan, J.; Fu, J.S.; Dentener, F.; Du, E.; deVries, W. Spatial variation of modelled total, dry and wet nitrogen deposition to forests at global scale. Env. Pollut. 2018, 243, 1287–1301. [Google Scholar] [CrossRef]
  63. Yang, Y.; Cheng, H.; Gao, H.; An, S.S. Response and driving factors of soil microbial diversity related to global nitrogen addition. Land Degrad. Dev. 2020, 31, 190–204. [Google Scholar] [CrossRef]
  64. Delgado-Baquerizo, M.; Reich, P.B.; Khachane, A.N.; Campbell, C.D.; Thomas, N.; Freitag, T.E.; Abu Al-Soud, W.; Sorensen, S.; Bardgett, R.D.; Singh, B.K. It is elemental: Soil nutrient stoichiometry drives bacterial diversity. Env. Microbiol. 2017, 19, 1176–1188. [Google Scholar] [CrossRef] [PubMed] [Green Version]
  65. Liu, Z.F.; Fu, B.J.; Zheng, X.X.; Liu, G.H. Plant biomass, soil water content and soil N:P ratio regulating soil microbial functional diversity in a temperate steppe: A regional scale study. Soil Biol. Biochem. 2010, 42, 445–450. [Google Scholar] [CrossRef]
  66. Lammel, D.R.; Barth, G.; Ovaskainen, O.; Cruz, L.M.; Zanatta, J.A.; Ryo, M.; de Souza, E.M.; Pedrosa, F.O. Direct and indirect effects of a pH gradient bring insights into the mechanisms driving prokaryotic community structures. Microbiome 2018, 6, 106. [Google Scholar] [CrossRef] [PubMed] [Green Version]
  67. Rousk, J.; Brookes, P.C.; Baath, E. Investigating the mechanisms for the opposing pH relationships of fungal and bacterial growth in soil. Soil Biol. Biochem. 2010, 42, 926–934. [Google Scholar] [CrossRef]
  68. Leff, J.W.; Jones, S.E.; Prober, S.M.; Barberan, A.; Borer, E.T.; Firn, J.L.; Harpole, W.S.; Hobbie, S.E.; Hofmockel, K.S.; Knops, J.M.; et al. Consistent responses of soil microbial communities to elevated nutrient inputs in grasslands across the globe. Proc. Natl. Acad. Sci. USA 2015, 112, 10967–10972. [Google Scholar] [CrossRef] [Green Version]
  69. Dai, Z.; Su, W.; Chen, H.; Barberan, A.; Zhao, H.; Yu, M.; Yu, L.; Brookes, P.C.; Schadt, C.W.; Chang, S.X.; et al. Long-term nitrogen fertilization decreases bacterial diversity and favors the growth of Actinobacteria and Proteobacteria in agro-ecosystems across the globe. Glob. Chang. Biol. 2018, 24, 3452–3461. [Google Scholar] [CrossRef]
  70. Krumins, J.A.; Dighton, J.; Gray, D.; Franklin, R.B.; Morin, P.J.; Roberts, M.S. Soil microbial community response to nitrogen enrichment in two scrub oak forests. For. Ecol. Manag. 2009, 258, 1383–1390. [Google Scholar] [CrossRef]
  71. Rousk, J.; Bååth, E.; Brookes, P.C.; Lauber, C.L.; Lozupone, C.; Caporaso, J.G.; Knight, R.; Fierer, N. Soil bacterial and fungal communities across a pH gradient in an arable soil. ISME J. 2010, 4, 1340–1351. [Google Scholar] [CrossRef]
  72. Bahram, M.; Hildebrand, F.; Forslund, S.K.; Anderson, J.L.; Soudzilovskaia, N.A.; Bodegom, P.M.; Bengtsson-Palme, J.; Anslan, S.; Coelho, L.P.; Harend, H.; et al. Structure and function of the global topsoil microbiome. Nature 2018, 560, 233–237. [Google Scholar] [CrossRef] [Green Version]
  73. Cui, J.; Zhu, R.; Wang, X.; Xu, X.; Ai, C.; He, P.; Liang, G.; Zhou, W.; Zhu, P. Effect of high soil C/N ratio and nitrogen limitation caused by the long-term combined organic-inorganic fertilization on the soil microbial community structure and its dominated SOC decomposition. J. Environ. Manag. 2022, 303, 114155. [Google Scholar] [CrossRef]
  74. Dimitriu, P.A.; Grayston, S.J. Relationship between soil properties and patterns of bacterial beta-diversity across reclaimed and natural boreal forest soils. Microb. Ecol. 2010, 59, 563–573. [Google Scholar] [CrossRef] [PubMed]
  75. Jones, R.T.; Robeson, M.S.; Lauber, C.L.; Hamady, M.; Knight, R.; Fierer, N. A comprehensive survey of soil acidobacterial diversity using pyrosequencing and clone library analyses. ISME J. 2009, 3, 442–453. [Google Scholar] [CrossRef] [PubMed] [Green Version]
  76. Shen, C.C.; Xiong, J.B.; Zhang, H.Y.; Feng, Y.Z.; Lin, X.G.; Li, X.Y.; Liang, W.J.; Chu, H.Y. Soil pH drives the spatial distribution of bacterial communities along elevation on Changbai Mountain. Soil Biol. Biochem. 2013, 57, 204–211. [Google Scholar] [CrossRef]
  77. Wang, C.; Liu, D.W.; Bai, E. Decreasing soil microbial diversity is associated with decreasing microbial biomass under nitrogen addition. Soil Biol. Biochem. 2018, 120, 126–133. [Google Scholar] [CrossRef]
  78. Ramirez, K.S.; Lauber, C.L.; Knight, R.; Bradford, M.A.; Fierer, N. Consistent effects of nitrogen fertilization on soil bacterial communities in contrasting systems. Ecology 2010, 91, 3463–3470; discussion 3503–3414. [Google Scholar] [CrossRef] [PubMed]
  79. Fierer, N.; Jackson, R.B. The diversity and biogeography of soil bacterial communities. Proc. Natl. Acad. Sci. USA 2006, 103, 626–631. [Google Scholar] [CrossRef] [Green Version]
  80. Wang, C.; Lu, X.K.; Mori, T.; Mao, Q.G.; Zhou, K.J.; Zhou, G.Y.; Nie, Y.X.; Mo, J.M. Responses of soil microbial community to continuous experimental nitrogen additions for 13 years in a nitrogen-rich tropical forest. Soil Biol. Biochem. 2018, 121, 103–112. [Google Scholar] [CrossRef]
  81. Zhou, J.; Jiang, X.; Zhou, B.K.; Zhao, B.S.; Ma, M.C.; Guan, D.W.; Li, J.; Chen, S.F.; Cao, F.M.; Shen, D.L.; et al. Thirty four years of nitrogen fertilization decreases fungal diversity and alters fungal community composition in black soil in northeast China. Soil Biol. Biochem. 2016, 95, 135–143. [Google Scholar] [CrossRef]
Figure 1. The alpha diversity of bacteria (a,c) and fungi (b,d) in different treatments. * p < 0.05 and ** p < 0.01.
Forests 14 00021 g001
Figure 2. The relative abundance of bacteria (a) and fungi (b) at the phylum level based on the results of clustering analysis.
Forests 14 00021 g002
Figure 3. Nonmetric multidimensional scaling (NMDS) ordination plot based on the Bray–Curtis distance of samples for the bacterial (a) and fungal communities (b) in all treatments.
Forests 14 00021 g003
Figure 4. Environmental predictors of the NMDS1 and NMDS2 of bacteria (a,b) and fungi (c,d) based on random forest analysis. Only predictors with significant effects are shown in the figures. Abbreviations: NO3, nitrate nitrogen; NH4+, ammonium nitrogen; STN, total nitrogen; SOC, soil organic carbon; STP, total phosphorus; SWC, soil water content. * p < 0.05 and ** p < 0.01.
Forests 14 00021 g004
Figure 5. Redundancy analysis (RDA) of soil properties and dominant bacterial phyla (a) and dominant fungal phyla (b). Abbreviations: NO3, nitrate nitrogen; NH4+, ammonium nitrogen; STN, total nitrogen; SOC, soil organic carbon; STP, total phosphorus; SWC, soil water content. Mean ± standard error, n = 3. * p < 0.05 and ** p < 0.01.
Forests 14 00021 g005
Table 1. Soil properties in different treatments. Abbreviations: NO3, nitrate nitrogen; NH4+, ammonium nitrogen; STN, total nitrogen; SOC, soil organic carbon; STP, total phosphorus; SWC, soil water content. Mean ± standard error, n = 3. Different lowercase letters indicate significant differences between treatments (p < 0.05).
TreatmentCKONMix-1Mix-2Mix-3INOne-Way ANOVA
Fp
SOC (g kg−1)126.80 (2.2)c194.90 (23.96)a101.98 (3.48)cd117.16 (3.37)cd91.04 (4.68)d158.59 (16.81)b19.82<0.001
STN (g kg−1)9.20 (0.24)b11.86 (1.04)a6.64 (0.66)cd8.51 (0.41)bc6.49 (0.42)d11.86 (1.62)a15.01<0.001
STP (g kg−1)0.98 (0.03)d0.96 (0.02)d1.18 (0.1)bc2.26 (0.07)a1.32 (0.09)b1.14 (0.08)c92.16<0.001
C/N13.79 (0.31)b16.39 (0.67)a15.48 (1.19)a13.78 (0.35)b14.04 (0.48)b13.44 (0.47)b6.450.004
C/P129.62 (5.49)b204.03 (29.31)a86.91 (8.49)c51.76 (0.84)d69.23 (6.91)cd138.54 (5.46)b35.91<0.001
N/P9.41 (0.54)b12.40 (1.31)a5.69 (0.94)c3.76 (0.15)d4.93 (0.45)cd10.34 (0.75)b38.40<0.001
pH7.81 (0.04)a7.29 (0.06)a7.35 (0.16)a7.51 (0.21)a7.60 (0.06)a6.95 (0.15)b4.050.022
NO3 (mg kg−1)8.55 (0.85)c55.39 (9.43)a2.70 (0.96)c1.53 (0.77)c11.09 (2.21)bc20.82 (4.93)b40.65<0.001
NH4+ (mg kg−1)9.88 (0.85)d10.50 (2.95)d29.18 (4.42)bc67.44 (15.23)a20.55 (3.22)cd35.40 (1.64)b20.13<0.001
SWC (%)43.55 (1.9)bc53.75 (7.21)ab55.58 (12.17)ab63.32 (8.39)a35.42 (1.32)c49.12 (8.84)abc3.240.440
Disclaimer/Publisher’s Note: The statements, opinions and data contained in all publications are solely those of the individual author(s) and contributor(s) and not of MDPI and/or the editor(s). MDPI and/or the editor(s) disclaim responsibility for any injury to people or property resulting from any ideas, methods, instructions or products referred to in the content.

