
α Diversity of Desert Shrub Communities and Its Relationship with Climatic Factors in Xinjiang


1
College of Ecology and Environment, Xinjiang University, Urumqi 830017, China
2
Bayinbuluk Grassland Ecosystem Research Station, Xinjiang Institute of Ecology and Geography, Chinese Academy of Sciences, Bayingolin Mongolian Autonomous Prefecture 841314, China
3
CAS Research Center for Ecology and Environment of Central Asia, Urumqi 830011, China
*
Author to whom correspondence should be addressed.
Forests 2023, 14(2), 178; https://0-doi-org.brum.beds.ac.uk/10.3390/f14020178
Submission received: 22 November 2022
/
Revised: 14 January 2023
/
Accepted: 17 January 2023
/
Published: 18 January 2023
(This article belongs to the Special Issue Plant Adaptation to Extreme Environments in Drylands)
Abstract
:In the past 30 years, Northwest China has experienced a warm and humid climate increase trend. How this climate change will affect the species diversity of plant communities is a hot issue in ecological research. In this study, four α diversity indexes were applied in 29 shrub communities at desert sites in Xinjiang, including the Margalef index, Simpson index, Shannon–Wiener index, and Pielou index, to explore the relationship between the α diversity of the desert shrub communities and climate factors (mean annual temperature (MAT) and mean annual precipitation (MAP)). The species diversity indexes varied across these different desert shrub communities. Tamarix ramosissima communities had the highest Margalef index, while the Krascheninnikovia ewersmannia communities had the lowest Margalef index; T. ramosissima communities also showed the highest Simpson index and Shannon–Wiener index, but Alhagi sparsifolia communities showed the lowest Simpson index and Shannon–Wiener index. The Ephedra przewalskii communities and Karelinia caspica communities showed the highest and the lowest Pielou index, respectively. The α diversity indexes (except the Pielou index) of desert shrub communities had a significantly positive correlation with MAP (p < 0.05) but a non-significantly correlation with MAT (p > 0.05). These results indicate that, compared with temperature, water conditions are still a more vital climatic factor affecting the species diversity of desert shrub communities in Xinjiang, and thus, the recent “warm and humid” climate trend in Xinjiang affects the α diversity of desert shrub communities.
1. Introduction
As the basis of ecosystem biodiversity, plant diversity plays an important role in maintaining ecosystem versatility, productivity, stability, and anti-interference ability [1,2]. Climate change has a significant impact on the water and heat dynamics of ecosystems, resulting in significant changes in the species composition and community structure of ecosystems [3]. Some research has found that climate change restricts the growth and distribution of plants, drives changes in plant diversity, affects interspecific relationships and community productivity, and seriously threatens the biodiversity of desert ecosystems [4,5]. Plant diversity will also alleviate the impact of climate change [4]. Therefore, the impact of climate change on plant diversity is a mutual process. In addition, to explain the distribution pattern of species diversity, a variety of hypotheses have been proposed, the most discussed of which is the energy hypothesis, which argues that changes in species diversity are controlled by energy according to the different forms of energy and their impact on the species diversity mechanism. The water-energy dynamic hypothesis holds that the large-scale pattern of species diversity is determined by water and energy. In this hypothesis, energy refers to thermal kinetic energy (or thermal energy), usually expressed in terms of potential evapotranspiration or temperature [5]. In addition, some scholars have studied the species richness model of 3637 vascular plants in arid areas of northern China. It was found that water had a greater impact on species richness than energy, which indicated that the species richness pattern of plants in arid areas was mainly limited by water [6]. Therefore, under extreme climatic conditions, the influence of limiting factors on species diversity should be considered first. Desert ecosystems are the most sensitive areas to climate change. Desert plant diversity is one of the key factors determining the structure and functional diversity of desert plant communities [4,7]. Under the background of the rapid loss of biodiversity caused by global change, it is of great significance to study the maintenance mechanism of desert plant diversity for the maintenance and management of biodiversity in this area and the protection of biodiversity in the future.
Due to different regions and ecological types, the effects of temperature and precipitation on plant diversity will also show different response results. On a global scale, rising surface temperatures increase plant growth in the mid- to high latitudes of the Southern and Northern Hemispheres [8]; in inland Asia, temperature is also a major environmental factor for vegetation growth [9]. Other studies have shown that warming reduces the diversity and richness of plant species. For example, in the Arctic tundra ecosystem, short-term warming reduces community species diversity [10]. In the Tibetan Plateau, the increase in temperature accelerates the decrease in species richness [11]. However, studies from Inner Mongolia grassland found that warming had no significant effect on plant diversity [12]. In addition to temperature, the precipitation distribution pattern also affects plant species diversity. Studies have shown that a warm and humid climate is conducive to the increase in perennial plant diversity, while a warm and dry climate is conducive to the improvement of annual plant diversity [13]. In the warm and humid climate, the vegetation coverage in most arid areas of inland China increased significantly [14]. With the increase in annual precipitation, plant diversity changes along the steppe types (from desert to desert steppe-typical to steppe-meadow steppe) [15], which is consistent with Lopez-Angulo research results on the correlation between vegetation species richness and annual precipitation in different grassland types in Xinjiang. However, studies have shown that increased annual precipitation has no significant effect on plant diversity [16,17]. In addition, under the influence of climate change, species composition and vegetation patterns are changing. Kazakis et al. [18] and Pickering et al. [19] believed that climate warming caused the distribution of thermophilic shrubs, herbs, and invasive weeds to tend to occur at higher altitudes. The increase in temperature caused the dominant dwarf shrub, Dryas octopetala, in the alpine zone of southern Norway to be replaced by herbs, and the response of shrubs to global changes was more intense [20]. However, there are still few studies on the diversity of desert shrubs.
In recent years, against the background of global warming, the climate in Xinjiang has become more unstable, precipitation variability has increased, and the characteristics of “warm and humid” have become more obvious. Strong human activities have greatly increased the possibility of sudden climate change in Xinjiang, and extreme climate events have increased [21]. This makes the response of the Xinjiang desert ecosystem to global climate change unique and complex. Desert shrubland plants are an important part of biodiversity in the desert ecosystem of Xinjiang. Climate change has reduced plant diversity in originally extremely fragile desert ecosystems. The effects of climate change on the maintenance mechanism of plant diversity and other important scientific questions need to be answered. The study of species diversity is a key issue in desert ecosystem ecology, because the research content involves many aspects, such as the sustainable development of desert ecosystems and the protection and reconstruction of ecosystems. Species diversity is the degree of diversity at the level of species organization within a biological community. Margalef index, Simpson index, Shannon–Wiener index, and Pielou index are mostly used for community species diversity research. In this paper, the shrub community of the desert ecosystem in Xinjiang was taken as the research object. The four diversity indexes of the shrub community of desert plants were systematically studied, and the correlation between species diversity and climatic factors (temperature and precipitation) was discussed to provide a theoretical basis for the optimal management of desert ecosystems and the protection of plant community species diversity.
2. Materials and Methods
2.1. Study Area
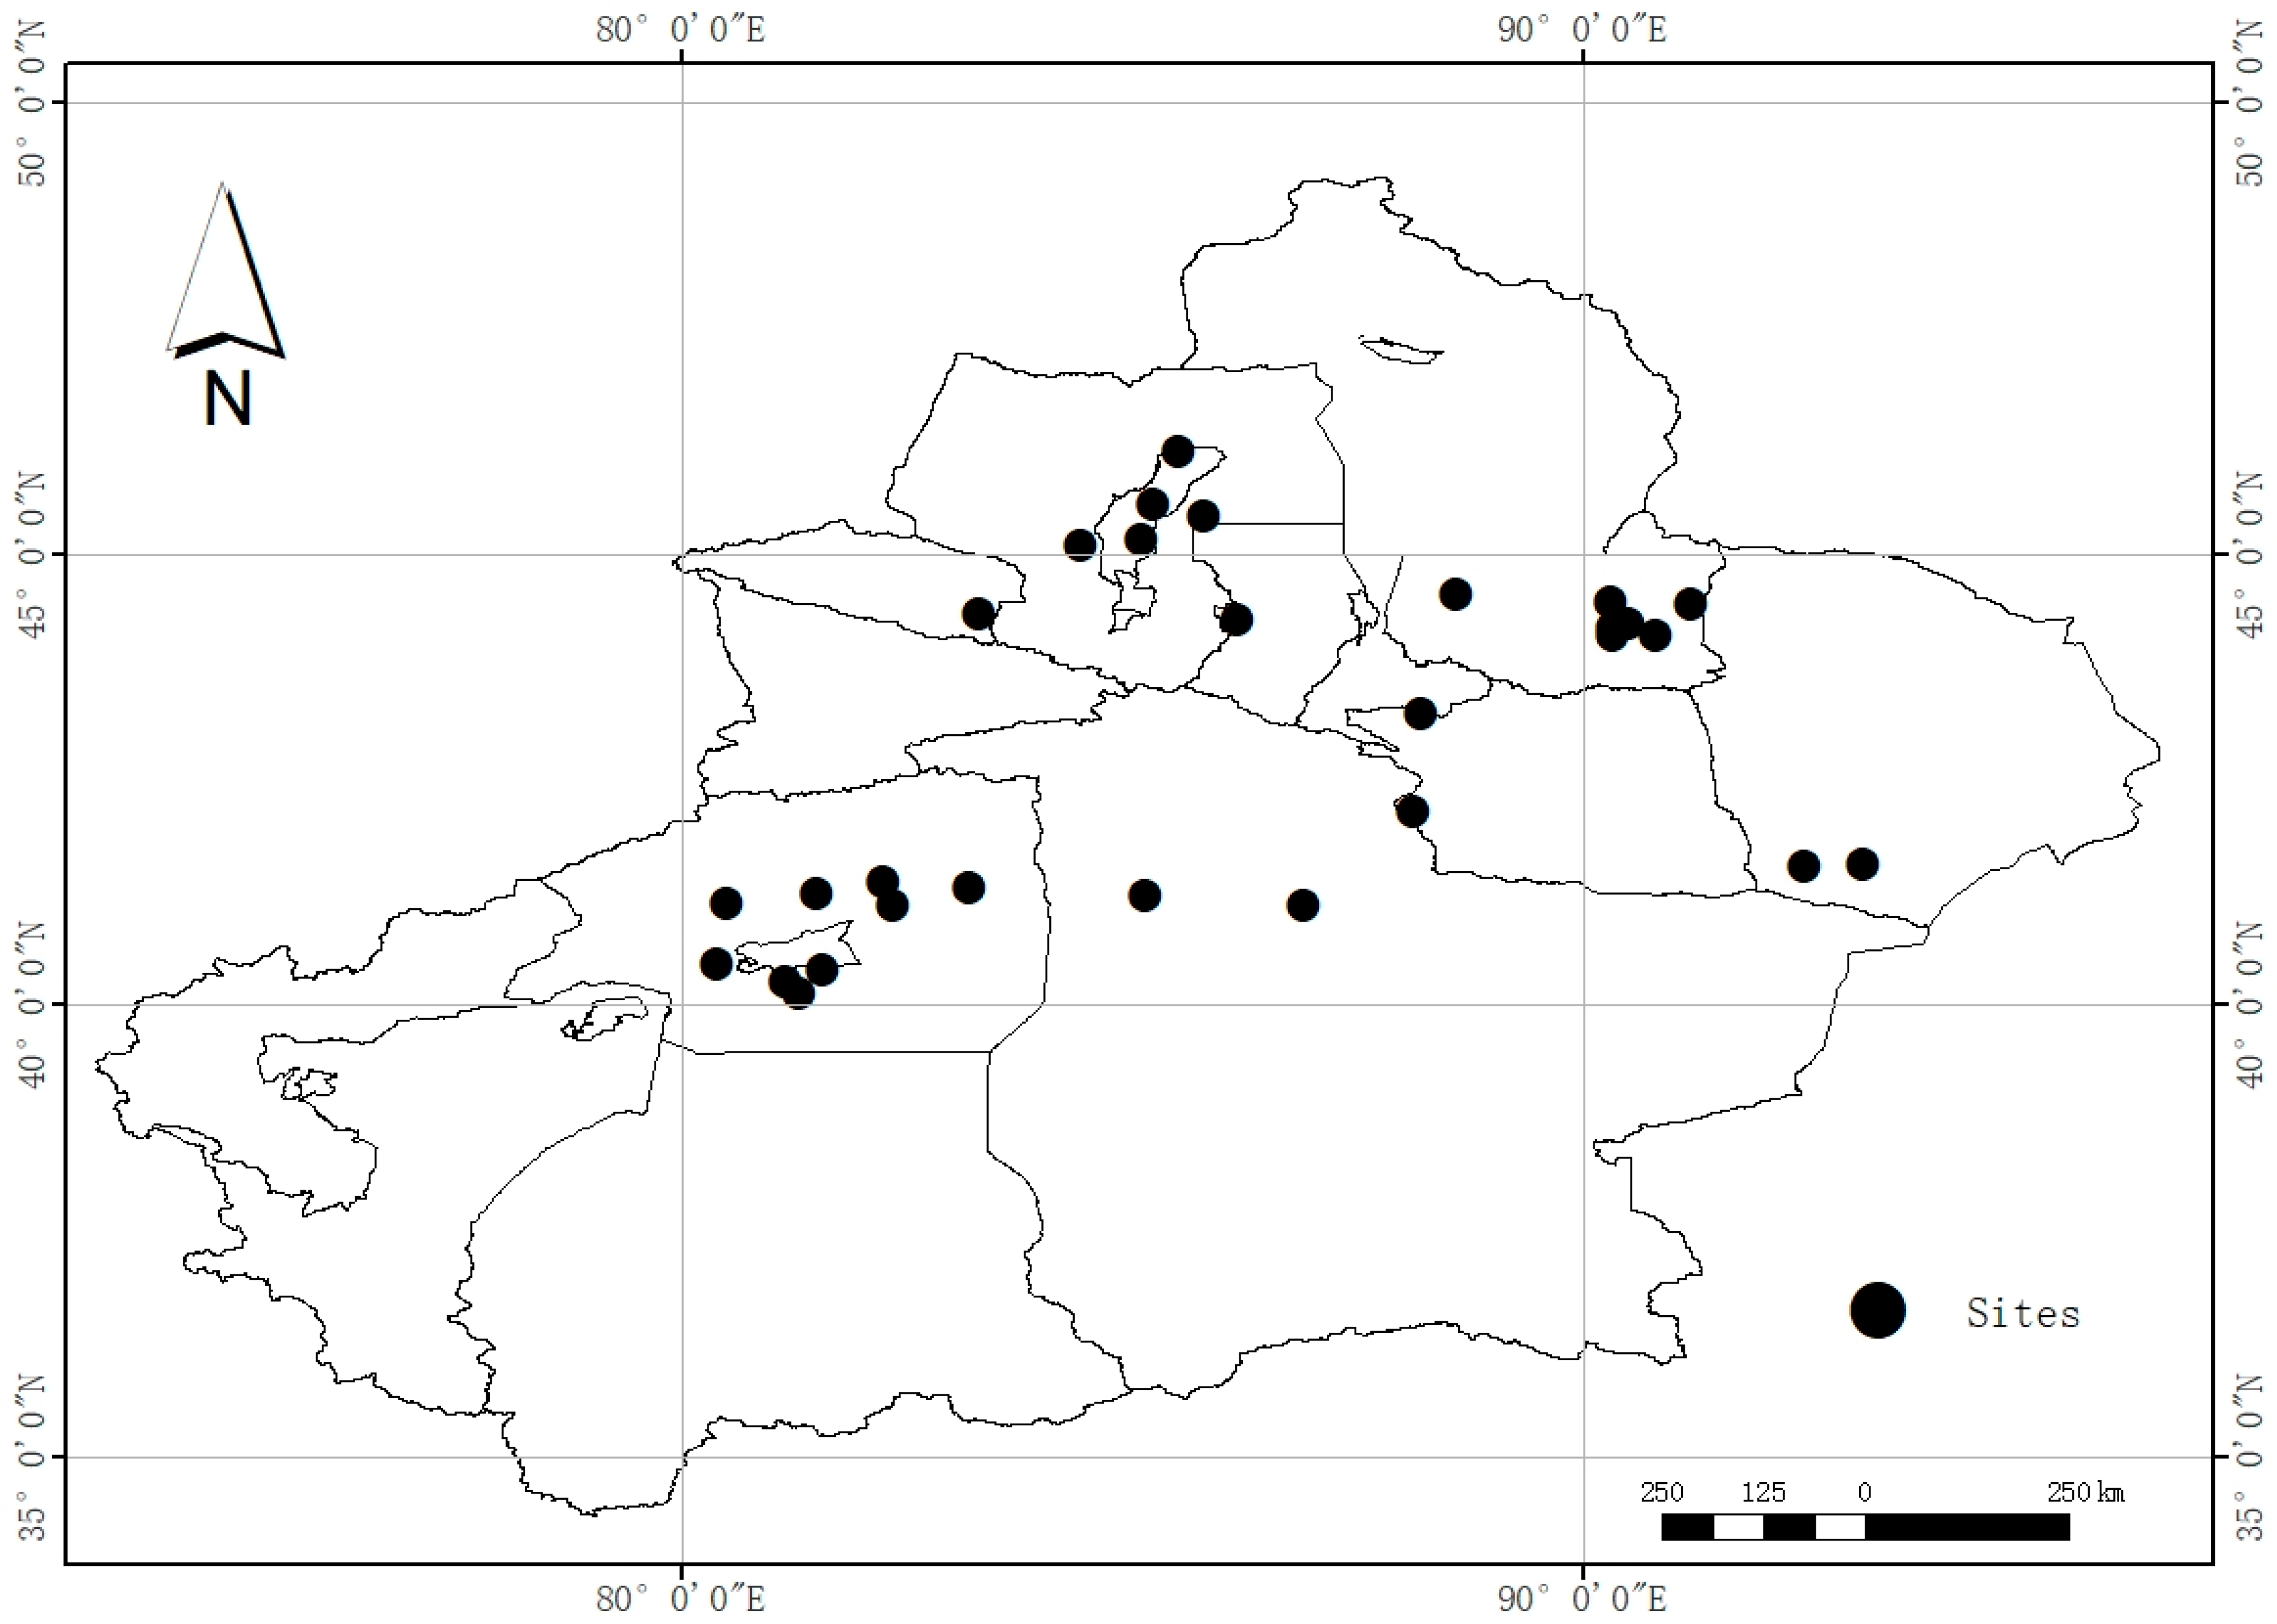
Xinjiang is located in the core of the arid region of Central Asia, deep inland, and is the farthest province from the sea in China. The region has a typical warm temperate continental climate, with dry summers, less rain, cold winters, and large temperature differences between day and night. Sandstorm disasters are serious, precipitation is scarce, and evaporation is strong. The study area spans 80°39′–91°19′ E and 40°14′–46°14′ N. The average annual temperature is 9.37 °C, and the average annual precipitation is 107.93 mm (Figure 1; Table 1).
2.2. Field Sampling
Sampling was conducted in the Xinjiang desert area in August 2018. According to the vegetation characteristics and environmental characteristics, a total of 29 survey plots were selected in the study area. The typical plot method was used to investigate 29 plant communities in Xinjiang desert areas. The basic information of 39 desert species was investigated. The sample design area of the plot is as follows: the shrub sample size is 15 × 15 m2. In each quadrat, plant species and coverage, plant height, number of plants, and other information of each community were counted to calculate community species diversity, abundance, frequency, dominance, and other indicators.
2.3. Meteorological Data Acquisition
In this study, annual average temperature (MAT, °C) and annual precipitation (MAP, mm) were selected as climatic factors. Annual mean temperature and annual precipitation data are from WorldClim Version 2.0 (http://worldclim.org/version2 (accessed on 7 March 2020)), Fick& Hijmans, 2017). Selecting these two indicators, we can investigate the changes in the diversity characteristics of desert shrub communities with temperature and water factors.
2.4. Data Processing
SPSS (Version 26.0, Armonk, NY, USA) and Origin (Version 2019, Northampton, MA, USA) were used to analyze the experimental data. One-way ANOVA was used to test the significance of the diversity indexes of different plant communities, and the difference was significant at the 0.05 level. The one-way ANOVA method was used to analyze the variance of the Margalef index, Simpson index, Shannon–Wiener index, and Pielou index of different plant communities. Using linear regression model to analyze the relationship between Margalef index, Simpson index, Shannon–Wiener index, and Pielou index and climatic factors.
The following four diversity indexes were selected as community diversity indexes. Margalef index represents the richness of species; the Simpson index represents the sum of probabilities of all species in a community or sample plot, the Shannon–Wiener index indicates the number of species in a community or sample plot and the evenness of individual distribution among species, and the Pielou index reflects the evenness of individual number distribution of each species, the calculation formula of each index is:
Margalef index (Ma) Ma = (S − 1)/lnN
Pielou index (E) E = H’/ln(S)
In the above formula, S is the total number of species in the quadrat, Pi is the proportion of the abundance of the i-th species in the total abundance, and N is the total abundance.
Gleason index is adopted for plant abundance (D). The calculation formula is:
D = S/lnA
In the above formula, S and A are the total number of plant species and total area (m2) in the sample plot.
3. Results and Analysis
3.1. Species Composition and Structural Characteristics of the Desert Shrub Community
Through the investigation of the study area, a total of 39 species, 27 genera, and 12 families were recorded, represented by Chenopodiaceae, Polygonaceae, Leguminosae, Tamaricaceae, and Zygophyllaceae. Common species include Tamarix ramosissima, Haloxylon ammodendron, Halostachys caspica, Calligonum mongolicum, Alhagi sparsifolia, Reaumuria soongarica, Ephedra przewalskii, etc. (Table 2).
The plant composition and structural characteristics of 29 plant communities were investigated (Table 3). The overall plant with extremely low coverage (ranging from 6% to 26%), most of the communities contain shrub and subshrub layers, indicating that the distribution of plants is relatively scattered and the coverage is relatively low. Most of them are T. ramosissima, H. ammodendron, and A. sparsifolia, which can grow under extremely dry conditions. In 29 shrub communities, T. ramosissima (in S4, S5, S21) and H. amodendron (in S2, S25, S26, S27, S29) has the highest frequency with 0.38 and 0.34, respectively. The plant height ranges from 0.07 m to 6.43 m, and the crown width ranges from 0.11 m to 6.48 m in different habitats vary greatly.
3.2. Relationship between Diversity Index Characteristics of the Desert Shrub Community and Climatic Factors
The Margalef index is related to the number of species and the total number of plants in the sample community. The Shannon–Wiener index is an important index reflecting the diversity of the community, which is used to explain the richness of species in the sample community. The Simpson index is also called the Simpson dominance index, which reflects the change in the number of species in the community. The larger the Pielou evenness index, the more uniform the distribution of individual species in the community. Table 4 shows the different variation characteristics among the species diversity indexes of the different plant communities. The Margalef species richness index ranged from 0.21 to 1.13. Among them, the T. ramosissima community (in S5) was the highest, and the K. wersmannia community (in S23) was the lowest, indicating that the plant species in the T. ramosissima community were the most species number and K. wersmannia community was the least species number. The Shannon–Wiener index ranged from 0.53 to 1.86, among which the T. ramosissima community (in S5) was the highest and the A. sparssifolia community (in S14) was the lowest, indicating that the T. ramosissima community contained a large amount of plant information and that the complexity of the community was higher than that in the other communities. The Simpson index ranged from 0.28 to 0.84 in this study, with the highest in the T. ramosissima community (in S5) and the lowest in the A. sparssifolia community (in S14), indicating that T. ramosissima plays an important role in Xinjiang desert ecosystem. The Pielou index ranged from 0.27 to 0.99, with the highest in the E. przewalskii community (in S12) and the lowest in the K. caspica community (in S19), indicating that the distribution of E. przewalskii community was the most uniform.
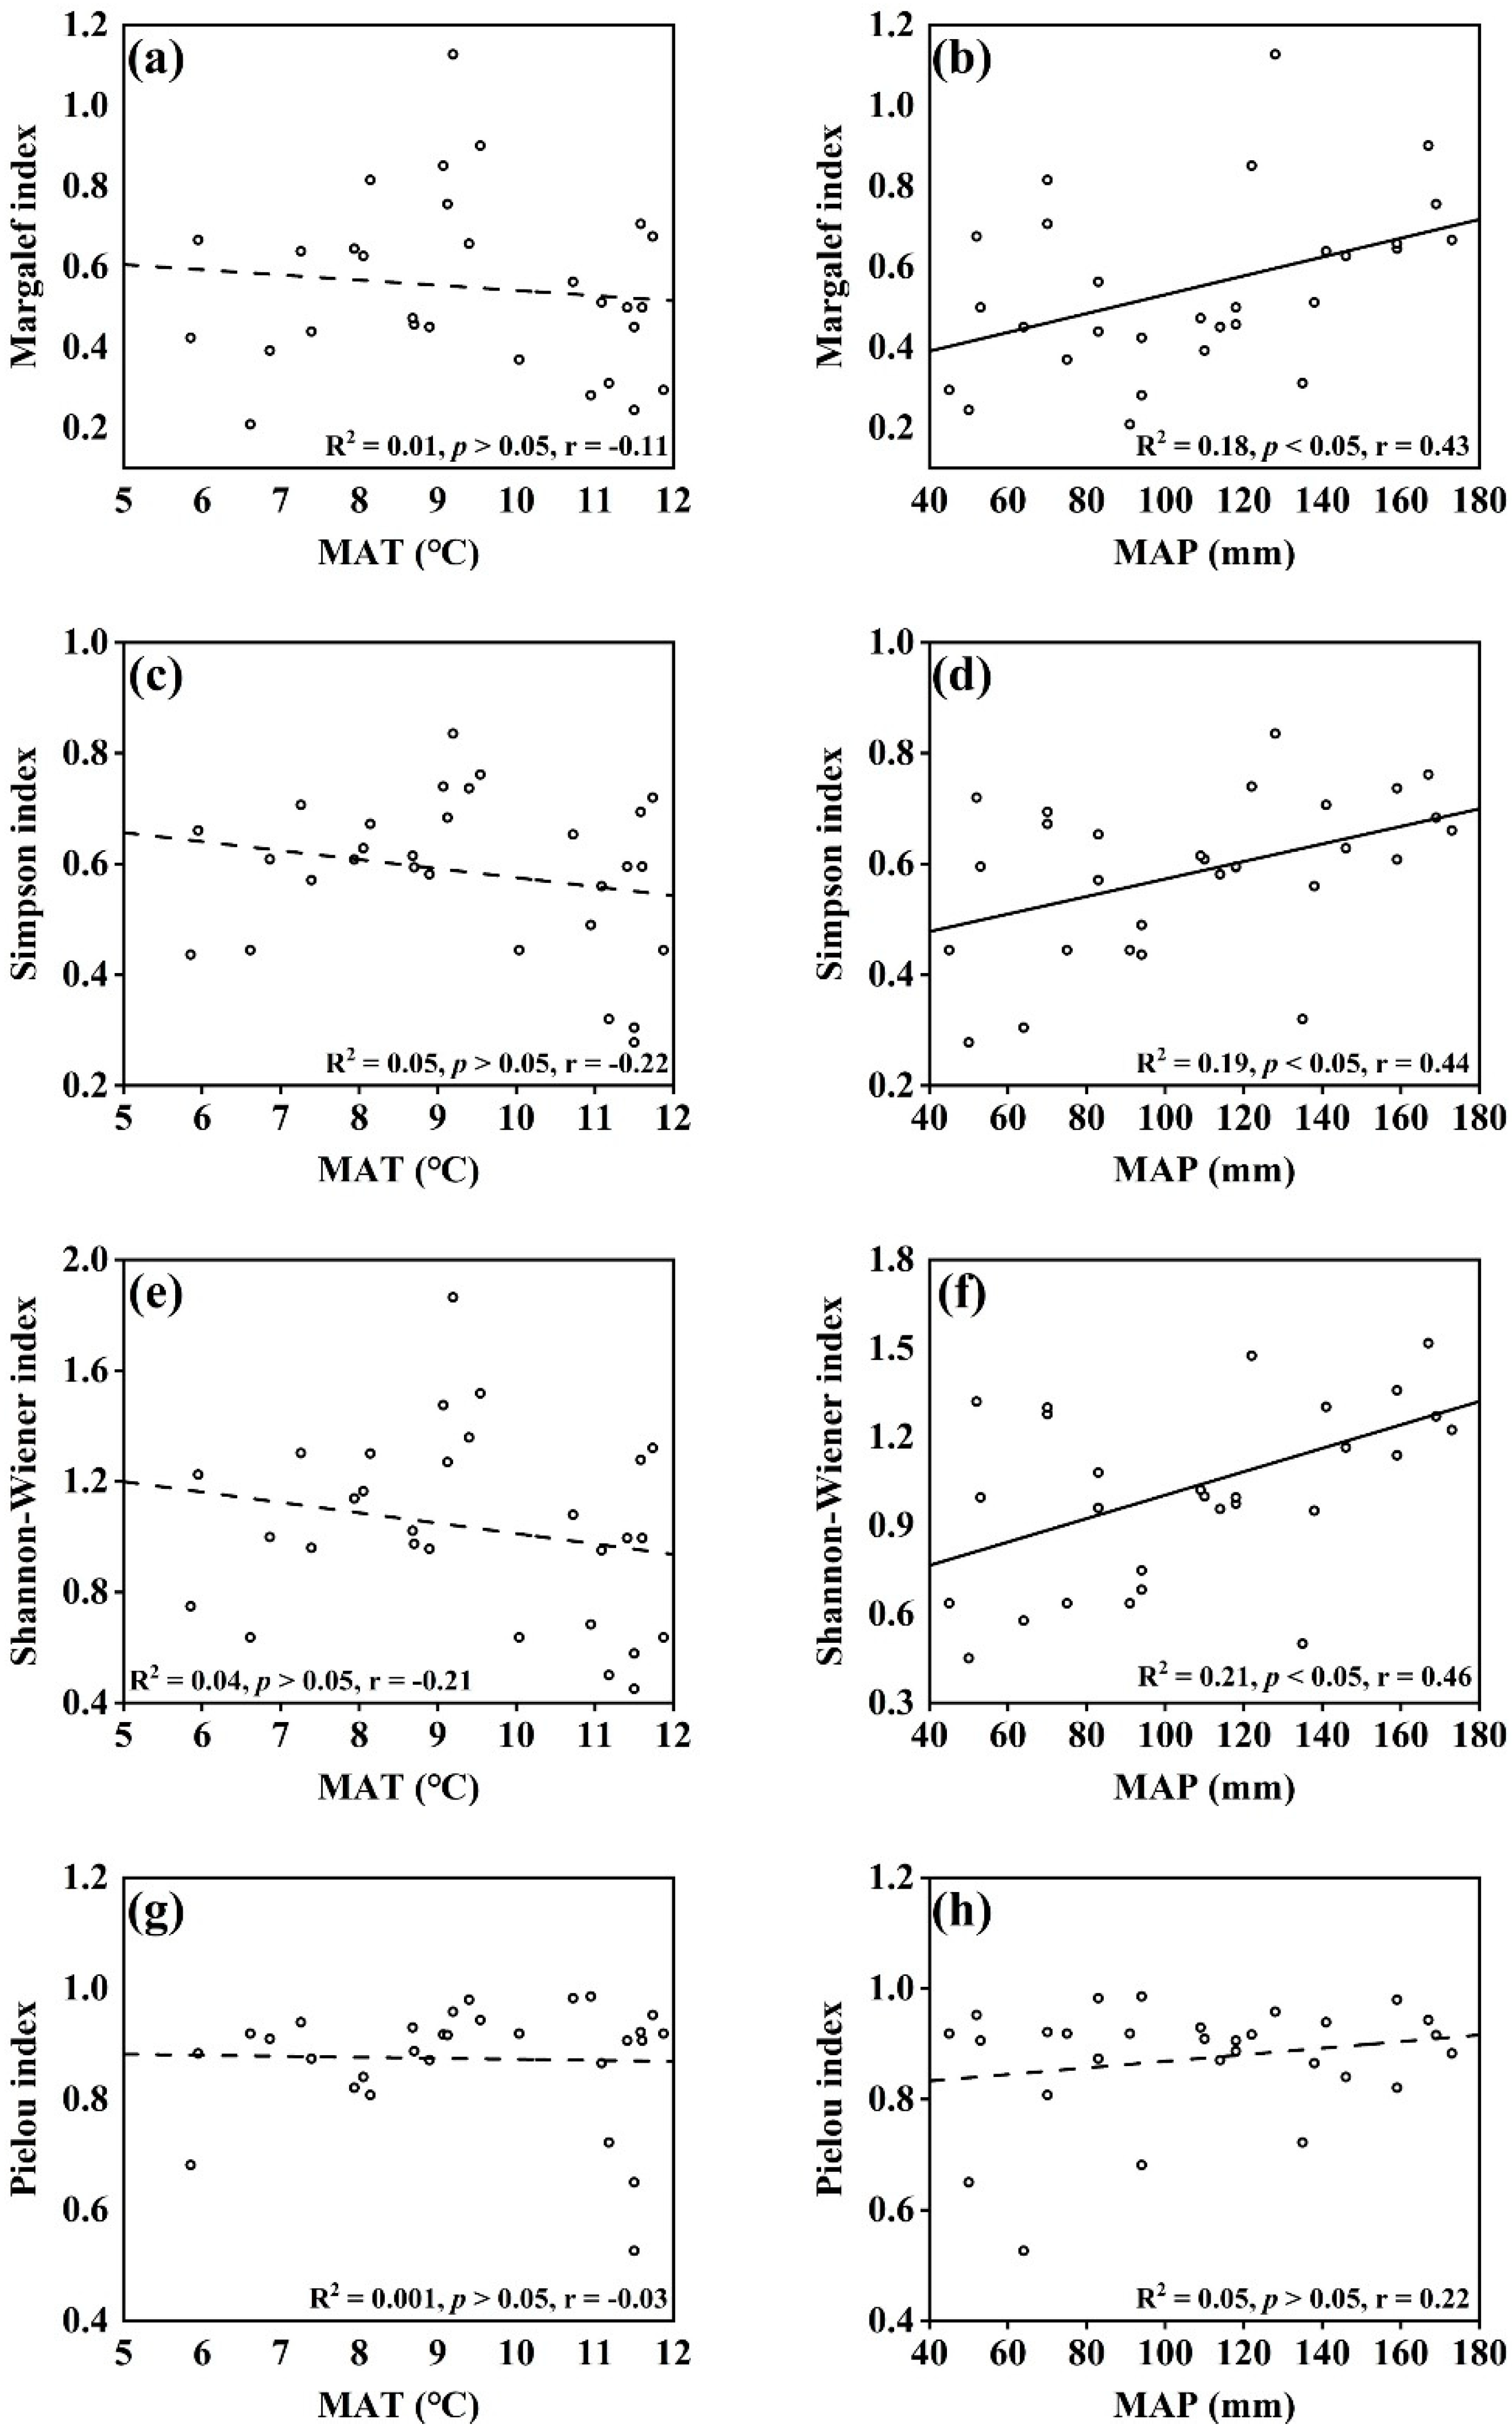
The relationship between the diversity characteristics of desert shrub communities and climatic factors was obtained by linear regression model analysis. Figure 2 shows that the Margalef index, Simpson index, Shannon–Wiener index, and Pielou index were negatively correlated with MAT but did not reach a significant level. Except for the Pielou index, the Margalef index (R2 = 0.18, p < 0.05), Simpson index (R2 = 0.19, p < 0.05), and Shannon–Wiener index (R2 = 0.21, p < 0.05) were significantly positively correlated with MAP. This indicates that community characteristics are closely related to precipitation conditions and that precipitation conditions have a significant effect on the structure and composition of flora.
4. Discussion
4.1. Diversity Characteristics of the Desert Shrub Community
The species and number of natural vegetation in desert shrub communities are relatively small, dominated by xerophytic, halophytic, or ultra-xerophytic small shrubs and perennial herbs, reflecting the characteristics of desert, semi-desert, and steppe desert plant communities [22,23]. In this study, the dominant layer of the community is the shrub layer, and its species composition is dominated by dwarf subshrubs. The dominant plants are mainly shrubs or subshrubs of Chenopodiaceae, Tamaricaceae, and Zygophyllaceae. The proportion of herbaceous plants is lower than that of shrubs and subshrubs, reflecting the harsh desert environment in Xinjiang. Under the conditions of a low degree of heterogeneity, from the perspective of layers, the life form of vegetation composition species gradually tends to be simple or even single.
The community species diversity index can reflect community structure characteristics. The larger the value of the Margalef species richness index, the higher the species number reflecting the community or habitat, and the greater the number of species [22,23,24]. Among the 29 communities in the Xinjiang desert, the Margalef index is the highest in the T. ramosissima community. T. ramosissima, as the constructive species, was widely distributed in Xinjiang. Because of its large number of species, large size, and strong ability to adapt to barren habitats, T. ramosissima has significant control over the formation of its community structure and community environment. The constructive species of T. ramosissima is more likely to form tall shrubs than other species in the process of the barren desert environment, but it will also form significant differences in height, coverage, and other aspects due to environmental changes [25]. The Shannon–Wiener diversity index is used to describe the amount of information contained in a community. The larger the index, the higher the complexity of the community [26]. In this study, the Shannon–Wiener index was the highest in the T. ramosissima community. T. ramosissima is the most salt-tolerant species in Tamarix, which has the characteristics of strong adaptability, resistance to wind, salt and alkali, drought and moisture, barren soil, sand burial, and developed roots [27]. Therefore, the associated species of the T. ramosissima community are abundant. The Simpson index, also known as the ecological dominance index, comprehensively reflects the richness of species in the community. It is one of the more commonly used diversity indexes. The higher the index is, the higher the ecological dominance of dominant species and the higher the probability of species occurrence [24]. In different communities, the Simpson index was still the highest in the T. ramosissima community, indicating that the T. ramosissima community plays an important role in the desert ecosystem, has good adaptability to the extreme environment, and has a great impact on the improvement of the desert environment. The Pielou index is an index of species evenness, which is generally used to characterize the uniformity of the spatial distribution of species in a community. The larger the value of the index is, the more uniform the distribution of plants [24]. In this study, the Pielou index was the highest in the E. pseudacorus community and the lowest in the K. caspica community, indicating that the species in the E. pseudacorus community had the highest uniformity of spatial distribution, while the K. caspica community had the lowest. In desert ecosystems, water, salinity, and other factors have certain effects on the distribution of species, so they will also affect the diversity characteristics of plant communities. However, more samples need to be collected to confirm the specific impact.
4.2. Relationship between Desert Shrub Community Diversity and Climatic Factors
The results of this study confirmed that climatic factors, especially water conditions, were the main factors leading to differences in plant community types and species composition in the Xinjiang desert. The Margalef index, Simpson index, Shannon–Wiener index, and Pielou index had no significant correlation with MAT but had a significant positive correlation with MAP. This shows that water is still the main limiting factor affecting the diversity of desert plant communities in the Xinjiang desert ecosystem. The frequent occurrence of extreme events in the context of global warming has a particularly significant impact on Xinjiang, which is located in arid and semi-arid regions, resulting in increased risks of extreme precipitation events, storm floods, and snowmelt floods. The increase in precipitation will help to improve the α diversity characteristics of desert shrub communities.
In this study, most diversity indexes had a significant positive correlation with the MAP. This is because the Xinjiang desert area is located in the temperate desert area of China. The environment is harsh, the soil is barren, the community type is poor, and the species’ life type is single. It is mainly composed of temperate desert shrubs and semi-shrub communities, and temperate shrubs and meadows are formed in some areas [22,23,26]. In terms of community species composition, shrubs and subshrubs account for a higher proportion, less precipitation in the habitat, simpler community composition, and higher dominance of dominant communities. Environmental factors have important effects on the distribution and diversity of plant species [26]. Extremely arid climatic conditions in the study area are the basis for the formation of desert plants in Xinjiang. At the regional scale, temperature and precipitation are the determinants of vegetation type distribution and species life form and are the basis for the formation of zonal vegetation [16,28]. The growth and development of various plants require precipitation. Precipitation will affect the distribution of different plant species and the species diversity of communities. Precipitation is a comprehensive environmental factor affected by many factors. Especially in recent years, due to the over-exploitation of the earth’s resources and the rapid development of industrialization it has accelerated the process of global warming and has also had a huge impact on global plant species diversity [28]. Global warming can not only affect plant growth and productivity by prolonging the seasonal cycle and changing phenological conditions but also directly affect plant photosynthesis by changing precipitation [29]. In addition, precipitation will also affect the change in soil moisture. The water absorbed by plants mainly comes from soil water, while soil water mainly comes from precipitation, so most of the water available to vegetation comes from natural precipitation [28,29].
Plants absorb water mainly from soil moisture, and soil moisture mainly comes from precipitation, so most of the water that vegetation can use comes from natural precipitation [28]. The effect of precipitation on plant community growth is a cumulative effect, and the plant community structure will change with changes in precipitation [27,28,29]. Precipitation changes have a significant impact on ecosystem structure and processes, such as community composition and dynamics, species diversity, and species competition. In the desert area of northwest China, water is the main limiting factor controlling plant growth and plant community diversity [29]. The results of this study show that precipitation can significantly improve the Margalef index, Simpson index, and Shannon–Wiener index. Yuan et al. found that the species diversity of alpine grassland in the northern Tibetan Plateau showed an exponential growth relationship with precipitation, and the increase in precipitation led to the optimization of community structure, which was significantly promoted [30]. Soliveres et al. [31] found that there is a good linear relationship between species richness and seasonal precipitation changes. Precipitation pattern changes directly affect species diversity and ecosystem versatility. Therefore, in the future, this paper also needs to consider investigating more data and further revealing the impact of rainfall changes on plant community diversity on a longer time scale.
5. Conclusions
In a word, this study analyzed the characteristics of different diversity indexes among desert plant communities and their responses to climate factors. Our results show that the T. ramosissima community had the highest Margalef index, and the K. ewersmannia community had the lowest. The Simpson index and Shannon–Wiener index were the highest in T. ramosissima and the lowest in A. sparsifolia. The Pielou index was the highest in the E. przewalskii community and the lowest in the K. caspica community. These results showed that there are significant differences among different plant communities in different diversity indexes. In addition, the α diversity index (except the Pielou index) of desert shrub community species was significantly positively correlated with the annual average precipitation but not significantly negatively correlated with the annual average temperature. These results indicated that water conditions are still an important factor affecting the species diversity of desert shrub communities in Xinjiang. These results provide an important reference for understanding the characteristics of plant community diversity in desert ecosystems and the relationship between desert plants and climate change.
Author Contributions
Y.L. carried out the fieldwork and wrote the first draft of the manuscript and Y.G. assisted with revising and editing the draft manuscript. All authors have read and agreed to the published version of the manuscript.
Funding
Third Xinjiang Scientific Expedition Program (Grant No. 2022xjkk040301), China Postdoctoral Science Foundation (Grant No. 2022M722667), and the Department of Education of Xinjiang Uygur Autonomous Region, Dr. Tianchi Program Project (Grant No. TCBS202123).
Data Availability Statement
Anyone who needs available data can directly consult and contact the first author of this article.
Conflicts of Interest
The authors declare that the research was conducted in the absence of any commercial or financial relationships that could be construed as a potential conflict of interest.
References
- Eisenhauer, N. Plant diversity effects on soil microorganisms: Spatial and temporal heterogeneity of plant inputs increase soil biodiversity. Pedobiologia 2016, 59, 175–177. [Google Scholar] [CrossRef]
- Vellend, M.; Geber, M.A. Connections between species diversity and genetic diversity. Ecol. Lett. 2005, 8, 767–781. [Google Scholar] [CrossRef]
- van Oijen, M.; Bellocchi, G.; Hoglind, M. Effects of Climate Change on Grassland Biodiversity and Productivity: The Need for a Diversity of Models. Agronomy 2018, 8, 14. [Google Scholar] [CrossRef] [Green Version]
- Parra-Tabla, V.; Albor-Pinto, C.; Tun-Garrido, J.; Angulo-Perez, D.; Barajas, C.; Silveira, R.; Ortiz-Diaz, J.J.; Arceo-Gomez, G. Spatial patterns of species diversity in sand dune plant communities in Yucatan, Mexico: Importance of invasive species for species dominance patterns. Plant Ecol. Divers. 2018, 11, 157–172. [Google Scholar] [CrossRef]
- Wright, D.H. Species-energy theory: An extension of species-area theory. Oikos 1983, 41, 496–506. [Google Scholar] [CrossRef] [Green Version]
- Banerjee, A.K.; Mukherjee, A.; Guo, W.X.; Liu, Y.; Huang, Y.L. Spatio-temporal patterns of climatic niche dynamics of an invasive plant Mikania micrantha kunth and its potential distribution under projected climate change. Front. Ecol. Evol. 2019, 7, 291. [Google Scholar] [CrossRef] [Green Version]
- Zuo, X.A.; Zhao, S.L.; Cheng, H.; Hu, Y.; Wang, S.K.; Yue, P.; Liu, R.T.; Knapp, A.K.; Smith, M.D.; Yu, Q.; et al. Functional diversity response to geographic and experimental precipitation gradients varies with plant community type. Funct. Ecol. 2021, 35, 2119–2132. [Google Scholar] [CrossRef]
- Mao, J.F.; Shi, X.Y.; Thornton, P.E.; Hoffman, F.M.; Zhu, Z.C.; Myneni, R.B. Global latitudinal-asymmetric vegetation growth trends and their driving mechanisms: 1982–2009. Remote Sens. 2013, 5, 1484–1497. [Google Scholar] [CrossRef] [Green Version]
- Anwar, M.; Wang, X.H.; Xu, X.T.; Peng, L.Q.; Yang, Y.; Zhang, X.P.; Myneni, R.B.; Piao, S.L. Drought and spring cooling induced recent decrease in vegetation growth in Inner Asia. Agric. For. Meteorol. 2013, 178, 21–30. [Google Scholar] [CrossRef]
- Walker, M.D.; Wahren, C.H.; Hollister, R.D.; Henry, G.H.R.; Ahlquist, L.E.; Alatalo, J.M.; Bret-Harte, M.S.; Calef, M.P.; Callaghan, T.V.; Carroll, A.B.; et al. Plant community responses to experimental warming across the tundra biome. Proc. Natl. Acad. Sci. USA 2006, 103, 1342–1346. [Google Scholar] [CrossRef]
- Klein, J.A.; Harte, J.; Zhao, X.Q. Experimental warming causes large and rapid species loss, dampened by simulated grazing on the Tibetan Plateau. Ecol. Lett. 2004, 7, 1170–1179. [Google Scholar] [CrossRef]
- Wu, Q.; Ren, H.Y.; Wang, Z.W.; Li, Z.G.; Liu, Y.H.; Wang, Z.; Li, Y.H.; Zhang, R.Y.; Zhao, M.L.; Chang, S.X.; et al. Additive negative effects of decadal warming and nitrogen addition on grassland community stability. J. Ecol. 2020, 108, 1442–1452. [Google Scholar] [CrossRef]
- Zhang, G.G.; Huang, J.; Jia, M.Q.; Liu, F.H.; Yang, Y.H.; Wang, Z.W.; Han, G.D. Ammonia-Oxidizing Bacteria and Archaea: Response to Simulated Climate Warming and Nitrogen Supplementation. Soil Sci. Soc. Am. Merica J. 2019, 83, 1683–1695. [Google Scholar] [CrossRef]
- Li, W.; Cheng, J.M.; Yu, K.L.; Epstein, H.E.; Guo, L.; Jing, G.H.; Zhao, J.; Du, G.Z. Plant functional diversity can be independent of species diversity: Observation based on the impact of 4-yrs of nitrogen and phosphorus additions in an alpine meadow. PLoS ONE 2015, 10, e0136040. [Google Scholar] [CrossRef] [PubMed] [Green Version]
- Bai, Y.F.; Wu, J.G.; Xing, Q.; Pan, Q.M.; Huang, J.H.; Yang, D.L.; Han, X.G. Primary production and rain use efficiency across a precipitation gradient on the Mongolia plateau. Ecology 2008, 89, 2140–2153. [Google Scholar] [CrossRef]
- Lopez-Angulo, J.; Pescador, D.S.; Sanchez, A.M.; Luzuriaga, A.L.; Cavieres, L.A.; Escudero, A. Impacts of climate, soil and biotic interactions on the interplay of the different facets of alpine plant diversity. Sci. Total Environ. 2019, 698, 133960. [Google Scholar] [CrossRef]
- Grime, J.P.; Fridley, J.D.; Askew, A.P.; Thompson, K.; Hodgson, J.G.; Bennett, C.R. Long-term resistance to simulated climate change in an infertile grassland. Proc. Natl. Acad. Sci. USA 2008, 105, 10028–10032. [Google Scholar] [CrossRef] [Green Version]
- Kazakis, G.; Ghosn, D.; Vogiatzakis, I.N.; Papanastasis, V.P. Vascular plant diversity and climate change in the alpine zone of the Lefka Ori, Crete. Biodivers. Conserv. 2007, 16, 1603–1615. [Google Scholar] [CrossRef]
- Pickering, C.; Hill, W.; Green, K. Vascular plant diversity and climate change in the alpine zone of the Snowy Mountains. Aust. Biodivers. Conserv. 2008, 17, 1627–1644. [Google Scholar] [CrossRef] [Green Version]
- Ni, J. A biome classification of China based on plant functional types and the BIOME3 model. Folia Geobot. 2001, 36, 113–129. [Google Scholar] [CrossRef]
- Wang, Q.; Zhai, P.M.; Qin, D.H. New perspectives on ‘warming-wetting’ trend in Xinjiang, China. Adv. Clim. Chang. Res. 2010, 11, 252–260. [Google Scholar] [CrossRef]
- Pekas, K.M.; Schupp, E.W. Influence of aboveground vegetation on seed bank composition and distribution in a Great Basin Desert sagebrush community. J. Arid Environ. 2013, 88, 113–120. [Google Scholar] [CrossRef] [Green Version]
- Li, S.J.; Su, P.X.; Zhang, H.N.; Zhou, Z.J.; Xie, T.T.; Shi, R.; Gou, W. Distribution patterns of desert plant diversity and relationship to soil properties in the Heihe River Basin, China. Ecosphere 2018, 9, e02355. [Google Scholar] [CrossRef] [Green Version]
- Therriault, T.W.; Kolasa, J. Physical determinants of richness, diversity, evenness and abundance in natural aquatic microcosms. Hydrobiologia 1999, 412, 123–130. [Google Scholar] [CrossRef]
- Zhang, Z.; Ullah, I.; Wang, Z.; Ma, P.; Zhao, Y.; Xia, X.; Li, Y. Reconstruction of temperature for the past 400 years in the southern margin of the Taklimakan desert based on carbon isotope fractionation of Tamarix leaves. Appl. Ecol. Environ. Res. 2019, 17, 271–284. [Google Scholar] [CrossRef]
- Garland, J.L.; Lehman, R.M. Dilution/extinction of community phenotypic characters to estimate relative structural diversity in mixed communities. Fems Microbiol. Ecol. 1999, 30, 333–343. [Google Scholar] [CrossRef]
- Chen, Y.; Wang, H.; Zhang, F.S.; Xi, J.B.; He, Y.K. The characteristic of salt excretion and its affected factors on Tamarix ramosissima Leded under desert saline-alkali habitat in Xinjiang Province. Acta Ecol. Sin. 2010, 30, 511–518, (Abstract in Chinese). [Google Scholar]
- Mokany, K.; Ferrier, S. Predicting impacts of climate change on biodiversity: A role for semimechanistic community-level modeling. Divers. Distrib. 2015, 17, 374–380. [Google Scholar] [CrossRef]
- Sun, Y.; He, M.Z.; Wang, L. Effects of precipitation control on plant diversity and biomass in a desert region. Acta Ecol. Sin. 2018, 38, 2425–2433, (Abstract in Chinese). [Google Scholar]
- Yuan, Q.; Yuan, Q.Z.; Ren, P. Coupled effect of climate change and human activities on the restoration/degradation of the Qinghai-Tibet Plateau grassland. J. Geogr. Sci. 2021, 31, 1299–1327. [Google Scholar] [CrossRef]
- Soliveres, S.; Maestre, F.T.; Eldridge, D.J.; Delgado-Baquerizo, M.; Quero, J.L.; Bowker, M.A.; Gallardo, A. Plant diversity and ecosystem multifunctionality peak at intermediate levels of woody cover in global drylands. Glob. Ecol. Biogeogr. 2015, 23, 1408–1416. [Google Scholar] [CrossRef] [PubMed]
Figure 1.
Locations of the 29 sampling sites in Xinjiang, China. The figure was drawn based on the map of Xinjiang at a scale of 1:5,500,000 (Xinjiang Bureau of Surveying Mapping and Geoinformation, No. Xin S (2016) 250).
Figure 1.
Locations of the 29 sampling sites in Xinjiang, China. The figure was drawn based on the map of Xinjiang at a scale of 1:5,500,000 (Xinjiang Bureau of Surveying Mapping and Geoinformation, No. Xin S (2016) 250).

Figure 2.
Relationship between plant community diversity index and climate factors. Note: (a,c,e,g) diagrams represent the relationship between Margalef index, Simpson index, Shannon–Wiener index, Pielou index and MAT respectively; (b,d,f,h) diagrams represent the relationship between Margalef index, Simpson index, Shannon–Wiener index, Pielou index and MAP respectively.


Table 1.
Characteristics of sites and climatic factors.
| Sites | Longitude (°) | Latitude (°) | Altitude (m) | MAT (°C) | MAP (mm) |
|---|---|---|---|---|---|
| 1 | 86.27 | 44.48 | 365 | 7.3 | 141 |
| 2 | 85.03 | 45.29 | 270 | 8.9 | 114 |
| 3 | 85.86 | 46.24 | 526 | 7.9 | 159 |
| 4 | 85.15 | 45.72 | 366 | 9.1 | 122 |
| 5 | 85.39 | 45.92 | 307 | 9.2 | 128 |
| 6 | 84.72 | 45.18 | 270 | 8.7 | 118 |
| 7 | 83.49 | 44.57 | 365 | 9.4 | 159 |
| 8 | 83.02 | 41.95 | 1451 | 9.1 | 169 |
| 9 | 82.78 | 41.91 | 1110 | 9.5 | 167 |
| 10 | 82.59 | 41.67 | 1031 | 11.2 | 135 |
| 11 | 82.44 | 41.61 | 997 | 11.1 | 138 |
| 12 | 81.09 | 41.40 | 1024 | 11.0 | 94 |
| 13 | 80.82 | 41.25 | 984 | 10.7 | 83 |
| 14 | 81.24 | 40.43 | 975 | 11.5 | 50 |
| 15 | 81.05 | 40.24 | 1025 | 11.9 | 45 |
| 16 | 80.66 | 40.75 | 1024 | 11.4 | 53 |
| 17 | 81.94 | 40.68 | 980 | 11.6 | 70 |
| 18 | 83.30 | 41.52 | 958 | 11.6 | 118 |
| 19 | 85.23 | 41.36 | 916 | 11.5 | 64 |
| 20 | 86.16 | 41.18 | 878 | 11.7 | 52 |
| 21 | 88.19 | 42.26 | 892 | 10.0 | 75 |
| 22 | 88.34 | 43.40 | 1196 | 6.0 | 173 |
| 23 | 90.54 | 44.19 | 870 | 6.6 | 91 |
| 24 | 90.56 | 44.05 | 958 | 5.9 | 94 |
| 25 | 91.33 | 44.76 | 766 | 8.1 | 70 |
| 26 | 90.82 | 44.41 | 905 | 7.4 | 83 |
| 27 | 90.14 | 44.18 | 756 | 6.9 | 110 |
| 28 | 90.06 | 44.81 | 563 | 8.7 | 109 |
| 29 | 89.00 | 44.94 | 571 | 8.1 | 146 |
Table 2.
Species classification and characteristics of the desert shrub community.
| Species | Family | Genus | Life Form |
|---|---|---|---|
| Alhagi sparsifolia | Leguminosae | Alhagi | Subshrub |
| Anabasis aphylla | Chenopodiaceae | Anabasis | Subshrub |
| Anabasis brevifolia | Chenopodiaceae | Anabasis | Subshrub |
| Anabasis cretacea | Chenopodiaceae | Anabasis | Subshrub |
| Apocynum venetum | Apocynaceae | Apocynum | Subshrub |
| Artemisia ordosica | Compositae | Artemisia | Subshrub |
| Calligonum ebinuricum | Polygonaceae | Calligonum | Shrub |
| Calligonum junceum | Polygonaceae | Calligonum | Shrub |
| Calligonum leucocladum | Polygonaceae | Calligonum | Shrub |
| Calligonum mongolicum | Polygonaceae | Calligonum | Shrub |
| Caragana acanthophylla | Leguminosae | Caragana | Shrub |
| Caragana dasyphylla | Leguminosae | Caragana | Shrub |
| Cynanchum sibiricum | Asclepiadaceae | Cynanchum | Herb |
| Ephedra intermedia | Ephedraceae | Ephedra | Shrub |
| Ephedra przewalskii | Ephedraceae | Ephedra | Shrub |
| Gymnocarpos przewalskii | Caryophyllaceae | Gymnocarpos | Subshrub |
| Halimodendron halodendron | Leguminosae | Halimodendron | Shrub |
| Halocnemum strobilaceum | Chenopodiaceae | Halocnemum | Subshrub |
| Halostachys caspica | Chenopodiaceae | Halostachys | Shrub |
| Haloxylon ammodendron | Chenopodiaceae | Haloxylon | Shrub |
| Iljinia regelii | Chenopodiaceae | Iljinia | Subshrub |
| Kalidium caspicum | Chenopodiaceae | Kalidium | Subshrub |
| Kalidium foliatum | Chenopodiaceae | Kalidium | Shrub |
| Karelinia caspica | Compositae | Karelinia | Herb |
| Krascheninnikovia ewersmannia | Chenopodiaceae | Krascheninnikovia | Shrub |
| Leymus racemosus | Gramineae | Leymus | Herb |
| Lycium ruthenicum | Solanaceae | Lycium | Shrub |
| Nitraria sphaerocarpa | Zygophyllaceae | Nitraria | Shrub |
| Nitraria tangutorum | Zygophyllaceae | Nitraria | Shrub |
| Poacynum pictum | Apocynaceae | Poacynum | Subshrub |
| Reaumuria soongarica | Tamaricaceae | Reaumuria | Subshrub |
| Salsola arbuscula | Chenopodiaceae | Salsola | Subshrub |
| Suaeda microphylla | Chenopodiaceae | Suaeda | Subshrub |
| Sympegma regelii | Chenopodiaceae | Sympegma | Subshrub |
| Tamarix arceuthoides | Tamaricaceae | Tamarix | Shrub |
| Tamarix hispida | Tamaricaceae | Tamarix | Shrub |
| Tamarix ramosissima | Tamaricaceae | Tamarix | Shrub |
| Zygophyllum fabago | Zygophyllaceae | Sarcozygium Bunge | Herb |
| Zygophyllum xanthoxylon | Zygophyllaceae | Sarcozygium | Shrub |
Table 3.
Plant composition and structural characteristics of different community types.
| Sites | Community Types | Vegetation Composition | Number of Seedlings | Average Height (m) | Average Crown (m) | Coverage (%) | Frequency |
|---|---|---|---|---|---|---|---|
| S1 | Karelinia caspica | H. caspica | 30 | 1.28 | 1.33 | 24 | 0.10 |
| T. ramosissima | 15 | 3.55 | 3.60 | 10 | 0.38 | ||
| K. caspica | 45 | 0.81 | 0.78 | 21 | 0.14 | ||
| S. microphylla | 20 | 0.26 | 0.28 | 6 | 0.07 | ||
| S2 | Haloxylon ammodendron | H. ammodendron | 45 | 2.85 | 2.89 | 26 | 0.34 |
| C. mongolicum | 10 | 0.72 | 0.69 | 8 | 0.07 | ||
| S. arbuscula | 30 | 0.18 | 0.21 | 24 | 0.07 | ||
| S3 | Ephedra intermedia | E. intermedia | 60 | 0.66 | 0.65 | 10 | 0.17 |
| T. arceuthoides | 10 | 3.11 | 3.16 | 22 | 0.03 | ||
| C. sibiricum | 15 | 0.35 | 0.31 | 7 | 0.03 | ||
| A. sparsifolia | 20 | 0.45 | 0.40 | 24 | 0.24 | ||
| S4 | Tamarix ramosissima | T. ramosissima | 45 | 2.96 | 3.01 | 10 | 0.38 |
| H. ammodendron | 15 | 2.06 | 2.10 | 23 | 0.34 | ||
| L. ruthenicum | 10 | 0.97 | 0.94 | 10 | 0.14 | ||
| I. regelii | 20 | 0.42 | 0.38 | 22 | 0.03 | ||
| K. caspica | 20 | 0.68 | 0.63 | 8 | 0.14 | ||
| S5 | Tamarix ramosissima | T. ramosissima | 50 | 3.82 | 3.84 | 26 | 0.38 |
| H. ammodendron | 10 | 1.12 | 1.10 | 7 | 0.34 | ||
| E. przewalskii | 20 | 0.79 | 0.76 | 23 | 0.14 | ||
| H. halodendron | 30 | 1.70 | 1.68 | 9 | 0.03 | ||
| A. ordosica | 30 | 0.37 | 0.38 | 22 | 0.07 | ||
| S. regelii | 35 | 0.41 | 0.42 | 7 | 0.07 | ||
| A. sparsifolia | 30 | 0.62 | 0.60 | 23 | 0.17 | ||
| S6 | Suaeda microphylla | H. ammodendron | 10 | 1.83 | 1.82 | 11 | 0.34 |
| R. soongarica | 30 | 0.57 | 0.58 | 24 | 0.24 | ||
| S. microphylla | 40 | 0.07 | 0.11 | 8 | 0.07 | ||
| S7 | Tamarix hispida | T. hispida | 30 | 4.30 | 4.33 | 26 | 0.10 |
| R. soongarica | 25 | 0.45 | 0.44 | 8 | 0.24 | ||
| K. caspicum | 15 | 0.78 | 0.72 | 23 | 0.03 | ||
| N. tangutorum | 26 | 0.50 | 0.49 | 9 | 0.03 | ||
| S8 | Reaumuria soongarica | Z. xanthoxylon | 10 | 0.63 | 0.59 | 25 | 0.07 |
| R. soongarica | 25 | 0.29 | 0.32 | 6 | 0.24 | ||
| C. dasyphylla | 8 | 1.24 | 1.24 | 22 | 0.03 | ||
| G. przewalskii | 10 | 0.51 | 0.49 | 7 | 0.03 | ||
| S9 | Kalidium foliatum | E. przewalskii | 10 | 0.5 | 0.48 | 24 | 0.24 |
| K. foliatum | 30 | 0.32 | 0.33 | 7 | 0.03 | ||
| R. soongarica | 20 | 0.16 | 0.18 | 22 | 0.24 | ||
| L. racemosus | 10 | 0.36 | 0.34 | 6 | 0.03 | ||
| A. ordosica | 15 | 0.28 | 0.30 | 21 | 0.07 | ||
| S10 | Anabasis cretacea | A. cretacea | 20 | 0.41 | 0.39 | 8 | 0.07 |
| E. przewalskii | 5 | 0.36 | 0.37 | 22 | 0.34 | ||
| S11 | Tamarix hispida | T. hispida | 30 | 4.93 | 4.98 | 9 | 0.10 |
| C. junceum | 10 | 0.55 | 0.51 | 25 | 0.07 | ||
| A. sparsifolia | 10 | 0.66 | 0.62 | 6 | 0.20 | ||
| S12 | Ephedra przewalskii | E. przewalskii | 20 | 0.57 | 0.56 | 22 | 0.45 |
| C. junceum | 15 | 0.79 | 0.79 | 8 | 0.07 | ||
| S13 | Lycium ruthenicum | T. ramosissima | 10 | 1.97 | 1.97 | 24 | 0.38 |
| L. ruthenicum | 15 | 0.84 | 0.86 | 7 | 0.14 | ||
| A. sparsifolia | 10 | 0.41 | 0.42 | 21 | 0.23 | ||
| S14 | Alhagi sparsifolia | A. sparsifolia | 50 | 0.89 | 0.81 | 7 | 0.26 |
| T. ramosissima | 10 | 2.53 | 2.58 | 23 | 0.38 | ||
| S15 | Poacynum pictum | T. ramosissima | 10 | 3.21 | 3.26 | 9 | 0.38 |
| P. pictum | 20 | 1.06 | 1.06 | 22 | 0.07 | ||
| S16 | Lycium ruthenicum | H. caspica | 15 | 1.60 | 1.62 | 9 | 0.10 |
| T. hispida | 10 | 2.76 | 2.78 | 25 | 0.10 | ||
| L. ruthenicum | 30 | 0.76 | 0.74 | 6 | 0.14 | ||
| S17 | Alhagi sparsifolia | P. pictum | 10 | 1.22 | 1.20 | 22 | 0.07 |
| T. ramosissima | 20 | 4.03 | 4.03 | 9 | 0.38 | ||
| A. sparsifolia | 30 | 1.24 | 1.20 | 21 | 0.29 | ||
| S. regelii | 10 | 0.79 | 0.78 | 6 | 0.07 | ||
| S18 | Karelinia caspica | T. ramosissima | 10 | 3.48 | 3.50 | 25 | 0.38 |
| H. caspica | 15 | 1.21 | 1.20 | 8 | 0.10 | ||
| K. caspica | 30 | 0.81 | 0.80 | 22 | 0.14 | ||
| S19 | Karelinia caspica | T. ramosissima | 10 | 3.08 | 3.10 | 9 | 0.38 |
| K. caspica | 70 | 0.93 | 0.94 | 22 | 0.14 | ||
| Z. fabago | 5 | 0.44 | 0.48 | 7 | 0.03 | ||
| S20 | Alhagi sparsifolia | T. ramosissima | 10 | 2.82 | 2.81 | 25 | 0.38 |
| L. ruthenicum | 20 | 0.88 | 0.89 | 7 | 0.14 | ||
| A. venetum | 25 | 1.09 | 1.08 | 21 | 0.03 | ||
| A. sparsifolia | 30 | 0.44 | 0.52 | 6 | 0.32 | ||
| S21 | Tamarix ramosissima | T. ramosissima | 10 | 6.43 | 6.48 | 24 | 0.38 |
| H. strobilaceum | 5 | 1.65 | 1.69 | 8 | 0.03 | ||
| S22 | Caragana acanthophylla | C. acanthophylla | 45 | 0.84 | 0.86 | 25 | 0.03 |
| Z. xanthoxylon | 15 | 0.85 | 0.82 | 8 | 0.07 | ||
| A. aphylla | 20 | 0.14 | 0.19 | 22 | 0.03 | ||
| A. brevifolia | 10 | 0.44 | 0.45 | 6 | 0.03 | ||
| S23 | Krascheninnikovia ewersmannia | H. ammodendron | 40 | 1.81 | 1.86 | 25 | 0.34 |
| K. ewersmannia | 80 | 0.34 | 0.32 | 7 | 0.07 | ||
| S24 | Anabasis cretacea | A. cretacea | 80 | 0.51 | 0.49 | 22 | 0.07 |
| R. soongarica | 25 | 0.28 | 0.31 | 8 | 0.24 | ||
| N. sphaerocarpa | 7 | 0.74 | 0.73 | 24 | 0.07 | ||
| S25 | Haloxylon ammodendron | H. ammodendron | 65 | 1.25 | 1.25 | 8 | 0.34 |
| C. leucocladum | 35 | 1.50 | 1.53 | 25 | 0.10 | ||
| S. arbuscula | 10 | 0.18 | 0.21 | 6 | 0.07 | ||
| E. intermedia | 5 | 0.71 | 0.71 | 21 | 0.17 | ||
| N. sphaerocarpa | 20 | 1.07 | 1.06 | 8 | 0.07 | ||
| S26 | Haloxylon ammodendron | H. ammodendron | 55 | 2.35 | 2.4 | 24 | 0.34 |
| E. intermedia | 25 | 0.66 | 0.67 | 8 | 0.17 | ||
| R. soongarica | 15 | 0.48 | 0.48 | 22 | 0.24 | ||
| S27 | Haloxylon ammodendron | H. ammodendron | 76 | 1.85 | 1.89 | 10 | 0.34 |
| C. leucocladum | 23 | 0.82 | 0.82 | 23 | 0.10 | ||
| K. ewersmannia | 65 | 0.83 | 0.83 | 6 | 0.07 | ||
| S28 | Krascheninnikovia ewersmannia | C. leucocladum | 13 | 0.58 | 0.58 | 23 | 0.10 |
| E. intermedia | 35 | 0.57 | 0.57 | 7 | 0.17 | ||
| H. ammodendron | 21 | 1.13 | 1.18 | 24 | 0.34 | ||
| S29 | Haloxylon ammodendron | H. ammodendron | 65 | 1.7 | 1.7 | 10 | 0.34 |
| E. intermedia | 10 | 0.74 | 0.74 | 21 | 0.17 | ||
| R. soongarica | 20 | 0.6 | 0.63 | 7 | 0.24 |
Note: S1 to S29 indicated sites with serial numbers from 1 to 29.
Table 4.
Diversity index in different plant communities.
| Sites | Community Types | Margalef Index | Simpson Index | Shannon–Wiener Index | Pielou Index |
|---|---|---|---|---|---|
| S1 | K. caspia | 0.64 | 0.71 | 1.30 | 0.94 |
| S2 | H. ammodendron | 0.45 | 0.58 | 0.96 | 0.87 |
| S3 | E. intermedia | 0.64 | 0.61 | 1.14 | 0.82 |
| S4 | T. ramosissima | 0.85 | 0.74 | 1.48 | 0.92 |
| S5 | T. ramosissima | 1.13 | 0.84 | 1.86 | 0.96 |
| S6 | S. microphylla | 0.46 | 0.59 | 0.97 | 0.89 |
| S7 | T. hispida | 0.66 | 0.74 | 1.36 | 0.98 |
| S8 | R. songarica | 0.76 | 0.68 | 1.27 | 0.92 |
| S9 | K. foliatum | 0.90 | 0.76 | 1.52 | 0.94 |
| S10 | A. cretacea | 0.31 | 0.32 | 0.50 | 0.72 |
| S11 | T. hispida | 0.51 | 0.56 | 0.95 | 0.86 |
| S12 | E. przewalskii | 0.28 | 0.49 | 0.68 | 0.99 |
| S13 | L. ruthenicum | 0.56 | 0.65 | 1.08 | 0.98 |
| S14 | A. sparsifolia | 0.24 | 0.28 | 0.45 | 0.65 |
| S15 | P. hendersonii | 0.29 | 0.44 | 0.64 | 0.92 |
| S16 | L. ruthenicum | 0.50 | 0.60 | 0.99 | 0.91 |
| S17 | A. sparsifolia | 0.71 | 0.69 | 1.28 | 0.92 |
| S18 | K. caspia | 0.50 | 0.60 | 0.99 | 0.91 |
| S19 | K. caspia | 0.45 | 0.30 | 0.58 | 0.53 |
| S20 | A. sparsifolia | 0.68 | 0.72 | 1.32 | 0.95 |
| S21 | T. ramosissima | 0.37 | 0.44 | 0.64 | 0.92 |
| S22 | C. acanthophylla | 0.67 | 0.66 | 1.22 | 0.88 |
| S23 | K. eversmanniana | 0.21 | 0.44 | 0.64 | 0.92 |
| S24 | A. cretacea | 0.42 | 0.44 | 0.75 | 0.68 |
| S25 | H. ammodendron | 0.82 | 0.67 | 1.30 | 0.81 |
| S26 | H. ammodendron | 0.44 | 0.57 | 0.96 | 0.87 |
| S27 | H. ammodendron | 0.39 | 0.61 | 1.00 | 0.91 |
| S28 | K. eversmanniana | 0.47 | 0.61 | 1.02 | 0.93 |
| S29 | H. ammodendron | 0.63 | 0.63 | 1.16 | 0.84 |
Note: S1 to S29 indicated sites with serial numbers from 1 to 29.
Disclaimer/Publisher’s Note: The statements, opinions and data contained in all publications are solely those of the individual author(s) and contributor(s) and not of MDPI and/or the editor(s). MDPI and/or the editor(s) disclaim responsibility for any injury to people or property resulting from any ideas, methods, instructions or products referred to in the content. |
© 2023 by the authors. Licensee MDPI, Basel, Switzerland. This article is an open access article distributed under the terms and conditions of the Creative Commons Attribution (CC BY) license (https://creativecommons.org/licenses/by/4.0/).
Share and Cite
MDPI and ACS Style
Luo, Y.; Gong, Y. α Diversity of Desert Shrub Communities and Its Relationship with Climatic Factors in Xinjiang. Forests 2023, 14, 178. https://0-doi-org.brum.beds.ac.uk/10.3390/f14020178
AMA Style
Luo Y, Gong Y. α Diversity of Desert Shrub Communities and Its Relationship with Climatic Factors in Xinjiang. Forests. 2023; 14(2):178. https://0-doi-org.brum.beds.ac.uk/10.3390/f14020178
Chicago/Turabian StyleLuo, Yan, and Yanming Gong. 2023. "α Diversity of Desert Shrub Communities and Its Relationship with Climatic Factors in Xinjiang" Forests 14, no. 2: 178. https://0-doi-org.brum.beds.ac.uk/10.3390/f14020178
Note that from the first issue of 2016, this journal uses article numbers instead of page numbers. See further details here.