Article

Color and Chemical Composition of Timber Woods (Daniellia oliveri, Isoberlinia doka, Khaya senegalensis, and Pterocarpus erinaceus) from Different Locations in Southern Mali

by
Mohamed Traoré
1,2 and
Antonio Martínez Cortizas
1,3,*
1
CRETUS, EcoPast (GI-1553), Facultade de Bioloxía, Universidade de Santiago de Compostela, 15782 Santiago de Compostela, Spain
2
Department of Geology and Mines, Ecole Nationale d’Ingénieurs Abderhamane Baba Touré (ENI-ABT), 410 Avenue Van Vollenhoven, Bamako P.O. Box 242, Mali
3
Bolin Centre for Climate Research, Stockholm University, SE-10691 Stockholm, Sweden
*
Author to whom correspondence should be addressed.
Submission received: 4 March 2023 / Revised: 4 April 2023 / Accepted: 6 April 2023 / Published: 8 April 2023

Abstract

:
Wood characteristics and properties are related to various factors connected to the biochemical processes that occur in the tree during wood formation, but also, to the interactions with the environmental conditions at the tree growing location. In addition to climatic factors, several investigations drew attention to the significance of the influence of other environmental parameters at the tree growing location. In this perspective, this work aimed to characterize the variation in color and chemical composition of timber wood from different locations in southern Mali, of trees growing under the same climatic conditions. To do so, a total of 68 grounded wood samples, from 4 timber wood species (Daniellia oliveri, Isoberlinia doka, Khaya senegalensis, and Pterocarpus erinaceus), were analyzed using CIELab color space and FTIR-ATR. Overall, the results indicated that the variation in wood color and chemical properties can be related to the local environmental conditions. Pterocarpus erinaceus presented significant differences between samples from the three areas according to the highest number of variables (color parameters, molecular composition determined by FTIR-ATR spectroscopy, and FTIR-ATR ratios). Daniellia oliveri and Khaya senegalensis, however, showed significant differences between areas of provenance for a lower number of variables. Isoberlinia doka, for its part, showed no significant differences and seems to be less sensitive to environmental factors. Furthermore, the results revealed that important differences exist between wood samples from Kati and Kéniéba.

1. Introduction

Wood characteristics and properties (e.g., aesthetical, physical, and chemical) are important parameters that make it valuable for a given end-use [1]. In construction, wood density and other mechanical properties, as well as its natural durability, are among the most considered wood characteristics to face biotic and abiotic threats, whereas, in the art industry, the required characteristics are related to its easy manipulation for carving or a certain specific tune when referring to musical instruments [2,3,4]. It is well known that wood characteristics and properties are related to various factors connected to the biochemical processes that occur in the tree during wood formation, but also, to the interactions with the environmental conditions at the tree growing location [5]. Over the last decade, numerous studies have been carried out on a large variety of wood species, in temperate regions and in tropical regions, to unravel the biogeochemical processes that are behind the composition of this complex lignocellulosic material [6,7,8]. Despite the great advances in the field, more work is needed, especially taking advantage of the multidisciplinary aspect of wood research, to obtain a better understanding of the endogenous and exogenous factors controlling wood characteristics and properties.
The effects of the environmental conditions on wood structure and composition come out with various parameters related to the climate, as well as to physical, chemical, and biological processes at the tree growing location [9,10]. Variations of these environmental factors can be related to parameters that reflect such changes in wood structure and composition [11,12]. For instance, tree-ring width is one of the most used proxies in wood research to provide a general overview of tree growth [13,14]. The analysis of anatomical features and the structure of growth rings (earlywood width, latewood width, total ring width) provides insights into the main growth-limiting climatic factors (e.g., temperature, precipitation, drought, etc.), and enables the retrieval of information about the modification of structural features by soil moisture content, depth of groundwater table, slope, etc. [6,15]. Likewise, wood chemical composition (molecular, elemental, and isotopic) constitutes a potential means for the characterization of wood and for the understanding of the effect that the variability in environmental and climatic conditions has on the quality and properties of wood [16,17]. To our understanding, the development of these promising approaches still requires further research work in order to provide both a theoretical basis (i.e., an understanding of the factors behind wood composition and its characteristics) and a well-grounded methodological approach for wood characterization and fingerprinting (i.e., a means to determine the specific features concerning a given factor).
An increasing number of studies are conducted to develop methodological approaches, using accessible and handy analytical techniques. This approach has been important to obtain a better understanding of wood physical and chemical characteristics in relation to environmental influences. To give an example, CIELab color space parameters have been used to study the link between wood color variation and various factors, including genetic, climatic, and edaphic [18,19,20]. In a like manner, the various applications of infrared spectroscopy revealed the great potential of this technique to investigate the link between wood molecular composition and tree species, as well as the wood provenance [21,22,23,24]. Additionally, data from these techniques can be used in parallel with other parameters related to structure and composition to foster the multiproxy potentially associated with wood research disciplines [20,25,26].
The main objective of the present research is to assess the variation in the characteristics (physical and chemical) of timber wood from three different areas of provenance, in a limited geographical area, under the same climatic conditions. To do so, we have applied CIELab color space and FTIR-ATR spectroscopy to wood samples of four timber wood species (Daniellia oliveri, Isoberlinia doka, Khaya senegalensis, and Pterocarpus erinaceus) from different locations (Kéniéba, Kita, and Sibi) in southern Mali. Data analysis has been performed using uni- and multivariate statistical methods (one-way ANOVA and principal component analysis).

2. Materials and Methods

2.1. Origin of the Wood Materials and Wood Species

The wood materials used for this research belong to 11 wood cross-sections obtained from individual planks of commercialized timbers, from three different areas in Mali: Kéniéba (12°50′43″ N, 11°14′08″ W), Kita (13°1′41″ N, 9°30′5″ W), and Sibi (12°22′39″ N, 8°19′35″ W) (Figure 1). All three areas are located, under the same climatic conditions, in the Sudano–Guinean climatic zone with average annual rainfall ranging between 800 and 1200 mm, and ferralitic soils predominate [4,27]. The consideration of this geographical delimitation is related to the main purpose of this study, which intends to draw attention to other factors characterizing the local environmental conditions (e.g., location of origin) rather than climatic factors that seem to be the most studied factors driving changes in wood properties.
The 11 wood cross-sections correspond to four timber wood species: Daniellia oliveri, Isoberlinia doka, Khaya senegalensis, and Pterocarpus erinaceus, which are indigenous African tree species with a geographic distribution ranging from West to East Africa [28,29,30]. These species are associated with high natural resistance to the less favorable climatic conditions of the tropical arid Sahelian and semiarid Sudanian zones in the West African Sahel [31,32]. Further, the selected wood species are among the most used timber wood with vital importance for local economic development [33,34]. According to the IUCN Red List, D. oliveri and I. doka are registered as the least concerned species, whereas K. senegalensis and P. erinaceus are, respectively, indicated as vulnerable and threatened species [35,36,37,38]. Moreover, these species are being affected by widespread forest degradation because of increasing demand for forest products and excessive exploitation combined with the changing environmental conditions without appropriate regeneration measures [33,39].

2.2. Sample Preparation

Once at the laboratory, for different analytical purposes, each cross-section was divided into two identical parts along the radial direction. The first part was prepared following standard dendrochronological methods to improve the visibility of the growth rings and related macroscopic and microscopic features. The wood surface was manually polished with fine sandpaper (grain sizes from P600 to P1200, Federation of European Producers of Abrasives). This first part enabled us to obtain images of transverse sections, using a Leica Emspira 3 digital microscope (Leica Microsystems GmbH, Wetzlar, Germany), as presented in Figure 2. As for the second part, in the first step, it was divided along the radial direction into small pieces of 3 to 4 cm. Thereafter, a portion (10–15 g) of each wood piece was milled to a very fine powder and homogenized using a Retsch mixer mill MM 301 (Retsch GmbH, Haan, Germany), with final fineness <5 µm, and oven dried at 30 °C for two weeks before the analysis using CIELab color space and infrared spectroscopy techniques. It is worth mentioning that the main reason for milling the wood to very fine powder is related to the later application of the X-ray fluorescence techniques to determine the elemental concentrations, not to the color measurement nor the infrared spectroscopy technique.

2.3. Analytical Techniques

In total, 68 grounded wood samples (see Table 1) were analyzed with two commonly used analytical techniques for wood color and chemical characterization, under room standard temperature and humidity conditions. Color parameters were measured in the CIELab color space using a Konica-Minolta CR-5 Chroma Meter for solids (Konica Minolta Inc., Japan). The CIELab color space provides numerical values for color coordinates: lightness (L*), green–red component (a*), blue-yellow component (b*), chroma (C*), and hue (h°). The infrared spectra were recorded, using an Agilent Cary 630 FTIR Spectrometer (Agilent Technologies Inc., USA), by Fourier-transform infrared spectroscopy in attenuated total reflectance mode (FTIR-ATR). Spectra were obtained in the mid-infrared region (MIR, 4000–400 cm−1) by performing 100 scans at a resolution of 4 cm−1. Further analytical details are provided elsewhere [40,41].

2.4. Data Analysis

For the color data, data analysis addressed the color coordinates including lightness (L*), redness (a*), yellowness (b*), chroma (C*), and hue (h°). For the FTIR data, in the first place, we focused on a selected number of infrared bands on the basis of peak identification using the R package andurinha [42]. Then, we applied principal component analysis (PCA) using varimax rotation to the selected MIR bands, on the correlation mode. The extracted PCA components were further used, instead of individual FTIR bands. Finally, we calculated the following FTIR ratios: lateral order index (LOI, 1425/895), guaiacyl/syringyl ratios (1265/1230 and 1510/1595), lignin/carbohydrate ratios (1510/1460, 1510/1375, and 1510/895). These FTIR ratios mostly help to determine changes in the molecular structure of polysaccharides and lignin [43,44].
Furthermore, to evaluate whether there were significant differences between wood samples from the three areas (Kéniéba, Kita, and Sibi), for each wood species, we applied one-way analysis of variance (ANOVA) using as variables the CIELab color parameters, the extracted PCA components, and the calculated FTIR ratios.
The statistical tests, one-way ANOVA and principal component analysis, were performed using SPSS 27.

3. Results and Discussion

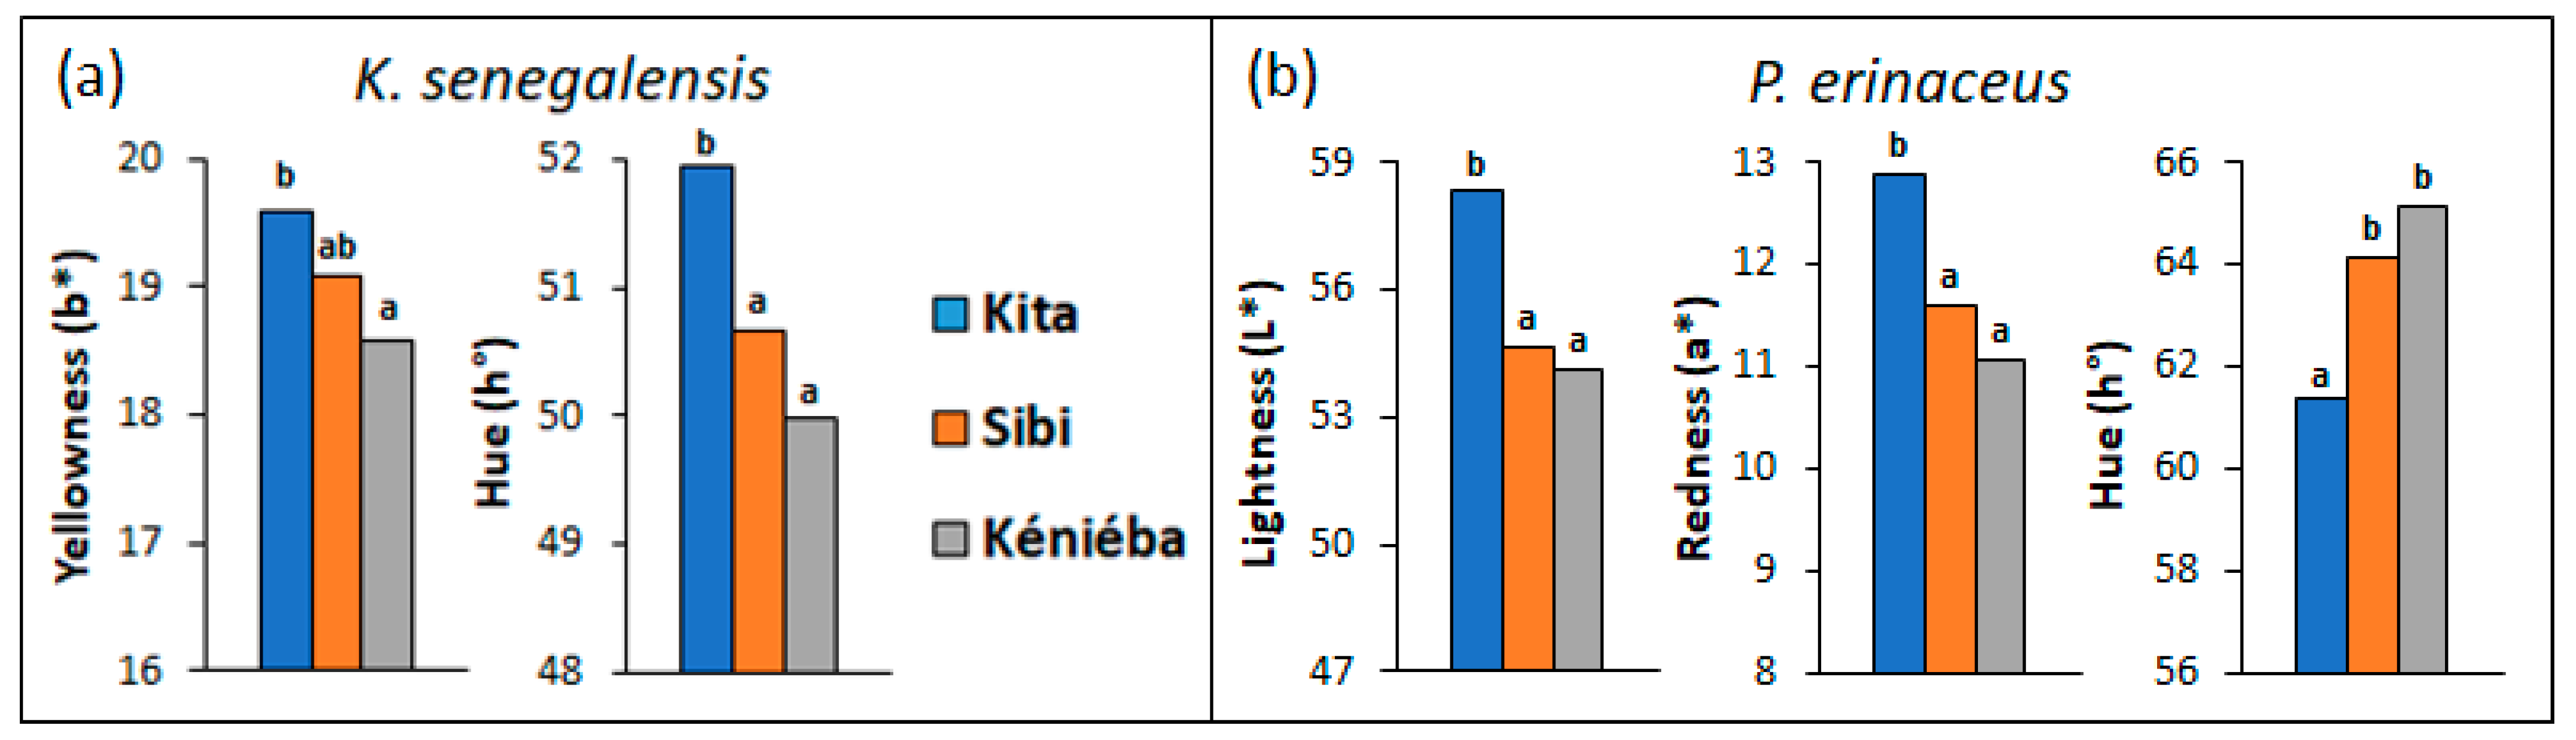
3.1. Variations in Wood Color Parameters

The color data indicated that the influence of the provenance of the wood sample can depend on the tree species. As presented in Table 2, no significant differences were observed between samples from the three areas where the timbers were collected, for Daniellia oliveri and Isoberlinia doka. However, for Khaya senegalensis and Pterocarpus erinaceus, there were significant differences between samples from the three areas. It appears that woods from Kita are highly different from woods of the two other areas (Sibi and Kéniéba). As for K. senegalensis, the highest yellowness (b*) values were associated with wood from Kita, the lowest values for Kéniéba, and intermediate values for wood from Sibi (Figure 3). Also, the highest hue (h°) values were related to wood from Kita, and wood from Sibi and Kéniéba similarly indicated the lowest h° values. Regarding P. erinaceus, woods from Kita were characterized by the highest values of lightness (L*) and redness (a*), and the lowest values were obtained for woods from Sibi and Kéniéba, which appear to be analogous. The h° values for P. erinaceus were found to be the opposite of what has been pointed out by the wood samples of K. senegalensis.
These differences observed using the wood color parameters may be related to the variation in wood contents in relation to the tree growing locations. As mentioned in various studies, wood color is connected to its chemical contents, especially the extractive compounds [45,46]. Therefore, the color characteristics of wood can result from processes linked to genetic effects but also the effects of environmental conditions at the tree growing location [20,47]. L* and a* are usually connected to the extractives and phenols, while b* is usually related to lignin and polysaccharides [46,48]. The latter may suggest that, on the one hand, the significant differences observed for the wood samples of K. senegalensis may be due to processes that control the chemical content in the wood cell walls (polysaccharides and lignins) and, on the other hand, the significant differences observed between the wood samples of P. erinaceus may be due to variation in the wood extractive contents. Similar results have been found for wood from trees growing in different environmental conditions, including different soil properties [19,49,50].

3.2. Variations in Wood FTIR Absorption Bands

The principal component analysis extracted six components (with 26, 25, 14, 13, 10, and 7% of explained variance, respectively) that explained about 95% of the total variance in the dataset. All the selected bands showed a communality value above 0.85. The first component (PC1) is characterized by large positive loadings for bands related to vibrations in aromatic rings and in carboxylic groups in lignin (near 1623, 1606, and 1592 cm−1) and wagging in crystalline cellulose (at 1318 cm−1); and large negative loadings for bands associated with carbonyl vibration in ester and acetyl groups in hemicellulose (near 1735, 1720 and 1703 cm−1) (Table 3). The second component, PC2, shows positive loadings for vibrations related to the molecular structure in guaiacyl and syringyl lignin moieties (1510, 1264, 1245, 1228, and 822 cm−1), C-H deformation in lignin and carbohydrates (1461 cm−1), C-H out of plane in cellulose (895 cm−1), and negative loadings for O-H bond vibration of absorbed water on cellulose (near 3323 and 1655 cm−1) (Table 3). Regarding the third and fourth components (PC3 and PC4), they are characterized by large positive loadings for methyl and methylene stretching of aliphatic structures in cellulose and in extractive compounds (2935, 2922, and 2853 cm−1) and C-O stretching in polysaccharides (1055, 1031, 1019, and 986 cm−1), respectively (Table 3). The fifth component, PC5, is characterized by positive loadings for methoxyl and aromatic skeletal vibrations in lignin and in extractive compounds (near 1560, 1543, and 1422 cm−1). The last extracted component, PC6, presents positive loadings for bands associated with C-O-C stretching in cellulose (1124 and 1107 cm−1) (Table 3). For more insight, the average relative absorption spectra of the wood species with the associated assignment for the absorption bands are presented in Figure 4.
The one-way ANOVA applied to the PCA component scores enabled us to identify the components that show differences between wood samples from the three geographical areas. A summary of this statistical analysis is provided in Table 4. It appears evident that the significance of differences, based on FTIR data, between the sources of the studied samples depends on the wood species. For instance, no significant differences were observed for I. doka, whereas significant differences were shown by D. oliveri for PC4, by K. senegalensis for PC3 and PC4, and by P. erinaceus for PC5 and PC6. Overall, samples from Kita and Kéniéba showed high component scores (Figure 5). For D. oliveri, the samples from Kéniéba were associated with positive scores of PC4, whereas samples from Kita and Sibi were similarly associated with negative scores of PC4. As for K. senegalensis, woods from Kita were associated with negative scores of PC3 and positive scores of PC4, whereas woods from Kéniéba were characterized by positive scores of PC3 and negative scores of PC4. For both PC3 and PC4, intermediate values of component scores were related to wood from Sibi, and regarding P. erinaceus, the woods from Kita were associated with negative scores of PC5 and PC6, whereas woods from Sibi and Kéniéba were similarly associated with positive scores of PC5 and PC6.
From the results described above, the FTIR signal related to the main macromolecules (cellulose, hemicellulose, and lignin) and extractive contents can be explored to evaluate the relation between the variations in wood characteristics and provenance of the studied timber wood. Again, it seems that the wood of the studied tree species was not equally affected by the different local environmental conditions. These results suggest that glycosidic bonds (in polysaccharides) and aliphatic structures (in polysaccharides and extractives) are the most indicative of the identified chemical variations in relation to the origin of the wood samples for D. oliveri and K. senegalensis. In fact, the variation in polysaccharide contents in wood can also be linked to the degree of disturbance related to the environmental conditions at the tree growing location [17,51]. Thus, we could conclude that the local environmental conditions at Kéniéba and Kita have a significant influence on the polysaccharide contents of wood of D. oliveri and K. senegalensis, respectively. This result is also in agreement with what has been described earlier for the color data, for K. senegalensis, about the significant differences showed by the yellowness (b*) values, which can be related to the polysaccharide contents [46,48]. Nevertheless, we should also draw attention to the fact that biochemical responses to environmental factors may vary depending on the wood species [51]. Furthermore, for P. erinaceus, it seems that extractive compounds with aromatic structures are also indicative of changes that differentiate between wood from different provenance areas. Previous studies on this wood species, in Togo and in Mali (West Africa), revealed that its extractive contents depend on the soil properties at the tree growing location [4,52]. Finally, these findings highlight that wood chemistry and biochemical processes of wood formation are also related to environmental factors other than climate [9,53].

3.3. Variations in Wood FTIR Ratios

The one-way ANOVA applied to the FTIR ratios dataset revealed the possibility to differentiate the wood samples of the three studied areas. The summary of these results is provided in Table 5. No significant differences were found for samples of I. doka and K. senegalensis, whereas significant differences were found for D. oliveri based on the guaiacyl/syringyl (GS2, 1510/1595) and lignin/carbohydrate (LC1, 1510/1460; LC2, 1510/1375; and LC3, 1510/895) ratios, and for P. erinaceus for all the considered ratios (Table 5). Again, as illustrated in Figure 6, samples from Kita and Kéniéba stand out by the average values of the FTIR ratios. For D. oliveri, samples from the areas of Kita and Sibi appeared to be very much alike with positive values of the FTIR ratios, whereas samples from the area of Kéniéba were associated with negative values of the FTIR ratios. Regarding P. erinaceus, all FTIR ratios except for the guaiacyl/syringyl ratio (GS1, 1265/1230) showed significantly lower values for Kita, as compared to Sibi and Kéniéba, which presented similar values. In contrast, the 1265/1230 ratio values were significantly higher for wood from Kita than for the wood from Sibi and Kéniéba.
The results of the FTIR ratios for D. oliveri and P. erinaceus suggest that they can be used to assess the changes in the molecular structure of the wood cell walls macromolecules related to provenance. Each of the calculated FTIR ratios is somehow connected to specific chemical characteristics. For instance, the ratio 1425/895, also known as the lateral order index (LOI), is an empirical crystallinity index that is associated with the number of crystalline structures of cellulose [43,54]. The guaiacy/syringyl ratios (1265/1230 and 1510/1595) inform about the molecular structure of the lignin contents and the relative number of methoxyl groups in guaiacyl and syringyl nuclei [55,56]. The lignin/carbohydrate ratios (1510/1460, 1510/1375, and 1510/895) are indicative of the relative proportion of lignin and polysaccharide compounds [44,57]. Thus, according to the results of the FTIR ratios, it can be deduced that, for D. oliveri, the wood samples from Kéniéba are characterized by a higher proportion of syringyl than guaiacyl groups in the molecular structure of lignin compounds and the highest proportion of polysaccharide compounds. As for P. erinaceus, the wood samples from Kita appear to be associated with the less ordered crystalline structure in cellulose, the highest proportion of methoxyl groups in the syringyl nuclei of lignin compounds, and the lowest proportion of polysaccharide compounds. Moreover, the known correlation between the lignin/carbohydrate ratio suggests that P. erinaceus wood from Kita may have lower mechanical strength in comparison to P. erinaceus wood from Sibi and Kéniéba [58,59].

4. Conclusions

The main conclusion of the study is that the variation in wood color and chemical properties can be related to the local environmental conditions at the tree growing locations. Since the three studied areas are under the Sudano–Guinean climatic zone, the observed variations in wood properties are most likely connected to the local soil properties and/or landforms. Additionally, it was clear that the studied tree species were not equally affected by the different local environmental conditions. P. erinaceus appears to be the most sensitive species, as it presented significant differences between samples from the three areas for the largest number of variables (color parameters, PCA components, and FTIR-ATR ratios) used in this research. D. oliveri and K. senegalensis, however, showed significant differences between sample provenance for a lower number of variables. I. doka, for its part, showed no significant differences. Furthermore, the results revealed that important differences exist between wood samples from Kati and Kéniéba; these differences are related to color parameters (redness (a*) and hue (h°)), as well as a number of FTIR signals related to chemical content in the wood cell walls (polysaccharides and lignins).
Finally, from this work, we believe that other factors characterizing the local environmental conditions (e.g., soil properties) rather than climatic factors can drive significant changes in wood properties. Certainly, further research could help to determine specific links between wood properties (physical and chemical) and environmental factors (e.g., soil factors) that are not necessarily climatic.

Author Contributions

Conceptualization, M.T. and A.M.C.; methodology, M.T. and A.M.C.; investigation, M.T. and A.M.C.; resources, M.T. and A.M.C.; data curation, M.T. and A.M.C.; writing—original draft preparation, M.T.; writing—review and editing, M.T. and A.M.C.; supervision, A.M.C. All authors have read and agreed to the published version of the manuscript.

Funding

This research is funded by Grupos de Referencia Competitiva (ED431C 2021/32) by Xunta de Galicia. It was developed within the framework of the visiting fellowship program for African researchers (Programa BECAS ÁFRICA-MED 2021-2022) of the Spanish Agency for International Development Cooperation (AECID). MT is currently funded by Plan Galego I2C Modalidade A (ED481B-2022-017).

Data Availability Statement

The data presented in this study are available on request from the corresponding author.

Acknowledgments

The authors would like to thank Bakary Traoré (Katibougou IPR/IFRA, Mali) who provided the wood samples. Also, the authors would like to thank the editors and reviewers for their time and insightful suggestions that helped to improve our manuscript.

Conflicts of Interest

The authors declare no conflict of interest. And the funders had no role in the design of the study; in the collection, analyses, or interpretation of data; in the writing of the manuscript; or in the decision to publish the results.

References

  1. Jozsa, L.A.; Middleton, G.R. A Discussion of Wood Quality Attributes and Their Practical Implications; Forintek Canada Corporation Special Publication No. SP-34; Forintek Canada Corporation: Vancouver, BC, Canada, 1944. [Google Scholar]
  2. Rowell, R.M.; Pettersen, R.; Han, J.S.; Rowell, J.S.; Tshabalala, M.A. Cell Wall Chemistry. In Handbook of Wood Chemistry and Wood Composites; Rowell, R.M., Ed.; CRC Press: Boca Raton, FL, USA, 2005. [Google Scholar]
  3. Wegst, U.G. Wood for sound. Am. J. Bot. 2006, 93, 1439–1448. [Google Scholar] [CrossRef] [PubMed]
  4. Traoré, B.; Brancheriau, L.; Perré, P.; Stevanovic, T.; Diouf, P. Acoustic quality of vène wood (Pterocarpus erinaceus Poir.) for xylophone instrument manufacture in Mali. Ann. For. Sci. 2010, 67, 815. [Google Scholar] [CrossRef] [Green Version]
  5. Fengel, D.; Wegener, G. Wood: Chemistry, Ultrastructure, Reactions; Walter de Gruyter: Berlin, Germany, 1984. [Google Scholar]
  6. Nabais, C.; Hansen, J.K.; David-Schwartz, R.; Klisz, M.; Lopez, R.; Rozenberg, P. The effect of climate on wood density: What provenance trials tell us? For. Ecol. Manag. 2018, 408, 148–156. [Google Scholar] [CrossRef]
  7. Hevia, A.; Campelo, F.; Chambel, R.; Vieira, J.; Alía, R.; Majada, J.; Sánchez-Salguero, R. Which matters more for wood traits in Pinus halepensis Mill., provenance or climate? Ann. For. Sci. 2020, 77, 55. [Google Scholar] [CrossRef]
  8. Moya, R.; Gaitan-Alvarez, J.; Berrocal, A.; Caceres, C.B.; Hernandez, R.E. Wood properties of nine acetylated tropical hardwoods from fast-growth plantations in Costa Rica. Wood Fiber Sci. 2022, 54, 134–148. [Google Scholar] [CrossRef]
  9. Fritts, H.C. Tree Rings and Climate; Academic Press: Cambridge, MA, USA, 1976. [Google Scholar]
  10. Côté, B.; Hendershot, W.H.; Fyles, J.W.; Roy, A.G.; Bradley, R.; Biron, P.M.; Courchesne, F. The phenology of fine root growth in a maple-dominated ecosystem: Relationships with some soil properties. Plant Soil 1998, 201, 59–69. [Google Scholar] [CrossRef]
  11. Fritts, H.C.; Swetnam, T.W. Dendroecology: A tool for evaluating variations in past and present forest environments. Adv. Ecol. Res. 1989, 19, 111–188. [Google Scholar]
  12. Schweingruber, F.H. Trees and Wood in Dendrochronology: Morphological, Anatomical, and Tree-Ring Analytical Characteristics of Trees Frequently used in Dendrochronology; Springer Science & Business Media: Berlin/Heidelberg, Germany, 2012. [Google Scholar]
  13. Hughes, M.K. Dendrochronology in climatology—The state of the art. Dendrochronologia 2002, 20, 95–116. [Google Scholar] [CrossRef]
  14. Sass-Klaassen, U. Tree physiology: Tracking tree carbon gain. Nat. Plants 2015, 1, 15175. [Google Scholar] [CrossRef]
  15. Ibanez, T.; Chave, J.; Barrabé, L.; Elodie, B.; Boutreux, T.; Trueba, S.; Vandrot, H.; Birnbaum, P. Community variation in wood density along a bioclimatic gradient on a hyper-diverse tropical island. J. Veg. Sci. 2017, 28, 19–33. [Google Scholar] [CrossRef]
  16. Jansen, K.; Sohrt, J.; Kohnle, U.; Ensminger, I.; Gessler, A. Tree ring isotopic composition, radial increment and height growth reveal provenance-specific reactions of Douglas-fir towards environmental parameters. Trees 2013, 27, 37–52. [Google Scholar] [CrossRef]
  17. Kusiak, W.; Majka, J.; Ratajczak, I.; Górska, M.; Zborowska, M. Evaluation of environmental impact on selected properties of lime (Tilia cordata Mill.) wood. Forests 2020, 11, 746. [Google Scholar] [CrossRef]
  18. Sotelo Montes, C.; Hernández, R.E.; Beaulieu, J.; Weber, J.C. Genetic variation in wood color and its correlations with tree growth and wood density of Calycophyllum spruceanum at an early age in the Peruvian Amazon. New For. 2008, 35, 57–73. [Google Scholar] [CrossRef]
  19. Moya, R.; Calvo-Alvarado, J. Variation of wood color parameters of Tectona grandis and its relationship with physical environmental factors. Ann. For. Sci. 2012, 69, 947–959. [Google Scholar] [CrossRef] [Green Version]
  20. Bessa, F.; Sousa, V.; Quilhó, T.; Pereira, H. An Integrated Similarity Analysis of Anatomical and Physical Wood Properties of Tropical Species from India, Mozambique, and East Timor. Forests 2022, 13, 1675. [Google Scholar] [CrossRef]
  21. Rana, R.; Müller, G.; Naumann, A.; Polle, A. FTIR spectroscopy in combination with principal component analysis or cluster analysis as a tool to distinguish beech (Fagus sylvatica L.) trees grown at different sites. Holzforschung 2008, 62, 530–538. [Google Scholar] [CrossRef]
  22. Santoni, I.; Callone, E.; Sandak, A.; Sandak, J.; Dirè, D. Solid state NMR and IR characterization of wood polymer structure in relation to tree provenance. Carbohydr. Polym. 2015, 17, 710–721. [Google Scholar] [CrossRef]
  23. Sharma, V.; Yadav, J.; Kumar, R.; Tesarova, D.; Ekielski, A.; Mishra, P.K. On the rapid and non-destructive approach for wood identification using ATR-FTIR spectroscopy and chemometric methods. Vib. Spectrosc. 2020, 110, 103097. [Google Scholar] [CrossRef]
  24. Toscano, G.; Maceratesi, V.; Leoni, E.; Stipa, P.; Laudadio, E.; Sabbatini, S. FTIR spectroscopy for determination of the raw materials used in wood pellet production. Fuel 2022, 313, 123017. [Google Scholar] [CrossRef]
  25. Schollaen, K.; Baschek, H.; Heinrich, I.; Slotta, F.; Pauly, M.; Helle, G. A guideline for sample preparation in modern tree-ring stable isotope research. Dendrochronologia 2017, 44, 133–145. [Google Scholar] [CrossRef] [Green Version]
  26. Domínguez-Delmás, M.; Rich, S.; Traoré, M.; Hajj, F.; Poszwa, A.; Akhmetzyanov, L.; García-González, I.; Groenendijk, P. Tree-ring chronologies, stable strontium isotopes and biochemical compounds: Towards reference datasets to provenance Iberian shipwreck timbers. J. Archaeol. Sci. Rep. 2020, 34, 102640. [Google Scholar] [CrossRef]
  27. Konaré, D. Équations allométriques pour l’évaluation de la biomasse foliaire de trois espèces ligneuses fourragères. Cas de Afzelia africana, Ficus gnaphalocarpa et Pterocarpus erinaceus, des parcours naturels du cercle de Kéniéba au Sud-Ouest du Mali. Rev. Afr. Des Sci. Soc. Et De La Sante Publique 2019, 1, 29–52. [Google Scholar]
  28. Orwa, C.; Mutua, A.; Kindt, R.; Jamnadass, R.; Simons, A. Agroforestree Database: A Tree Reference and Selection Guide Version 4.0.; World Agroforestry Centre: Nairobi, Kenya, 2009. [Google Scholar]
  29. Segla, K.N.; Adjonou, K.; Rabiou, H.; André Bationo, B.; Mahamane, A.; Guibal, D.; Kokou, K.; Chaix, G.; Kokutse, A.D.; Langbour, P. Relations between the ecological conditions and the properties of Pterocarpus erinaceus Poir. wood from the Guinean-Sudanian and Sahelian zones of West Africa. Holzforschung 2020, 74, 999–1009. [Google Scholar] [CrossRef]
  30. Sanogo, K.; Gebrekirstos, A.; Bayala, J.; van Noordwijk, M. Climate-growth relationships of Daniellia oliveri (Rolfe) Hutch. & Dalziel in the Sudanian zone of Mali, West Africa. Trees For. People 2022, 10, 100333. [Google Scholar]
  31. Hänke, H.; Börjeson, L.; Hylander, K.; Enfors-Kautsky, E. Drought tolerant species dominate as rainfall and tree cover returns in the West African Sahel. Land Use Policy 2016, 59, 111–120. [Google Scholar] [CrossRef] [Green Version]
  32. Hérault, B.; N’guessan, A.K.; Ahoba, A.; Bénédet, F.; Coulibaly, B.; Doua-Bi, Y.; Koffi, T.; Koffi-Konan, J.C.; Konaté, I.; Tiéoulé, F.; et al. The long-term performance of 35 tree species of sudanian West Africa in pure and mixed plantings. For. Ecol. Manag. 2020, 468, 118171. [Google Scholar] [CrossRef]
  33. Brandt, M.; Romankiewicz, C.; Spiekermann, R.; Samimi, C. Environmental change in time series–An interdisciplinary study in the Sahel of Mali and Senegal. J. Arid Environ. 2014, 105, 52–63. [Google Scholar] [CrossRef]
  34. Faye, M.D.; Weber, J.C.; Abasse, T.A.; Boureima, M.; Larwanou, M.; Bationo, A.B.; Diallo, B.O.; Sigué, H.; Dakouo, J.M.; Samaké, O.; et al. Farmers’ preferences for tree functions and species in the West African Sahel. For. Trees Livelihoods 2011, 20, 113–136. [Google Scholar] [CrossRef]
  35. World Conservation Monitoring Centre. Khaya senegalensis. In The IUCN Red List of Threatened Species; e.T32171A9684583; World Conservation Monitoring Centre: Cambridge, UK, 1998. [Google Scholar]
  36. Contu, S. Isoberlinia doka. In The IUCN Red List of Threatened Species; e.T19892774A20090324; World Conservation Monitoring Centre: Cambridge, UK, 2012. [Google Scholar]
  37. Barstow, M. Pterocarpus erinaceus. In The IUCN Red List of Threatened Species; e.T62027797A62027800; World Conservation Monitoring Centre: Cambridge, UK, 2018. [Google Scholar]
  38. Botanic Gardens Conservation International (BGCI); IUCN SSC Global Tree Specialist Group. Daniellia oliveri. In The IUCN Red List of Threatened Species; e.T144315321A149026856; World Conservation Monitoring Centre: Cambridge, UK, 2019. [Google Scholar]
  39. Ky-Dembele, C.; Bayala, J.; Kalinganire, A.; Traoré, F.T.; Koné, B.; Olivier, A. Vegetative propagation of twelve fodder tree species indigenous to the Sahel, West Africa. South. For. A J. For. Sci. 2016, 78, 185–192. [Google Scholar] [CrossRef]
  40. Martínez Cortizas, A.; López-Costas, O.; Orme, L.; Mighall, T.; Kylander, M.E.; Bindler, R.; Gallego Sala, Á. Holocene atmospheric dust deposition in NW Spain. Holocene 2020, 30, 507–518. [Google Scholar] [CrossRef] [Green Version]
  41. Traoré, M.; Kaal, J.; Martínez Cortizas, A. Variation of wood color and chemical composition in the stem cross-section of oak (Quercus spp.) trees, with special attention to the sapwood-heartwood transition zone. Spectrochim. Acta Part A Mol. Biomol. Spectrosc. 2023, 285, 121893. [Google Scholar] [CrossRef] [PubMed]
  42. Álvarez Fernández, N.; Martínez Cortizas, A. Andurinha: Make Spectroscopic Data Processing Easier; R Package Version 0.0.2.; R Foundation for Statistical Computing: Vienna, Austria, 2020. [Google Scholar]
  43. Auxenfans, T.; Crônier, D.; Chabbert, B.; Paës, G. Understanding the structural and chemical changes of plant biomass following steam explosion pretreatment. Biotechnol. Biofuels 2017, 10, 36. [Google Scholar] [CrossRef] [PubMed] [Green Version]
  44. Popescu, M.C.; Popescu, C.M.; Lisa, G.; Sakata, Y. Evaluation of morphological and chemical aspects of different wood species by spectroscopy and thermal methods. J. Mol. Struct. 2011, 988, 65–72. [Google Scholar] [CrossRef]
  45. Klumpers, J.; Janin, G.; Becker, M.; Lévy, G. The influences of age, extractive content and soil water on wood color in oak: The possible genetic determination of wood color. In Annales des Sciences Forestières; EDP Sciences: Les Ulis, France, 1993; Volume 50, pp. 403s–409s. [Google Scholar]
  46. Gierlinger, N.; Jacques, D.; Grabner, M.; Wimmer, R.; Schwanninger, M.; Rozenberg, P.; Pâques, L.E. Colour of larch heartwood and relationships to extractives and brown-rot decay resistance. Trees 2004, 18, 102–108. [Google Scholar] [CrossRef]
  47. Moya, R.; Berrocal, A. Wood colour variation in sapwood and heartwood of young trees of Tectona grandis and its relationship with plantation characteristics, site, and decay resistance. Ann. For. Sci. 2010, 67, 109. [Google Scholar] [CrossRef] [Green Version]
  48. Moya, R.; Fallas, R.S.; Bonilla, P.J.; Tenorio, C. Relationship between wood color parameters measured by the CIELab system and extractive and phenol content in Acacia mangium and Vochysia guatemalensis from fast-growth plantations. Molecules 2012, 17, 3639–3652. [Google Scholar] [CrossRef] [Green Version]
  49. Nelson, N.D.; Maeglin, R.R.; Wahlgren, H.E. Relationship of black walnut wood color to soil properties and site. Wood Fiber Sci. 1969, 1, 29–37. [Google Scholar]
  50. Sotelo Montes, C.; Weber, J.C.; Silva, D.A.; Andrade, C.; Muñiz, G.I.; Garcia, R.A.; Kalinganire, A. Effects of region, soil, land use, and terrain type on fuelwood properties of five tree/shrub species in the Sahelian and Sudanian ecozones of Mali. Ann. For. Sci. 2012, 69, 747–756. [Google Scholar] [CrossRef]
  51. Zhang, P.; Wu, F.; Kang, X. Chemical properties of wood are under stronger genetic control than growth traits in Populus tomentosa Carr. Ann. For. Sci. 2015, 72, 89–97. [Google Scholar] [CrossRef] [Green Version]
  52. Segla, K.N.; Kokutse, A.D.; Adjonou, K.; Langbour, P.; Chaix, G.; Guibal, D.; Kokou, K. Caractéristiques biophysiques du bois de Pterocarpus erinaceus (Poir.) en zones guinéenne et soudanienne au Togo. Bois Forêts Trop. 2015, 324, 51–64. [Google Scholar] [CrossRef] [Green Version]
  53. Creber, G.T.; Chaloner, W.G. Influence of environmental factors on the wood structure of living and fossil trees. Bot. Rev. 1984, 50, 357–448. [Google Scholar] [CrossRef]
  54. Nelson, M.L.; O’Connor, R.T. Relation of certain infrared bands to cellulose crystallinity and crystal lattice type. Part II. A new infrared ratio for estimation of crystallinity in celluloses I and II. J. Appl. Polym. Sci. 1964, 8, 1325–1341. [Google Scholar] [CrossRef]
  55. Colom, X.; Carrillo, F. Comparative study of wood samples of the northern area of Catalonia by FTIR. J. Wood Chem. Technol. 2005, 25, 1–11. [Google Scholar] [CrossRef]
  56. Popescu, C.M.; Singurel, G.; Popescu, M.C.; Vasile, C.; Argyropoulos, D.S.; Willför, S. Vibrational spectroscopy and X-ray diffraction methods to establish the differences between hardwood and softwood. Carbohydr. Polym. 2009, 77, 851–857. [Google Scholar] [CrossRef]
  57. Pandey, K.K. A note on the influence of extractives on the photo-discoloration and photo-degradation of wood. Polym. Degrad. Stab. 2005, 87, 375–379. [Google Scholar] [CrossRef]
  58. Whetten, R.W.; MacKay, J.J.; Sederoff, R.R. Recent advances in understanding lignin biosynthesis. Annu. Rev. Plant Biol. 1998, 49, 585–609. [Google Scholar] [CrossRef]
  59. Novaes, E.; Kirst, M.; Chiang, V.; Winter-Sederoff, H.; Sederoff, R. Lignin and Biomass: A Negative Correlation for Wood Formation and Lignin Content in Trees. Plant Physiol. 2010, 154, 555–561. [Google Scholar] [CrossRef] [Green Version]
Figure 1. Map showing the area of origin of the studied woods.
Forests 14 00767 g001
Figure 2. Transverse sections images of the studied wood. DO for Daniellia oliveri, ID for Isoberlinia doka, KS for Khaya senegalensis, and PE for Pterocarpus erinaceus. Z1, Z2, and Z3 refer to Kita, Sibi, and Kéniéba, respectively.
Forests 14 00767 g002
Figure 3. Bar chart of the mean values of color parameters showing significant differences between samples from the three areas; (a) for K. senegalensis (n = 8 for Kita, n = 8 for Sibi and n = 8 for Kéniéba), (b) for P. erinaceus (n = 6 for Kita, n = 5 for Sibi and n = 6 for Kéniéba); (the labels a, ab, and b refer to group classification in ascending order of the Student–Newman–Keuls post-hoc test).
Forests 14 00767 g003
Figure 4. Average FTIR absorption spectra of the studied wood species, indicating the related bond vibrations for FTIR absorption bands.
Forests 14 00767 g004
Figure 5. Bar chart of the mean values of component scores of PCA factors showing significant differences between samples from the three areas; (a) for D. oliveri (n = 5 for Kita, n = 6 for Sibi and n = 6 for Kéniéba), (b) for K. senegalensis (n = 8 for Kita, n = 8 for Sibi and n = 8 for Kéniéba), and (c) for P. erinaceus (n = 6 for Kita, n = 5 for Sibi and n = 6 for Kéniéba); (the labels a, ab, and b refer to group classification in ascending order of the Student–Newman–Keuls post-hoc test).
Forests 14 00767 g005
Figure 6. Bar chart of the mean values of FTIR ratios showing significant differences between samples from the three areas; (a) for D. oliveri (n = 5 for Kita, n = 6 for Sibi and n = 6 for Kéniéba), (b) for P. erinaceus (n = 6 for Kita, n = 5 for Sibi and n = 6 for Kéniéba); (the labels a, ab, and b refer to group classification in ascending order of the Student–Newman–Keuls post-hoc test).
Forests 14 00767 g006
Table 1. Total number of samples (per species and area) analyzed using CIELab and FTIR-ATR.
Wood SpeciesKéniébaKitaSibiTotal
Daniellia oliveri65617
Isoberlinia doka55-10
Khaya senegalensis88824
Pterocarpus erinaceus66517
Total68
Table 2. Summary of the one-way ANOVA using the CIELab color parameters.
Wood SpeciesColor ParametersMeanSDdfFSig.
Daniellia oliveriLightness (L*)60.142.1020.780.48
Redness (a*)8.240.2923.010.08
Yellowness (b*)25.331.6420.580.57
Chroma (C*)26.651.5720.540.59
Hue (h°)71.921.2321.390.28
Isoberlinia dokaLightness (L*)47.824.1210.120.74
Redness (a*)14.880.5810.470.51
Yellowness (b*)18.080.9310.330.58
Chroma (C*)23.420.9010.030.87
Hue (h°)50.521.5411.120.32
Khaya senegalensisLightness (L*)50.863.1822.680.09
Redness (a*)15.530.5220.700.51
Yellowness (b*)19.090.6627.630.00 (1)
Chroma (C*)24.610.6622.160.14
Hue (h°)50.871.2329.110.00 (1)
Pterocarpus erinaceusLightness (L*)55.763.2024.250.04 (2)
Redness (a*)11.871.0928.290.00 (1)
Yellowness (b*)23.830.8520.370.70
Chroma (C*)26.650.6220.910.43
Hue (h°)63.522.6424.910.02 (2)
(1) significant differences at p < 0.01; and (2) significant differences at p < 0.05.
Table 3. List of FTIR bands (with loading values) in relation to the extracted PCA components.
PC1PC2PC3PC4PC5PC6
Bands with positive loadings1623 (0.94)822 (0.91)2922 (0.92)1019 (0.96)1422 (0.79)1107 (0.77)
1606 (0.87)1245 (0.91)2935 (0.92)986 (0.91)1543 (0.76)1124 (0.61)
1592 (0.86)1228 (0.89)2853 (0.89)1031 (0.91)1560 (0.67)
1318 (0.74)1264 (0.82) 1055 (0.71)1375 (0.55)
895 (0.78) 1159 (0.52)
1510 (0.64)
1461 (0.64)
Bands with negative loadings1735 (−0.86)1655 (−0.70)
1720 (−0.86)3323 (−0.62)
1703 (−0.83)
Table 4. Summary of the one-way ANOVA using component scores of PCA components.
Wood SpeciesPCA ComponentdfFSig.
Daniellia oliveriPC120.210.81
PC220.410.67
PC320.420.66
PC426.990.01 (1)
PC520.440.65
PC623.030.08
Isoberlinia dokaPC111.540.25
PC210.010.92
PC310.150.71
PC410.000.99
PC512.930.13
PC610.350.57
Khaya senegalensisPC121.390.27
PC221.300.29
PC325.500.01 (2)
PC424.510.02 (2)
PC520.490.62
PC622.250.13
Pterocarpus erinaceusPC123.500.06
PC223.400.06
PC322.870.09
PC421.150.35
PC5212.080.00 (1)
PC624.560.03 (2)
(1) significant differences at p < 0.01; and (2) significant differences at p < 0.05.
Table 5. Summary of the one-way ANOVA using FTIR ratios.
Wood SpeciesFTIR RatiosdfFSig.
Daniellia oliveri1425/895 (LOI)20.720.50
1265/1230 (GS1)21.180.34
1510/1595 (GS2)24.530.03 (2)
1510/1460 (LC1)25.590.02 (2)
1510/1375 (LC2)24.340.03 (2)
1510/895 (LC3)24.260.04 (2)
Isoberlinia doka1425/895 (LOI)12.380.16
1265/1230 (GS1)10.010.94
1510/1595 (GS2)10.220.65
1510/1460 (LC1)10.000.96
1510/1375 (LC2)10.320.59
1510/895 (LC3)10.320.59
Khaya senegalensis1425/895 (LOI)20.400.67
1265/1230 (GS1)23.420.05
1510/1595 (GS2)22.430.11
1510/1460 (LC1)20.900.42
1510/1375 (LC2)21.800.19
1510/895 (LC3)21.400.27
Pterocarpus erinaceus1425/895 (LOI)218.240.00 (1)
1265/1230 (GS1)218.230.00 (1)
1510/1595 (GS2)26.010.01 (2)
1510/1460 (LC1)25.290.02 (2)
1510/1375 (LC2)23.650.05
1510/895 (LC3)28.190.00 (1)
(1) significant differences at p < 0.01; and (2) significant differences at p < 0.05.
Disclaimer/Publisher’s Note: The statements, opinions and data contained in all publications are solely those of the individual author(s) and contributor(s) and not of MDPI and/or the editor(s). MDPI and/or the editor(s) disclaim responsibility for any injury to people or property resulting from any ideas, methods, instructions or products referred to in the content.

