1. Introduction
A recent change in German forestry has been the increased use of mechanized forest operations, particularly when considering the cut-to-length (CTL) method [
1]. In a fully mechanized CTL system, a harvester is commonly used to fell, delimb, and buck the stem into logs of various lengths directly on the machine operating trail after which a forwarder is used to transport the processed logs to the roadside or to a landing area. Harvesters were first introduced in Germany during the 1990 large-scale wind-throws, which uprooted about 72.5 million m
3 of wood and required a sudden widespread increase of mechanized operations to safely and efficiently harvest the unusually large amount of wood [
2]. Nowadays, hundreds of harvesters are in use in Germany and they are the most common machines encountered in mechanized operations [
3]. The proven benefits of fully-mechanized harvesting systems are the increased work safety, the combination of different working steps into one process, and increased monetary profits via higher productivity and efficiency [
4]. Currently, about 60% of all wood harvested from German public forests is with mechanized forest operations and from this proportion, the entirety is with the cut-to-length (CTL) method [
1]. While tree size and shape have less influence on the feasibility of chainsaw operations, harvesters can reach their operational limit with large diameter trees or with trees exhibiting relatively large diameters and complex root systems, thus potentially leaving high stumps in the forest. Such stumps can be unwanted obstacles making it difficult to maneuver machines through the forest or transport wood without damaging residual trees. Additionally, the Food and Agriculture Organization of the United Nations suggests stump height should be as low as practicable and identifies 30 cm or lower as a preferable threshold to maximize merchantable volume [
5]. With advancements in machine design and with specific requirements from third-party certification programs, it is not uncommon to see alterations in the design/layout of machine operating trails. Any modification in spatial alignment or spacing of machine operating trails will entail that some new trails have to be created in areas that were previously in the leave strip (area adjacent to two trails). It should also be of interest to harvest as much woody biomass as possible and produce logs of longer length, especially in the lower section of the tree, where the diameter is the greatest and normally presents fewer irregularities and, thus, providing higher returns.
Concerning woody biomass, measurements done throughout the last century were mostly performed manually with simple techniques, tables, and often relying on estimations rather than actual measurements. The terrestrial laser scanner (TLS), on the other hand, provides a relatively easy, fast, and precise method to scan and measure forest structures by sending out an infrared laser beam scanning the surrounding environment on the millimeter scale. This is of particular importance when the scanning subjects have an irregular shape, such as tree stumps. The TLS is a non-intrusive and non-destructive measurement device that allows for repeated measurements at the exact same locations. Initially developed to address issues in the industrial building sector, the use of TLS in forestry settings is increasing in frequency. TLS data have already been used to estimate forest structures such as sub-canopy architecture [
6], leaf area index [
7,
8,
9], tree height, diameter and diameter at breast height [
10,
11,
12,
13,
14,
15], and specific tree properties, such as stem volume [
14] and crown characteristics [
16,
17,
18,
19]. Regarding stump measurements, TLS was used to assess above-ground stump biomass and the associated indirect emission of bioenergy [
20]. The most noticeable advantages of this system are the possibilities of capturing data without disturbing the forest environment. Once recorded, the data can be used to measure variables of interest without the need to revisit the study area if further information is missing. Despite the research and advancements listed above, very limited research has been completed with TLS to measure stump characteristics in order to investigate the influence of above-ground root collar on stump height following mechanized felling.
To allow mechanized forest operations to be as effective as possible, it is necessary to identify and understand physical barriers that might influence the height at which a tree can be cut and felled. Such a barrier might be the stump diameter. Each harvesting head has a limited range of stem diameters which can be cut. The diameter can be limited either by the opening of the feed-rollers or the length of the saw bar. If the diameter close to the ground is too large, the harvesting head can be lifted upwards until a suitable diameter is reached, thereby creating a higher stump. Striking root flares might also hinder an adjustment of the harvesting head close to the ground. Together with an increasing distance from the machine, the lifting force of the harvester boom decreases. Some harvesters can hardly lift the harvesting head alone if the boom is fully extended. In this case, a proper arrangement of the harvesting head at the tree is difficult. At greater distances, the visibility of operators can also be hindered. Both might contribute to higher stumps with an increasing distance between the machine operating trail and the tree.
In the scope of this study, we intended to test the following hypotheses:
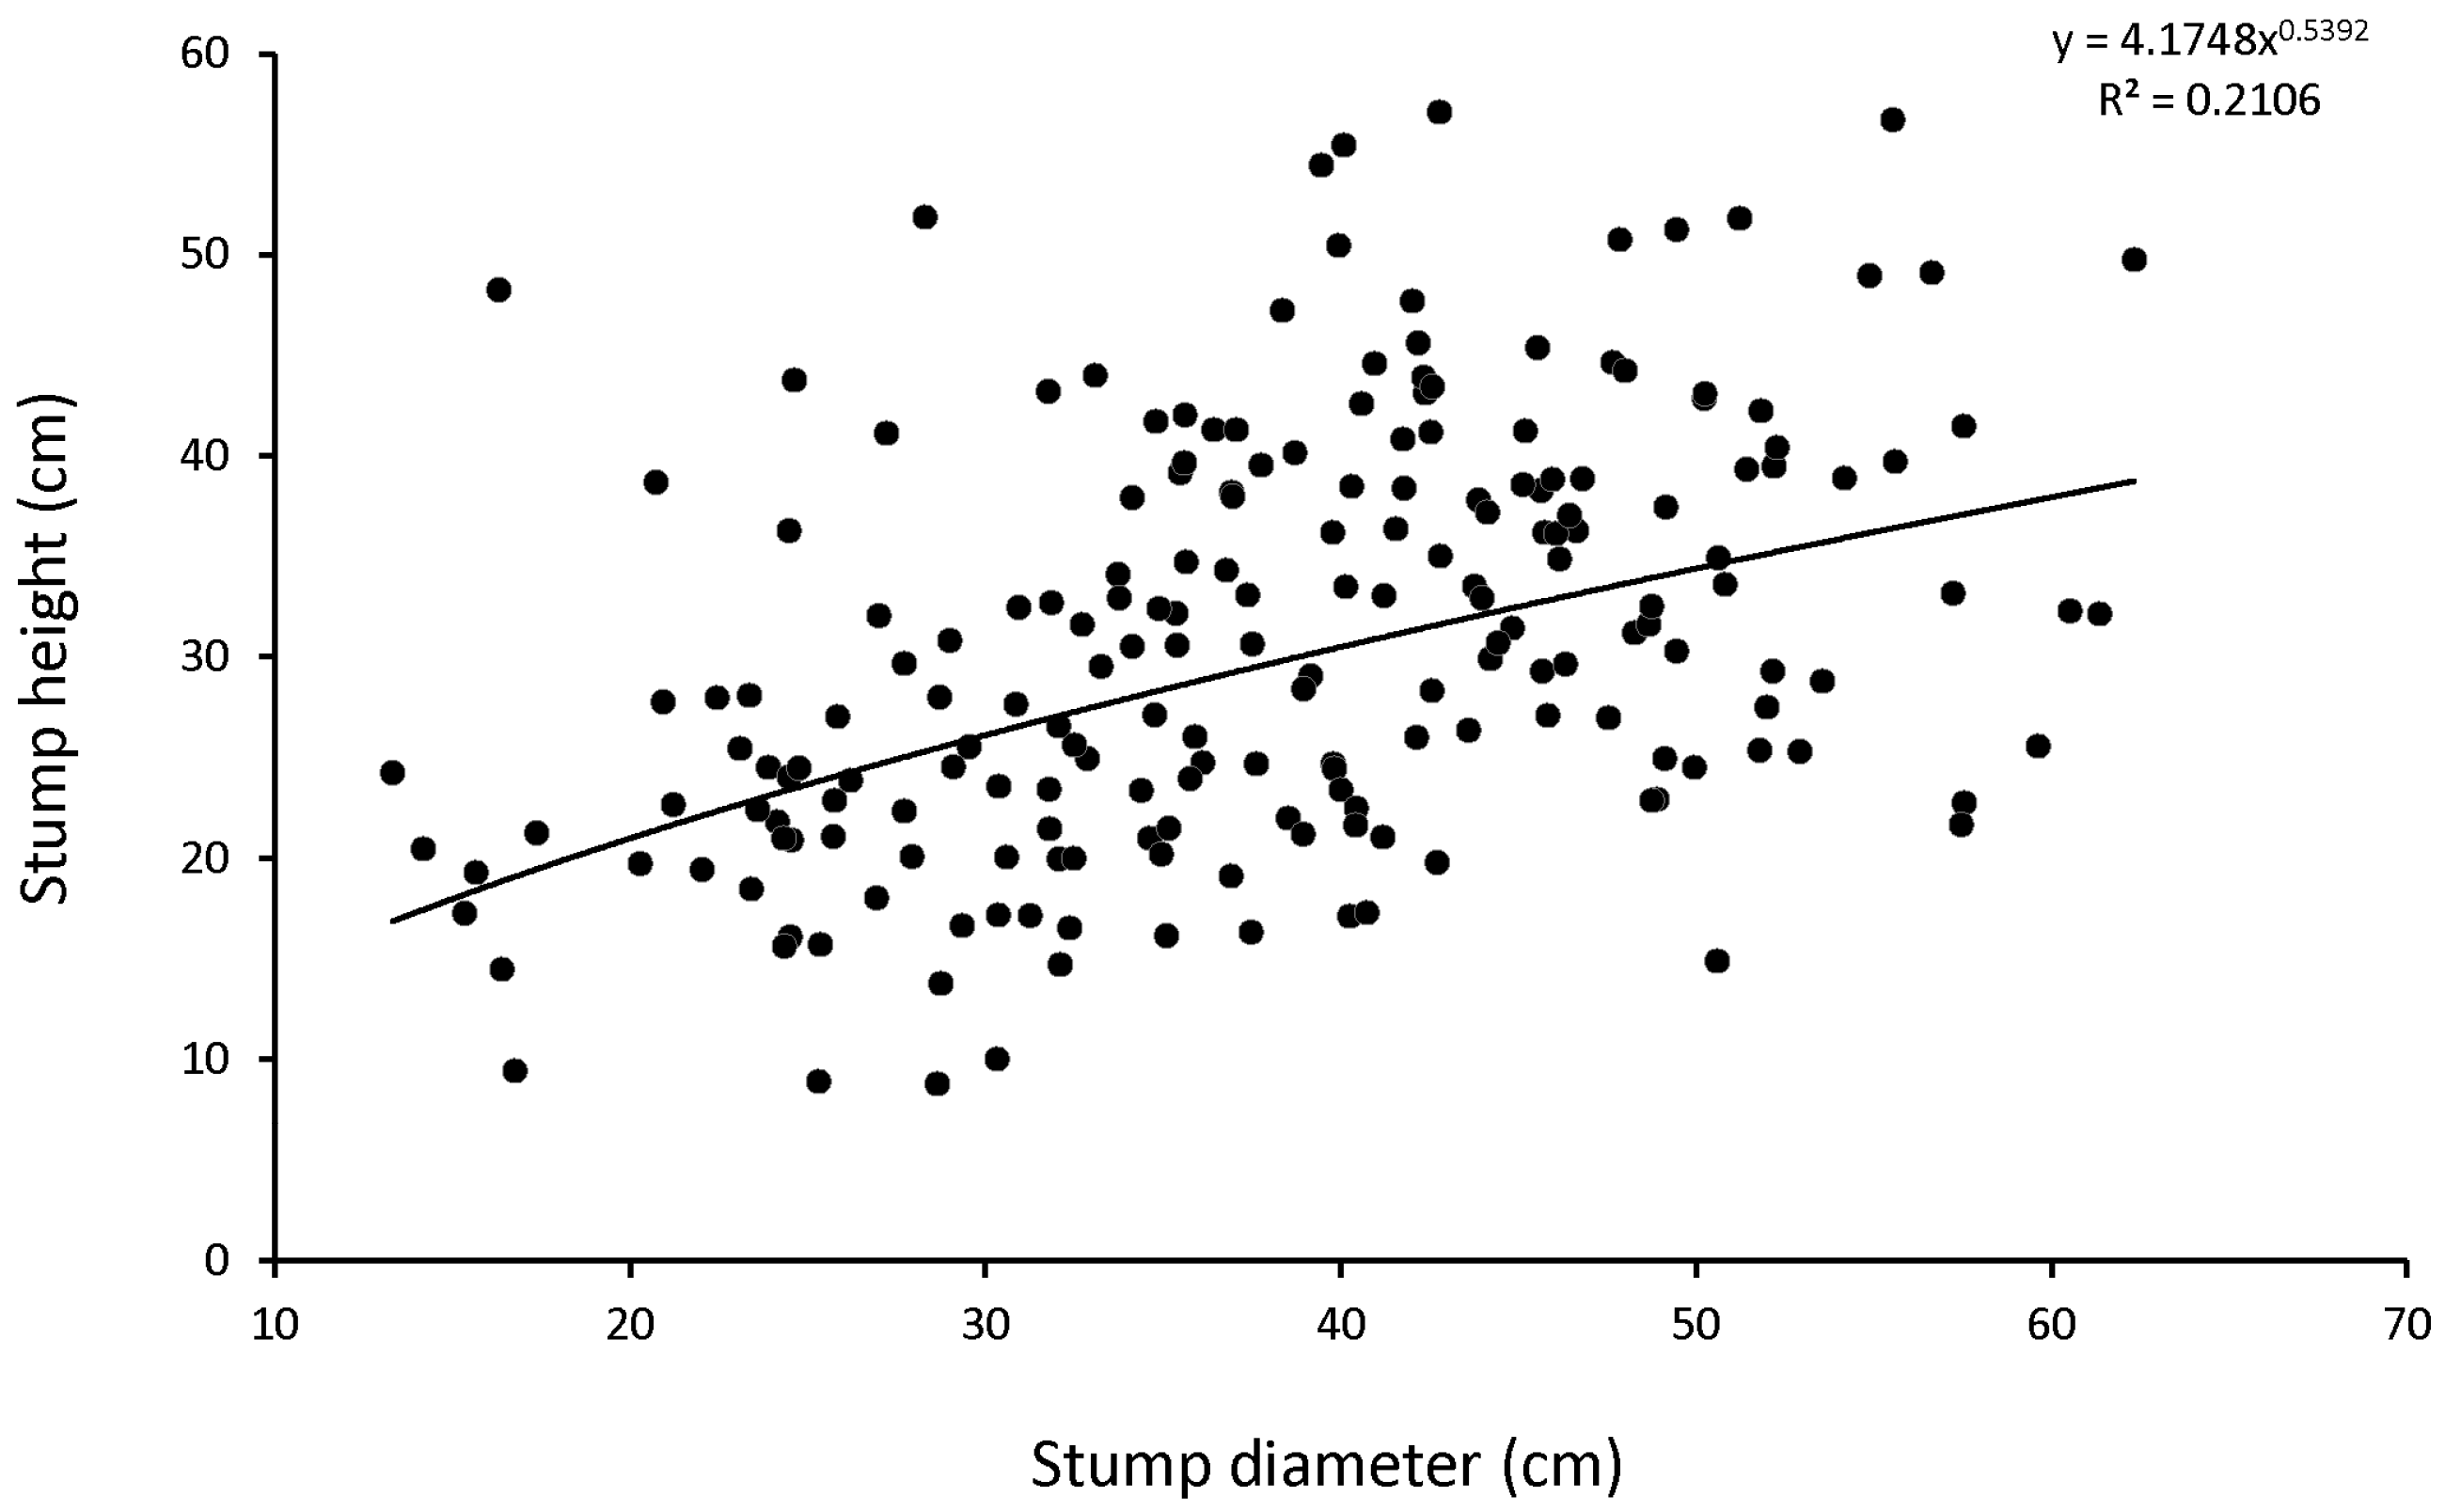
Hypothesis 1. We anticipate a correlation between stump height and stump diameter, which will lead to higher stumps as the diameter at the cut surface is increasing.
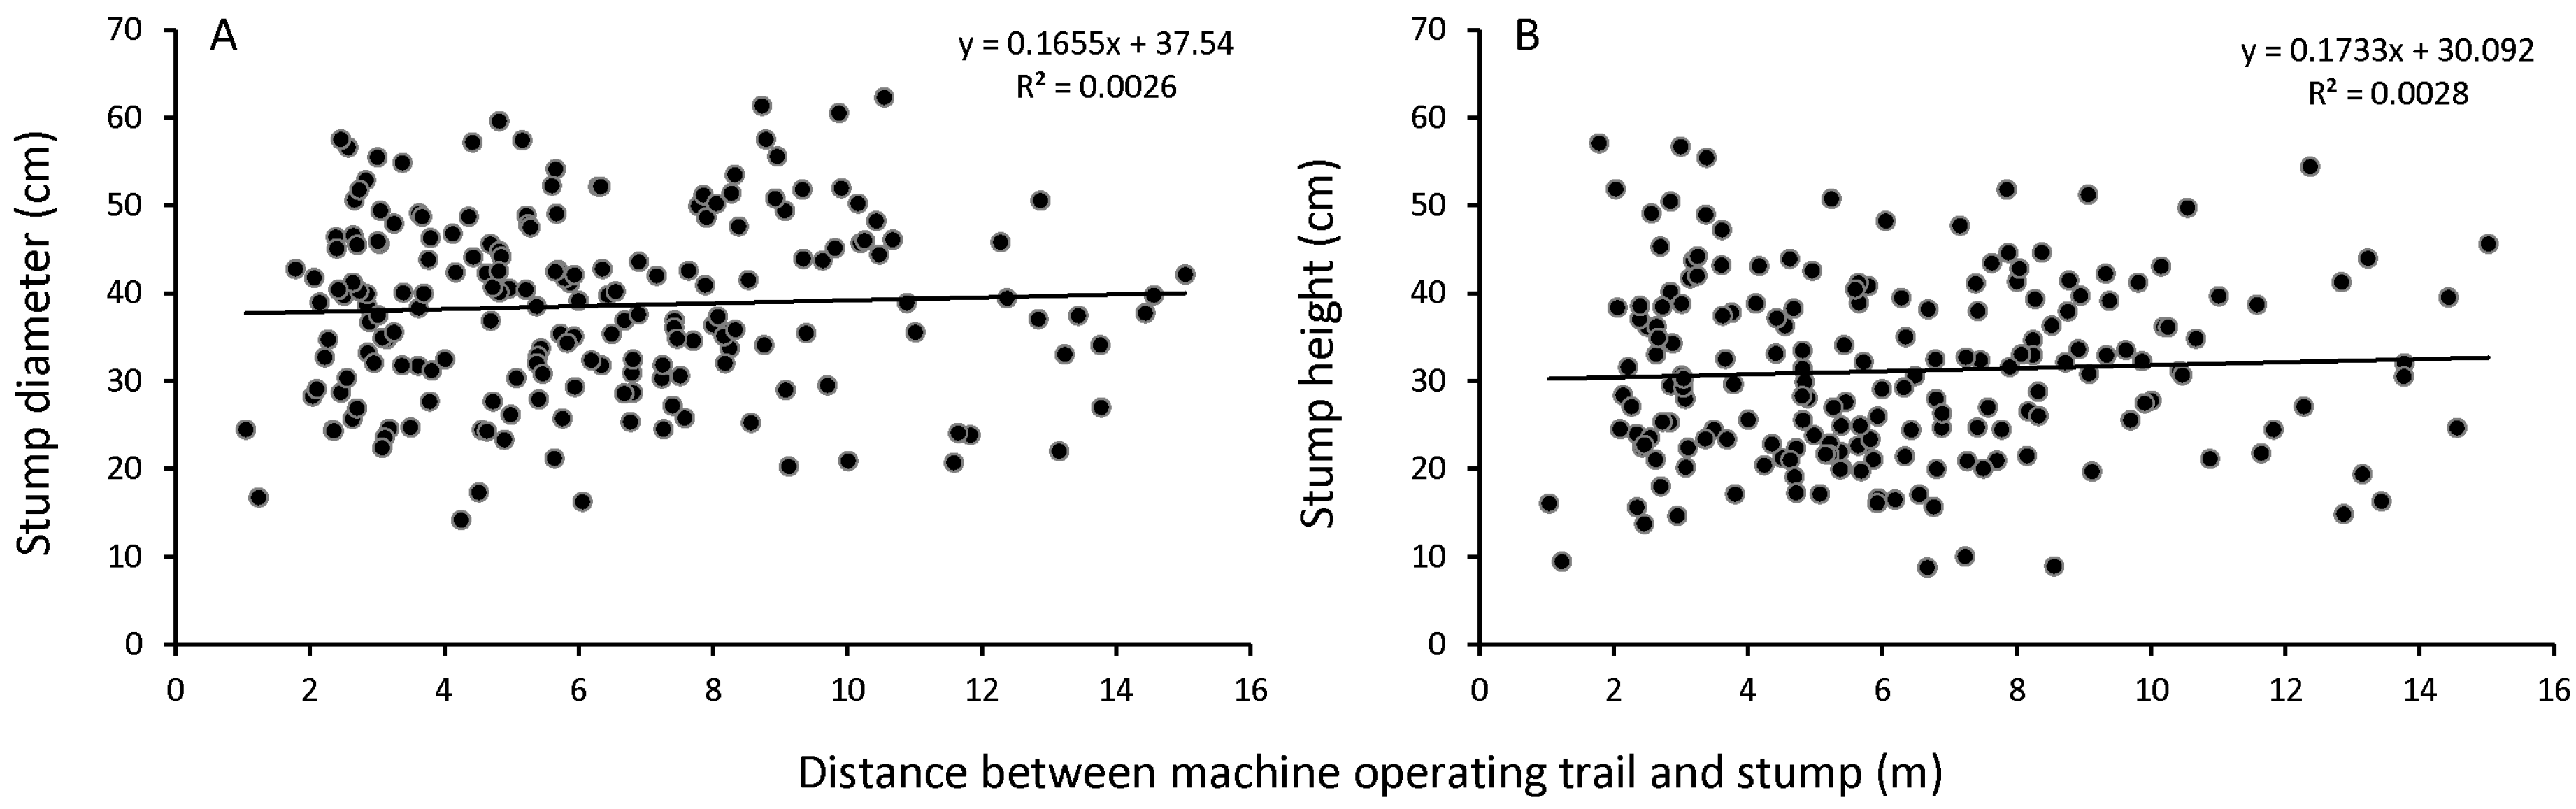
Hypothesis 2. We anticipate a correlation between the distance from a stump to the machine operating trail and stump height resulting in higher stumps as the distance between the stump and trail is increasing.
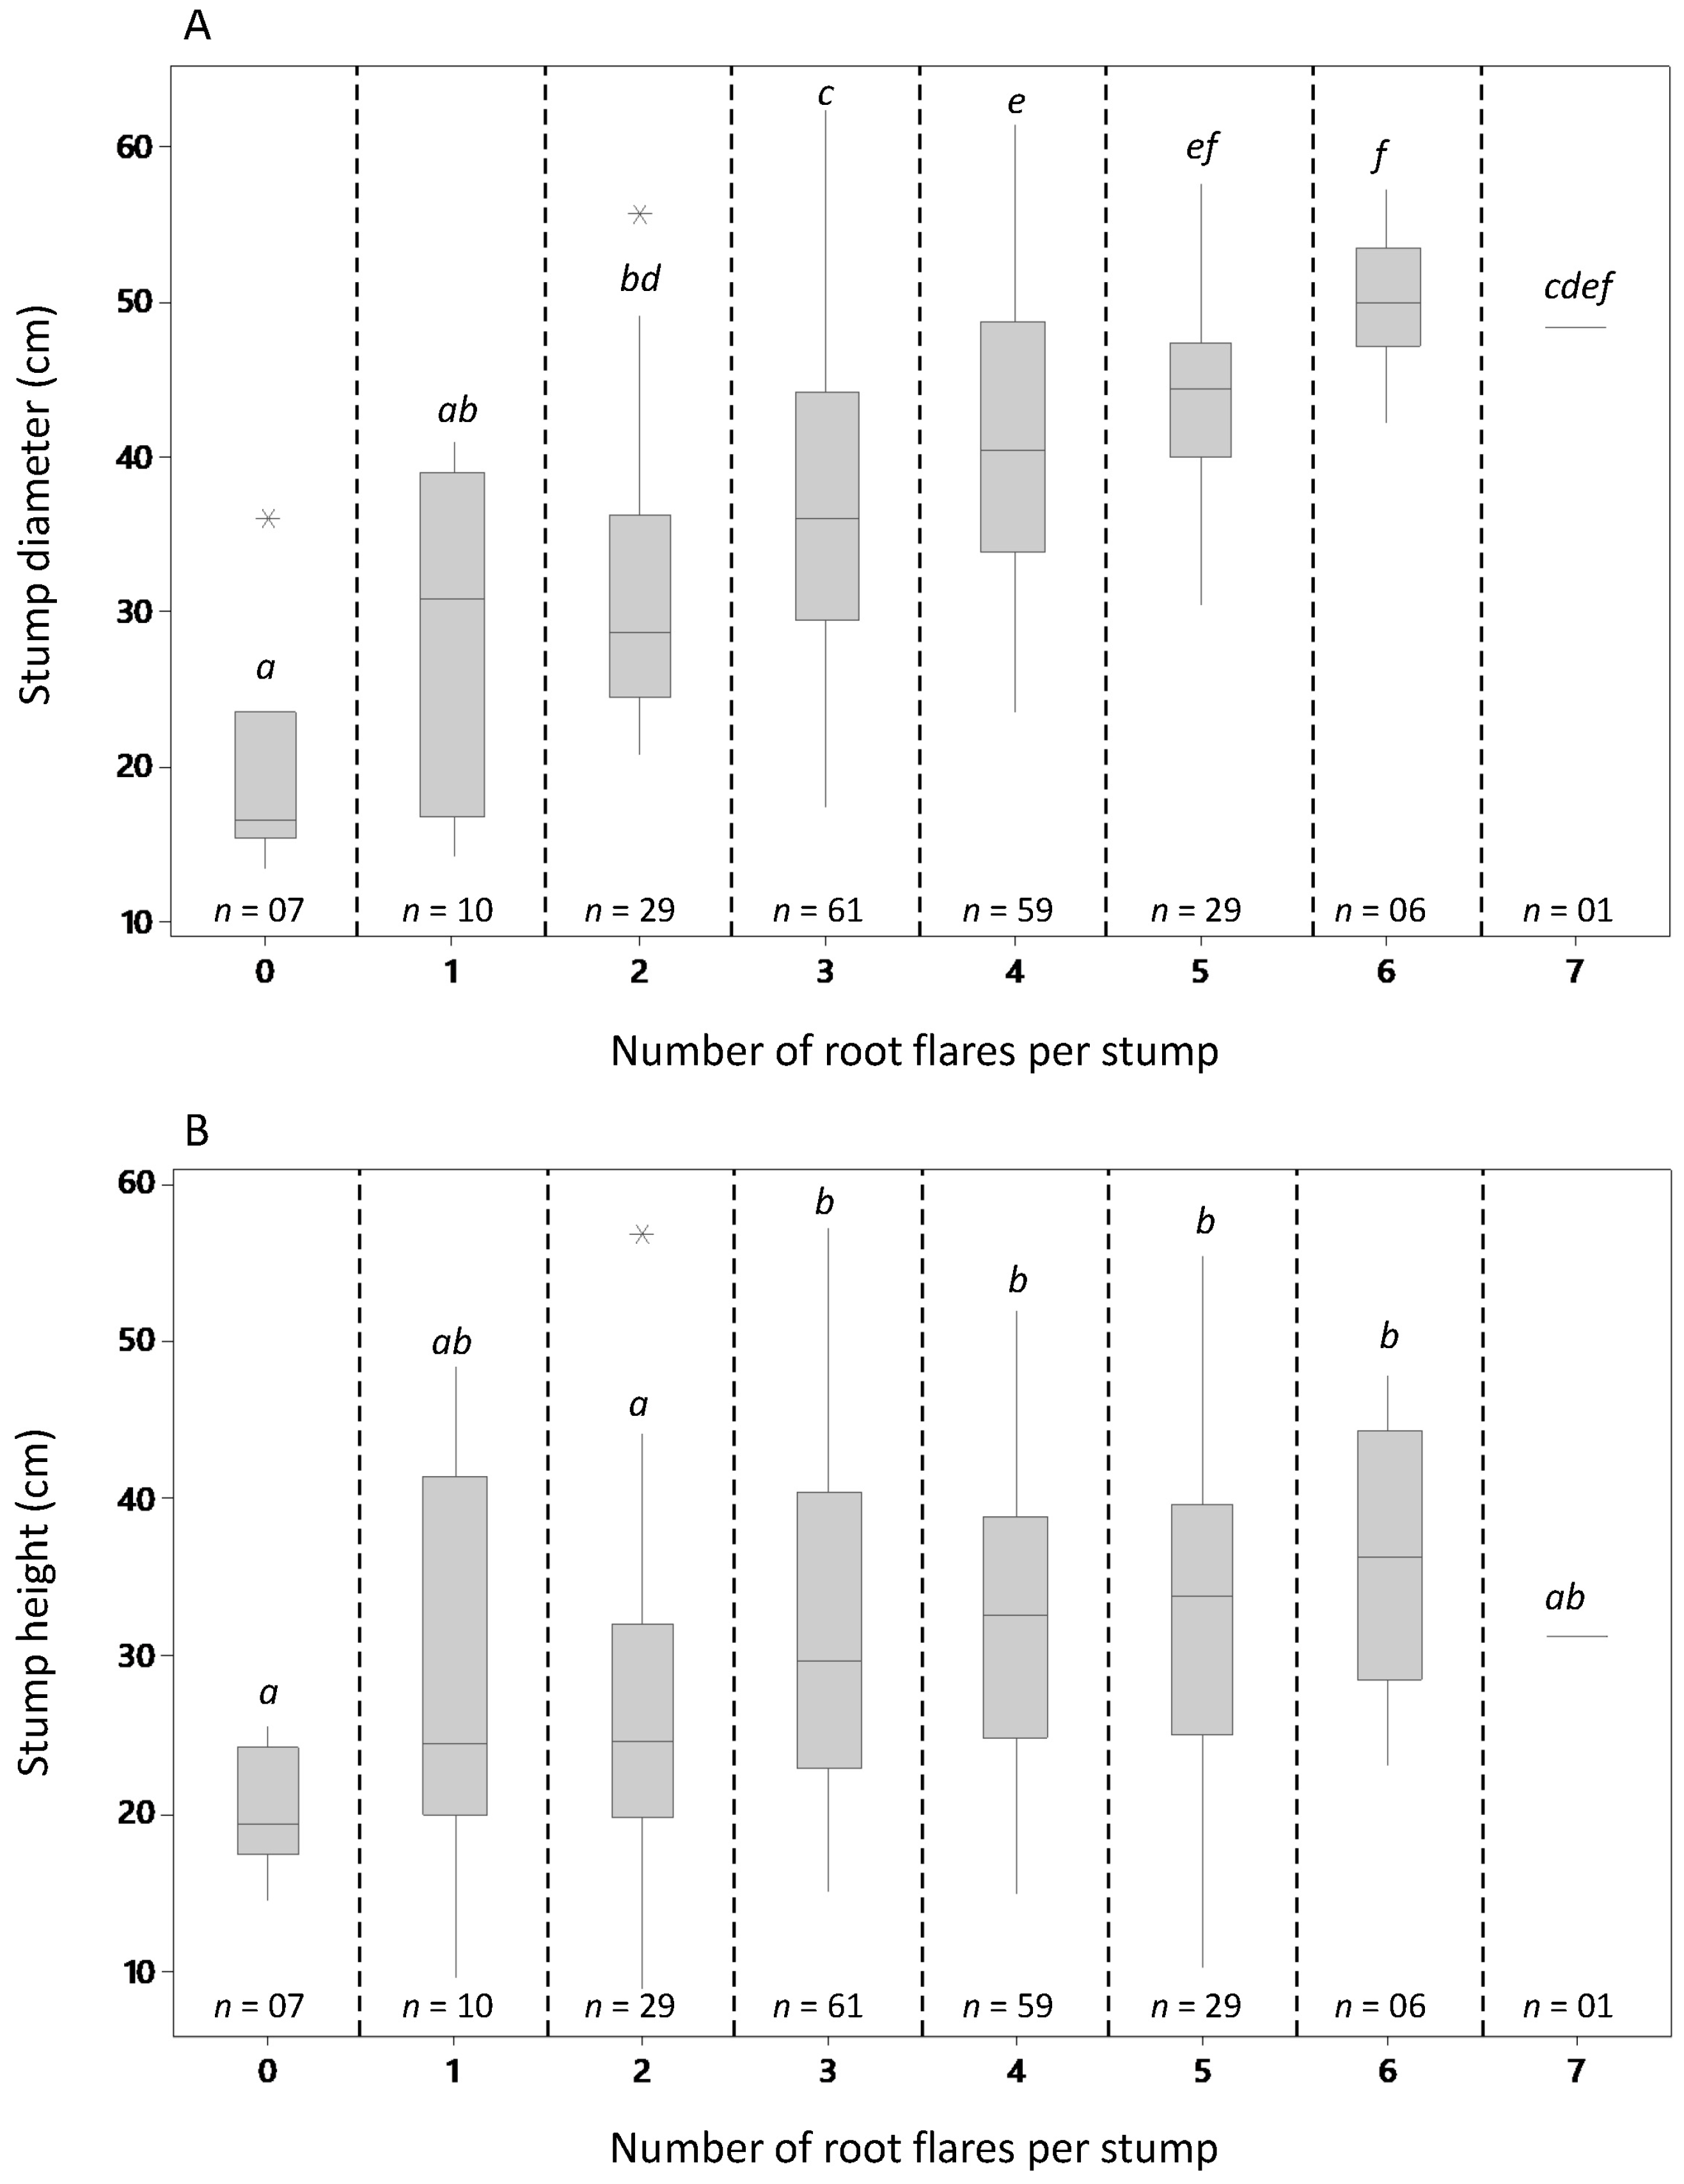
Hypothesis 3. We also anticipate a correlation between stump diameter and root collar, which will lead to a higher stump diameter as the root angles are getting flatter and are, therefore, also causing higher stumps.
Through the use of a TLS, the objective of this study was to find possible correlations between stump height and physical parameters, such as stump diameter, above-ground root collar, and distance to the machine operating trail following mechanized operations. In this context, we defined a root collar as the above-ground widening of the stump beyond its natural taper.
Other factors may also affect stump height. This can be the power of the harvester, the skill of the operator or the tree species being harvested. These factors can only be analyzed when a large number of different logging operations are observed. However, we investigated the stumps of only one logging operation and could, therefore, not address the above-mentioned factors.
2. Materials and Methods
2.1. Research Site and Experimental Design
Research sites were located in southern Germany near the town of Freising (
Figure 1A). In total, 103 stumps were measured in the forest district Rappenberg (48°24′25.2” N and 11°42′19.6” E) and 99 stumps in the neighboring district Wippenhausereinfang (48°25′33.1” N and 11°41′13.6” E). The sites were chosen because of the fully-mechanized operations and their proximity to the Technical University of Munich. Mechanized harvesting was performed in February and March 2015 by an experienced entrepreneur commissioned by the Bavarian State Forest Enterprise to harvest trees following a wind-throw. This calamity triggered an opportunity to perform additional thinning operations near the affected areas. However, only the trees that showed no sign of wind-throw were analyzed in this study. To exclude the influences of different mechanical specifications, the study area only involved the sections harvested by the same machine and operator.
The forest is mainly stocked with Norway spruce (Picea abies) (80%) and European beech (Fagus sylvatica L.) (15%) mixed with a few Douglas fir (Pseudotsuga menziesii (Mirb.) Franco), larch (Larix decidua Mill.) and oak (Quercus L.) trees constituting the remaining 5%. The mechanized portion of the felling and our associated measurements were performed in a Norway spruce-dominated stand. For this study, stumps originating from 202 harvester-felled Norway spruce trees with varying diameters along with the corresponding machine operating trails and surrounding forest areas were scanned with a TLS. The only stumps targeted were those that were (i) not affected by the wind-throw and, thus, possessed an undisturbed root collar and (ii) stumps originating from the current harvest. Due to the very limited spatial extent of the test site, similar stand and terrain conditions were present.
All of the 202 trees corresponding to our sampled stumps had previously been harvested and processed with a Valmet 921 (Komatsu Forest AB, Umea, Sweden) six-wheeled single-grip harvester with a 10 m long boom equipped with a Komatsu forest 360.2 harvesting head (Komatsu Forest AB, Umea, Sweden) (
Figure 1B). This particular harvesting head had a maximum opening of the upper delimbing knives of 64 cm and a maximum feed roller opening of 55 cm [
21].
2.2. Instrumentation and Sampling
Initial field tests relied on conventional measurements of stump characteristics using rulers, string and a builder’s level. However, severe difficulties were encountered when measuring the angles of the root flares since it was almost impossible to have a fixed reference point perpendicular to the ground and this for each 5 cm layer. For this reason, a TLS was instead chosen to collect field data consisting of 3D point clouds. The settings (resolution and quality) selected for this experiment corresponded to a point distance of 7.8 mm in a scan distance of 10 m with an average scan time of 190 seconds (not including site preparation and TLS setup) [
22]. With these recording parameters, high accuracy was achieved while keeping the amount of data and scanning time appropriate.
Preliminary test scans indicated that moss and branches on the surface and sides of stumps could cause difficulties during data processing. Therefore, prior to the start of a scan, all sample stumps were cleared of moss and loose material (branches, leaves, dead material, etc.) from the cut surface down to the soil layer with the use of steel brushes, a procedure that took on average one minute per stump. Surrounding under-growth vegetation was also removed if it was deemed to hinder the upcoming scanning campaign. To facilitate the identification of the measured stumps within the point cloud, a wooden stake was inserted near each sampled stump prior to scanning.
Spheres of 145 mm diameter, automatically detectable by the processing software, were used in the field to facilitate merging point clouds originating from different scans. It was necessary that at least three spheres remained in the same location between two adjacent scans, thus permitting the software to triangulate the positions of the scanner. Prior to a scan, all positions of the spheres were verified by line-of-sight to ensure the scanner could detect the spheres from its current position.
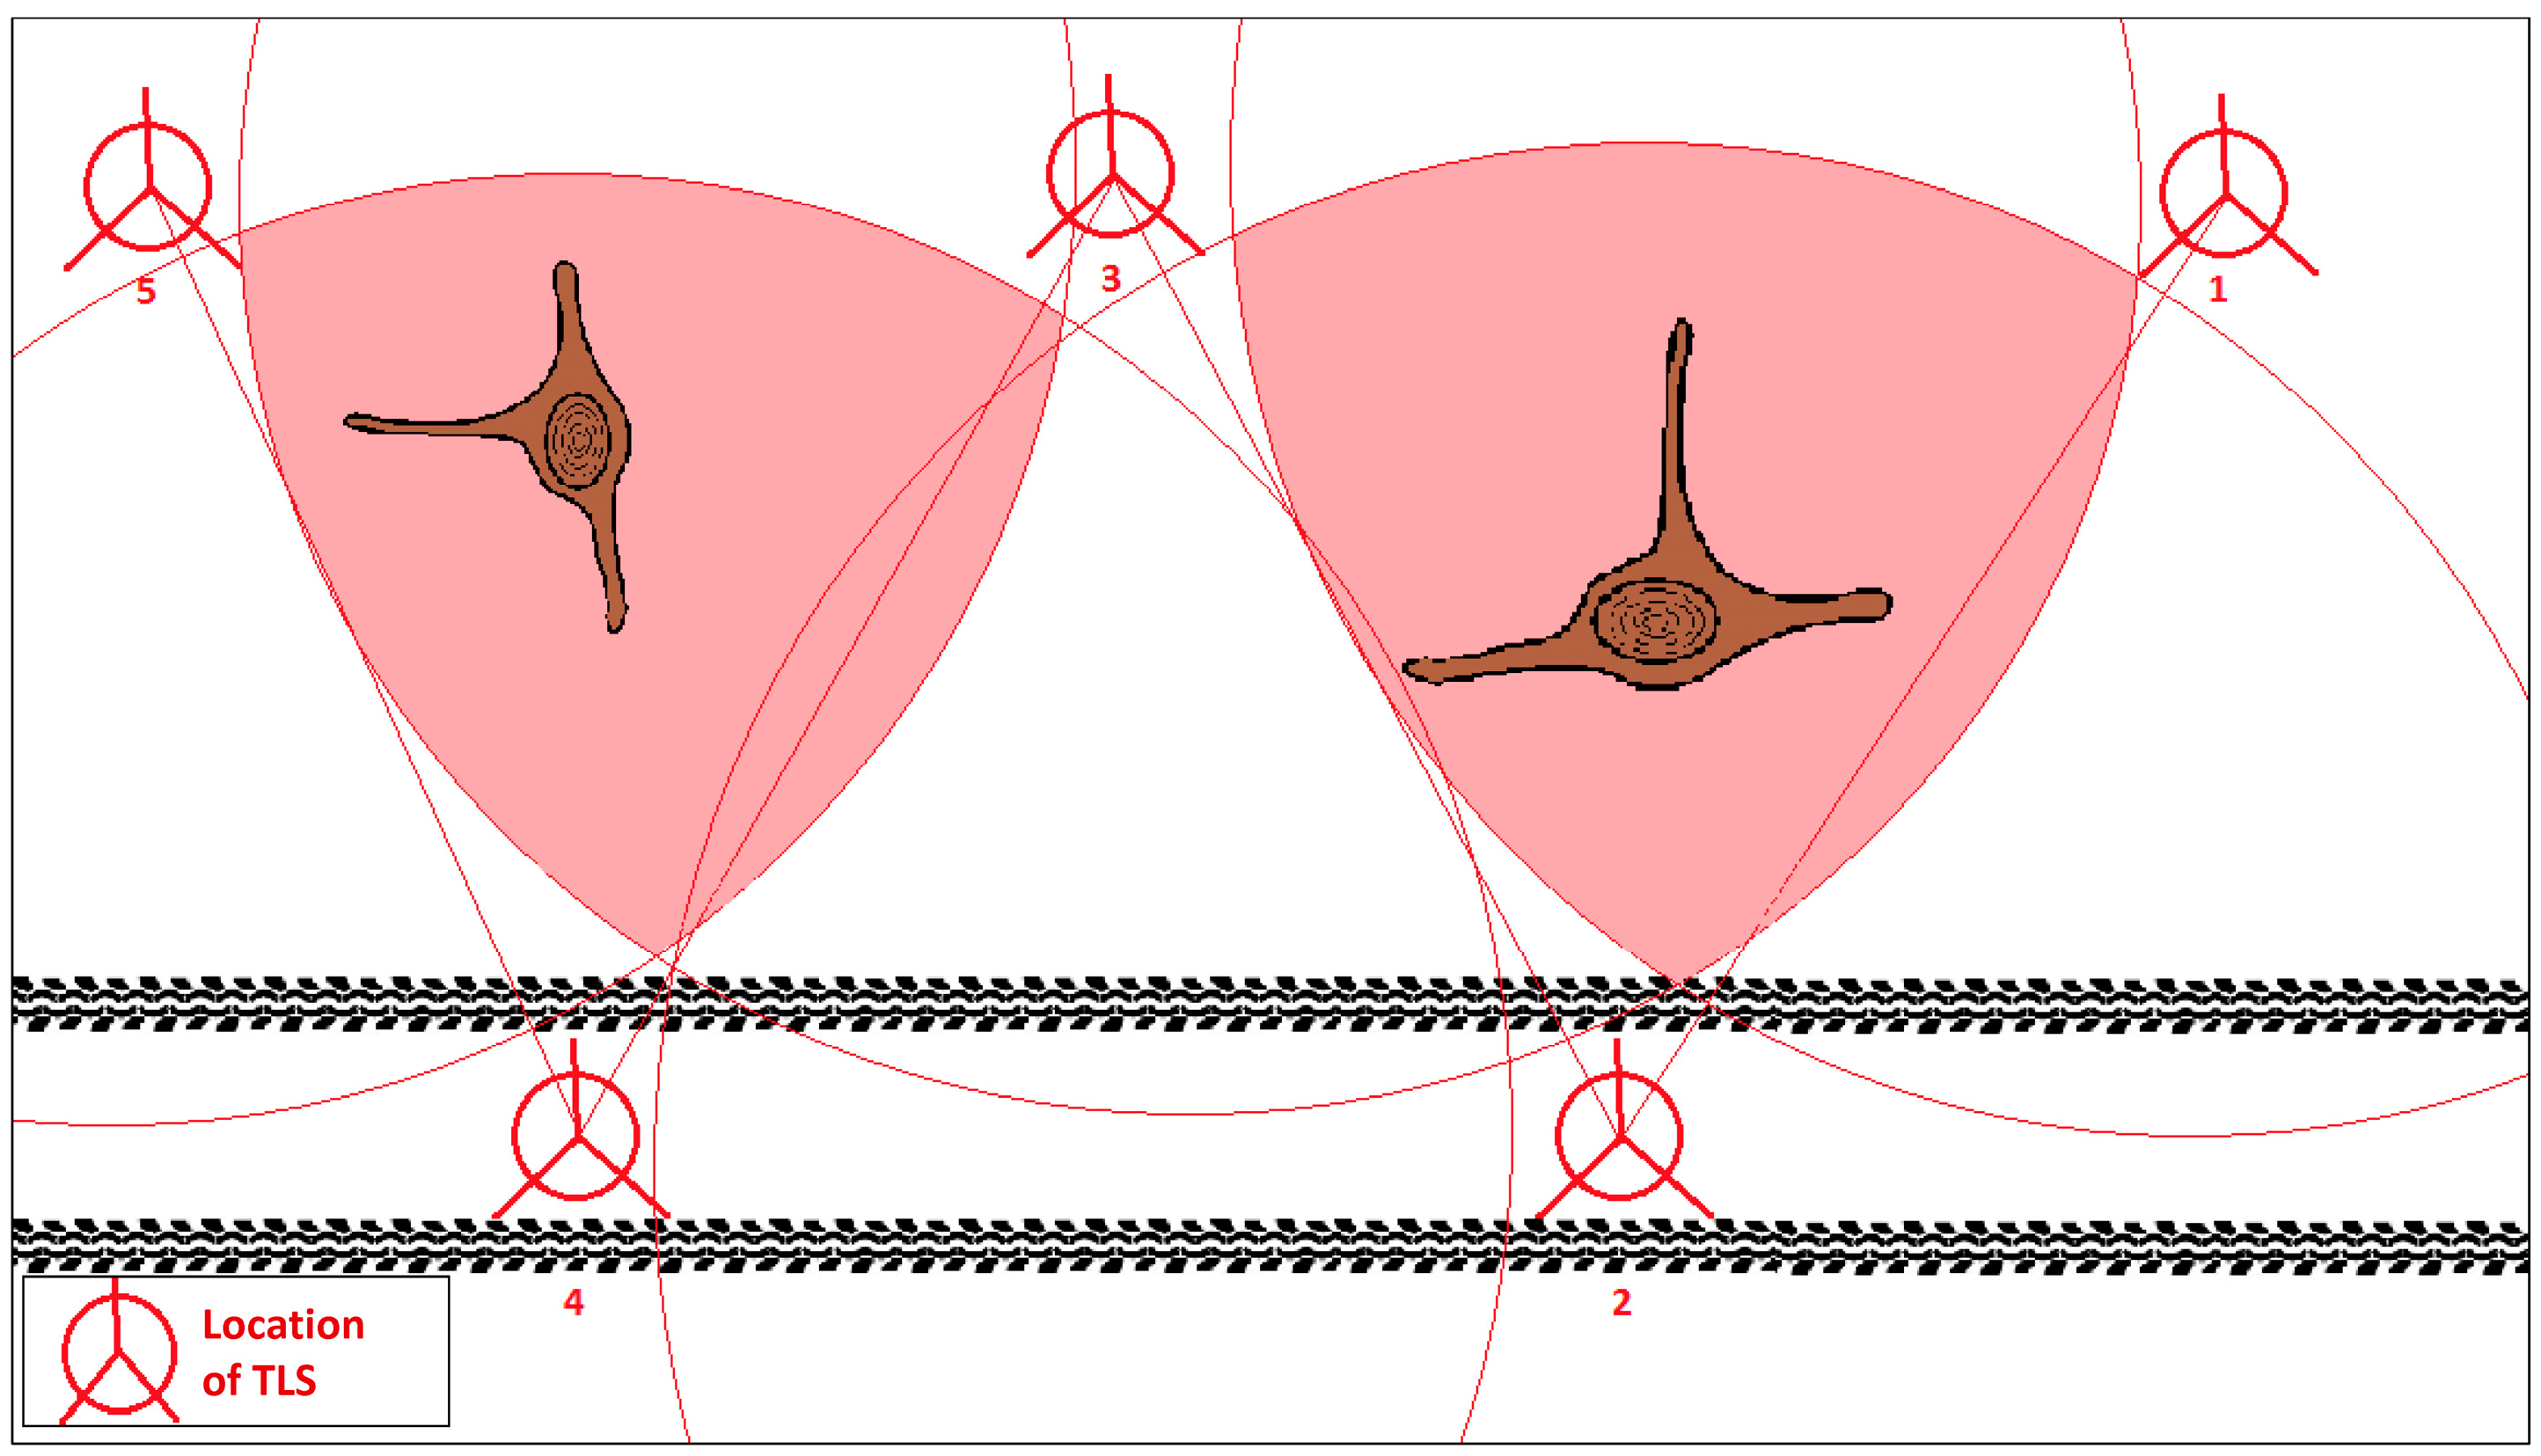
To allow for exact measurements, the TLS was leveled at every scan position with the use of an adjustable tripod. Under ideal scanning conditions, a stump was scanned from three sides. One scan was always performed directly from the machine operating trail so that the horizontal distance between the trail centerline and the target stump could be measured. Whenever possible, the scans followed a diagonal pattern on one or both sides of the machine operating trail (
Figure 2). In areas where dense vegetation or complex root systems were present, scanning frequency was increased accordingly to assure that all required data was captured.
2.3. Data and Statistical Analyses
Following the field campaign, data was examined using a point cloud processing, visualizing, and analyzing software. To perform exact measurements of the stump architecture, it was first necessary to create a mesh on the surface of the stump rather than try to obtain required measurements via the point cloud. This procedure, performed for all target stumps and corresponding machine operating trails, consisted of creating a triangular irregular network, which converted the point clouds into surfaces.
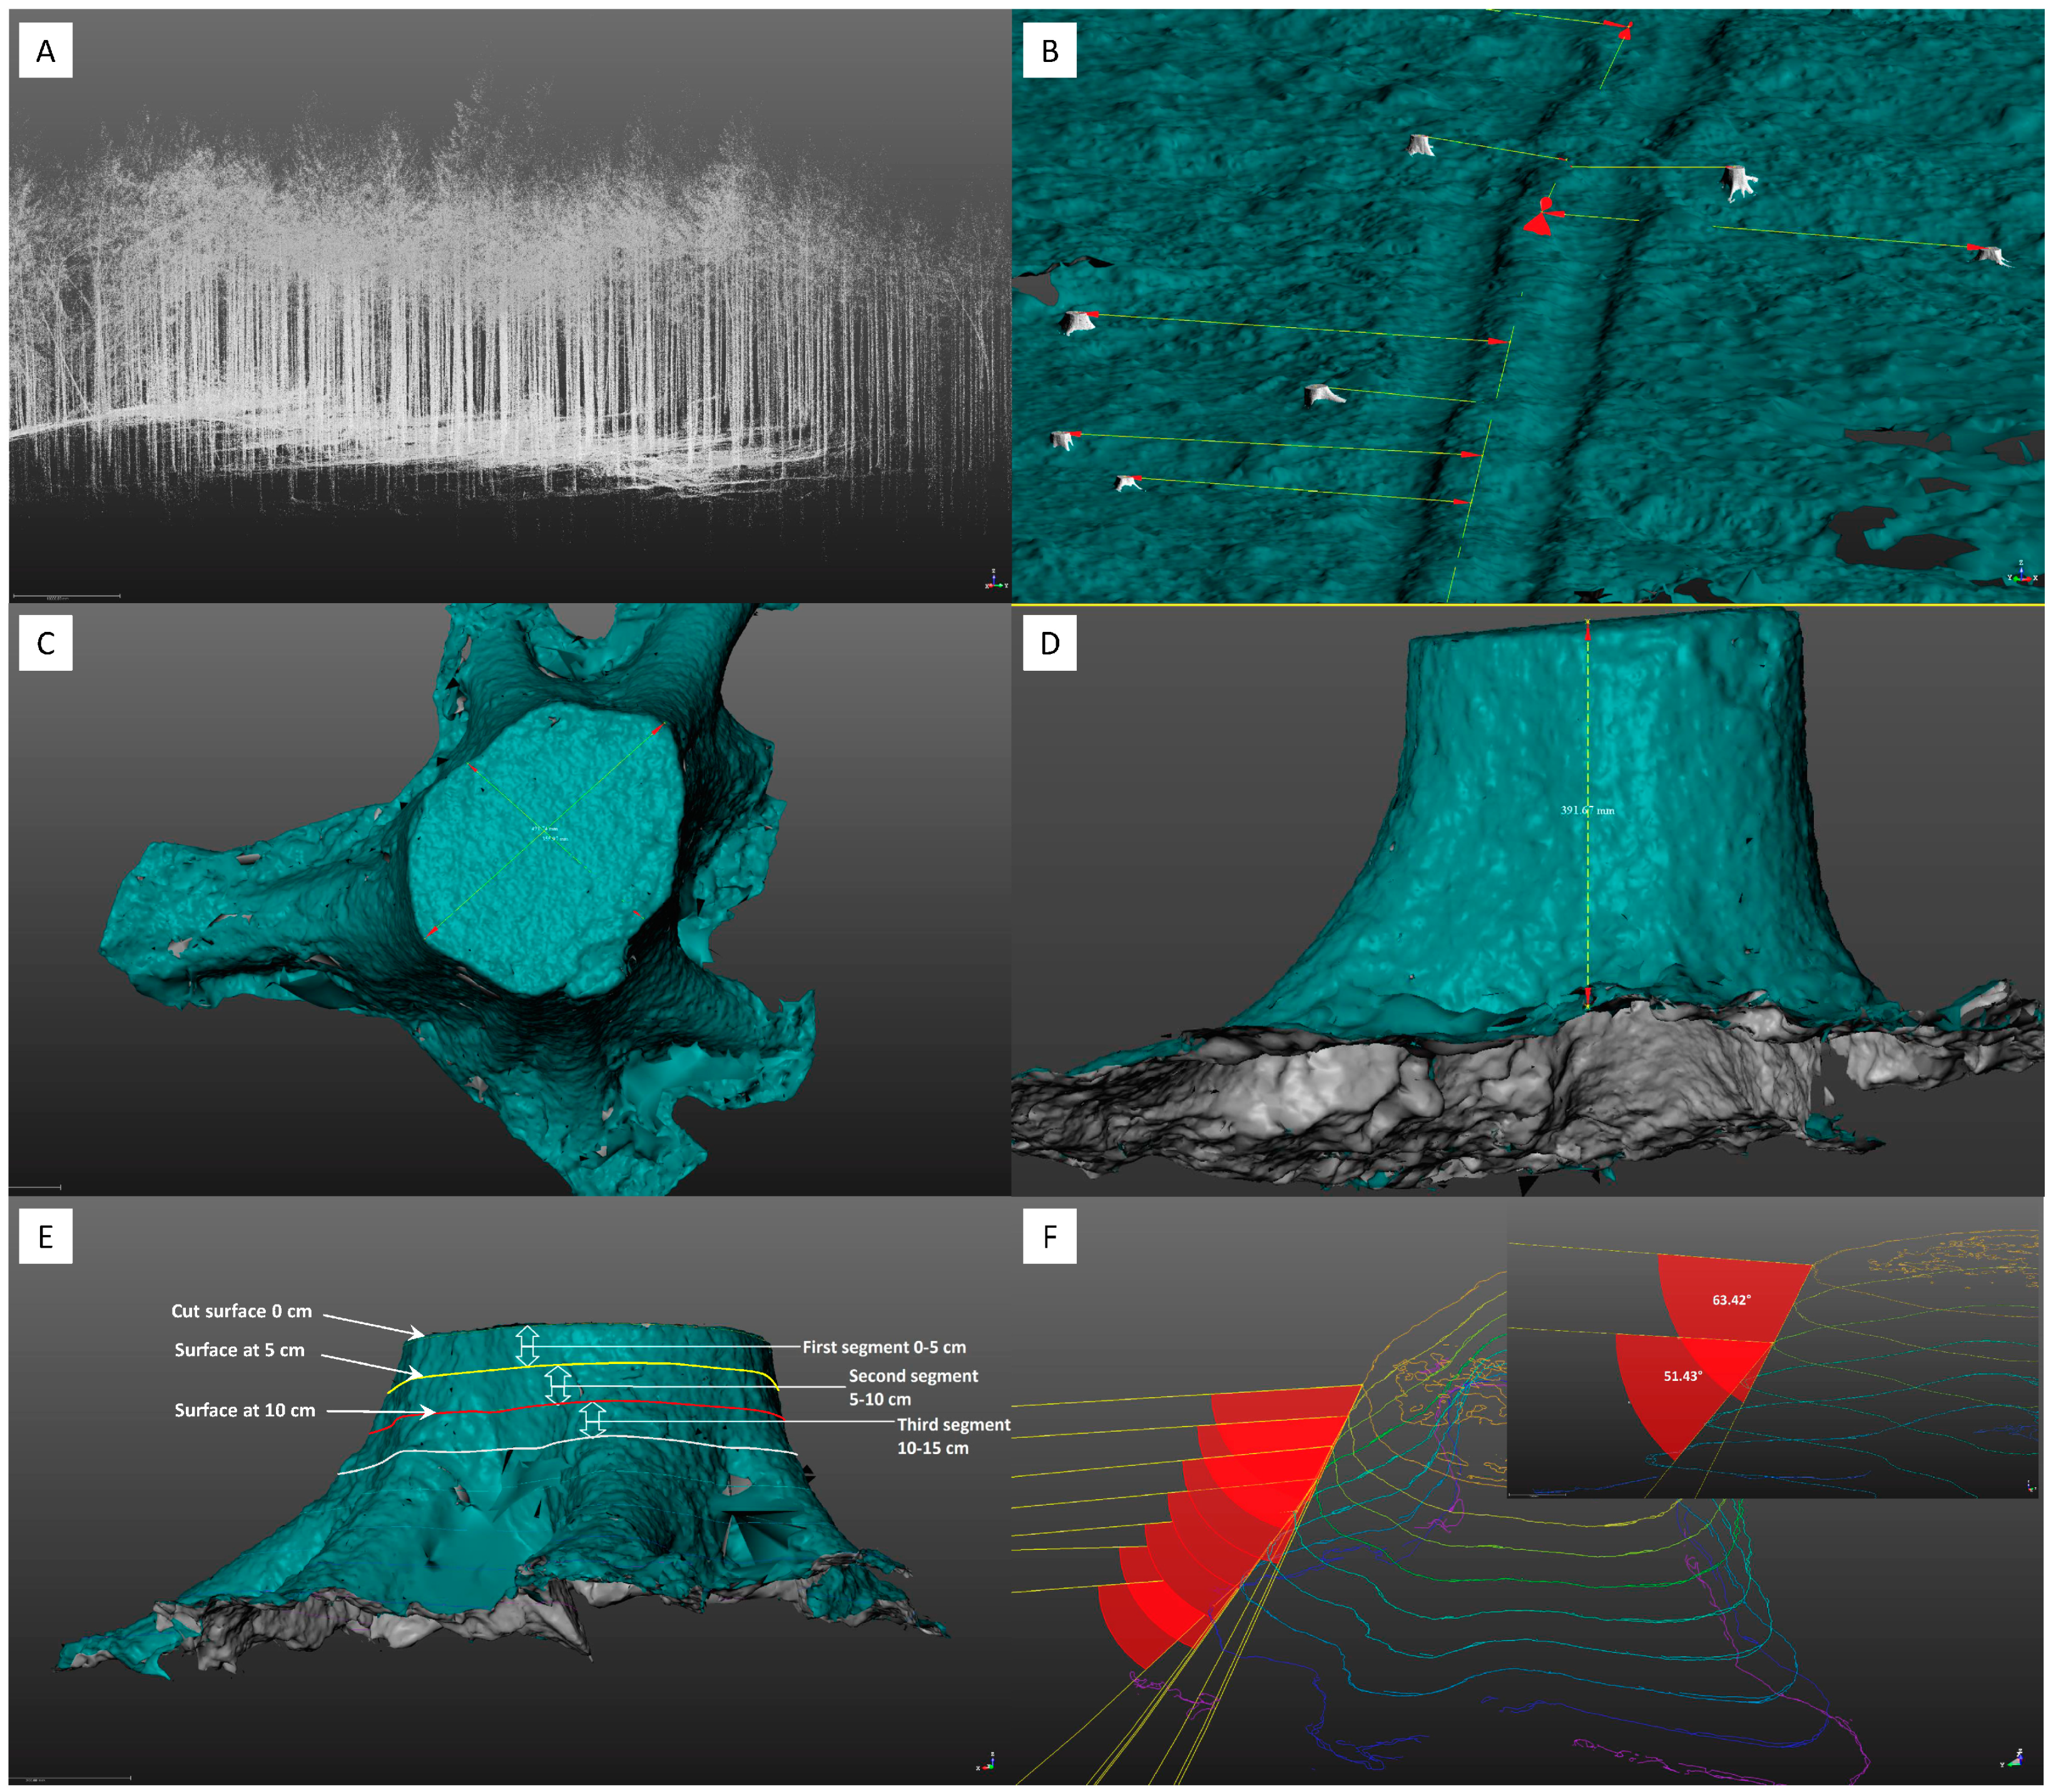
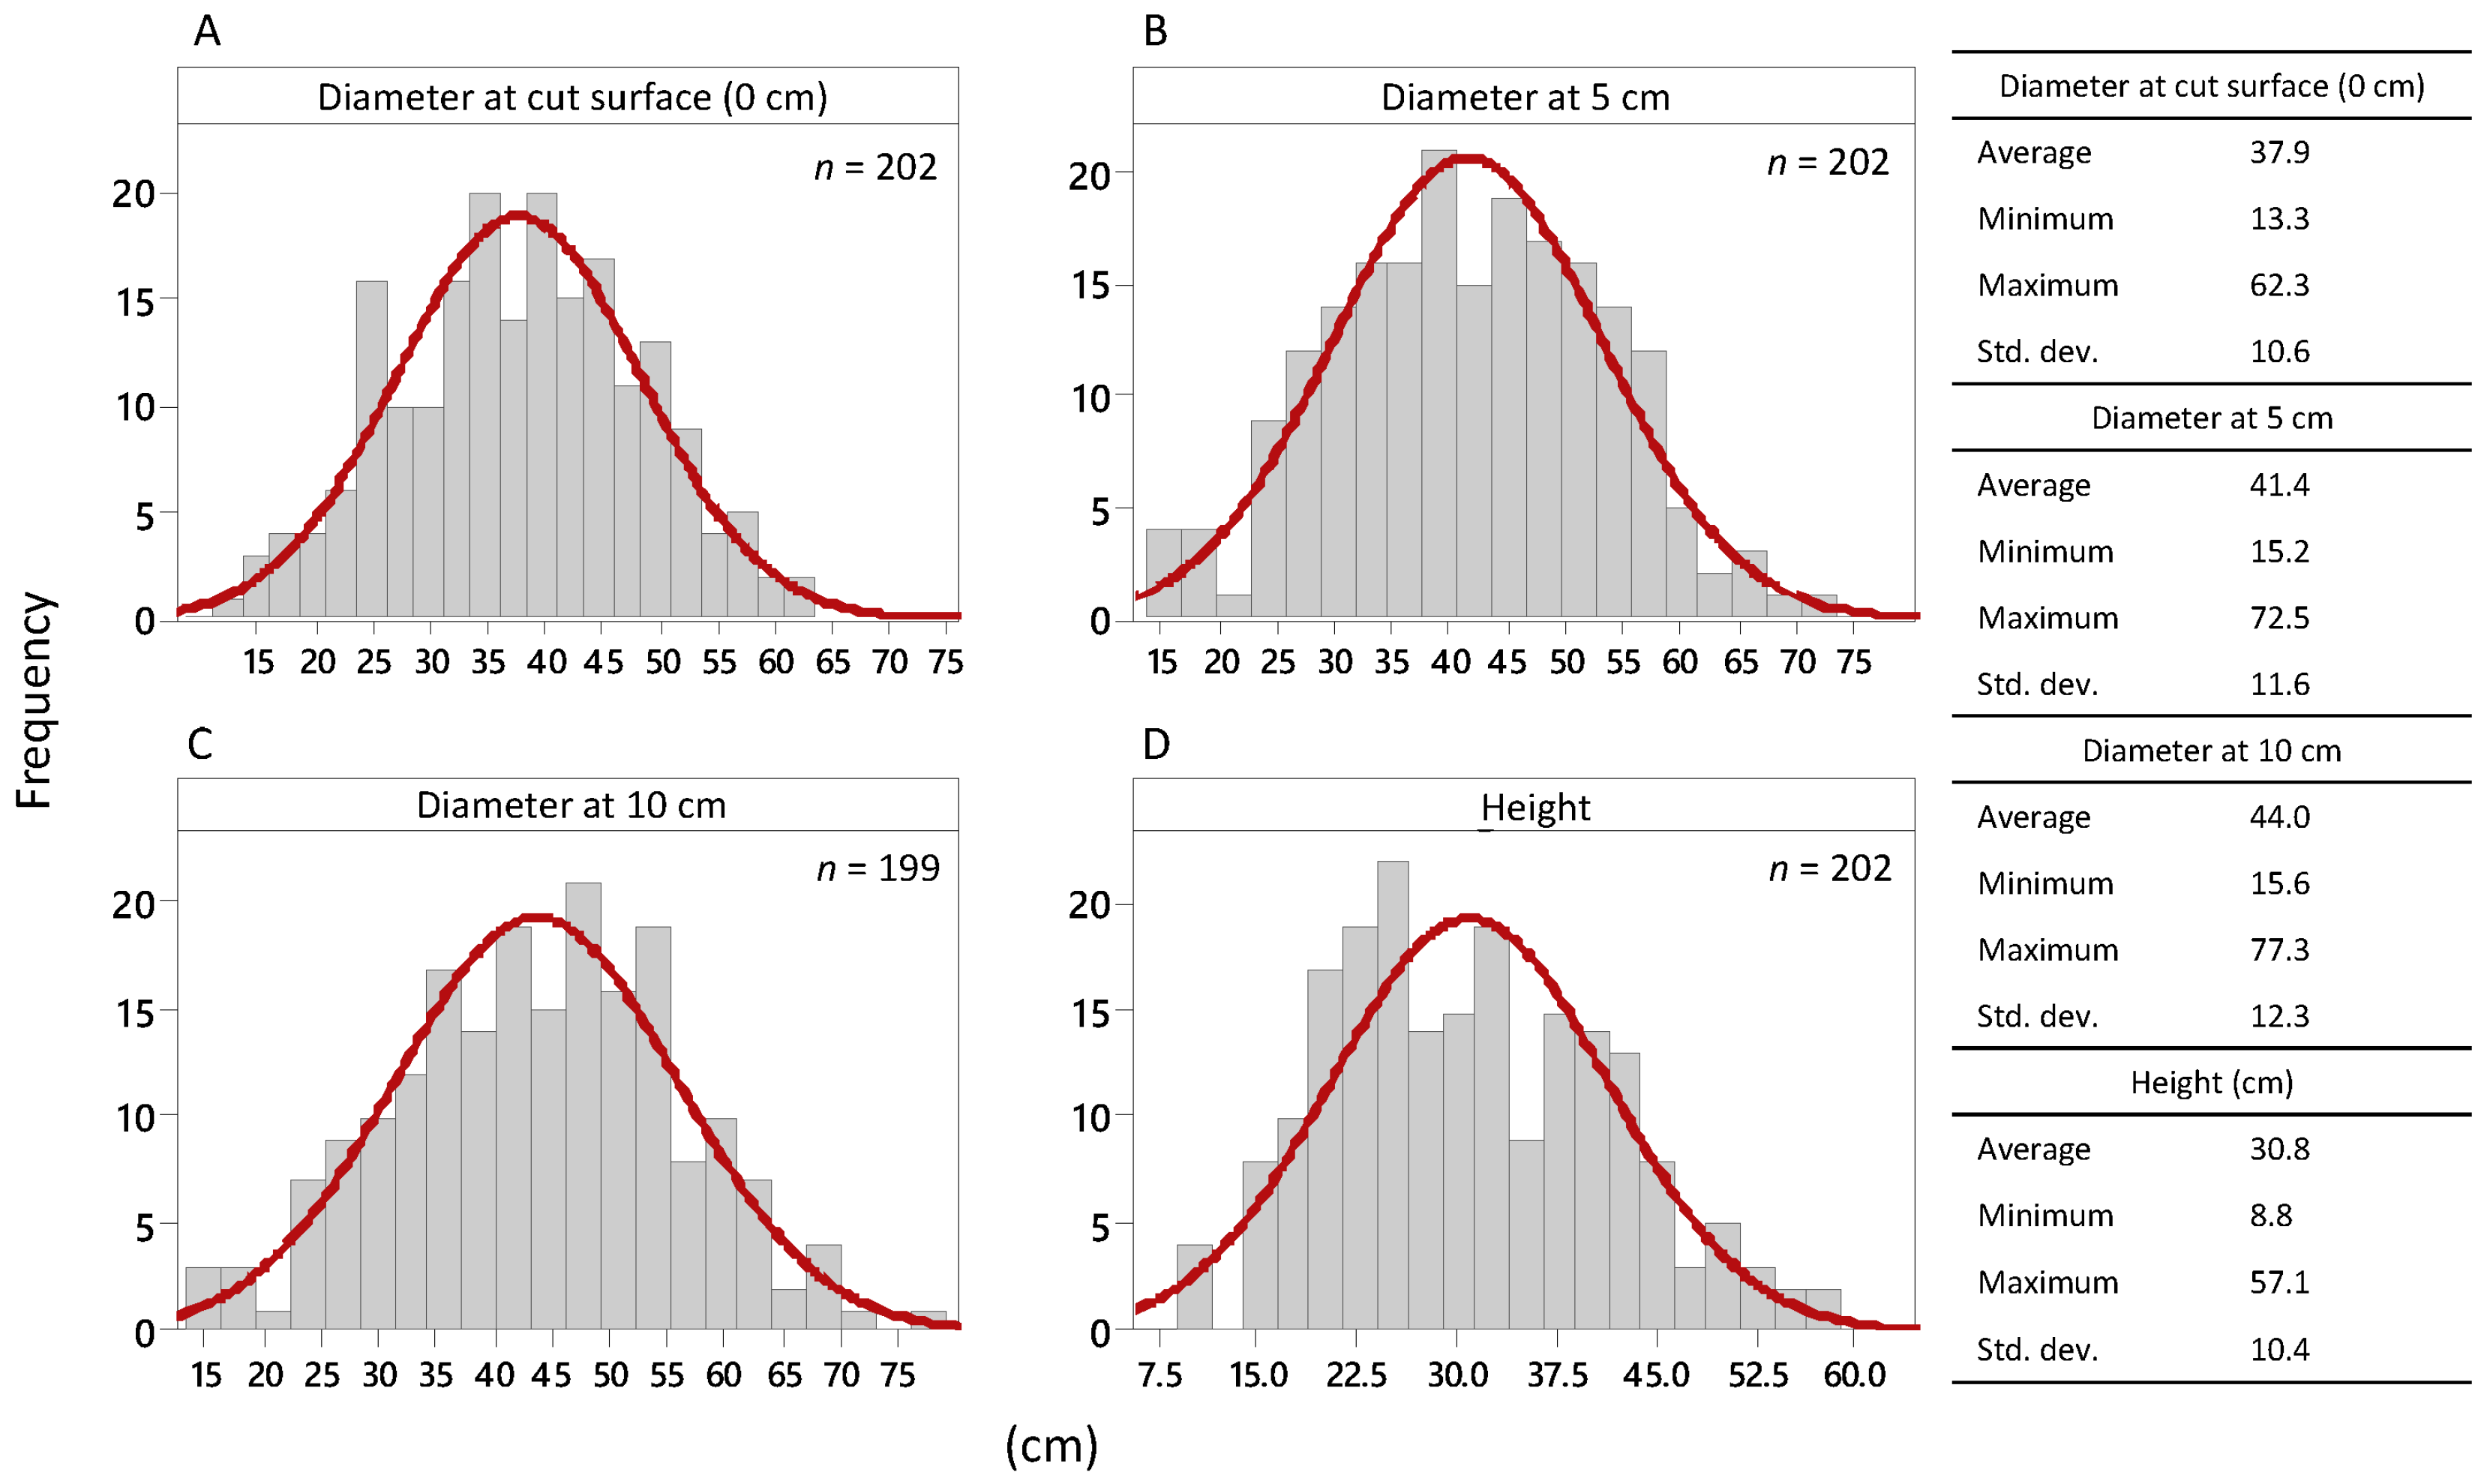
This study focused on characterizing four main parameters; stump diameter, stump height, root collar geometry, and distance to machine operating trail. Since it was of interest to understand the change in stump diameter from the cut surface down towards the soil surface, three different types of stump diameters will be discussed (diameter at cut surface, diameter at the 5 cm segment, and diameter at the 10 cm segment). All stump diameters have their starting point or starting horizontal plane on the top surface (cut surface) of the stump, which was in contact with the saw of the harvesting head. Unless otherwise specified, the diameter at cut surface is the origin (0 cm) and from this position, measurements were recorded in a vertical downward direction towards the ground in 5 cm increments. As an example, the further described 5 cm segment was the segment from the edge of the cut surface to a plane 5 cm below the cut surface (
Figure 3E). Methods used to quantify stump characteristics are summarized below.
Diameters: Similar to the method used by [
23,
24], average stump diameters (mm accuracy), irrespective of their vertical position on the stump, were calculated using two outside bark diameter measurements (shortest and longest) extending through the geometric center of the stump (
Figure 3C).
Heights: Stump heights were measured with mm accuracy from the ground level on the high side (in reference to the ground) of the stump to the height at the geometric center at the cut surface [
23] (
Figure 3D).
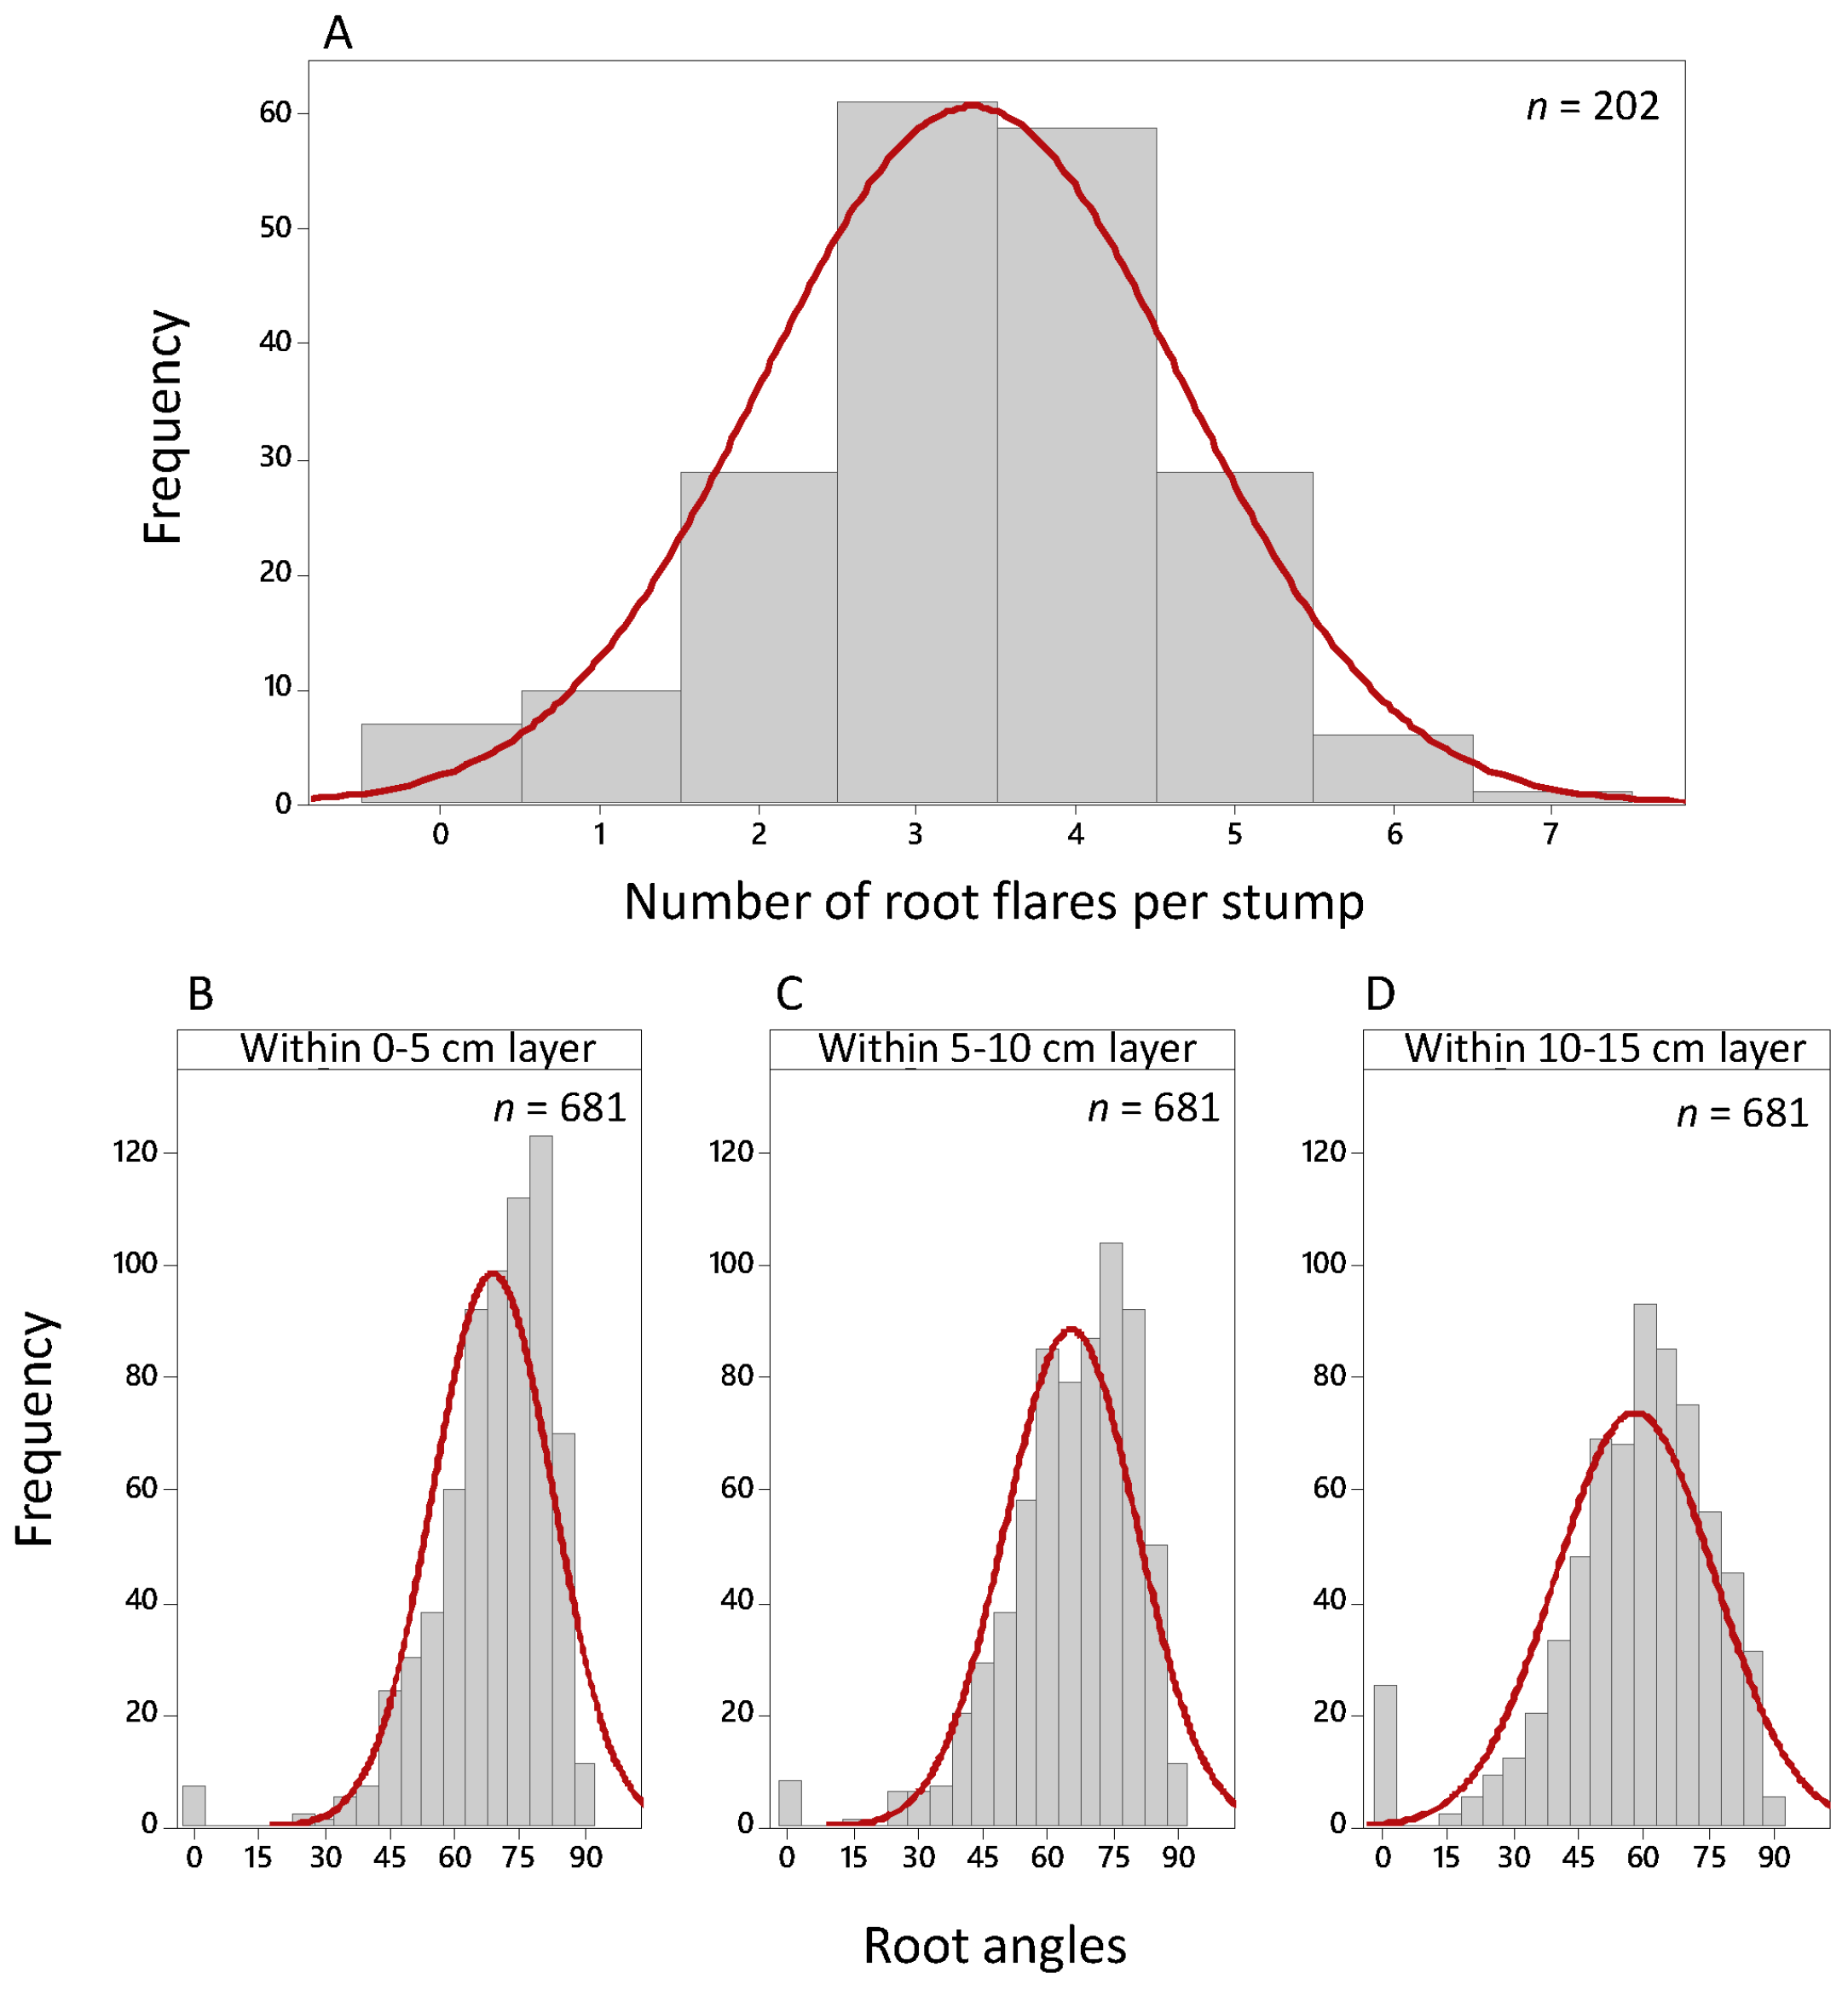
Root collar: To appropriately describe the root collar, every angle between the created vertical segments on the stump was measured to a horizontal line. The first angle was always the angle from the edge of the stump cut surface down to the 5 cm line. The angles were measured on top of the roots in a downward direction towards the ground (
Figure 3F). Root collar was assessed in three segments; cut surface (0 cm) to 5 cm, 5 to 10 cm, and 10 to 15 cm. For example, a 90° angle would correspond to a root not extending beyond the natural taper of the stem.
Number of root flares per stump: Above-ground root flares were defined as visually discernable parts of a stump beyond its natural taper, which continuously extended down to the soil layer (as shown in
Figure 3C).
Distance to machine operating trail: The distance from a stump to the machine operating trail was measured from the geometric center of the stump to the centerline of the operation trail in a 90° angle. To allow for this type of measurement, a line was generated following the middle of the trail and used as a reference for the 90° measurements (
Figure 3B).
The measurements described above only consider the shape of the top 15 cm of a stump as expressed from the cut surface downwards. In order to consider the shape of the entire stump, the diameters and root angles of a subsample of 100 stumps (randomly selected from the entire 202 stump data set) were also measured with the point of origin now beginning from the ground surface upwards in 5 cm layers until reaching the cut surface. In this subset, minimum diameters were measured similar to the functioning of a tree caliper. Thus, smaller diameters only caused by grooves or protrusions on a stump did not influence the caliper-type diameter measurements. The complimentary analysis was performed to better link the stump characteristics to the functioning of a harvesting head as it is being positioned at the base of a tree.
For all ensuing measurements, data was transferred and analyzed in Minitab 17 and R Statistics. All response variables (diameters at different heights, height, distance to machine operating trail) were first tested for normality with the Anderson-Darling normality test. One-way ANOVAs were performed in Minitab with the diameter and height set as response variables and the number of roots per tree as the factor. R Statistics was used to obtain Pearson correlations. Additionally, a multiple linear regression analysis (ordinary least squares method) was performed in SAS 9.3 where the stump height was the dependent variable and the minimum diameter and average root angles at the cut surface and the number of root flares and the distance to the machine operating trail used as predictor variables. Outliers were identified by Cook’s D, which combines information on the residual and leverage [
25]. The normality of the residuals was proved by the Shapiro-Wilk W test for normality and homoscedasticity was tested by performing the White test. Lastly, multicollinearity was tested by looking at the variance inflation factor.
Another linear regression was performed with the data from the subsample of 100 stumps where measurements originated from the ground. The minimum diameter and the average of the angles of all roots were the explanatory variables and the distance to the cut surface the dependent variable. Here the average of the root angles of successive layers was assigned to the diameter between both segments. In addition, a quantile regression for this model was executed since they are useful in applications where extremes are important [
26]. Therefore, the model should reveal if the variation of stump heights at the lower end are limited by stump diameter and the root collar and ultimately shed some light on if a threshold on the stump height imposed by the stump shape can be determined. In all statistical tests, a significance level of 0.05 was used.
4. Discussion
4.1. Stump Characteristics
The dataset of 202 stumps supported a positive trend of increasing stump height with an increase in stump diameter. This implies that for those stumps that were close to the maximum operating capability of the harvesting head, stump diameter should have an impact on stump height. Despite the relatively small stump sizes in relation to the maximum opening of the harvesting head, high variation in stump height was observed suggesting that the height at which a stump is cut during mechanized harvesting operations might not be entirely related to physical parameters of the stump or the maximum opening of the harvesting head.
4.2. Root Flares and Root Collar
A positive linear trend could be noticed between the number of root flares per stump and stump height. A much stronger relationship was apparent between the number of root flares per stump and stump diameter. The trend through the entire dataset can be explained as large diameter trees often grow supporting roots to stabilize themselves against side-pressure associated with wind forces. All stumps with no visible above-ground root flares in the dataset had, therefore, relatively small diameters. The development of the trend implied that, when a certain above-ground root flare mass was grown, this effect was getting smaller. By comparing the diameter segments, a second trend could be seen. The point clouds were moving to the top right corner with an increase in diameter class. This also seemed to be caused by the increasing diameter and not by flatter angles. The initial trend was similar throughout the diameter classes but was less apparent at higher diameters.
4.3. Machine Operating Trail
At the onset of the study, we anticipated that as the distance from a stump to the machine operating trail increased, that the operator visibility would be hindered and the lifting force of the boom would decrease, both contributing to higher stumps. However, the horizontal distance between sampled stumps and the machine operating trail did not influence diameter and height of the stumps that were scanned. Of course, the diameter of a tree influences its weight, which can become a limiting factor in relation to the maximum reach of the harvester and its ability to perform adequate and safe felling, but for the study, a consistent deviation of all stump diameters and heights up to the maximum reach of the boom was reported. For some instances, distances measured between the center of the machine operating trail and the center of the sample stumps was greater than the reach of the harvester boom. It is possible that on some occasions, the harvester operator performed so-called poke-ins or pockets with the harvester to be able to reach trees located further away from the trail. With the presence of brush mats coupled with a single machine pass, these pockets can be difficult to detect in the scan. The likelihood of this scenario occurring was increased since operations were performed following a wind-throw. In such conditions, all trees were felled and processed with machines to ensure the safety of all workers. Second, it is also possible that the bird’s eye view projection of the machine operating trail centerline was not located precisely because of too high and dense vegetation on the trail at the end of the field campaign. Therefore, in further projects it is recommended to scan early at the beginning of the growing season or control competitive vegetation such as Himalayan balsam (Impatiens glandulifera Royle). This particular vegetation became a significant problem by covering up the operating trails and masking them in the scans.
4.4. Concurrent Effects on Stump Height
The diameter of a stump and the shape of the root collar at the cut surface together had a significant effect on stump height. The model explained even half of the variation of stump heights. The minimum diameter contributed more to the explanation of stump height variation than the average or the maximum diameter. This was plausible because it was rather the minimum diameter which limited the grabbing of the tree by the harvesting head, since the later could be swiveled during the positioning at the base of a tree.
Somewhat contradictory appeared the observation that the stump height increased with the diameter, as well as the number of root flares, but in the multiple regression model the number of root flares revealed no significance. The regression model showed no critical multicollinearity of the diameter and the number of root flares when both parameters were included into the model. But in a model with the predictors “root angle” and “number of root flares”, the coefficient of the root number also became significantly different from zero. However, this model without the predictor “minimum diameter” had an adjusted R-square of only 0.14. Thus, the number of root flares other than the diameter could explain hardly any variation of the stump heights.
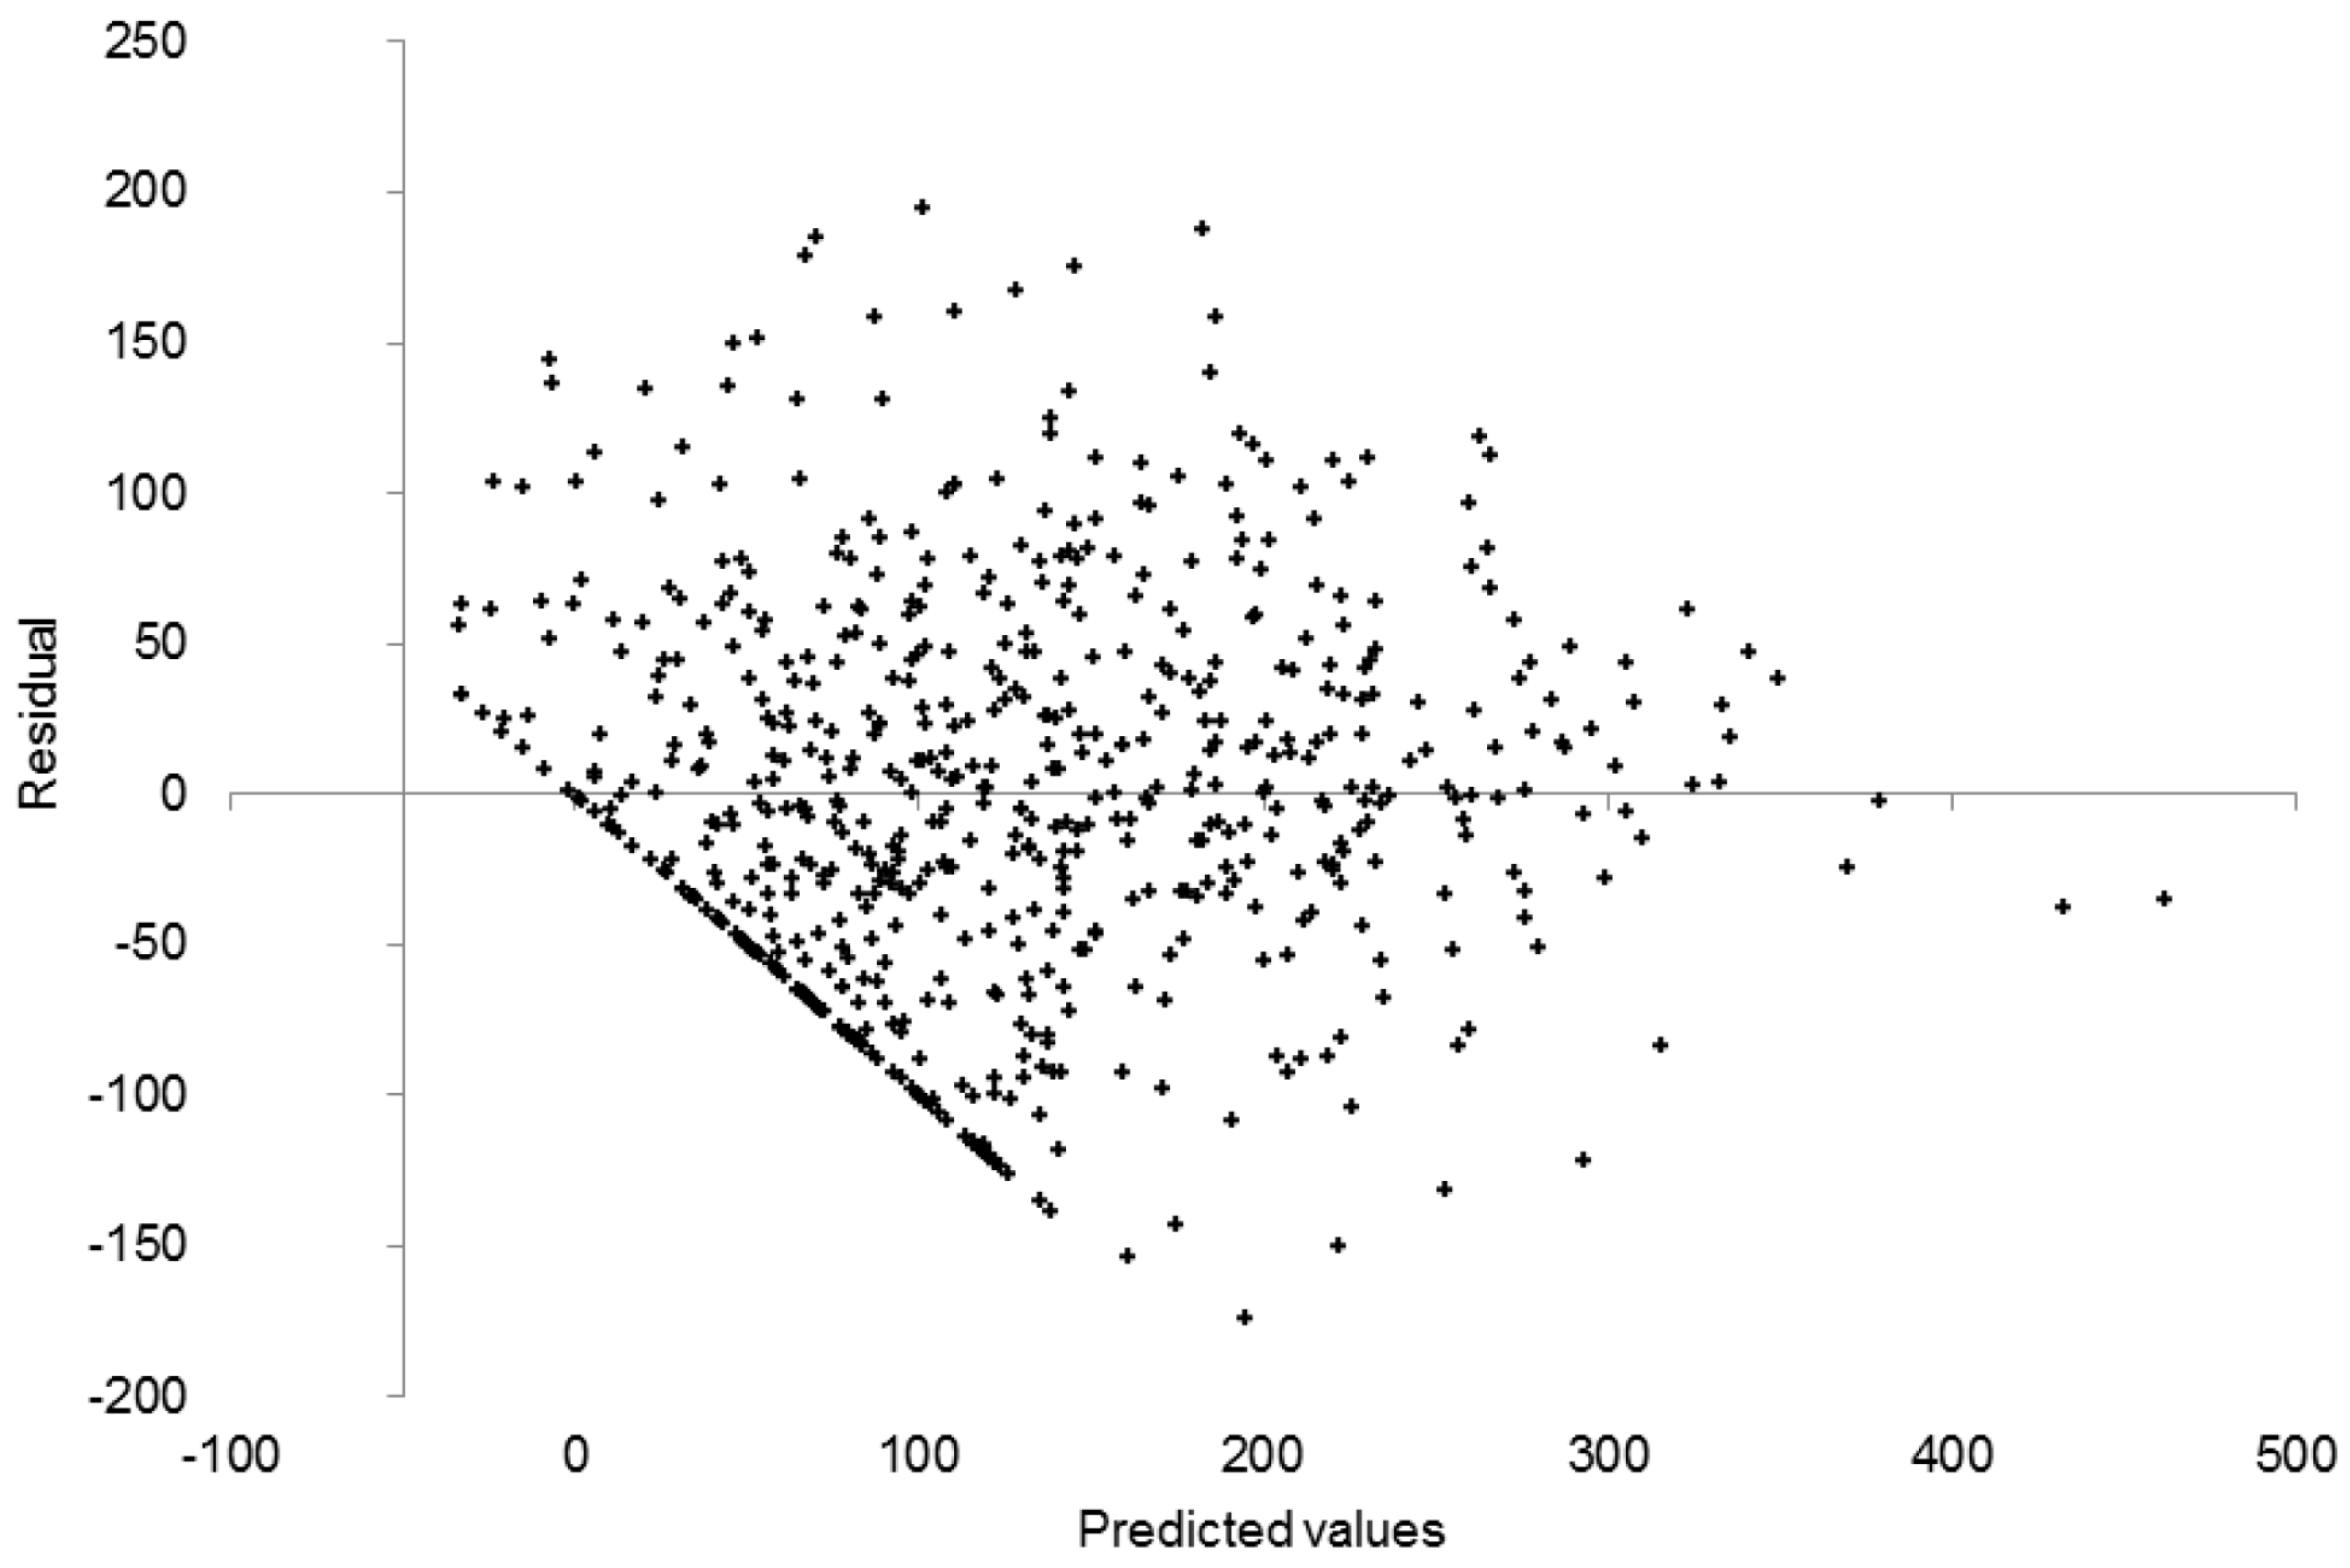
The minimum diameters and average root angles at all 5 cm-segments from the ground upwards seemed to have a significant relation to their distance to the cut surface. However, this model violated an important assumption of linear regression models, because the residuals were not homogenous as expressed by the scatterplot of the residuals showing a sharp edge. Nevertheless, this edge was artificial, because no negative distances to the cut surface were allowed. The edge was marked by the straight line where the negative residuals equaled the predicted values. At a predicted distance of e.g., 100 mm to the cut surface the minimum residual that could occur was –100 mm. The deviation to the negative side could not be greater, because no negative distances to the cut surface were in the data set. If we had measured the tree before logging, we could have determined the distances from above the cut surface too and these distances could have been introduced as negative values into the model. Thus, we would have received a homogenous distribution of the residuals. There might also be certain physical factors located higher than the cut surface that could have influenced stump height but were not considered in the study since only the stump sections were scanned. Further investigations should also consider the shape of the tree before harvesting via a scan of the first 2–3 meters from the ground surface.
A quantile regression applied to the dataset of the last model revealed the lower limit of stump heights, which was imposed by the diameter and the root collar. The model disclosed a limit of minimum diameters at the cut surface of 600 mm. The limiting factor of the particular harvesting head was the opening width of the feed-rollers, which was 550 mm. However, this point was not detected as it was located on the log rather than on the measured stump. The center of the feed-rollers was at a distance of approximately 0.75 m from the level of the saw bar. Therefore, a diameter at the cut surface slightly wider than the maximum opening of the feeding rollers was plausible.
Almost one-third of all stumps could have been cut at a lower level according to the observed limit. There might have been reasonable explanations for cutting the trees at higher levels but they could not be assigned to the size of the stump and the root collar. In the study, the amount of wood which was not exploited was low (0.4% of core wood) but could easily increase in the case of higher stumps. We do not know the variation between different logging operations. Perhaps the stump heights were close to the optimum in our case study and our case is far away from the average. Considering a unit price of 100 €/m3 for Norway spruce sawlog of high quality and an average tree diameter of 1 m3, a monetary loss of about 0.40 €/m3 could be anticipated. At first sight, this might seem quite trivial but when considering that about 60% of the harvests on public forests (approx. 3,000,000 m3) in Bavaria are performed with fully-mechanized systems, the potential value loss could be considerable.
4.5. Review of the Applied Methods
The thresholds detected in this study cannot be generalized as they refer to the specific configuration of the harvesting head. A harvesting head with a greater opening width of the feed-rollers should allow larger diameters at the cut surface. In other cases, the limiting factor might be the width of the lower knifes of the harvesting head. Further studies with different harvesting heads could disclose the effect of the configuration on the cutting level. We recommend scanning the trees before logging and the stumps after logging. Through this method, the shape of the stem above the cutting level could also be included in the model and the distribution of the residuals should be homogenous. Additional attributes of a tree above the cut surface could also be included in the explanatory model.
Within this study, the operator’s line-of-sight and visibility within the harvester cabin was not considered as the field measurement campaign was performed after the completion of the operations. Nevertheless, as one scan was always taken from the intended machine operating trail (clear visibility towards the stump was indispensable), a clear line-of-sight was present for all measured stumps. In a further approach, recording the angle formed between the boom being extended from the machine towards the stump could provide additional information on the position of the harvester and the associated visibility of the operator, thus, further helping to understand the effect of visibility on stump height.
Measuring the minimum diameter at grooves of the contour of the cut surface delivered results which certainly do not refer to the configuration of the harvesting head. In this study, minimum diameters were measured like a caliper measures only for the subsample of 100 stumps. Further studies should measure the diameter in this way, too.
Lastly, we could have chosen other predictor variables. We also could have taken the minimum root angle instead of the average. In fact, we tested different models but the average angle of all roots at one layer delivered better results measured by R-square as compared to the minimum value.


