Article

Structural Diversity in a Mixed Spruce-Fir-Beech Old-Growth Forest Remnant of the Western Carpathians

Department of Silviculture, Faculty of Forestry, Technical University in Zvolen, T.G. Masaryka 24, 960 53 Zvolen, Slovakia
*
Author to whom correspondence should be addressed.
Submission received: 18 April 2018 / Revised: 15 June 2018 / Accepted: 21 June 2018 / Published: 23 June 2018
(This article belongs to the Special Issue Disturbance, Succession, and Development of Forests)

Abstract

:
Old-growth forests are a unique source of information for close-to-nature silviculture. In the National Nature Reserve Dobročský prales (Slovakia), a remnant of mixed old-growth forests of the Western Carpathians, we analyzed changes in tree species composition, stand structure, and creation and closure of canopy gaps. The results were based on data from forest inventories of an entire reserve conducted in 1978 and 2015, extended by detailed measurements in a research plot of 250 × 250 m. We observed the expansion of common beech (Fagus sylvatica L.) at the expense of conifers (Abies alba Mill., Picea abies L. Karst.) in all layers of the stand. Due to a lack of conifers in the category of saplings >130 cm and an abundance of coniferous deadwood, we hypothesize that this development will lead to the dominance of beech. All development stages revealed a reverse J-shaped diameter structure; however, they differed in the majority of basic stand characteristics (e.g., growing stock, basal area, tree density, deadwood volume). Most of the structural indices did not differ between development stages, confirming a relatively high degree of structural differentiation throughout the development cycle. The total gap area reached 18%, with the dominance of small gaps ≤100 m2. Nevertheless, only canopy gaps >100 m2 formed by the mortality of three or more trees were of higher importance for the extensive establishment of natural regeneration.

1. Introduction

Although the old-growth forests formed by mixtures of silver fir (Abies alba Mill.), common beech (Fagus sylvatica L.) and Norway spruce (Picea abies L. Karst.) once represented the dominant type of European mountain forests, currently only their remnants can be found scattered in some areas of central and south-eastern Europe [1,2]. Due to their structural diversification and conservation of biodiversity, these old-growth forest remnants are strictly protected and provide an opportunity to study the dynamics of natural processes in intact old-growth forests [3,4]. Understanding of these processes is essential for the development of close-to-nature silvicultural systems and their implementation in forestry practice [5].
In the past, the structure of mixed common beech-silver fir-Norway spruce old-growth forests was considered as relatively stable; however, these ecosystems appear to be experiencing significant changes. There are numerous studies confirming the decline of conifer species (silver fir, Norway spruce) in tree species mixtures [6,7,8,9,10,11,12]. On the contrary, many authors make reference to the increasing dominance of common beech observed in forests across Europe [7,13,14]. Responses to natural and anthropogenic disturbances in mixed stands are usually very complicated and each tree species can respond to similar disturbances with different intensities [15,16]. The dynamic of natural mixed forests is driven by disturbances of smaller scale and higher frequency, that remove single or eventually small groups of trees and favour multi-layered stand structure, but also by less frequent disturbances of intermediate or large scale, that allow shade-intolerant species to establish and survive [17,18,19,20]. Small-scale disturbances favour silver fir because of its high tolerance to shade, but on the other hand, silver fir is negatively affected by high deer browsing [21,22], the expansion of beech [8,18] and in the past also by air pollution [23,24]. Intermediate disturbances promote both common beech and Norway spruce establishment [25]; however, currently we can observe different development trends of these tree species. While common beech seems to be favoured by climate change, resulting in more frequent seed crops, lower sensitivity to competition from ground vegetation or a prolonged growing season [12], Norway spruce suffers from longer drought periods, bark-beetle outbreaks and more frequent and stronger wind disturbances [11].
Traditionally, the development dynamic of European temperate forests was described by the “forest cycle” concept [26] with a cyclic succession of idealized development phases [27,28]. Korpeľ [2] identified three development stages (Initial, Optimal and Decay), that are characterized by typical attributes of forest structure and by natural processes determining changes in forest structure (e.g. accumulating, or breaking down of stand biomass, regeneration processes, senescence). Structural attributes are usually defined by basic structural characteristics (e.g., tree density, basal area, growing stock, diameter structure, crown engagement ratio, amount of deadwood), which provide only limited information on the spatial arrangement of the forest. The need to include the spatial patterns of trees in the studies of development dynamics has been frequently emphasized; nevertheless, only a few studies to date have investigated spatial structure in mixed old-growth forests of the Western Carpathians [29]. Although the measurements of spatial arrangement of trees and structural complexity using structural indices could be quite complicated, they can considerably contribute to the complex assessment of forest stand structure [30,31]. As the structural complexity has a significant impact on ecosystem regeneration, growth, production and resilience [31,32,33,34], structural indices may become an important tool in planning of the forest management measures in mixed stands.
A crucial issue in the identification of development stages is the definition of a minimal stage area. Several authors have reported problems with stage classification on overly large plots (e.g., [5,17,35,36,37]), as they captured more developmental stages with different naturally ongoing processes. Thus, to classify stands to the appropriate developmental stage, authors have recommended using plot sizes that correspond to the extent of gap-scale processes that largely drive structural and successional patterns. The minimal stage area should be a compromise between the minimal size of the canopy gap that allows for natural regeneration, since such a canopy gap is a prerequisite for a new development stage, and practicability of field work [35]. Although the most common disturbance regime in beech-dominated natural forests is very small in scale [5,18,38], to capture the full range of development stages within the forest succession cycle requires a fairly large research plot [2,39]. Therefore, when studying development dynamics, it is recommended to conduct the surveys on sufficiently large research plots segmented at an appropriate scale according to the local disturbance regime [40].
The main goals of this paper are (1) to analyse the long-term changes of tree species composition in a mixed common beech-silver fir-Norway spruce forest developing with no direct human impact; (2) to determine the attributes of old-growth forest and to test the hypothesis that they significantly differ among the development stages; and (3) to investigate the structure of canopy gaps and to assess their impact on the development of seedlings and saplings.

2. Materials and Methods

2.1. Study Area

The study site, the National Nature Reserve (NNR) Dobročský prales, is situated in the central part of Slovakia in the Slovenské Rudohorie Mts. (48°40′37′′N, 19°40′34′′E, approximately 885–965 m above sea level). The reserve with the core zone of 49.88 hectares was declared in 1913 and has been untouched since the declaration. At present, the area has been enlarged to 101.82 hectares with the wide buffer zone. The natural forest is composed mainly of common beech (Fagus sylvatica L.), silver fir (Abies alba Mill.) and Norway spruce (Picea abies L. Karst.) with minor occurrence of maples (Acer pseudoplatanus L., Acer platanoides L.), European ash (Fraxinus excelsior L.) and wych elm (Ulmus montana With.). The area is humid and cold with annual precipitation of 840–940 mm, of which 515–600 mm falls in the growing season. The mean temperature ranges from 4.5 to 5.8 °C [41]. The prevailing soils are deep cambisols developed from the bedrock of biotite granodiorite [2]. Herb-rich communities of the reserve belong to the Dentario enneaphylli-Fagetum (Oberdorfer ex W. et A. Matuszkiewicz 1960) salvietosum glutinosae (Moravec 1974) subassociation, and the Fagion (Luquet 1926) alliance [42]. NNR Dobročský prales is one of the few remnants of original common beech-silver fir-Norway spruce old-growth forests and therefore it can be regarded as a typical representative for this forest type in the Western Carpathians (Table A1).

2.2. Data Collection and Analysis

In the core zone of the reserve (49.88 ha) (Figure 1), the forest inventory was conducted in 2015. We registered tree species and diameter at breast height (dbh) of all living stems ≥8 cm. To assess the long-term dynamics of tree species composition, the data were subsequently compared with the results of a historical forest inventory from 1978 (done in the same way).
More detailed analysis of stand structure, development stages and canopy openings was based on the data from a permanent research plot (PRP) located in the core zone of the reserve (Figure 1). The main criteria for the location of the PRP were to avoid the core zone boundaries and to be representative of the average conditions of the NNR (e.g., slope, aspect, dominant vegetation community). The size and design of the PRP were adjusted to the needs of the canopy gaps mapping, as it requires a sufficiently large, compact area to be captured [43]. The 6.25 ha square (250 × 250 m) plot was divided into 12.5 × 12.5 m subplots (Figure 2a). In the research plot, we recorded all living stems and standing deadwood (snags) with dbh ≥8 cm as well as down deadwood (logs) with large-end diameter ≥20cm and length ≥2 m. For all standing stems, we registered tree species, dbh, status (living or dead) and in the case of broken snags also the height. Parameters recorded for logs were tree species, small- and large-end diameter, length and exact location within the plot (Figure 2b). All snags and logs were assigned to one of four decay classes according to Albrecht [44]: freshly dead (1), moderate decay (2), advanced decay (3) and strongly decomposed (4). In decay class 4, the identification of tree species was no longer possible, so the deadwood was classified only as conifer or broadleaved according to the pattern of knot remnants.
Additional characteristics of surveyed stems were measured on the 50 × 200 m large transect in the central part of the research plot (Figure 2a). We recorded the exact position and height of each standing tree with dbh ≥2 cm and for living stems also crown base height and crown projection (four radii in two perpendicular directions). The density of seedlings and saplings (dbh ≤2 cm) was registered on a series of 128 circular plots with the radius of 2 m distributed regularly over the transect. Each individual was assigned to a tree species and height category (seedlings—0–20 cm, saplings—21–50 cm, 51–80 cm, 81–130 cm, >130 cm). The vertical profile of the stand was divided into three height layers (lower, middle and upper) according to stand dominant height (h10%—height of the tallest 10% trees). Growth space utilization was quantified as the ratio between the sum of crown volumes and the volume of space with the base delineated by the research plot (or subplot) and the height equal to the dominant height of the stand. The crown engagement ratio expressed the share of the sum of crown projections from the area of the research plot (or moving window). The volume of individual trees was calculated according to the two-parameter (dbh, height) equations derived by Petráš and Pajtík [45]. The heights of trees outside the transect were calculated using stand height curve, which was constructed for each tree species based on the data from the transect. The downed deadwood volume was computed by Smalian’s formula [46].
In the entire research plot, canopy openings and spatial extent of natural regeneration were mapped as polygons using FieldMap® technology (IFER—Monitoring and Mapping Solutions, Ltd., Jílové u Prahy, Czech Republic) (Figure 2c,d). The extent of patches of spatially continuous natural regeneration (m2·ha−1) were classified according to dominant tree species and height or diameter category (height 0–50 cm, 51–130 cm, >130 cm up to dbh 2 cm, dbh 2–8 cm). We distinguished two types of canopy openings according to Runkle [47]: canopy gaps and expanded gaps. The area of canopy gap was delineated by the crown projections of trees surrounding the canopy opening. The expanded gap included the canopy gap and the adjacent area limited by the stems of trees surrounding the canopy gap. Canopy openings were registered if their area was >5 m2, the remnants of gapmakers (trees, whose mortality had created the gap) were still present and the mean dbh of the next tree generation within the gap did not exceed 8 cm.
Each of the 12.5 × 12.5 m subplots was assigned to a particular development stage (Initial, Optimal, Decay) according to the criteria presented in Table A2. Subplots of this size were used in similar studies (e.g. [28,35,43]) and regarded as the lower limit for the identification of development stages. Values of basic stand characteristics and structural indices were calculated for a larger area of 25 × 25 m (four subplots) to decrease the impact of the edge effect. To obtain the input data for the calculation, we used the approach proposed by Král et al. [36] with the square moving window (a = 25 m) shifting through the sufficiently large patches of development stages.
As additional characteristics of stand structure, we calculated the following structural indices: distance-independent—Gini coefficient for heights [48], Shannon diversity index [49], homogeneity coefficient [50], standardized diversity [49] and stand density index [51] as well as distance-dependent—aggregation index [52,53], diameter differentiation index [54] and structural complexity index [30]. The Gini coefficient (G) is one of the vertical structure characteristics, which characterizes inequity in the distribution of tree heights and reaches the values from 0 (maximal uniformity, all trees have equal height) to 1 (maximal non-uniformity). The Shannon diversity index (H′) is a mathematical measure of species diversity in a community. The H′ value allows us to know how the stem density or basal area of the species is distributed among all the species in the community. High values of H′ would be representative of more diverse communities with evenly distributed species. A community with one species would have an H′ value 0. The standardized diversity (E) reaches a maximal value 1 in the case of equal tree species representation (stem density or basal area) in the stand and it decreases to 0 as differences between tree species increase. The homogeneity coefficient (H) is based on the relationship between the distribution of stem density and growing stock in dbh classes. It is calculated as the ratio between the sum of cumulated stem density percentages of each dbh class and the sum of differences between the cumulated stem density percentage and cumulated growing stock percentage of each dbh class. The theoretical maximum (H = infinity) means that the growing stock is distributed evenly in all dbh classes. As the distribution departs from this state, the value of H decreases towards the theoretical minimum (H = 1). The aggregation index (R) describes the spatial distribution of stems on the surveyed plot. The index enables one to identify deviation from a random distribution (value 1) to regular (>1) or aggregated (<1) distribution. To test the significance of a deviation from a random distribution towards a regular distribution or aggregation, we used a standard, normally distributed test statistic TR with the boundary correction factor by Donnelly [53]. The diameter differentiation index (T) reflects the differentiation in size (dbh) between three nearest neighbours. T ranges from 0 to 1 (highly differentiated stands). The structural complexity index (SCI) incorporates tree size differentiation (h, dbh) and horizontal spatial positioning. SCI is based on spatial tessellation that creates a triangulated irregular network of non-overlapping triangles of tree neighbours that are as equilateral as possible. The lowest value of SCI is 1 (all trees have the same size) without the upper limit. Structural indices were calculated by Bwinpro 7.5 (FVA, Freiburg, Germany) and Matlab V.8.2 software (Mathworks Inc., Natick, MA, USA).
Statistical evaluations were performed using Statistica 7 software (StatSoft, Inc., Tulsa, OK, USA). Differences between diameter distributions were compared by the nonparametric two-sample Kolmogorov–Smirnov test. Factorial MANOVA (for H′N and H′BA) and one-way MANOVA (for all other stand characteristics and structural indices) with a modification of post hoc Tukey HSD test for unequal sample sizes were used to determine significant differences among development stages. Prior to the analysis, data were tested for normality and homogeneity of variances, and transformed using the arcsine (percentages) and Box–Cox transformation (H, EBA). Considering the unequal sample size, for the calculation of Sums of Squares, we used the Type III that is not sample size dependent. The alpha level used for all tests was 0.05. To describe long-term changes in species composition and successional trajectory, we used detrended correspondence analysis (DCA, [55]) which was conducted in the R software environment (R Development Core Team, 2010). Input data for the DCA were the values basal area of tree species in stand layers (lower, middle, upper) calculated from the forest inventories conducted in the reserve in 1978 and 2015.

3. Results

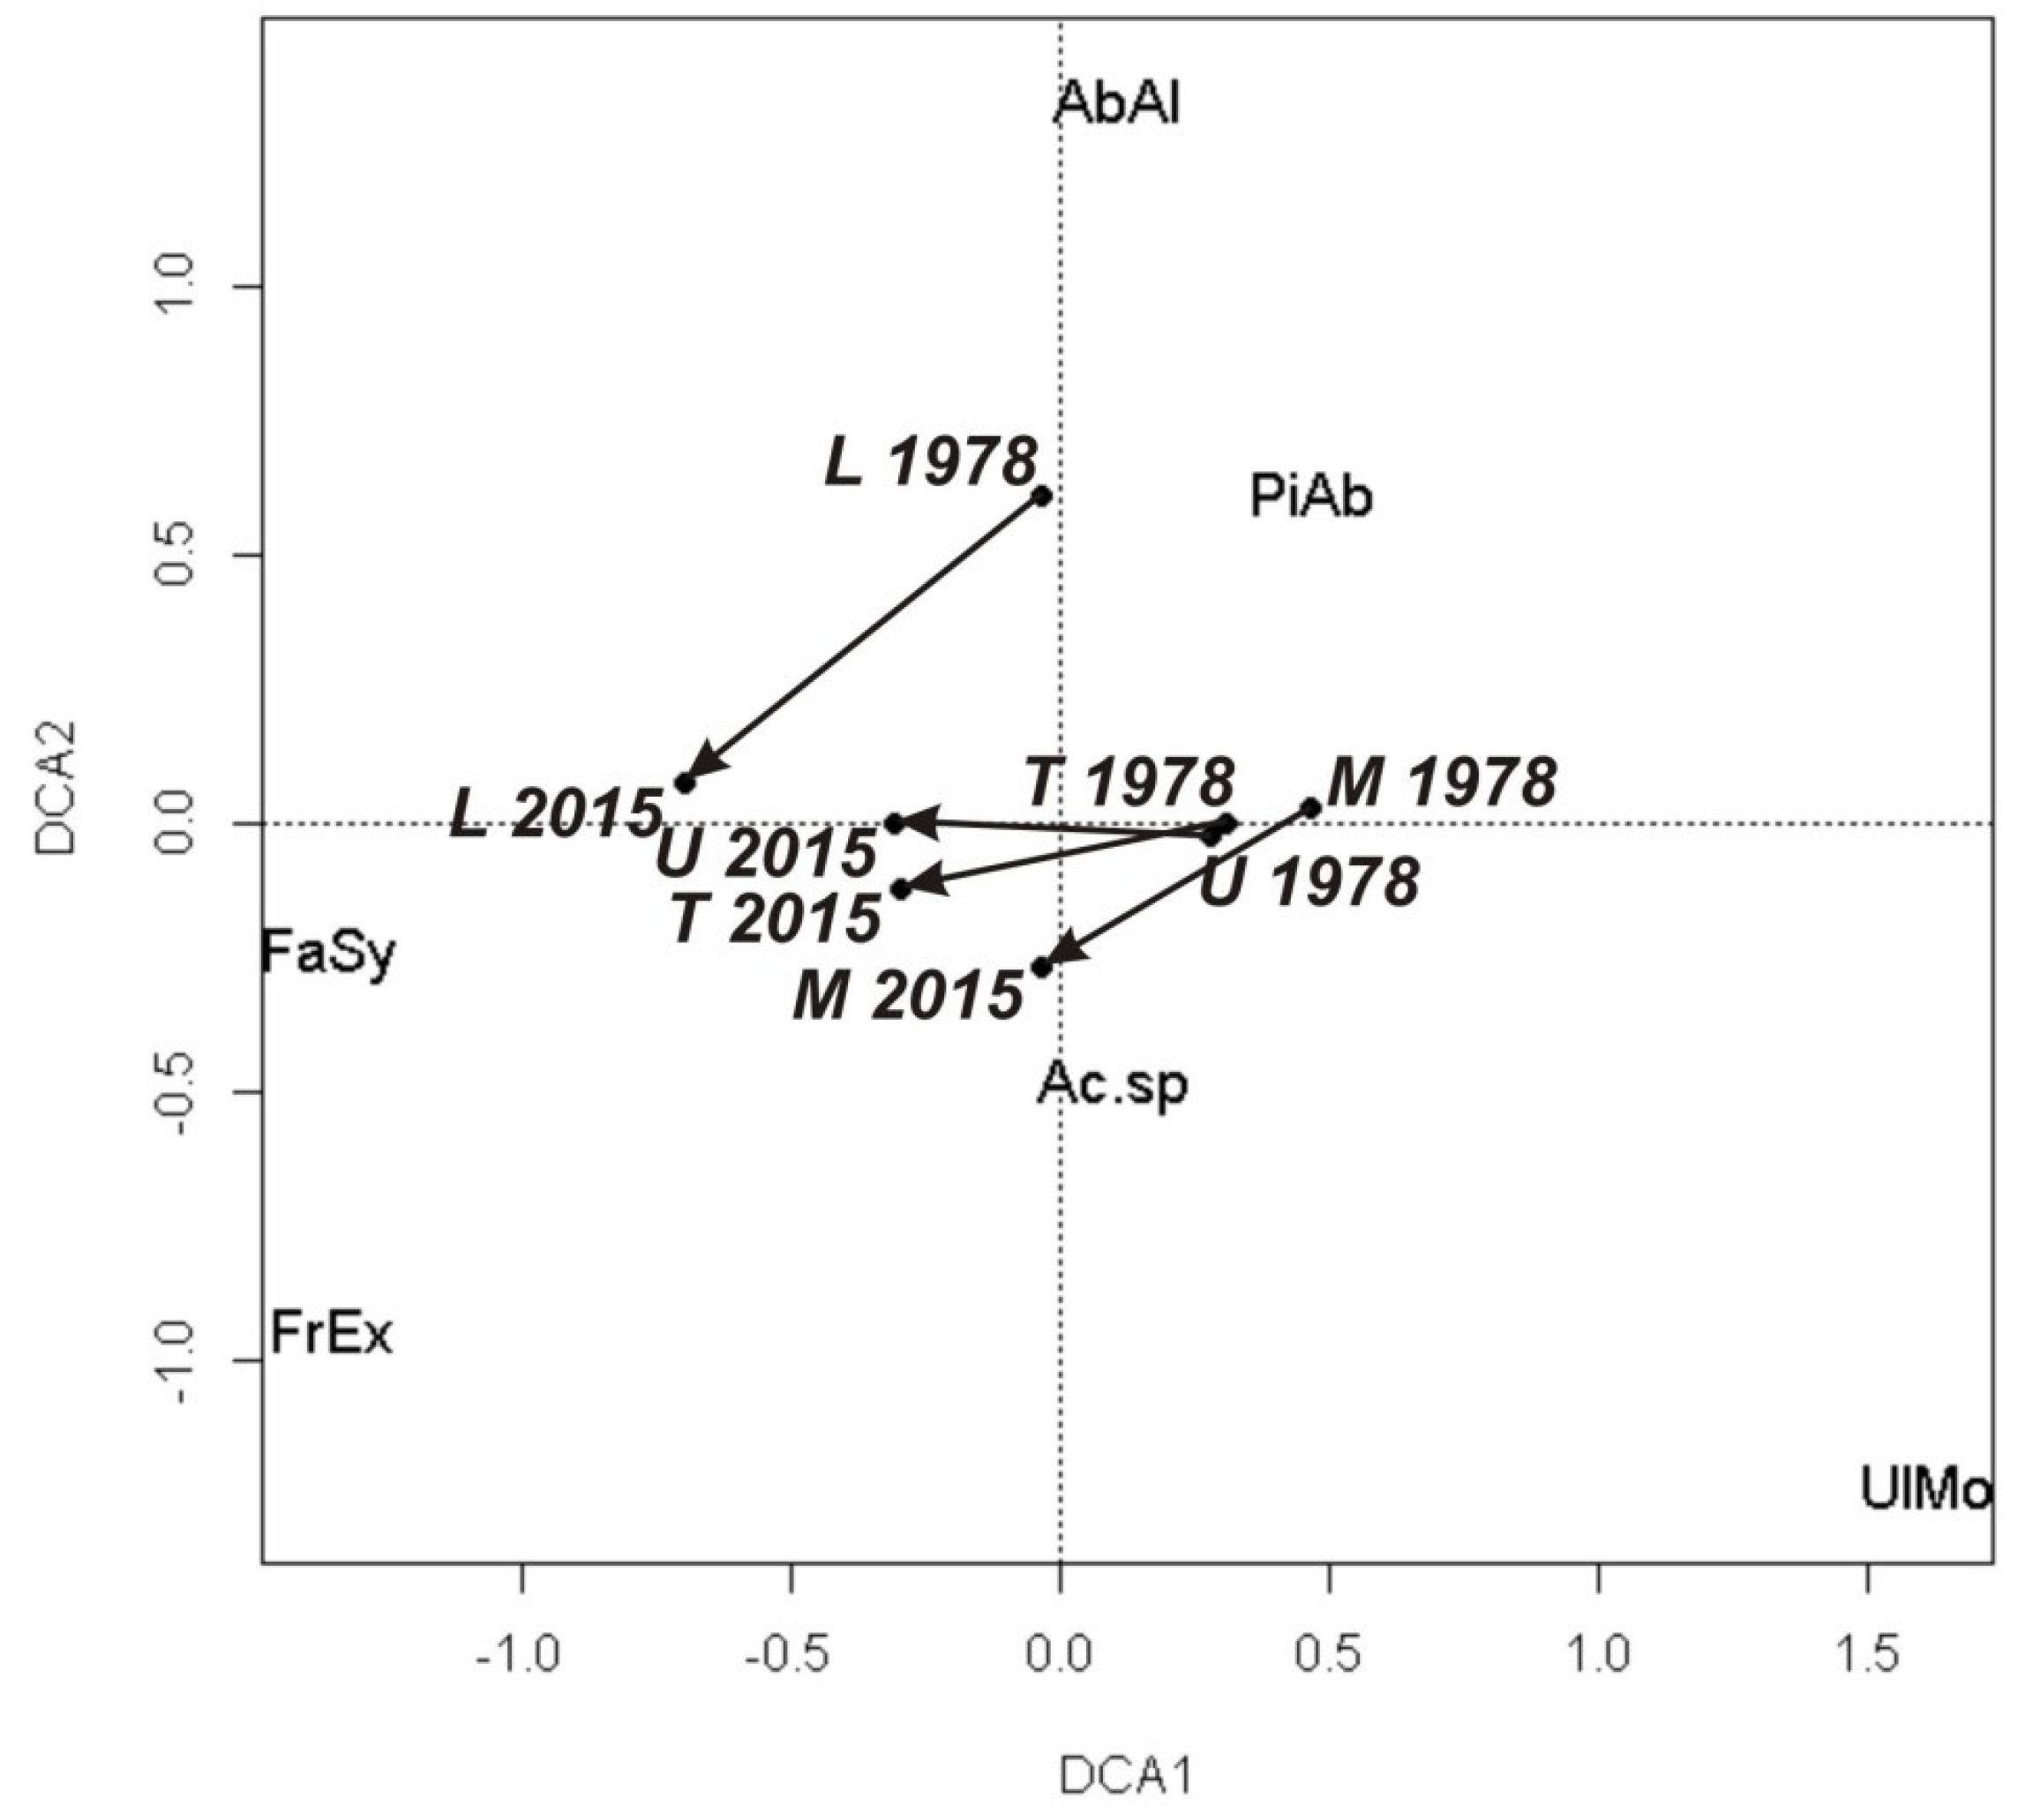
3.1. Changes in Tree Species Composition

In the entire reserve, we observed an overall increase of basic stand characteristics in the period 1978–2015, ranging from 6% for basal area to 9% for stem density (Table 1). Analysis of the long-term changes in tree species composition by the DCA (Figure 3) confirmed the shift from the quadrant of the fir and spruce dominance towards the quadrant with the dominance of beech. The two DCA axes accounted cumulatively for 21.9% of the variation in tree species composition. The general trend of increasing beech dominance at the expense of conifers was registered in all stand layers as well, whereas in the upper layer we also recorded an increase in silver fir’s importance in all basic stand characteristics at the expense of spruce.
As regeneration processes are a prerequisite for continual ingrowth of individuals into stand layers, we made detailed measurements of seedlings and saplings density on the transect within the PRP (Table 2). Results confirmed the dominance of fir that accounted for 51% and occurred almost exclusively in the category ≤20 cm. In the category of saplings >130 cm, 99% of the 502 individuals per hectare proved to be beech. The low share of spruce individuals (1%) located only in the lowest height classes is disproportionate to its share on the growing stock (Table 3). Seedlings and saplings of maples and European ash were densely presented in lower categories, but toward the higher categories their numbers also dropped.

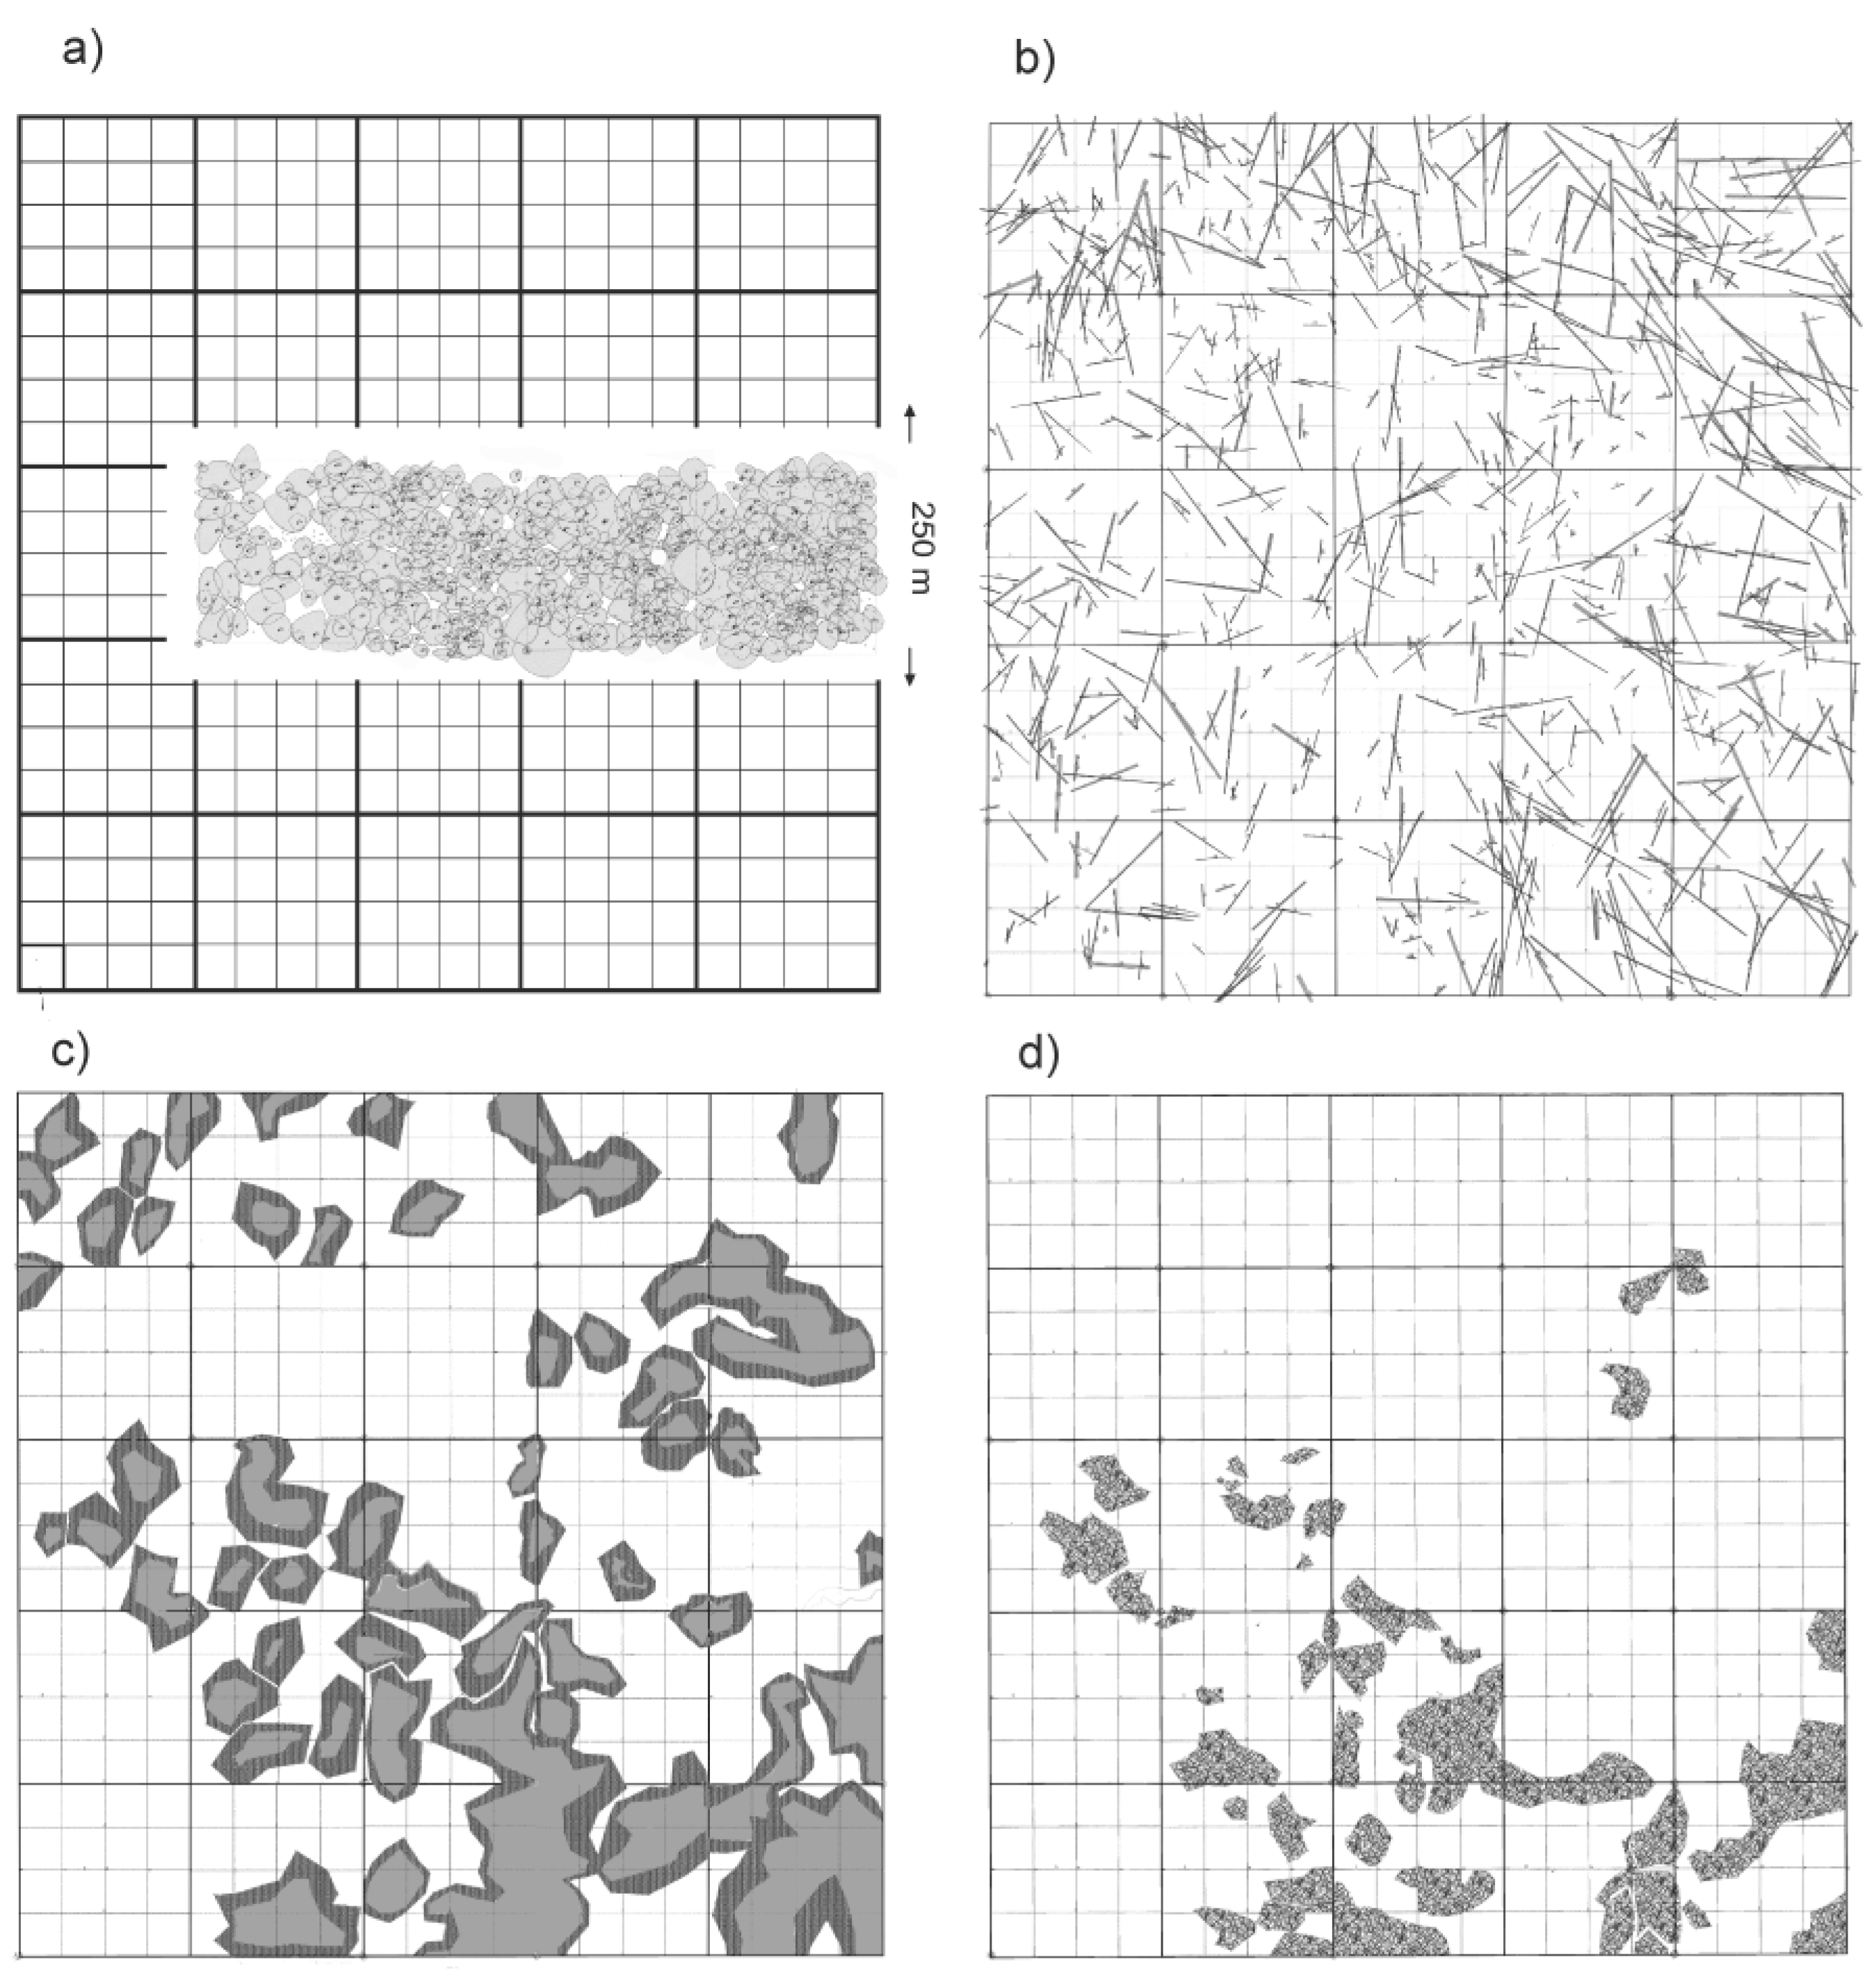
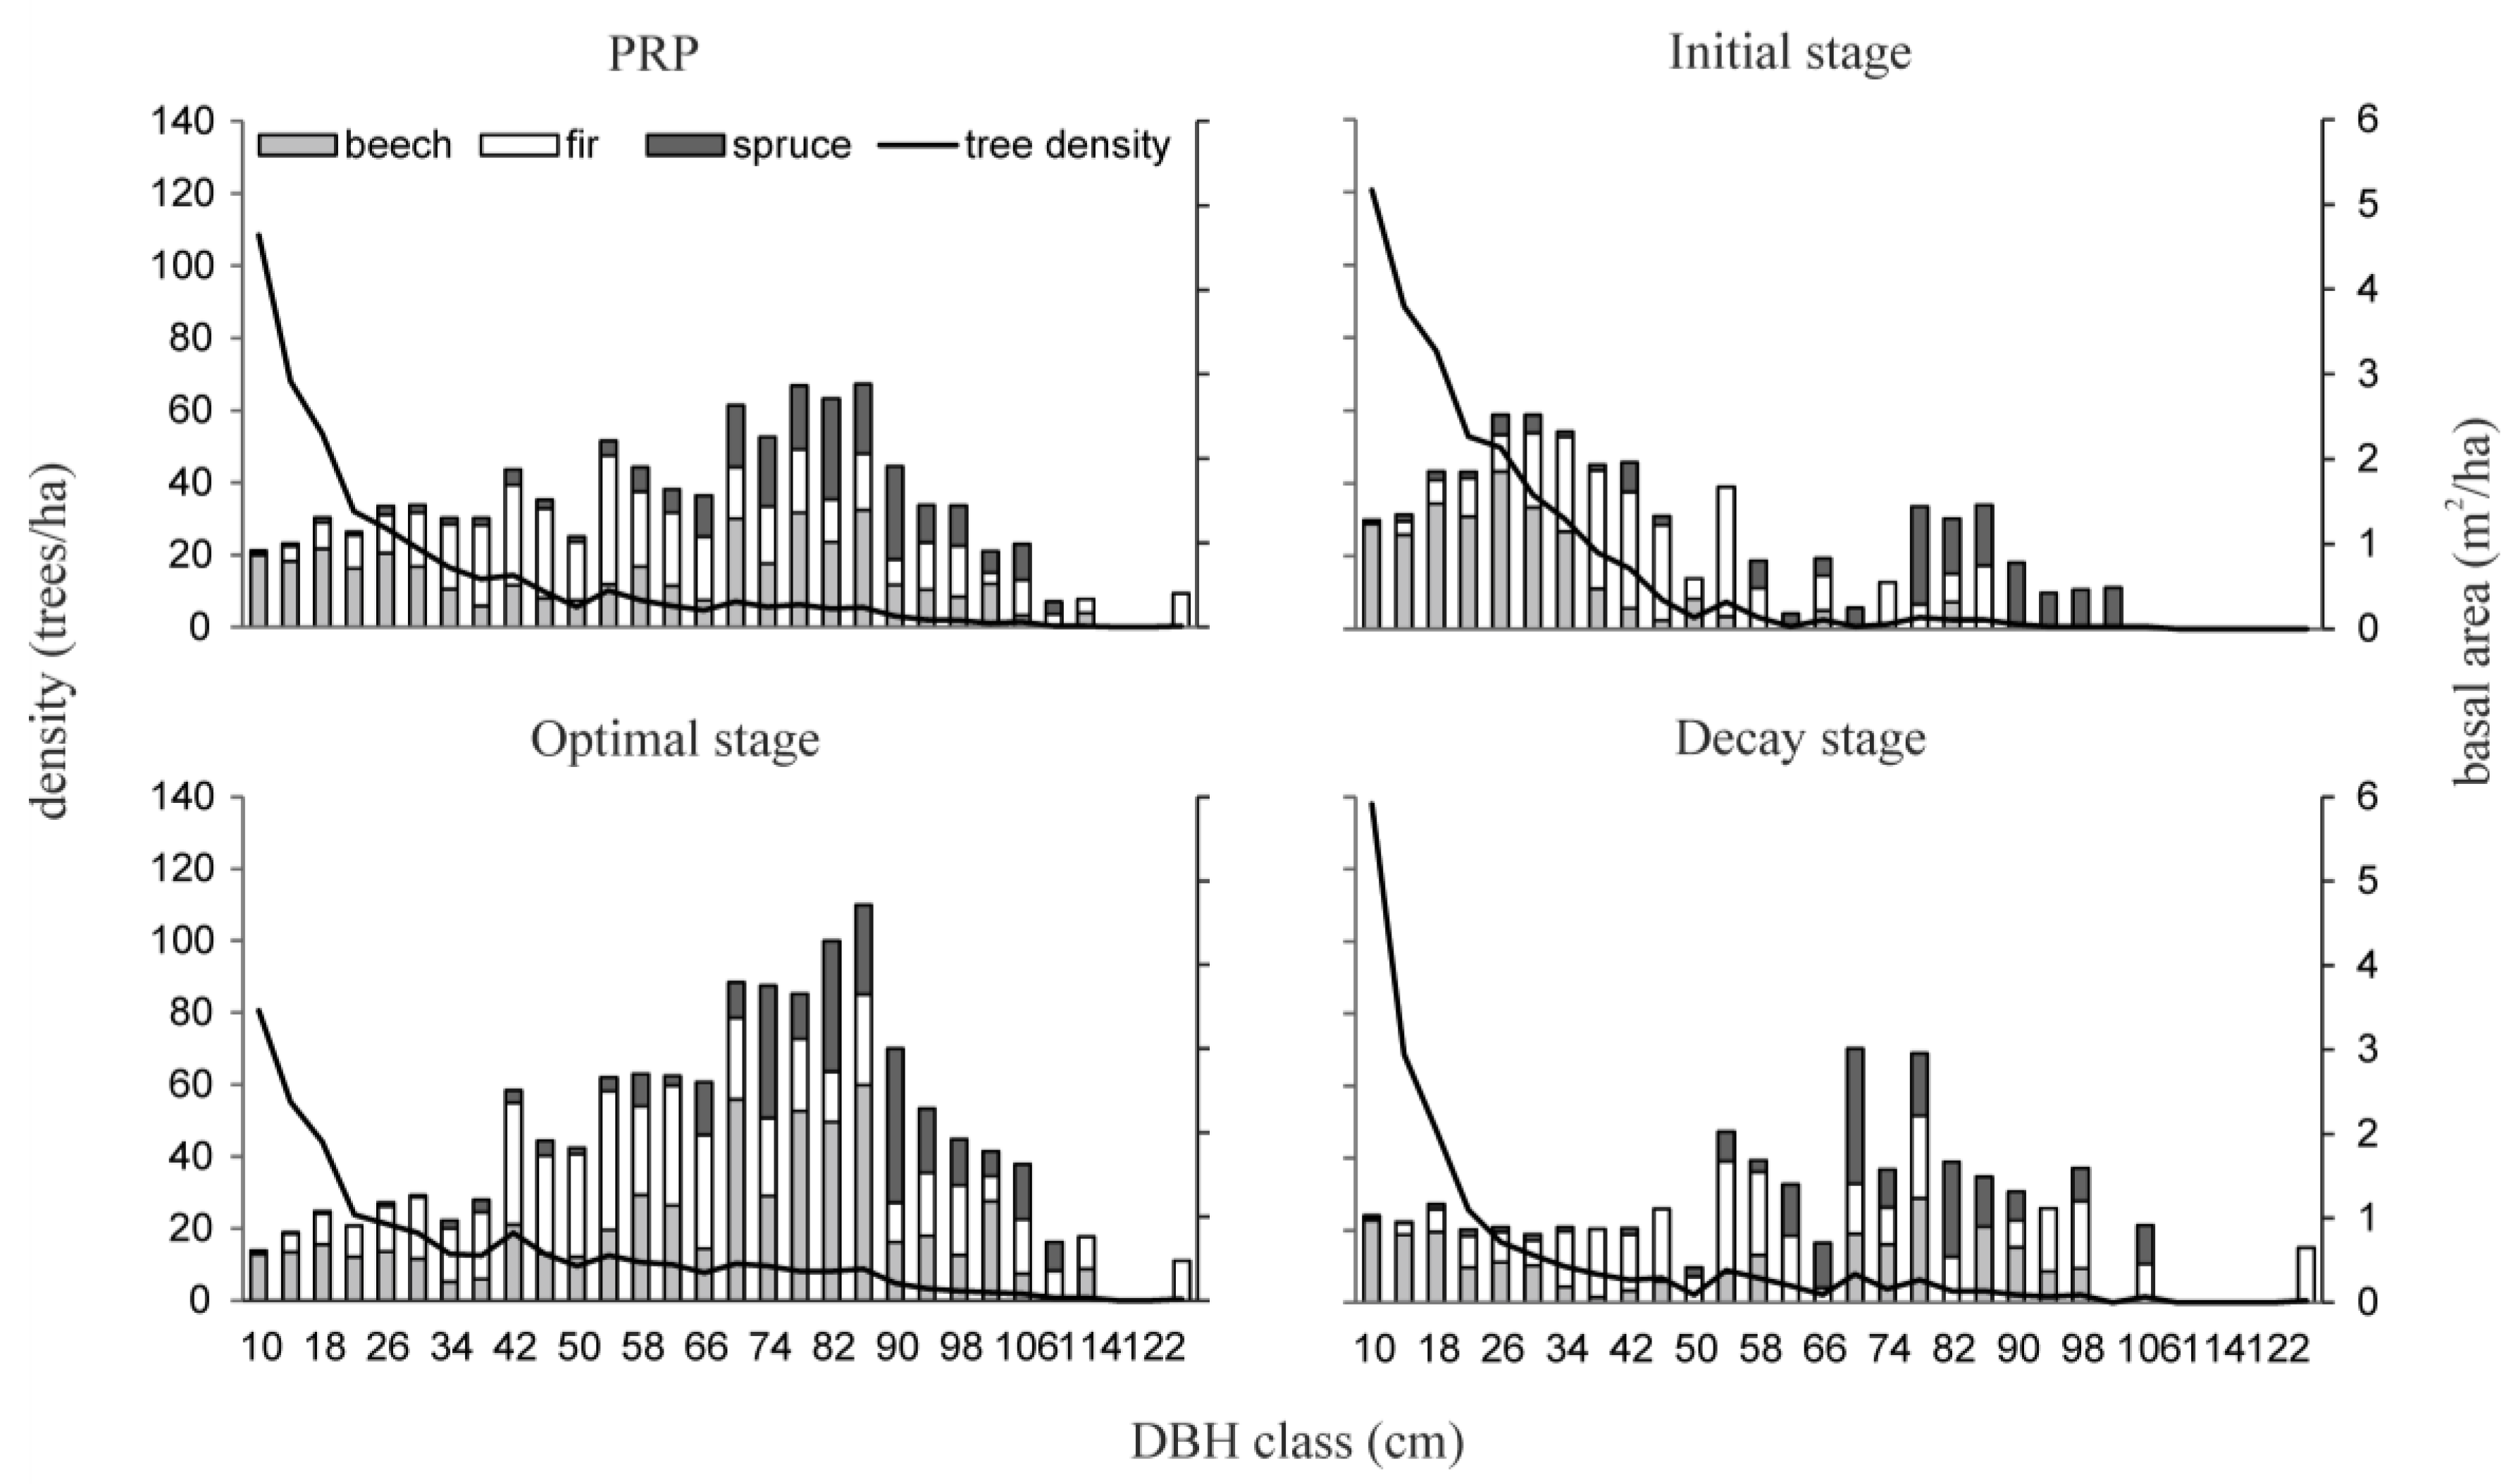
3.2. Attributes of the Old-Growth Forest Structure

Based on the data from the permanent research plot (Table 3), the investigated area was dominated by the Optimal stage (44%), followed by the Decay (30%) and Initial stage (26%). All development stages were predominantly composed of three species: silver fir, common beech and Norway spruce, without any significant differences between their proportions.
Diameter structure in the entire investigated plot as well as in particular development stages exhibited a general reverse J-shaped form (Figure 4); however, the distributions differed significantly according to the development stage. For the Initial stage, besides the highest tree density (Table 3) and right-skewed basal area distribution, the high proportion of beech in the basal area of the lower and middle layer was characteristic. Although there was no significant difference between Decay and Initial stage in growing stock and basal area, they differed significantly in tree densities and diameter distributions. In the Optimal stage, the highest growing stock and basal area were confirmed, while the stem density did not differ from that of the Decay stage.
The mean volume of downed deadwood reached 260 m3·ha−1 (Table 3), which represented 36% of growing stock. The majority of the logs originated from conifers (95%) and the most common were the logs in decay class 4 (48%). In decay classes 1–3, where the classification of tree species was possible, spruce (61%) was dominant over fir (34%). The proportion of standing deadwood represented, on average, 7% of growing stock, with the majority of stems in decay class 2 (44%). Regarding the tree species, fir accounted for 78% of snags, followed by spruce with 14% and beech with 7%. The crown engagement ratio reached the average value 1.4; however, it differed significantly between development stages. Moreover, there were differences between the proportions of stand layers in the crown engagement ratio in particular development stages. In the Initial stage, the major share in the crown engagement ratio (68%) was represented by the middle layer. In the Optimal stage, the upper layer (55%) was accompanied by the middle layer (36%) and in the Decay stage, the upper layer was dominant (68%).
Values of structural indices (Table 4) were relatively balanced, with only few significant differences between development stages (EN, T); they confirmed a relatively high degree of structural differentiation. Nevertheless, significant differences of tree species diversity (H′N, H′BA) could be observed between the stand layers within a particular development stage. In all development stages, the species diversity quantified by the Shannon index (H′) and standardized diversity (E) expressed higher diversity according to the share of tree species on the basal area than on the tree density. This resulted mainly from the high number of understory beech stems and was even more pronounced when we analysed the differences in species diversity between stand layers within the development stage. The lower layer was composed almost exclusively of beech (especially in the Initial stage), resulting in low diversity index values and increasing species diversity towards the upper layer. According to the aggregation index (R), we registered the random distribution of stems in nearly all stand layers and development stages. The only exception was the lower layer for the whole PRP where the distribution of stems was aggregated. When we compared the average values of structural indices in development stages with values in the PRP, we observed higher species diversity (H′ and E) and more homogenous structure (H and SCI) in the PRP.

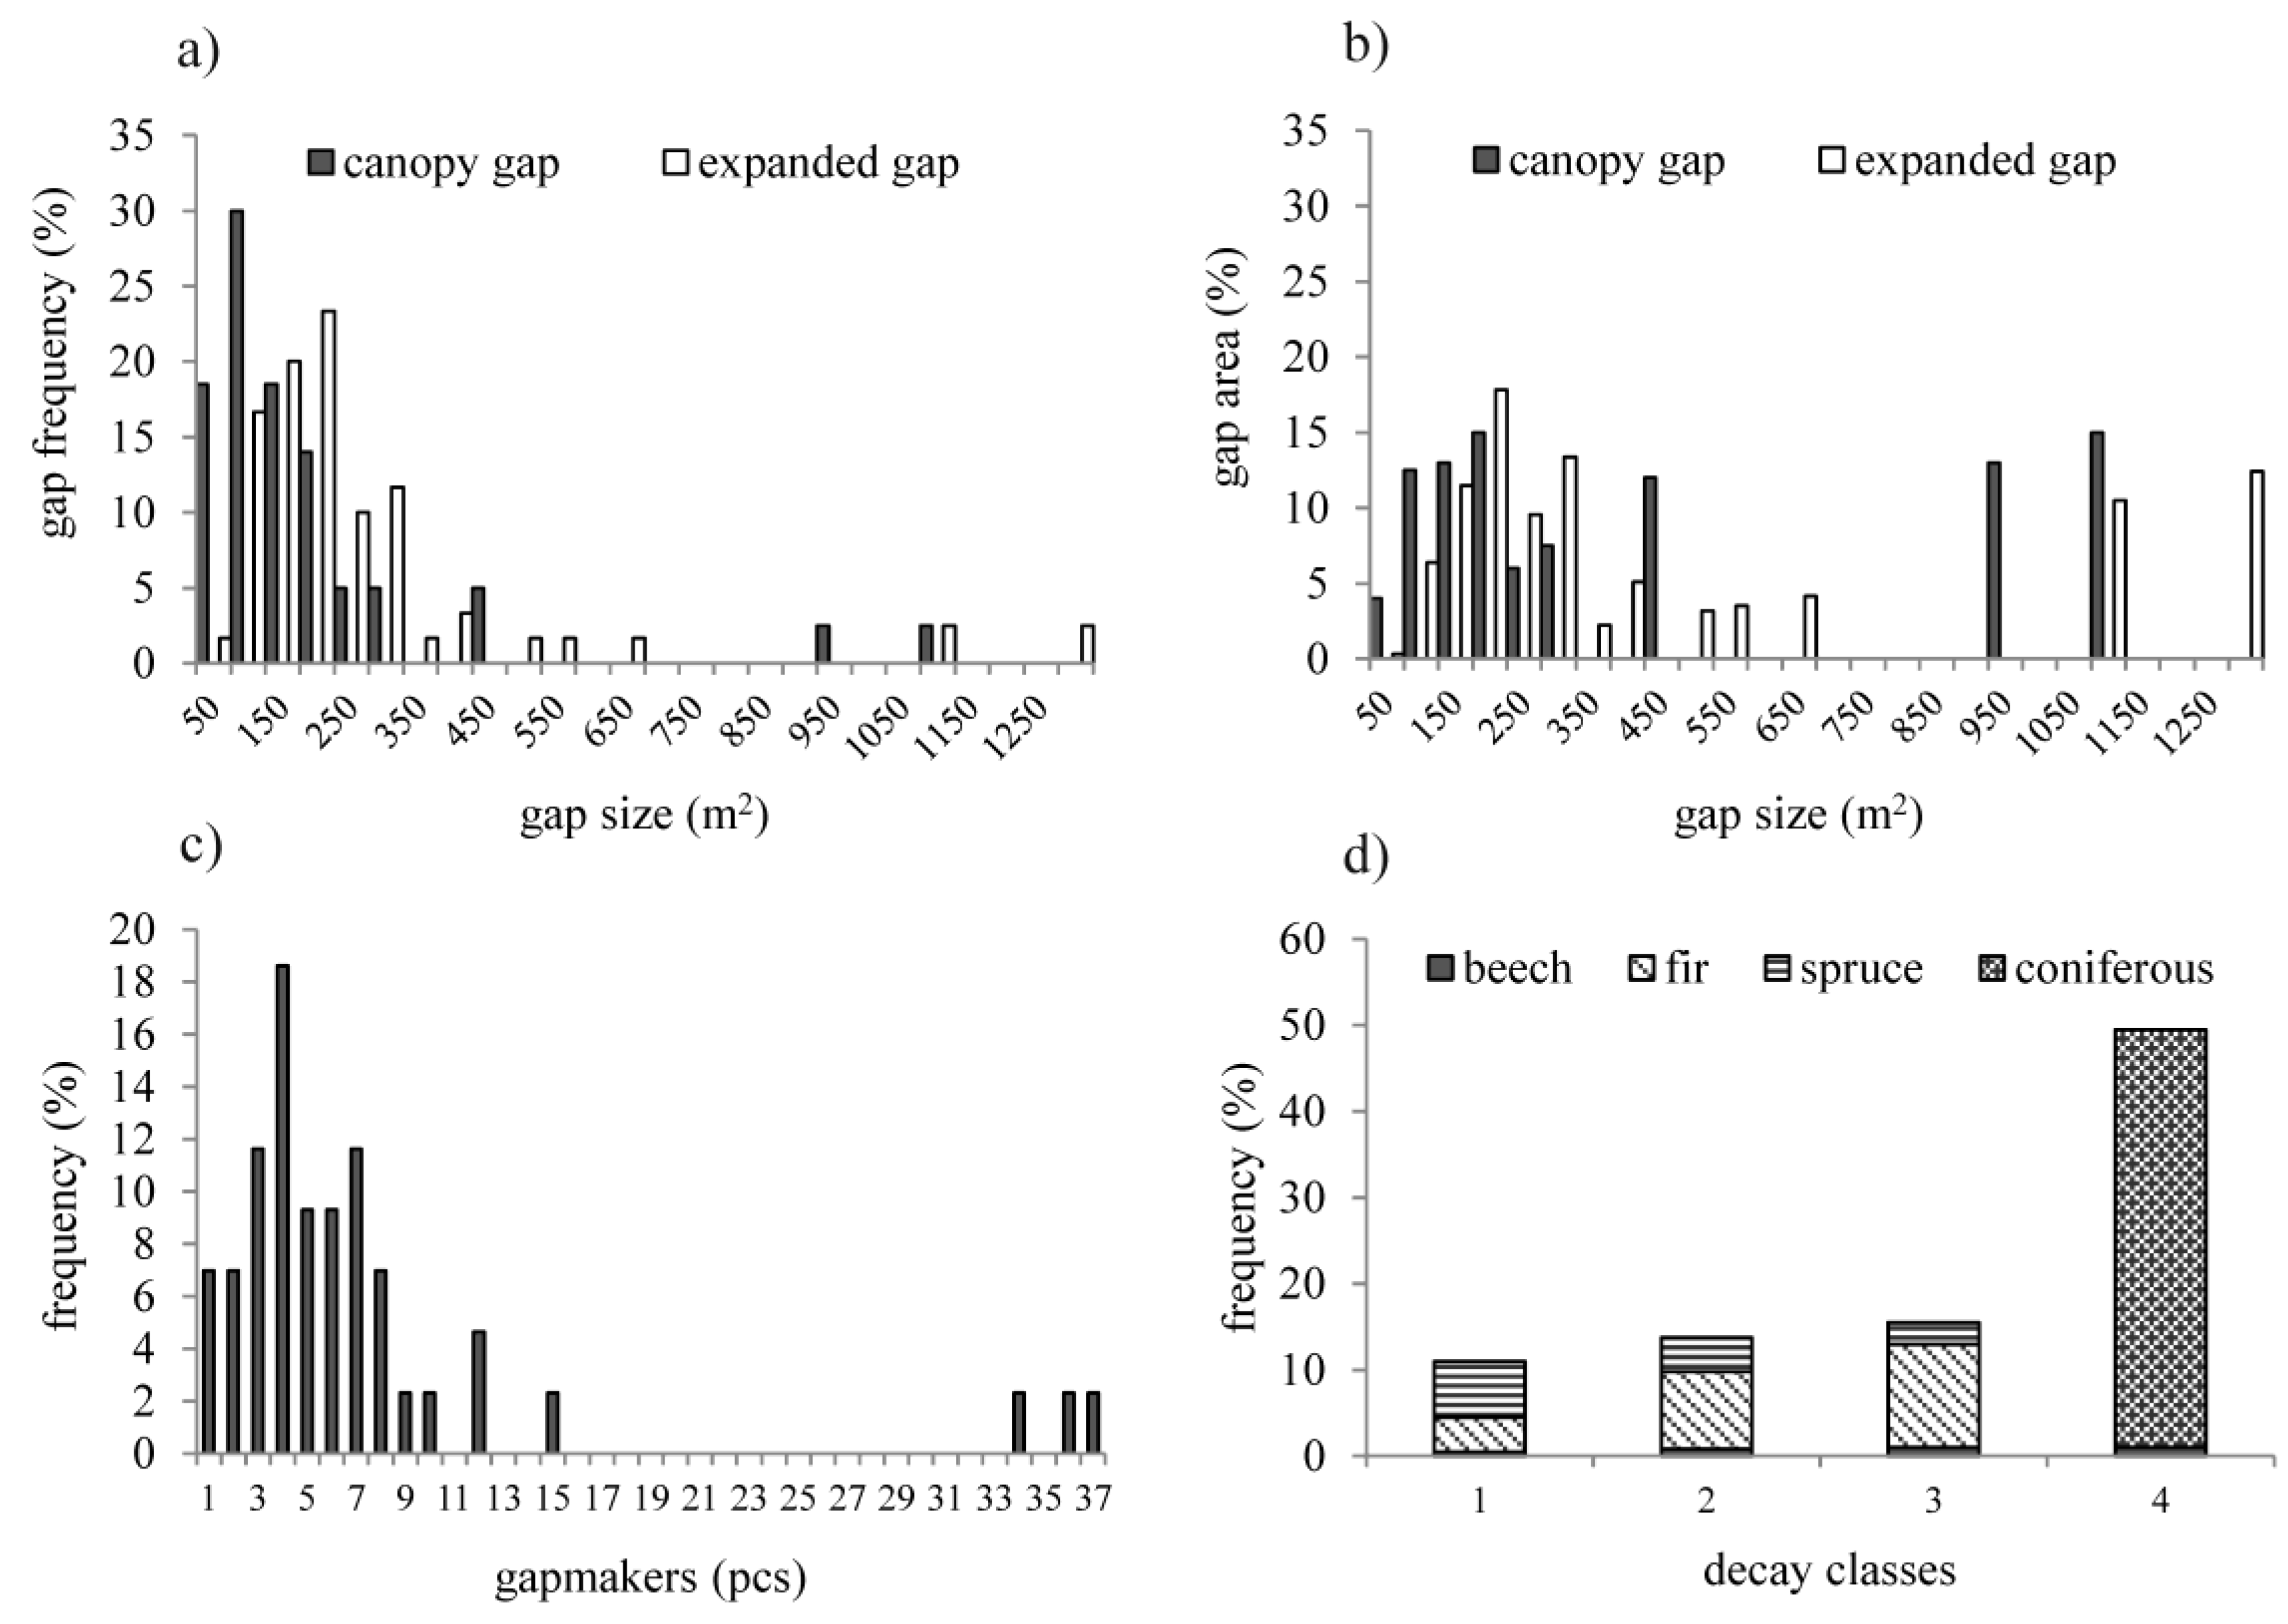
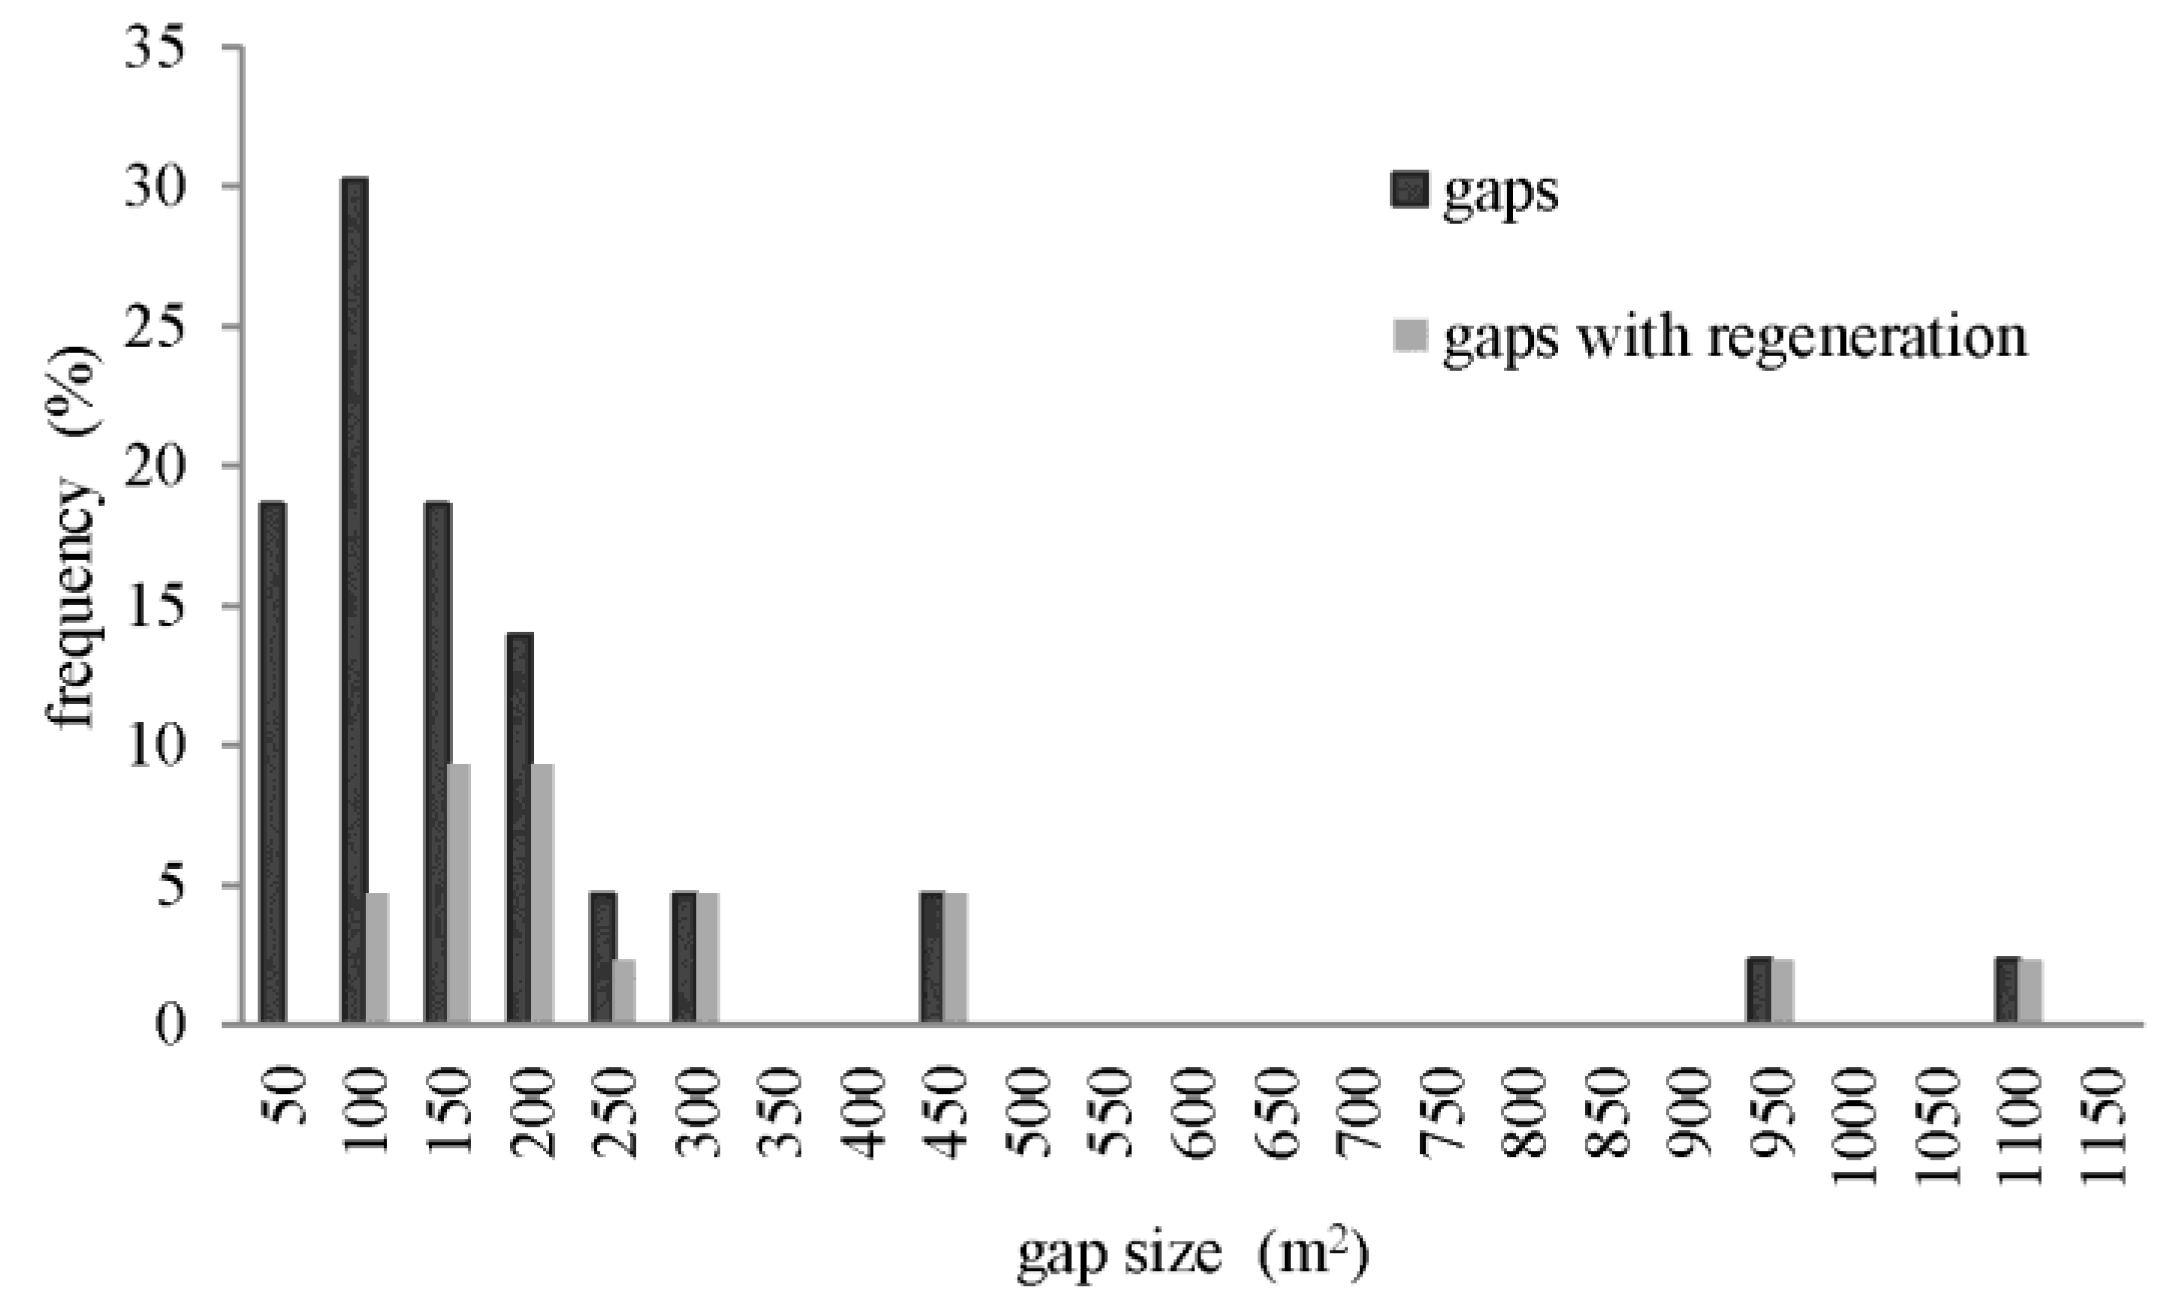
3.3. Structure of Canopy Gaps

In the research plot, a total of 52 canopy openings were recorded—an average of 8.3 per hectare (Figure 2c). Canopy gaps occupied 18% and expanded gaps nearly 39% of the area. The size of canopy gaps varied between 22 and 1061 m2, with median gap size of 91 m2 and mean size of 132 ± 132 m2 (Figure 5). The size of expanded gaps ranged from 45 to 1300 m2, with median gap size of 173 m2 and mean size of 225 ± 219 m2. Small canopy gaps (≤100 m2) were the most frequent (49%); nevertheless, they accounted for only 17% of the total gap area. According to the number of gapmakers, the majority of gaps was created by mortality of 1 to 8 trees (81%). Canopy openings with a higher number of gapmakers were relatively uncommon, with 9–16 and 33–38 tree groups comprising 12% and 7% of gapmakers, respectively. Though less frequent, these large groups contributed a disproportionately higher (28%) fraction of the total gap area. The majority of gapmakers (51%) belonged to the fourth decay class, while the other decay classes were represented fairly evenly. The gapmakers were dominantly comprised of conifers (95%).
Patches of spatially continuous natural regeneration occupied in total 15% of the investigated plot. In 90% of small gaps (those <100 m2), we registered no continuous regeneration (Figure A1). In the gaps of 100–250 m2, continuous regeneration was present in 56% of the gaps. We found no gaps >250 m2 without any patch of natural regeneration and in all of them the regeneration was present at least in part of their area. Regeneration patches were situated not only directly in the canopy gaps, but very often they occurred in expanded gaps or even beyond the border of the gaps in the closed stand (Figure 2d). Dominant tree regeneration was common beech (77%) greater than 130 cm in height (Table 5). Approximatelly one-quarter of patches were dominated by European ash or maples, with the majority concentrated in the height categories ≤130 cm.

4. Discussion

Researchers from European countries (e.g., [7,13,14,56,57,58]) have reported the phenomenon of common beech expansion at the expense of conifers. Although the conifers’ longevity and large dimensions partially compensate for their less abundant regeneration and decreasing stem density, the progressive increase in the share of common beech was evident in NNR Dobročský prales as well [59]. DCA can describe both compositional differences between sites as well as site compositional change through time [60]. Using this method in our study, we observed an expansion of common beech in all three stand layers over a period of 37 years (Figure 3). The trend of decreasing conifers proportion was confirmed in all layers with the exception of silver fir in the upper layer. The increased share of silver fir in the upper layer was more pronounced in basal area than in stem density and it was the consequence of gradual height transfers of silver fir from the middle layer. In the case of a more obvious increase in basal area, it was likely supported also by the increased radial growth of silver fir that was recently reported in studies from several European regions [16,24,61]. Although, in NNR Dobročský prales, the site conditions represent the optimum for silver fir (large number of seedlings, increase in basal area and growing stock), individuals of natural regeneration of this tree species did not exceed 20 cm in height and their development was limited, most likely due to the ungulate browsing (personal observation) and competition of common beech. In recent studies (e.g. [8,18]), the impact of ungulates and the expansion of common beech were similarly considered to be the most important factors that currently limit silver fir regeneration in forest reserves of the Carpathians. The reduction of silver fir in the lower and middle layer observed in our study is the direct consequence of this lack of saplings and virtually no ingrowth into these layers. As for Norway spruce, the overall significant decrease of its proportion in all stand layers seems to be the result of multiple factors associated with the recent climate changes such as increasing temperature, lower precipitation rates, more frequent severe disturbances and a more intense impact of bark beetle [11,62,63,64]. Despite the still relatively high proportion of Norway spruce (24% of the growing stock) in the locality investigated in our study, we recorded a low density of seedlings and saplings, indicating a serious problem for the maintenance of this tree species in studied stands. The stagnation of regeneration processes together with the high mortality rate in the case of Norway spruce and the pressure of ungulates combined with strong common beech competition in the case of silver fir could very likely result in a significant reduction in the proportion of conifers in the near future, not only in surveyed stands but also in most similar localities of the Western Carpathians.
Discrimination of development stages within the life cycle of a natural forest is based on criteria that take into consideration the stand structure, age distribution and distribution of volume increment as the most important characteristics [2,65]. In general, these characteristics influence the shape of diameter distribution [36] and result in different types of distribution for each development stage, i.e., right-skewed distribution for the Initial stage, unimodal symmetric distribution for the Optimal stage and bimodal distribution for the Decay stage. In NNR Dobročský prales, we observed some differences from this general pattern. The diameter distributions of all three development stages showed a reverse J-shaped form but their parameters were significantly different (Figure 4). Similar results were reported also by Zenner et al. [37] from an Oriental beech virgin forest in northern Iran, where diameter distributions of all stages were reverse J-shaped, but with significant differences between the Optimal and Initial stage as well as the Initial and Decay stage. Unlike Král et al. [36], who found the Optimal stage with a typical bell-shaped diameter distribution in a common beech-silver fir-Norway spruce stand, in NNR Dobročský prales the Optimal stage with homogenous stand structure was not present. The Optimal stage reached the highest values of growing stock and basal area that distinguished it from the other stages; however, the stand maintained the differentiated structure. A similar structure was registered by several authors [7,29,37,66,67], confirming that forest stands dominated by shade-tolerant tree species could be strongly diversified in all stages.
With the total downed deadwood volume exceeding 300 m3.ha−1 and the deadwood to living wood ratio of nearly 43%, the NNR Dobročský prales belongs to the reserves with the highest deadwood amount in Europe (cf. [68]). This is likely the consequence of several factors, with the most important being the increased mortality of conifers, relatively long degradation time of conifer logs [29,69,70,71] and the long-lasting degradation of standing silver fir and common beech stems [72]. The higher presence of snags during the Optimal stage suggests that the replacement of tree generations was realized by the substitution of a dead canopy tree by a sub-canopy tree or trees, without forming a canopy gap.
In the analysis of stand structures, besides the basic structural characteristics, we also used various structural indices; however, most of them showed no significant differences between development stages. The limited contribution of the majority of structural indices to the identification of development stages was reported by Balanda [73] as well, with nonsignificant differences of the diameter differentiation index (T) and aggregation index (R) among the stages in mixed old-growth forest Hrončecký grúň. Additionally in the study of Zenner et al. [37], no differences of diameter differentiation index were found and the structural complexity index (SCId) helped to distinguish only the Initial stage from both the Optimal and Decay stage. Similar values of structural indices, regardless of the development stage in our study, were likely caused by the fact that the stand consists of a mixture of tree species with different lifespans and environment demands resulting in relatively high structural diversity in all development stages, as confirmed by the generally higher values of analysed structural indices.
The canopy gap fraction is a reflection of the stand composition, structure, and texture [19]. The proportion of land area in canopy gaps in NNR Dobročský prales reached 18% and was higher than values reported from European common beech-dominated [18,74,75,76] and mixed common beech–silver fir or common beech-silver fir-Norway spruce forests [38,76] with the proportions rarely exceeding 11%. On the other hand, a fraction of the expanded gaps (39%) was nearly the same as that observed in old-growth common beech-dominated forest Badín in Slovakia [18] and common beech–silver fir forest Perucica in Bosnia-Herzegovina [38], both reaching 38%. The larger extent of canopy gaps was also confirmed by the median canopy gap size (91 m2) that was one of the highest values reported from Europe. This result can most likely be attributed to the higher presence of conifers (62%) in the surveyed stand, their increased mortality and lower ability to expand the crowns into the newly formed canopy openings [38].
Gap size distribution in NNR Dobročský prales was characterized by the dominance of small gaps <100 m2 and the decreasing frequency of canopy gaps towards larger gap size classes, generally observed in temperate forests [18,19,38,47,74,75,76]. However, the small gaps accounted for only 17% of the total gap area and the continuous regeneration in this gap size class occurred rarely. As a consequence, the gap closure was driven rather by the lateral growth of neighbouring tree crowns than by the height growth of saplings inside the gap. For the regeneration processes, gaps of larger sizes were more important and the gaps of 150 m2 can be regarded as a threshold for the successful development of continuous regeneration and subsequent replacement of tree generations, i.e., as the minimal area for the determination of development stages. This size corresponds also to that proposed by Meyer [28], based on the average crown projection of mature common beech with dbh 70 cm and set to approximately 150 m2.
The distribution of gapmaker numbers per gap was, in most studies, confirmed to have the reverse J-shaped form with the dominance of single tree gaps and their proportion around 30% [18,38,74] or even more than 50% of all gaps [19,75]. In NNR Dobročský prales, we found a considerably different distribution with single tree gaps reaching only 6.5% and the most frequent gaps with four gapmakers (18.5%). This difference could be associated with the relatively high share of conifers and the fact that the mortality of Norway spruce usually progresses in groups [2,20]. Moreover, the majority of gaps in our study were not formed by a single disturbance, but experienced more expansion events, as confirmed by the dominance of gaps with multiple gapmakers in different decay classes (84% of all gaps). We also observed the highest frequency of gapmakers in decay class 4 (51% of gapmakers) and the distinctive dominance of conifers (95%). One of the reasons that obviously contributed to the disproportionately higher proportion of conifers in gapmakers in comparison to their share in growing stock is their longer decay time compared to common beech. However, the more important factor seems to be the higher mortality rate of conifers, as confirmed also by the analysis of long-term changes in tree species composition.
The formation of canopy openings represents the process that is crucial for the establishment and subsequent development of natural regeneration [77]. The spatial extent of canopy gaps, reaching large gaps as a result of stand-replacing disturbances to single-tree gaps, is one of the most important parameters that determines the possible successional pathways in forest stand [13,38,74]. In our study, in relation to the massive onset of regeneration processes, only openings created by the mortality of three and more trees were relevant. The presence of gaps of different size provided suitable conditions for the regeneration of all represented tree species. The individual regeneration of silver fir, common beech and Norway spruce was concentrated in small gaps while the majority of medium and large gaps were dominated by dense cover of European ash and maples, extended by the gradual regeneration of common beech originating from several seed years. In medium and large gaps, the subsequent gradual increase of shading followed by self-thinning started the process of “micro-succession”, resulting in the expansion of shade-tolerant common beech and preventing European ash and maples from reaching the height >130 cm in height (cf. [22,33,59,78]).
One possible way to limit the negative consequences of ongoing changes of climate that negatively affect forests across Europe [79] is to increase their structural diversity. The selection system represents the silvicultural method that was developed to permanently maintain the uneven-aged, irregular structure of forest stands [80]. Although it is regarded as nature-based, the question was raised insofar as this silvicultural system corresponds to the natural processes and structures that are characteristic of old-growth forests [58]. In our study, we found that the structure of selection forests (reverse J-shaped diameter distribution) fully complies with the surveyed type of mixed forest and it is possible to use it as a target structure when planning silvicultural interventions. However, the results of our study suggest that a problem may occur when only the single-tree selection technique is used. This technique is suitable for the regeneration of shade-tolerant tree species (common beech, silver fir), but species with higher light demands, such as Norway spruce and especially maples and European ash, may be completely lacking in regeneration and consequently also in stand structure. In this case, knowledge of natural processes and gap dynamics can be used to adjust the traditional approach to the management of such tree species mixtures. Single-tree selection should be supplemented by group-tree selection and the groups can be progressively expanded. Based on our results, we suggest that a system that utilizes expanding gaps would mimic natural disturbance processes.

5. Summary

This study provides a unique view of the old-growth forest structure which is constantly undergoing the process of creation, destruction and natural changes. The dynamic of old-growth forest development is recorded through changes in tree species composition, structure in different development stages and through processes of creation and closure of canopy gaps. The results of this study indicate conifer decline in the old-growth forest Dobročský prales, but this fully applies only to Norway spruce. Silver fir in the upper layer increased in the proportion of all basic stand characteristics. This indicates that silver fir in the lower layer is not limited by site conditions but by other factors: probably selective ungulate browsing and competition of common beech. This is also the case of the maples and European ash. The density and species composition of small-diameter trees is an important indicator of processes in stand development [81]. The current development trend of tree species composition in the mixed old-growth forests shows the massive expansion of beech at the expense of other species. As expansion is probably caused by the interaction of indirect anthropogenic and natural factors [13,82,83], it is up to the forest managers to consider the resulting composition of forest stand. In this forest type, small-scale regeneration methods, such as single tree or group selection systems correspond best to natural regeneration for shade-tolerant tree species such as silver fir and common beech. Nevertheless, occasional larger-scale selection will be necessary for the establishment of shade-semi tolerant or intolerant tree species. When managers decide to preserve species diversity, supportive and protective measures should be introduced.
Our study confirmed the minimal stage area of about 100–150 m2 to be the appropriate scale for the identification of development stages as it also corresponded to the size of canopy gaps allowing the massive onset of natural regeneration. However, old-growth forests with a mixture of tree species with different lifespans and environment demands allow the coexistence of saplings and understory trees with large canopy trees regardless of development stage; we found that the structures of development stages differed greatly in the majority of structural characteristics. On the other hand, many of the stand structural indices, which capture the spatial structure, remain relatively constant among stages or distinguish only one development stage from the other two. Therefore, the assignment of a particular patch of forest to a development stage cannot be based on a single stand structural attribute, but should consider a broader set of structural criteria.

Author Contributions

Z.P., J.P., M.S. and S.K. designed the study, Z.P., J.V., M.F., D.S. and J.P. collected the data, Z.P., J.P., M.F., P.J. analysed the data, and all authors wrote the manuscript.

Acknowledgments

This research was funded by the Slovak Grant Agency for Science (VEGA, project no. 1/0021/18) and the Slovak Research and Development Agency (APVV, project no. 14-0014).

Conflicts of Interest

The authors declare no conflict of interest.

Appendix A

Table A1. Comparison of NNR Dobročský prales with other remnants of a similar forest types in the Western Carpathians.
Site NameMain Tree SpeciesSize (ha)Elevation (m)Temperature (°C)Precipitation (mm)Forest Plant CommunitySource of Data
Slovakia
Dobročský pralesF, B, S101.8840–9405.2890Dentario enneaphylli-Fagetum[42]
Ľubietovský VeporB, F, S236.9950–12774950Dentario enneaphylli-Fagetum[84]
Klenovský VeporB, S, F122.11100–13384950Dentario enneaphylli-Fagetum[85]
Poland
OszastS, B, F43.3950–114731300Dentario glandulosae-Fagetum[86]
ZarnowkaB, F, S-940–101041350Dentario glandulosae-Fagetum[39]
BaniskaB, F, S142.0775–103551200Dentario glandulosae-Fagetum[39]
Czech Republic
PolomS, B, F20.2546–6256786Dentario enneaphylli-Fagetum
Dentario glandulosae-Fagetum
[87]
RazulaF, B, S22.8600–8126.21088Dentario enneaphylli-Fagetum
Dentario glandulosae-Fagetum
[14]
SalajkaB, F, S22.9715–8205.41144Dentario enneaphylli-Fagetum
Dentario glandulosae-Fagetum
[14]
*, F–silver fir, B–common beech, S–Norway spruce.
Table A2. Indicative criteria for stage determination (sensu [2,12]) modified according to local conditions.
CriterionInitial StageOptimal StageDecay Stage
General age estimationYoungAdultOld
Tree densityHighMediumLow
Greatest proportion of trees by sizeIn small and medium sizesIn medium and large sizesIn large sizes
Canopy dominated byLower and middle layerUpper and middle layerUpper layer
Deadwood volumeMediumLowHigh
Decay stageHigher decay classesVarious decay classesLower decay classes
GapsAbsentAbsentPresent
Regeneration>8 cm, clustered in former gapsLittle, scattered over the whole area<8 cm, clustered in gaps
Figure A1. Frequency of canopy gaps and canopy gaps with regeneration cover according to gap size.
Forests 09 00379 g0a1

References

  1. Mayer, H.; Ott, E. Gebirgswaldbau—Schutzwaldpflege; Gustav Fischer Verlag: Stuttgart, Germany, 1991. [Google Scholar]
  2. Korpeľ, Š. Die Urwälder der Westkarpaten; Gustav Fischer Verlag: New York, NY, USA, 1995. [Google Scholar]
  3. Meyer, P.; Tabaku, V.; Lüpke, B. Die Struktur albanischer Rotbuchen Urwäldern—Ableitung für eine naturnahe Buchenwirtschaft. Forstwiss. Cent. 2003, 122, 47–58. [Google Scholar] [CrossRef]
  4. Bauhus, J.; Puettmann, K.; Messier, C. Silviculture for old-growth attributes. For. Ecol. Manag. 2009, 258, 525–537. [Google Scholar] [CrossRef] [Green Version]
  5. Akhavan, R.; Sagheb-Talebi, K.; Zenner, E.K. Spatial patterns in different forest development stages of an intact old-growth Oriental beech forest in the Caspian region of Iran. Eur. J. For. Res. 2012, 131, 1355–1366. [Google Scholar] [CrossRef]
  6. Diaci, J.; Rozenbergar, D.; Mikac, S.; Anić, I.; Hartman, T.; Boncina, A. Long-term changes in tree species composition in old-growth Dinaric beech-fir forest. Glas. Šumske Pokuse 2008, 42, 13–27. [Google Scholar]
  7. Diaci, J.; Rozenbergar, D.; Anic, I.; Mikac, S.; Saniga, M.; Kucbel, S.; Visnjic, C.; Ballian, D. Structural dynamics and synchronous silver fir decline in mixed oldgrowth mountain forests in Eastern and Southeastern Europe. Forestry 2011, 84, 479–491. [Google Scholar] [CrossRef]
  8. Vrška, T.; Adam, D.; Hort, L.; Kolař, T.; Janik, D. European beech (Fagus sylvatica L.) and silver fir (Abies alba Mill.) rotation in the Carpathians—A developmental cycle or a linear trend induced by man? For. Ecol. Manag. 2009, 258, 347–356. [Google Scholar] [CrossRef]
  9. Ficko, A.; Boncina, A. Silver fir (Abies alba Mill.) distribution in Slovenian forests. Res. Rep. For. Wood Sci. Technol. 2006, 79, 19–35. [Google Scholar]
  10. Klopcic, M.; Jerina, K.; Boncina, A. Long-Term Changes of Structure and Tree Species Composition in Dinaric Uneven-Aged Forests: Are Red Deer an Important Factor? Eur. J. For. Res. 2010, 129, 277–288. [Google Scholar] [CrossRef]
  11. Marini, L.; Okland, B.; Jonsson, A.M.; Bentz, B.; Carroll, A.; Forster, B.; Gregoire, J.C.; Hurling, R.; Nageleisen, L.M.; Netherer, S.; et al. Climate drivers of bark beetle outbreak dynamics in Norway spruce forests. Ecography 2017, 40, 1426–1435. [Google Scholar] [CrossRef]
  12. Keren, S.; Motta, R.; Govedar, Z.; Lucic, R.; Medarevic, M.; Diaci, J. Comparative structural dynamics of the Janj mixed old-growth mountain forest in Bosnia and Herzegovina: Are conifers in a long-term decline? Forests 2014, 5, 1243–1266. [Google Scholar] [CrossRef]
  13. Jaloviar, P.; Saniga, M.; Kucbel, S.; Pittner, J.; Vencurik, J.; Dovciak, M. Seven decades of change in a European old-growth forest following a stand-replacing wind disturbance: A long-term case study. For. Ecol. Manag. 2017, 399, 197–205. [Google Scholar] [CrossRef]
  14. Janík, D.; Adam, D.; Hort, L.; Král, K.; Šamonil, P.; Unar, P.; Vrška, T. Tree spatial patterns of Abies alba and Fagus sylvatica in the Western Carpathians over 30 years. Eur. J. For. Res. 2014, 133, 1015–1028. [Google Scholar] [CrossRef]
  15. Bouriaud, O.; Popa, I. Comparative dendroclimatic study of Scots pine, Norway spruce, and silver fir in the Vrancea Range, Eastern Carpathian Mountains. Trees 2009, 23, 95–106. [Google Scholar] [CrossRef]
  16. Gazol, A.; Camarero, J.J.; Gutiérrez, E.; Popa, I.; Andreu-Hayles, L.; Motta, R.; Nola, P.; Ribas, M.; Sangüesa-Barreda, G.; Urbinati, C.; et al. Distinct effects of climate warming on populations of silver fir (Abies alba) across Europe. J. Biogeogr. 2015, 42, 1150–1162. [Google Scholar] [CrossRef]
  17. Nagel, T.A.; Levanic, T.; Diaci, J. A dendroecological reconstruction of disturbance in an old-growth Fagus-Abies forest in Slovenia. Ann. For. Sci. 2007, 64, 891–897. [Google Scholar] [CrossRef]
  18. Kucbel, S.; Jaloviar, P.; Saniga, M.; Vencurik, J.; Klimaš, V. Canopy gaps in an old-growth fir–beech forest remnant of Western Carpathians. Eur. J. For. Res. 2010, 129, 249–259. [Google Scholar] [CrossRef]
  19. Sefidi, K.; Marvie Mohadjer, M.R.; Mosandl, R.; Copenheaver, C.A. Canopy gaps and regeneration in old-growth Oriental beech (Fagus orientalis Lipsky) stands, northern Iran. For. Ecol. Manag. 2011, 262, 1094–1099. [Google Scholar] [CrossRef]
  20. Trotsiuk, V.; Hobi, M.L.; Commarmot, B. Age structure and disturbance dynamics of the relic virgin beech forest Uholka (Ukrainian Carpathians). For. Ecol. Manag. 2012, 265, 181–190. [Google Scholar] [CrossRef]
  21. Fischer, A.; Marshall, P.; Camp, A. Disturbances in deciduous temperate forest ecosystems of the Northern Hemisphere: Their effects on both recent and future development. Biodivers. Conserv. 2013, 22, 863–898. [Google Scholar] [CrossRef]
  22. Balanda, M.; Saniga, M.; Jaloviar, P.; Pittner, J. Structure, Production and Regeneration Processes of Natural Forests in NPR Hrončecký Grúň; Technical University in Zvolen: Zvolen, Slovakia, 2015; ISBN 978-80-228-2729-4. [Google Scholar]
  23. Elling, W.; Dittmar, C.; Pfaffelmoser, K.; Rötzer, T. Dendroecological Assessment of the Complex Causes of Decline and Recovery of the Growth of Silver Fir (Abies alba Mill.) in Southern Germany. For. Ecol. Manag. 2009, 257, 1175–1187. [Google Scholar] [CrossRef]
  24. Bošeľa, M.; Petráš, R.; Sitková, Z.; Priwitzer, T.; Pajtík, J.; Hlavatá, H.; Sedmák, R.; Tobin, B. Possible causes of the recent rapid increase in the radial increment of silver fir in the Western Carpathians. Environ. Pollut. 2014, 184, 211–221. [Google Scholar] [CrossRef] [PubMed]
  25. Nagel, T.A.; Svoboda, M.; Rugani, T.; Diaci, J. Gap Regeneration and replacement patterns in an old-growth Fagus-Abies forest of Bosnia–Herzegovina. Plant Ecol. 2010, 208, 307–318. [Google Scholar] [CrossRef]
  26. Watt, A.S. Pattern and process in the plant community. J. Ecol. 1947, 35, 1–22. [Google Scholar] [CrossRef]
  27. Leibundgut, H. Europäische Urwälder: Wegweiser zur Naturnahen Waldwirtschaft; Verlag Paul Haupt: Bern und Stuttgart, Germany, 1993. [Google Scholar]
  28. Meyer, P. Determination of development phases and diversity of forest texture. AFJZ 1999, 170, 203–211. [Google Scholar]
  29. Petritan, I.C.; Commarmot, B.; Hobi, M.L.; Petritan, A.M.; Bigler, C.H.; Abrudan, I.V.; Rigling, A. Structural patterns of beech and silver fir suggest stability and resilience of the virgin forest Sinca in the Southern Carpathians, Romania. For. Ecol. Manag. 2015, 356, 184–195. [Google Scholar] [CrossRef]
  30. Zenner, E.K.; Hibbs, D.E. A new method for modeling the heterogeneity of forest structure. For. Ecol. Manag. 2000, 129, 75–87. [Google Scholar] [CrossRef]
  31. Pommerening, A. Approaches to quantifying forest structures. Forestry 2002, 75, 305–324. [Google Scholar] [CrossRef] [Green Version]
  32. Pretzsch, H. Zum Einfluss des Baumverteilungsmusters auf den Bestandeszuwachs. AFJZ 1995, 166, 190–201. [Google Scholar]
  33. Emborg, J. Understorey light condition and regeneration with respect to the structural dynamics of near-natural temperate deciduous forest in Denmark. For. Ecol. Manag. 1998, 106, 83–95. [Google Scholar] [CrossRef]
  34. Graz, F.P. The behaviour of the species mingling index Msp in relation to species dominance and dispersion. Eur. J. For. Res. 2004, 123, 87–92. [Google Scholar] [CrossRef]
  35. Drössler, L.; Meyer, P. Waldentwicklungsphasen in zwei Buchen-Urwaldreservaten in der Slowakei. Forstarchiv 2006, 77, 155–161. [Google Scholar]
  36. Král, K.; Vrška, T.; Hort, L.; Adam, D.; Šamonil, P. Development phases in a temperate natural spruce-fir-beech forest: Determination by a supervised classification method. Eur. J. For. Res. 2010, 129, 339–351. [Google Scholar] [CrossRef]
  37. Zenner, E.K.; Sagheb-Talebi, K.; Akhavan, R.; Peck, J.E. Integration of small-scale canopy dynamics smoothes live-tree structural complexity across development stages in old-growth Oriental beech (Fagus orientalis Lipsky) forests at the multi-gap scale. For. Ecol. Manag. 2015, 335, 26–36. [Google Scholar] [CrossRef]
  38. Nagel, T.A.; Svoboda, M. Gap disturbance regime in an old-growth Fagus-Abies forest in the Dinaric Mountains, Bosnia–Herzegovina. Can. J. For. Res. 2008, 38, 2728–2737. [Google Scholar] [CrossRef]
  39. Paluch, J.G.; Kołodziej, Z.; Pach, M.; Jastrzębski, R. Spatial variability of close-to-primeval Fagus-Abies-Picea forests in the Western Carpathians (Central Europe): A step towards a generalized pattern. Eur. J. For. Res. 2015, 134, 235–246. [Google Scholar] [CrossRef]
  40. Peck, J.E.; Commarmot, B.; Hobi, M.L.; Zenner, E.K. Should reference conditions be drawn from a single 10 ha plot? Assessing representativeness in a 10,000 ha old-growth European beech forest. Restor. Ecol. 2015, 23, 927–935. [Google Scholar] [CrossRef]
  41. Gömöryová, E.; Ujházy, K.; Martinák, M.; Gömöry, D. Soil microbial community response to variation in vegetation and abiotic environment in a temperate old-growth forest. Appl. Soil Ecol. 2013, 68, 10–19. [Google Scholar] [CrossRef]
  42. Ujházy, K.; Krížová, E.; Glončák, P.; Benčaťová, B.; Nič, J. Tree Species and Management Effect on Herb Layer Species Composition in Mountain Fir-Beech Forests of the Western Carpathians. In The Carpathians: Integrating Nature and Society Towards Sustainability; Kozak, J., Ostapowicz, K., Bytnerowicz, A., Wyzga, B., Eds.; Springer: Berlin, Germany, 2013; pp. 239–255. [Google Scholar]
  43. Tabaku, V. Structur von Buchen-Urwäldern in Albanien im Vergleich mit Deutchen Buchen-Naturwaldreservaten und -Wirtschaftswäldern. Ph.D. Thesis, Der Georg-August-Universität, Göttingen, Germany, November 1999. [Google Scholar]
  44. Albrecht, L. Grundlagen, Ziele und Methodik der Waldökologischen Forschung in Naturwaldreservaten; Schriftenreihe des Bayerischen Staatsministeriums für Ernährung, Landwirtschaft und Forsten gemeinsam mit dem Lehrstuhl für Landschaftstechnik: München, Germany, 1990; p. 221. [Google Scholar]
  45. Petráš, R.; Pajtík, J. Sústava česko–slovenských objemových tabuliek drevín. Lesn. Čas. 1991, 37, 49–56. [Google Scholar]
  46. Avery, T.E.; Burkhart, H.E. Forest Measurements, 5th ed.; McGraw-Hill: New York, NY, USA, 2002; ISBN 978-0-07-366176-6. [Google Scholar]
  47. Runkle, J.R. Patterns of disturbance in some old-growth mesic forests of Eastern North America. Ecology 1982, 63, 1533–1546. [Google Scholar] [CrossRef]
  48. Latham, P.A.; Zuuring, H.R.; Coble, D.W. A method for quantifying vertical forest structure. For. Ecol. Manag. 1998, 104, 157–170. [Google Scholar] [CrossRef]
  49. Shanon, C.E. The mathematical theory of communication. In The Mathematical Theory of Communication; Shannon, C.E., Weaver, W., Eds.; University of Illinois Press: Urbana, IL, USA, 1948; pp. 3–91. [Google Scholar]
  50. Camino, R. Zur Bestimmung der Bestandeshomogenität. Allg. For. Jagdztg. 1976, 147, 54–58. [Google Scholar]
  51. Reineke, L.H. Perfecting a stand density index for even-aged forests. J. Agric. Res. 1933, 46, 627–638. [Google Scholar]
  52. Clark, P.J.; Evans, F.C. Distance to nearest neighbour as a measure of spatial relationships in populations. Ecology 1954, 35, 445–453. [Google Scholar] [CrossRef]
  53. Donnelly, K. Simulations to determine the variance and edge effect of total nearest neighbour distance. In Simulation Methods in Archaeology; Hodder, J.R., Ed.; Cambridge University Press: London, UK, 1978; pp. 91–95. [Google Scholar]
  54. Füldner, K. Zur Strukturbeschreibung in Mischbeständen. Forstarchiv 1995, 66, 235–240. [Google Scholar]
  55. Hill, M.O.; Gauch, H.G. Detrended corespondence analysis: An improved ordination technique. Vegetatio 1980, 42, 47–58. [Google Scholar] [CrossRef]
  56. Nagel, T.A.; Svoboda, M.; Diaci, J. Regeneration patterns after intermediate wind disturbance in an old-growth Fagus–Abies forest in southeastern Slovenia. For. Ecol. Manag. 2006, 226, 268–278. [Google Scholar] [CrossRef]
  57. Klopcic, M.; Boncina, A. Recruitment of tree species in mixed selection and irregular shelterwood forest stands. Ann. For. Sci. 2012, 69, 915–925. [Google Scholar] [CrossRef] [Green Version]
  58. Keren, S.; Diaci, J.; Motta, R.; Govedar, Z. Stand structural complexity of mixed old-growth and adjacent selection forests in the Dinaric Mountains of Bosnia and Herzegovina. For. Ecol. Manag. 2017, 400, 531–541. [Google Scholar] [CrossRef]
  59. Parobeková, Z.; Saniga, M.; Pittner, J.; Kucbel, S.; Jaloviar, P. The Structure, Growing Stock Distribution, Disturbance Regime and Regeneration Processes of Virgin Forest Dobroč (Time Study); Technical University in Zvolen: Zvolen, Slovakia, 2016; ISBN 978-80-228-2853-6. [Google Scholar]
  60. Allen, M.S.; Thapa, V.; Arévalo, J.R.; Palmer, M.W. Windstorm damage and forest recovery: Accelerated succession, stand structure, and spatial pattern over 25 years in two Minnesota forests. Plant Ecol. 2012, 213, 1833–1842. [Google Scholar] [CrossRef]
  61. Büntgen, U.; Tegel, W.; Kaplan, J.O.; Schaub, M.; Hagedorn, F.; Bürgi, M.; Brázdil, R.; Helle, G.; Career, M.; Heussner, K.U.; et al. Placing unprecedented recent fir growth in a European-wide and Holocene-long context. Front. Ecol. Environ. 2014, 12, 100–106. [Google Scholar] [CrossRef] [Green Version]
  62. Boden, S.; Kahle, H.P.; Wilpert, K.; Spiecker, H. Resilience of Norway spruce (Picea abies (L.) Karst) growth to changing climatic conditions in Southwest Germany. For. Ecol. Manag. 2014, 315, 12–21. [Google Scholar] [CrossRef]
  63. Bošeľa, M.; Sedmák, R.; Sedmáková, D.; Marušák, R.; Kulla, L. Temporal shifts of climate–growth relationships of Norway spruce as an indicator of health decline in the Beskids, Slovakia. For. Ecol. Manag. 2014, 325, 108–117. [Google Scholar] [CrossRef]
  64. Schütz, J.P.; Götz, M.; Schmid, W.; Mandallaz, D. Vulnerability of spruce (Picea abies) and beech (Fagus sylvatica) forest stands to storms and consequences for silviculture. Eur. J. For. Res. 2006, 125, 291–302. [Google Scholar] [CrossRef]
  65. Podlaski, R. A development cycle of the forest with fir (Abies alba Mill.) and beech (Fagus sylvatica L.) and its species composition in the Swietokrzyski National Park. J. For. Sci. 2004, 50, 55–66. [Google Scholar] [CrossRef]
  66. Heiri, C.; Wolf, A.; Rohreb, L.; Bugmann, H. Forty years of natural dynamics in Swiss beech forests: Structure, composition, and the influence of former management. Ecol. Appl. 2009, 19, 1920–1934. [Google Scholar] [CrossRef] [PubMed]
  67. Šamonil, P.; Antolik, L.; Svoboda, M.; Adam, D. Dynamics of windthrow events in a natural fir–beech forest in the Carpathian Mountains. For. Ecol. Manag. 2009, 257, 1148–1156. [Google Scholar] [CrossRef]
  68. Christensen, M.; Hahn, K.; Mountford, E.P.; Odor, P.; Standovar, T.; Rozenbergar, D.; Diaci, J.; Wijdeven, S.; Meyer, P.; Winter, S.; et al. Dead wood in European beech (Fagus sylvatica) forest reserves. For. Ecol. Manag. 2005, 210, 267–282. [Google Scholar] [CrossRef]
  69. Korpeľ, Š. Pralesy Slovenska; Veda: Bratislava, Slovensko, 1989. [Google Scholar]
  70. Saniga, M. Structure, Production and Regeneration Processes of the Dobroč Virgin Forest; Technical University in Zvolen: Zvolen, Slovakia, 1999. [Google Scholar]
  71. Motta, R.; Garbarino, M.; Berretti, R.; Meloni, F.; Vacchiano, G. Development of old-growth characteristics in uneven-aged forests of the Italian Alps. Eur. J. For. Res. 2015, 134, 19–31. [Google Scholar] [CrossRef]
  72. Lombardi, F.; Cherubini, P.; Tognetti, R.; Cocozza, C.; Lasserre, B.; Marchetti, M. Investigating biochemical processes to assess deadwood decay of beech and silver fir in Mediterranean mountain forests. Ann. For. Sci. 2013, 70, 101–111. [Google Scholar] [CrossRef]
  73. Balanda, M. Spatio-temporal structure of natural forest: A structural index approach. Beskydy 2012, 5, 163–172. [Google Scholar] [CrossRef] [Green Version]
  74. Zeibig, A.; Diaci, J.; Wagner, S. Gap disturbance patterns of a Fagus sylvatica virgin forest remnant in the mountain vegetation belt of Slovenia. For. Snow Landsc. Res. 2005, 79, 69–80. [Google Scholar]
  75. Drössler, L.; Luepke, B. Canopy gaps in two virgin beech forest reserves in Slovakia. J. For. Sci. 2005, 51, 446–457. [Google Scholar] [CrossRef]
  76. Kenderes, K.; Král, K.; Vrška, T.; Standovár, T. Natural gap dynamics in a Central European mixed beech–spruce–fir oldgrowth forest. Ecoscience 2009, 16, 39–47. [Google Scholar] [CrossRef]
  77. Oliver, C.D.; Larson, B.C. Forest Stand Dynamics, 2nd ed.; John Wiley & Sons Inc.: New York, NY, USA, 1996; 520p. [Google Scholar]
  78. Vencurik, J.; Kucbel, S.; Saniga, M.; Jaloviar, P.; Parobeková, Z.; Sedmáková, D.; Pittner, J. Stand structure, light microclimate and distribution of lower layer individuals in selection forest in two localities of Slovakia. Zprávy Lesn. Výzkumu 2016, 61, 230–237. [Google Scholar]
  79. Seidl, R.; Thom, D.; Kautz, M.; Martin-Benito, D.; Peltoniemi, M.; Vacchiano, G.; Wild, J.; Ascoli, D.; Petr, M.; Honkaniemi, J.; et al. Forest disturbances under climate change. Nat. Clim. Chang. 2017, 7, 395–402. [Google Scholar] [CrossRef] [PubMed] [Green Version]
  80. Schütz, J.-P. Silvicultural tools to develop irregular and diverse forest structures. Forestry 2002, 75, 329–337. [Google Scholar] [CrossRef] [Green Version]
  81. Mohr, C.; Schori, C. Femelschlag oder Plenterung—Ein Vergleich aus betriebswirtschaftlicher Sicht. Schweiz. Z. Forstwes. 1999, 150, 49–55. [Google Scholar] [CrossRef]
  82. Bončina, A.; Gasperšič, F.; Diaci, J. Long-term changes in tree species composition in the Dinaric mountain forests of Slovenia. For. Chron. 2003, 79, 227–232. [Google Scholar] [CrossRef] [Green Version]
  83. Saniga, M.; Balanda, M.; Kucbel, S.; Jaloviar, P. Cyclic changes in tree species composition of mixed-species forest in Western Carpathians: Role of disturbance and tree regeneration. Pol. J. Ecol. 2011, 59, 381–389. [Google Scholar]
  84. Ujházy, K.; Hederová, L.; Máliš, F.; Ujházyová, M.; Bošeľa, M.; Čiliak, M. Overstorey dynamics controls plant diversity in age-class temperate forests. For. Ecol. Manag. 2017, 391, 96–105. [Google Scholar] [CrossRef]
  85. Miadok, D. Beitrag zur Kenntnis der Buchenwälder im Gebirge Klenovský Vepor. Acta Fac. Rerum Nat. Univ. Comenianae 1971, 17, 99–115. [Google Scholar]
  86. Jaworski, A.; Pach, M. A comparison of lower montane natural forest (Abies, Fagus, Picea) in Oszast Reserve and spruce monocultures in the Zywiecki Beskid and Slaski Beskid. For. Res. Pap. 2014, 75, 13–32. [Google Scholar] [CrossRef] [Green Version]
  87. Vrška, T.; Hort, L.; Adam, D.; Odehnalová, P.; Horal, D. Developmental Dynamics of Virgin Forest Reserves in the Czech Republic I; Academia: Prague, Czech Republic, 2002; p. 213. [Google Scholar]
Figure 1. Location of National Nature Reserve Dobročský prales and layout of a permanent research plot.
Forests 09 00379 g001
Figure 2. Output from the Field Map® software package: (a) map of exact tree positions and their crown projections (only in transect), (b) map of downed deadwood (logs), (c) map of canopy openings (light grey: canopy gaps; dark grey: expanded gaps), (d) map of regeneration cover.
Forests 09 00379 g002
Figure 3. Long-term changes in tree species composition in NNR Dobročský prales between 1978 and 2015 in species ordination space (DCA axes 1 and 2) according to tree layers (U–upper, M–middle, L–lower, T–total). Tree species acronyms: AbAl–Abies alba, PiAb–Picea abies, FaSy–Fagus sylvatica, FrEx–Fraxinus excelsior, UlMo–Ulmus montana, Ac.sp–Acer sp.
Forests 09 00379 g003
Figure 4. Tree density and basal area distributions according to diameter classes for the permanent research plot (PRP) and particular development stages.
Forests 09 00379 g004
Figure 5. Frequency of canopy and expanded gaps (a) and proportion of total gap area (b) according to size classes. Gap frequency according to number of gapmakers per gap (c). Frequency of gapmakers by decay class and tree species (d).
Forests 09 00379 g005
Table 1. Basic stand characteristics of NNR Dobročský prales according to forest inventories in 1978 and 2015.
Tree Species19782015
Stem DensityBasal AreaGrowing StockStem DensityBasal AreaGrowing Stock
N·ha−1%m2·ha−1%m3·ha−1%N·ha−1%m2·ha−1%m3·ha−1%
Fir1393817.64126138812017.83928038
Beech125359.222161242576515.63425835
Spruce902514.73423835491210.52317424
Others *821.23213921.43253
Total36210042.710068210039610045.3100737100
*, Fraxinus excelsior, Ulmus montana, Acer pseudoplatanus, Acer platanoides.
Table 2. Density of seedlings and saplings (N·ha−1) according to tree species and height/dbh category in particular development stages.
CategoryBeechFirSpruceMaplesAshTotal
≤20 cm21439190164343573015,661
21–50 cm5731635256761793
51–130 cm114007779270
>130 cm *4972002502
Total332792081674037148718,226
*, up to dbh 8 cm.
Table 3. Stand characteristics of the permanent research plot (PRP) by development stages (mean ± SD).
Stand CharacteristicsInitial StageOptimal StageDecay StagePRP
Spatial proportion(%)264430100
Tree density ≥ 8 cm(N·ha−1)531 ± 61 b413 ± 131 a398 ± 125 a413 ± 113
Basal area(m2·ha−1)32.2 ± 6.8 a60.2 ± 10.1 b33.3 ± 11.2 a44.9 ± 6.2
Growing stock(m3·ha−1)459 ± 133 a1005 ± 196 b529 ± 203 a731 ± 149
Fir(%)38 ± 24 a35 ± 23 a41 ± 23 a40 ± 23
Beech(%)31 ± 14 a39 ± 26 a29 ± 24 a33 ± 23
Spruce(%)26 ± 22 a22 ± 25 a27 ± 29 a22 ± 25
Others *(%)9 ± 17 b4 ± 5 ab2 ± 4 a5 ± 10
Snags(m3·ha−1)26 ± 39 a49 ± 73 ab80 ± 59 b53 ± 64
Logs(m3·ha−1)264 ± 171 ab185 ± 136 a353 ± 232 b260 ± 191
Crown engagement ratio1.5 ± 0.16 b1.7 ± 0.41 c1.0 ± 0.30 a1.4 ± 0.4
Growth space utilisation0.3 ± 0.09 a0.4 ± 0.10 b0.2 ± 0.09 a0.3 ± 0.1
*, Fraxinus excelsior, Ulmus montana, Acer pseudoplatanus, Acer platanoides. Letters indicate significant differences among the stages (MANOVA, p ≤ 0.05).
Table 4. Values of structural indices according to development stages and stand layers.
IndexStand LayerInitialOptimalDecayPRP
H′Nlower0.08 ± 0.07 a0.22 ± 0.15 ab0.29 ± 0.26 ab0.27
medium0.42 ± 0.15 b0.48 ± 0.27 b0.26 ± 0.38 ab0.69
upper0.88 ± 0.24 c0.77 ± 0.26 c0.76 ± 0.36 c1.19
total0.51 ± 0.100.53 ± 0.180.65 ± 0.120.62
H′BAlower0.28 ± 0.23 a0.48 ± 0.27 abc0.38 ± 0.29 ab0.63
medium0.58 ± 0.18 abc0.51 ± 0.27 abc0.33 ± 0.47 ab0.84
upper0.81 ± 0.31 c0.63 ± 0.36 abc0.66 ± 0.41 bc1.16
total0.99 ± 0.160.83 ± 0.240.83 ± 0.331.16
Rlower0.96 ± 0.130.93 ± 0.110.90 ± 0.160.90 ***
medium1.10 ± 0.151.05 ± 0.151.02 ± 0.021.03
upper1.05 ± 0.281.07 ± 0.201.15 ± 0.191.04
total1.03 ± 0.091.08 ± 0.061.05 ± 0.061.03
H1.41 ± 0.121.51 ± 0.261.40 ± 0.172.00
EN0.45 ± 0.08 a0.50 ± 0.13 a0.69 ± 0.20 b0.39
EBA0.87 ± 0.090.79 ± 0.150.81 ± 0.130.72
G0.38 ± 0.030.36 ± 0.060.41 ± 0.060.38
T0.55 ± 0.03 b0.50 ± 0.04 a0.56 ± 0.02 b0.51
SCId10.22 ± 1.319.95 ± 1.8311.29 ± 1.969.90
SCIh6.37 ± 0.536.21 ± 0.686.61 ± 0.796.15
H′N–Shannon diversity index according to stem density, H′BA–Shannon diversity index according to basal area, R–aggregation index, H–homogeneity index, EN–standardised diversity according to density, EBA–standardised diversity according to basal area, G–Gini coefficient, T–diameter differentiation index, SCId–structural complexity index according to dbh, SCIh–structural complexity index according to tree height. Letters indicate significant differences among the stand layers and/or stages (MANOVA, p ≤0.05). Nonsignificant differences are without letters. R is tested by standard, normally distributed test statistic with the boundary correction factor by Donnelly (***, p ≤0.001).
Table 5. Area of spatially continuous natural regeneration according to dominant tree species and height/dbh category.
CategoryBeechMaplesAshTotal
m2·ha−1m2·ha−1m2·ha−1m2·ha−1%
≤50 cm1078919613
51–130 cm181021208
>130 cm *508101553336
dbh 2–8 cm64664643
totalm2·ha−111541352061495100
%77914100
*, up to dbh 2 cm.

