Lnc-ITM2C-1 and GPR55 Are Proviral Host Factors for Hepatitis C Virus
by
 ,
,
Pan Hu
1,*, 
Jochen Wilhelm
2,
Gesche K. Gerresheim
1,
Lyudmila A. Shalamova
1 and
Michael Niepmann
1,* 1
Institute of Biochemistry, Medical Faculty, Justus-Liebig-University, Friedrichstrasse 24, 35392 Giessen, Germany
2
Universities of Giessen and Marburg Lung Center (UGMLC), German Center for Lung Research (DZL), 35392 Giessen, Germany
*
Authors to whom correspondence should be addressed.
Viruses 2019, 11(6), 549; https://0-doi-org.brum.beds.ac.uk/10.3390/v11060549
Submission received: 15 April 2019
/
Revised: 1 June 2019
/
Accepted: 12 June 2019
/
Published: 13 June 2019
(This article belongs to the Section Viral Immunology, Vaccines, and Antivirals)
Abstract
:Multiple host factors are known to play important roles in hepatitis C virus (HCV) replication, in immune responses induced by HCV infection, or in processes that facilitate virus escape from immune clearance, while yet only few studies examined the contribution of long non-coding RNAs (lncRNAs/lncRs). Using microarrays, we identified lncRNAs with altered expression levels in HCV replicating Huh-7.5 hepatoma cells. Of these, lncR 8(Lnc-ITM2C-1/LOC151484) was confirmed by quantitative real-time PCR (qRT-PCR) to be upregulated early after HCV infection. After suppressing the expression of lncR 8, HCV RNA and protein were downregulated, confirming a positive correlation between lncR 8 expression and HCV replication. lncR 8 knockdown in Huh-7.5 cells reduced expression of the neighboring gene G protein-coupled receptor 55 (GPR55) mRNA level at early times, and leads to increased levels of several Interferon stimulated genes (ISGs) including ISG15, Mx1 and IFITM1. Importantly, the effect of lncR 8 on ISGs and GPR55 precedes its effect on HCV replication. Furthermore, knockdown of GPR55 mRNA induces ISG expression, providing a possible link between lncR 8 and ISGs. We conclude that HCV induces lncR 8 expression, while lncR 8 indirectly favors HCV replication by stimulating expression of its neighboring gene GPR55, which in turn downregulates expression of ISGs. The latter fact is also consistent with an anti-inflammatory role of GPR55. These events may contribute to the failure to eliminate ongoing HCV infection.
1. Introduction
First identified in 1989, Hepatitis C virus (HCV) is an enveloped virus belonging to the Flaviviridae family [1,2]. The components of the HCV virion particle include the 9.6 kb single-stranded HCV RNA genome of positive polarity and some HCV non-structural proteins [3,4]. The HCV RNA moves to ribosomes after viral entry, and serves as a messenger RNA (mRNA) for translation of the viral proteins [3,5,6]. The encoded polyprotein is processed by viral and host proteases into 10 mature proteins, core, E1, E2, p7, NS2, NS3, NS4A, NS4B, NS5A, and NS5B [7,8,9]. Negative strand RNA intermediates are generated which then act as templates for the synthesis of new positive strand genomic RNA at the endoplasmic reticulum(ER)-derived membranous webs [3,7]. Viral assembly and release are the last steps of a complete HCV viral life cycle [3,5,6,7].
During its life cycle, the cell develops several mechanisms to recognize the virus and fight against it. The tightly coordinated innate immune signaling pathways in the liver provide the first and significant line of host defense against HCV [10,11], while the adaptive immune response emerges over several weeks [12]. Upon HCV infection, specific pathogen-associated molecular patterns (PAMPs) of HCV can be sensed by different pattern recognition receptors (PRRs), like retinoic acid-inducible gene I (RIG-I), melanoma differentiation factor 5 (MDA5), and toll-like receptor 3 (TLR3), leading to the production of pro-inflammatory cytokines, chemokines, and interferon (IFN), which include Type I IFN (IFNα, IFNβ, and others), Type II IFN (IFNγ), and Type III IFN (IFNλ) [12,13,14,15]. After triggering the JAK-STAT signaling pathway, the final outcome of the IFN signaling is the induction of hundreds of IFN-stimulated genes (ISGs), which serve as direct effectors of the IFN antiviral defense [10,12,14,15]. Antiviral ISGs may target many steps in the HCV life cycle to limit viral replication or promote the IFN antiviral ability [13,14,16]. IFN signaling and the subsequent expression of ISGs are central in this antiviral defense [17]. Only combined ISGs can induce a strong antiviral response, while the effect of a single ISG is weak [14,18].
In spite of activated immune response, 70–80% of infected patients develop chronic infection without clearance of HCV, including chronic hepatitis, cirrhosis and hepatocellular carcinoma (HCC). HCV remains a global health issue affecting approximately 2% of the global population [1,14,19]. The co-existence of high viral loads and high ISG expression reflects the failure of the innate immune response in clearing HCV [10], suggesting strategies used by HCV to evade the host immune response [11]. It was shown that the ineffectiveness of the innate immune response can be achieved by cleavage of MAVS by NS3/4A protease, by an ISG translation block mediated by the noncanonical cellular sensors dsRNA-activated protein kinase R (PKR) and DEAD box RNA helicase 3 (DDX3X), or by ISGs like ubiquitin specific peptidase 18 (USP18) that downregulates the IFN pathway response as a negative feedback to ensure homeostasis of the cellular immune response [4,11,13,14,16,20]. Autophagy induced by HCV might also be involved in the suppression of type I IFN production [18]. Moreover, HCV related exosomes also contribute to the immune escape [20].
Constituting about 65% of the human transcriptome, long non-coding RNA (lncRNA) is defined as RNA with more than 200 nucleotides in length and lacking protein coding capacity or only containing small open reading frames (ORFs) [4]. LncRNAs can regulate chromatin remodeling, transcription in cis or trans, translation, or serve as enzyme cofactors [21]. Increasing evidence suggests that cellular lncRNAs may be deregulated in response to viral replication or to the antiviral pathways induced by infection [4,13]. They may function in the HCV life cycle, the antiviral immune response induced by HCV, or in HCV immune escape, finally exerting a proviral or antiviral role [4,14]. LncRNAs, like growth arrest-specific 5 (GAS5), BST2 interferon stimulated positive regulator (BISPR), lncRNA#32/LUARIS, and lncITPRIP-1 can suppress HCV replication by different mechanisms. GAS5 binds HCV NS3 protein to inhibit its functions or binds miR-222 to release p27 protein, lncITPRIP-1 enhances the innate immune response by MDA5 oligomerization and activation [22,23,24]. LncRNA#32/LUARIS controls the expression of several ISGs [25], while BISPR appears to increase the expression of a single target gene, ISG BST2, and thereby leads to decreased virion release [13]. In fact, GAS5 was also reported to positively regulate IFN responses in esophageal squamous cell carcinoma [26]. In contrast, negative regulator of interferon response (NRIR) (also known as lncRNA-CMPK2) and eosinophil granule ontogeny transcript (EGOT) are proviral lncRNAs which negatively regulate ISGs and thus antagonize the antiviral response [4,14,15]. NORAD binds miR-373, resulting in release of their common target Wee1 and thereby deregulation of cell growth in HCV infected cells [27]. Interestingly, BISPR and NRIR are also bona-fide ISGs themselves [14]. In fact, investigation in esophageal squamous cell carcinoma also supports that GAS5 is an ISG which regulates the expression of other ISGs [26]. Taken together, accumulating data suggest a critical role of lncRNAs during HCV infection. However, only a small number of lncRNAs, even less for HCV-related lncRNAs, has been functionally studied [14].
In this study, we examined cellular lncRNAs with altered expression after fully established infection with HCV to identify additional lncRNAs that may regulate different steps of the HCV life cycle and the innate immune response. Two novel lncRNA candidates identified in this study, with anti- or proviral function for HCV replication, underline an involvement of lncRNAs in the battle of HCV and host cells.
2. Materials and Methods
2.1. Cell Culture
Human hepatocarcinoma derived Huh-7.5 cells and naïve Huh-7 cells, kindly provided by Charles Rice (Rockefeller University, New York, USA)and Ralf Bartenschlager (Heidelberg, Germany) respectively, were maintained in Dulbecco’s modified Eagle’s medium (DMEM) (Life Technology) supplemented with 10% fetal bovine serum (FBS) and 1% penicillin–streptavidin (10,000 U/mL), and grown at 37 °C in a 5% CO2 incubator.
2.2. Plasmid and In Vitro Transcription
Plasmid pFK-JFH1-J6 C-846_dg (briefly: Jc1) as previously described [28], kindly provided by Ralf Bartenschlager (Heidelberg, Germany), was used to generate full-length HCV Jc1 genomes(J6/JFH1 chimeric genotype 2a) by in vitro transcription.
The Jc1 plasmid was first digested with Mlu I-HF (NEB) for 2 hours (hrs) at 37 °C. Linearized DNA was purified by phenol/chloroform extraction and ethanol precipitation. Then, the concentration of dissolved DNA was measured by Qubit 2.0 Fluorimeter (ThermoFisher). The DNA size and linearization were checked on agarose gels.
In vitro transcription was performed using T7 RNA Polymerase (ThermoFisher) in the presence of 3.75 mM of each NTP, additional 5 mM MgCl2 and 10 mM DTT, and 30 ng/µL of linearized plasmid DNA. After 2 h of incubation at 37 °C, another 1 U/µL of T7 RNA Polymerase was added for 2 h more. Template DNA was then digested by 2 U RNase-free DNase I (NEB) per 1 µg of DNA for 1 h at 37 °C. HCV full-length Jc1 RNA transcripts were dissolved in equal amounts of RNase-free water. After removing the enzymes using GeneJET RNA Clean-up Kit (ThermoFisher), transcripts were checked for integrity by agarose gel electrophoresis and quantified by Qubit Fluorimeter.
2.3. Infectious HCV in Cell Culture
The Jc1 in vitro-transcribed RNA was transfected into Huh-7.5 cells by electroporation. The culture supernatants collected at 6 day (d) after transfection were distributed into split Huh-7.5 cells. After additional multiplication passages on naïve cells, the cell-free supernatants containing HCV were concentrated approximately 50-fold using Amicon Ultra-15 Centrifugal Filters (Millipore, Billerica, MA, USA). Aliquots were stored at −80 °C until use. Virus titers were determined by focus-forming units (FFU) assay. Huh-7.5 cells were seeded at 0.25 × 10⁵ cells per well in 24-well plates and cultured overnight. Test samples were diluted serially 10-fold and each dilution was inoculated into the cells. After incubation for 4 h at 37 °C, the cells were supplemented with fresh complete DMEM and cultured for 48 h. The cells were then immunofluorescence-stained for HCV NS5A. HCV-positive foci were manually counted under a fluorescence microscope. The virus titer was expressed as focus-forming units per milliliter of supernatant (FFU/mL), as determined by the average number of NS5A-positive foci detected in a whole well.
2.4. Oligonucleotides (Oligos)
miR-122 RNA oligos were supplied by biomers.net (Germany). The sequences were: miR-122 mat, 5′-(phos) UGGAGUGUGACAAUGGUGUUUG-3′, miR-122*, 5′-(phos) AACGCCAUUAUCACACUAAAUA-3′. Duplexes were formed by annealing same amounts of the guide (mat) and its complementary passenger strand (*) in a thermocycler by a steady temperature decrease from 90 °C to 4 °C (1 °C per minute).
The Locked nucleic acid (LNA) mixmer oligo for sequestering miR-122 was ordered from Exiqon (Denmark). The sequence was:
5′-+C*C*A*+T*T*G*+T*C*A*+C*A*C*+T*C*+C-3′, where (+) indicates a following LNA residue and G*, A*, T*, C* indicate phosphorothioate DNA bases.
LNATM long RNA GapmeR (GmR) oligos targeting different lncRNA candidates were designed using online Antisense GmR Designer (https://www.qiagen.com/de/shop/genes-and-pathways/custom-products/custom-assay-products/antisensegapmerdesigner/) and purchased from Qiagen (Germany). The sequences of the GmRs were:
- GmR Negative Control A (Neg. ctr. GmR): 5′-AACACGTCTATACGC-3′;
- GmR 1 for lncR 3/LINC00222 (lncR 3-GmR 1): 5′-GCGTGATTAAATGGAT-3′;
- GmR 2 for lncR 3/LINC00222 (lncR 3-GmR 2): 5′-GACGATAAGAGGTAAC-3′;
- GmR 1 for lncR 7/Lnc-SLC12A7-4 (lncR 7-GmR 1): 5′-TGATTAACAGAACGGA-3′;
- GmR 2 for lncR 7/Lnc-SLC12A7-4 (lncR 7-GmR 2): 5′-ATAAGTGTCTAGTTAG-3′;
- GmR 1 for lncR 8/Lnc-ITM2C-1(lncR 8-GmR 1): 5′-GTTACCAGTGAAGCGG-3′;
- GmR 2 for lncR 8/Lnc-ITM2C-1 (lncR 8-GmR 2): 5′-TCGGATTGGTCACATG-3′;
- GmR 1 for lncR 10/ZNF252P-AS1 (lncR 10-GmR 1): 5′-GTTAATCTGATCTTGC-3′;
- GmR 2 for lncR 10/ZNF252P-AS1 (lncR 10-GmR 2): 5′-TCTGAGCTTGATCACT-3′;
- GmR 1 for GPR55 (GPR55-GmR 1): 5′-GGCGAATCAGATTAAT-3′;
- GmR 2 for GPR55 (GPR55-GmR 2): 5′-AGGACCATCTTGAATG-3′;
Primers were purchased from biomers.net. Primers used for reverse-transcription (RT) reaction and qRT-PCR of lncRNA candidates are listed in Table 1 (Primers for lncRs 1, 4, 5, 6, and 9 with failed amplification are not shown). Primers for other genes are listed in Table 2. Most primers were designed by the PrimerPremier5 program (United Kingdom). Primers to amplify GAS5, small nucleolar RNA U99, H/ACA box 57 (snoRNA U99, U99), ISG15 ubiquitin-like modifier (ISG15), MX dynamin like GTPase 1 (Mx1), and interferon induced transmembrane protein 1 (IFITM1) fragments were obtained from previous reports [15,22,29,30]. Primers for Integral membrane protein 2C (ITM2C), G protein-coupled receptor 55 (GPR55), C-X-C motif chemokine ligand 10 (CXCL10), melanoma differentiation-associated protein 5 (MDA5, also named IFIH1), interferon beta 1, fibroblast (IFN-β) were from PrimerBank (https://pga.mgh.harvard.edu/primerbank/). Two different sets of primers targeting two sites of the sequences were designed for lncRs 3, 7, 8, and 10. qRT-PCR detecting expression after miR-122 with or without HCV treatment, and detecting cytoplasm/nucleus location were performed using 5′ side primers. To test the effect after GmR knockdown, 5′ side primers for lncRs 3 and 7, 3′ side primers for lncRs 8 and 10 were used.
2.5. Cell Treatment
To identify HCV altered transcriptome, transfection of 500 ng miR-122 duplex into Huh-7.5 cells in T175 flask was performed using Lipofectamine 2000 (Invitrogen) 24 h prior to HCV RNA electroporation. Cells were transfected at about 70% confluency. Oligos and Lipofectamine were first prepared as master mixtures in separate tubes in serum/antibiotic-free DMEM (50 μL/reaction). After 5 minutes (min) at room temperature, each sample was mixed together with Lipofectamine and incubated for 15 min. Then, 100 μL Lipofectamine-oligo mixed solution was carefully applied to the cells dropwise. At 3 h post transfection, the cells were washed in phosphate buffered saline (PBS), and fresh medium was added. The in vitro transcribed Jc1 HCV RNA together with miR-122 duplex, or miR-122 duplex only, were transfected into 400 µL of cells at 1.0 × 10⁷ cells/ml by electroporation one day later. miR-122 duplexes with or without 8 µg HCV RNA were separately prepared for each treatment. Anti-miR-122 LNA mixmer, which sequesters endogenous miR-122 and by that disables HCV replication, was also used to treat cells alone or with HCV transfection. The setting for Gene Pulser Xcell (Biorad, USA) was: square wave, 270 V, 20 ms, 1 Pulse, 4 mm cuvette. The cells were washed with PBS to remove dead cells at 6 h post incubation (hpi). Cells were further incubated with complete DMEM for 72 h, and another round of miR-122 duplex transfection was carried out to compensate for miR-122 loss and degradation after three days incubation in cells. HCV infection was allowed to proceed and cells were harvest 48 h later (i.e., 6 d after HCV RNA transfection).
For knockdown experiments, cells were seeded at 1.5 × 10⁵ cells/mL in 12-well plates 24 h before GmR treatment. 50 pmol of GmRs targeting lncRNA candidates in a final volume of 1 mL were transfected with Lipofectamine 2000 24 h prior to HCV transfection or infection. The medium was not supplemented with antibiotics. Medium from the cells was then substituted by fresh DMEM supplemented with antibiotics and FBS, and full-length HCV genome was transfected at 0.375 µg/well using Lipofectamine 2000. Cells were harvested after 12, 24, and 48 h incubation.
To study HCV infection, cells were infected with HCV at the multiplicity of infection (moi) of 0.3 for 4 h. After 4 h of infection, medium supernatants were removed and fresh medium was added to the cells. Cell supernatants and pellets were harvested at the indicated times post-infection. A replication defective mutant version of the HCV genome (NS5B replicase inactivating "GND" mutation) was also prepared to infect cells. Pathogen associated molecular pattern (PAMP) poly (I:C) (Invivogen) was also used to treat Huh-7.5 cells and Huh-7 cells at 2.5 µg or 5 µg per well for 8 h. In experiments with Janus kinase/signal transducers and activators of transcription (JAK–STAT) inhibitor, Huh-7.5 cells were treated with the JAK inhibitor ruxolitinib (Invivogen) (0.8 µM) for 1 h, with a subsequent treatment with IFN-α2 (100 units/mL) or mock control for 8 h followed by harvest of RNA.
2.6. RNA Samples, DNA Removal, and cDNA Preparation
Total RNA was isolated from cells using TRIzol (Invitrogen). After DNase I treatment, the total RNA was purified using GeneJET RNA Clean-up Kit. Nuclear and cytoplasmic cell fractionation was obtained using the Paris kit following the manufacturer’s instructions (Life Technologies). RNA integrity was checked by agarose gel electrophoresis, and RNA concentrations were measured by Qubit 2.0. Reverse transcription (RT) was performed using the qScript Flex cDNA Kit (Quanta Biosciences). Random primers or Gene-specific primers were used in the RT reaction. To determine whether lncRNA candidates are polyadenylated, cDNA with oligo dT primer was also prepared.
Total RNA for microarray was lysed by using a protocol combining TRIzol Reagent and RNeasy Kit (Qiagen). Next, total RNA was resuspended in RNase-free water. The quality of the RNA was analyzed by Bioanalyzer (Agilent Technologies, Santa Clara, CA, USA). Only RNAs with RNA Integrity Number (RIN) >9.5 were used for subsequent experiments.
2.7. Microarrays
Purified total RNAs after miR-122 with or without HCV treatment were amplified and Cy3-labeled using the LIRAK kit (Agilent Technologies) following the kit instructions. Per reaction, 200 ng of total RNA was used. The Cy3-labeled RNA was hybridized overnight to 8 × 60K 60mer oligonucleotide spotted microarray slides (Agilent Technologies, design ID 072363). Hybridization and subsequent washing and drying of the slides were performed following the Agilent hybridization protocol. The dried slides were scanned at 2 µm/pixel resolution using the InnoScan 900 (Innopsys, Carbonne, France). Image analysis was performed with Mapix 6.5.0 software, and calculated values for all spots were saved as GenePix results files. Stored data were evaluated using the R software [31] and the limma package [32] from BioConductor [33]. Mean spot signals were background corrected with an offset of 1 using the NormExp procedure on the negative control spots. The logarithms of the background-corrected values were quantile-normalized [32,34]. The normalized values were then averaged for replicate spots per array. From different probes addressing the same NCBI gene ID, the probe showing the maximum average signal intensity over the samples was used in subsequent analyses. Genes were ranked for differential expression using a moderated t-statistic [32]. Pathway analyses were done using gene set tests on the ranks of the t-values [32]. Z value was calculated according to formula: Z = (E − )/SD, where E is the quantile-normalized log2 signal intensity, is the mean value of E, SD indicates the standard deviation across the samples.
2.8. Quantitative Real Time-PCR (qRT-PCR)
qRT-PCR was performed with the PerfeCTa SYBR Green FastMix (Quanta Biosciences) according to the manufacturer’s instructions in the StepOnePlus™ Real-Time PCR System (Applied Biosystems) with the following temperature setting: initial denaturation for 20 s at 95 °C; 40 cycles of subsequent denaturation (3 s at 95 °C) and elongation (30 s at 60 °C); melting curve for 20 min. The secondary products and primer-dimers were excluded via melting curve and agarose gel electrophoresis. The specificity of amplification was verified by the presence of a single peak in the melting curve and also by sequencing (Microsynth SeqLab, Germany). Glyceraldehyde 3-phosphate dehydrogenase (GAPDH) mRNA levels were evaluated in all cases as a reference, and other expression results were normalized to GAPDH. Amplification efficiencies (E) of each primer pair were calculated using the following formula: E = 10(-1/slope). The E of primers used in this study was within the range of 1.8-2.2 [35]. To calculate the relative RNA levels in cytoplasmic/nuclear fractions, 2−∆Ct was used, where Ct is the threshold cycle number, ∆Ct = Ct of the gene in nucleus-Ct in cytoplasm. The expression fold change compared to control group was obtained using calculation: Fold change = (Etarget)^∆Cttarget(control-sample)/(Eref)^∆Ctref(control-sample), where Etarget and Eref are the respective amplification efficiencies of target genes and reference gene GAPDH; ∆Ct = Ct of the control sample - Ct of the treatment sample. The relative expression level of lncRNAs after GmR knockdown was presented as 1000*2−∆Ct, ∆Ct = Ct of the target gene - Ct of the reference gene GAPDH. The results of all biological replicates (minimum of three) and technical replicates (minimum of two) were used to derive the final data with standard error of the mean (SEM) graphed as error bars.
2.9. Immunofluorescence
One day before transfection, coverslips were heated in pure Ethanol and covered for 30 min with 0.1 mg/mL Poly-L-Lysin (30000-70000). Two days after transfection of HCV full-length Jc1 genomes, cells were washed with PBS and fixed with 4% paraformaldehyde for 10 min. Cells were washed again 3 times (×) with ice cold PBS, permeabilized with cold acetone for 10 min at −20 °C and again washed. Then, cells were incubated with 1% BSA, 22.5 mg/mL glycine in PBST (1 × PBS, 0.5% Tween 20) (Glycin-PBST) for 10 min. For staining, cells were incubated with a 1:500 dilution of Anti-HCV NS3 antibody (8 G-2, Abcam) in 1% BSA for 1 h at room temperature. Cells were washed 3 × with Glycin-PBST and then incubated with a 1:200 dilution of the secondary antibody (goat anti-mouse IgG1, Alexa Fluor® 488 conjugate) for 1 h at 37 °C in the dark. Cells were again washed 3 × with Glycin-PBST, incubated with Fluoroshield Mounting Medium With DAPI(Abcam)for 5 min. Fluorescent images were obtained with a fluorescent microscope (Olympus).
2.10. Western Blot
Cell pellets for western blots were lysed in 200 µL buffer (25 mM Tris-HCl (pH 7.5), 150 mM KCl, 2 mM EDTA (pH 7.5), 0.5 mM DTT, 0.5% NP-40). Following the pelleting of cell debris, 10 µL protein extracts were mixed with SDS loading buffer, denatured at 95 °C for 10 min, and subjected to 12% SDS-polyacrylamide gel electrophoresis. Next, proteins were transferred onto a PVDF membrane (Immobilon). Membranes were blocked with 7.5% milk in TBST for 1 h and incubated with monoclonal antibodies against GAPDH diluted 1:15000 (clone GAPDH-71.1, Sigma-Aldrich), Anti-HCV NS3 antibody 8G-2 (Abcam) diluted 1:500. After washing, membranes were incubated for another 1 h with a secondary goat-anti-mouse IgG HOR antibody conjugated with peroxidase diluted 1:40000 (Sigma-Aldrich). Western blots were developed with SuperSignal West Femto Chemiluminescent substrate (Pierce). The quantification of protein bands from western blotting films was performed by using Image J (NIH) (https://imagej.nih.gov/ij/index.html). The expression level was presented as IntDen ratio of each NS3 band relative to each GAPDH band.
2.11. Protein-Coding Potential
The features of lncRNA candidates, including the reference sequence, the length, Gene symbol and located chromosome of these lncRNAs were collected from NCBI (https://0-www-ncbi-nlm-nih-gov.brum.beds.ac.uk/) and are listed in Table 3. The names used in this study were based on LNCipedia gene ID or HGNC Gene Symbol.
Coding potential of lncRNA candidates was evaluated by Open reading frame Finder (https://0-www-ncbi-nlm-nih-gov.brum.beds.ac.uk/orffinder/), and by searching the LNCipedia 5.2 (http://www.lncipedia.org) for the presence of our candidates in the Pride proteomics database and the Lee lists of novel coding RNAs or Bazzini lists of lncRNAs containing small open reading frames (smORFS) obtained in ribosome profiling experiments. The evaluation of our candidates by Phylogenetic Codon Substitution Frequencies (PhyloCSF) and the coding potential assessment tool (CPAT) were also included [29,36]. Results from LNCipedia are listed in Table 4.
2.12. Statistical Analysis
The graphs showed mean and standard error of mean (Mean ± SEM) of at least three independent experiments. SEM is represented by error bar. Comparisons between groups were performed using two-tailed Student’s t-test by GraphPad. p-values lower than 0.05 were considered with statistical significance. * denotes p ≤ 0.05, ** p ≤ 0.01, *** p ≤ 0.001, and **** p ≤ 0.0001.
3. Results
3.1. Identification of lncRNAs Deregulated by HCV Replication
To identify deregulated lncRNAs induced by HCV replication, we carried out a gene expression microarray assay. Huh-7.5 cells were electroporated either with miR-122 only or with miR-122 plus HCV full-length genomic RNA, and then left for 6 days. Since Huh-7.5 cells contains somewhat lower levels of miR-122 than primary hepatocytes, miR-122 transfection was performed one day before and three days after the electroporation of HCV RNA to mimic a high level of miR-122, which is essential for HCV replication [37,38,39,40]. The 6-day duration of HCV replication was chosen to analyze the changes in expression levels of low abundance lncRNAs under conditions similar to long-term infection. A large fraction of the cells contained replicating virus at the harvest day, as evaluated by immunofluorescence and western blotting against HCV protein (Figure 1A,B) and by qRT-PCR targeting HCV RNA in the NS3 coding region (Figure 1C).
RNA samples from two independent biological replicates were used to hybridize an array in the Human G3 v3 Microarray Kit. Analysis of the expression changes in transcripts showed 68 deregulated genes with fold changes > 4 and p ˂ 0.01 (log fold change > 2, log10P value > 2) in HCV treated cells compared to control cells (Figure 1D). They were involved in different cellular process including immune response, amino acid metabolism, cell cycle, lipid homeostasis and alcoholism according to the KEGG analysis (Figure 1G). Eighteen putative lncRNAs and 48 protein coding mRNAs showed a significant change of expression level in Huh-7.5 cells upon HCV replication (Figure 1E,F; fold change > 4, p ˂ 0.01).
3.2. HCV Replication Increases the Expression of Four lncRNAs
In total, 11 lncRNAs (here renamed to lncR 1-10, nine upregulated and one downregulated in response to HCV replication; whereby lncR 7 has two variants, labeled as lncR 7-1 & 2) were selected for further investigation. To our knowledge, none of them had been functionally studied to date. Changes of the transcript levels observed in HCV replicating samples versus control were verified by qRT-PCR. GAS5 [22] was used as a positive control. Two variants of lncR 7 have 70 bp difference in sequence, they were amplified separately by variant specific primers (see Table 1). Six candidates were discarded due to failed (lncR 5, 6) or poor amplification (lncR 1, 4, 7-1, 9), which is mainly caused by their very low expression levels. A consistent result between the data of the qRT-PCR and microarray analysis was observed for lncR 3, 7-2, and 8 (Figure 2A). Samples after HCV or mock treatment without adding ectopic miR-122 were also prepared. Similar upregulation of lncR 8 was also observed in samples added ectopic miR-122 but only containing endogenous miR-122 (Figure S2B). LncR 2 expression was not altered by HCV replication, while lncR 10 was upregulated (Figure 2A), showing a result opposite to the microarrays (Figure 2E). In this context, it is interesting to note that lncR 10 was reported to be upregulated in hepatocellular carcinoma (HCC) tissues compared to adjacent non-tumor tissues in another study [41]. Concerning this possible link between HCV infection and HCC, we therefore also proceeded with lncR 10.
3.3. Low Protein Coding Potential and Subcellular Localization of lncRNAs
ORF Finder (NCBI) was used to determine all possible ORFs in four candidate lncRNAs. Putative ORFs longer than 100 amino acids (aa), which was set as a noncoding threshold, were screened for the presence of Kozak sequences (A/GCCACC or A/GCC) at the initiation codon. No results indicating coding capacity for these four lncRNA candidates were obtained (Data not shown). LncR 8/Lnc-ITM2C-1 was predicted as a coding gene according to CPAT (69.31%) but not interpreted as coding RNA according to PhyloCSF (-112.1426), and it was also not present in the PRIDE archive, and not in the Lee and the Bazzini coding RNA lists (Table 4). LncR 3, 7-2, and 10 were all described as non-coding RNA in LNCipedia, indicating a very low probability for coding (Table 4).
The preference of nuclear or cytoplasmic location can give clues for the function of a lncRNA [14,41,42]. To gain insight into the potential roles of the lncRNAs, we evaluated the subcellular localization of lncRs 3, 7-2, 8, and 10 in untreated Huh-7.5 cells and Huh-7.5 cells treated with miR-122 alone or miR-122 plus HCV. As expected, GAPDH reference transcripts accumulate preferentially in the cytoplasm in treated or untreated Huh-7.5 cells (Figure 2B). In contrast, more U6 RNA was found to be in the nucleus compared to cytoplasm. The relatively high ratio of U6 reference transcripts in the cytoplasm may be due to a leakage during nucleus/cytoplasm fractionation, which was also found in a previous study [43]. Therefore, we used U99 RNA as an additional control; U99 RNA was more localized in the nucleus. Importantly, lncR 8 and 10 were dominantly accumulated in the nucleus, while LncR 3 and 7-2 were found in both fractions. The nuclear enrichment of lncR 8 and 10 further confirmed their noncoding nature. No obvious difference in subcellular translocation due to the treatment with miR-122 or with HCV was observed. Thus, the different subcellular locations of our lncRNA candidates indicate different function and regulation mechanisms. In particular, lncR 8 (which is further analyzed below) is localized in the nucleus.
3.4. LncR 8/Lnc-ITM2C-1 Favors HCV Viral Replication
To evaluate the role of the lncRNAs in viral replication, we depleted lncRNAs from cells with GapmeRs (GmRs) independently targeting two different sites in the respective lncRNA to minimize off-target effects. LNA™ longRNA GapmeRs are single-stranded antisense oligonucleotides that contain a central block of deoxynucleotide monomers, flanked by locked nucleic acid (LNA) stretches for strong target binding and nuclease resistance. The central DNA block induces RNase H mediated degradation of the target RNA and can be used for knockdown of lncRNA and mRNA in cell cultures and even in animal models [44,45]. GmRs are effective at degrading both nuclear and cytoplasmic lncRNAs [44]. Cells were transfected with the specific GmRs or with negative control GmR (Neg. ctr. GmR, which contains a randomized targeting sequence) one day prior to transfection with HCV RNA and collected at indicated time points. The Neg. ctr. GmR transfection serves to level out unspecific effects that may be caused by the transfected GmRs in general. To display GmR binding specificity in the genome, CLUSTAL and NBLAST analyses were done. The results show that the Neg. ctr. GmR does not bind specifically to any target in the human transcriptome, and all GapmeRs specific for lncRNAs used in this study are very specific for their genuine targets, except that lncR 10-GmR1 has a single off-target with only 1 nt difference (Figure S1).The suppression of targeting lncRNAs 48 h after HCV transfection was examined by qRT-PCR (Figure 3A). Reference gene GAPDH was used for normalization. Since qRT-PCR detection of expression levels may significantly differ when targeting the 5′ or the 3′ side of the GmR target sequences [46], two different sets of primers targeting both sides of lncRNA sequence were checked and compared (Data not shown). Primers amplifying 5′ side sequence of lncRs 3 and 7-2, and 3′ side primers for lncRs 8 and 10 were used to determine GmR effects in this study. Both GmRs against lncRNAs functioned efficiently (Figure 3A).
HCV RNA level after lncRNA knockdown was examined by qRT-PCR. Since GAPDH was used for ‘well-to-well’ normalization within each experiment to correct for slight variations in samples, another house-keeping gene β-actin was used as a negative control gene, which is not supposed to be affected by the treatment (Figure 3B). β-actin did not show changes due to treatment. Two GmRs targeting lncR 3 stimulated HCV RNA expression, but the stimulation by lncR3-GmR 1 was not statistically significant, whereas lncR3-GmR 2 significantly induced upregulation of HCV protein level (Figure 3C). No change of HCV RNA levels was observed after the silencing of lncRs 7-2 and 10 (Figure 3B). However, HCV protein level was upregulated in lncR 7 knockdown samples and in lncR 10-GmR 1 treated samples (Figure 3C). Considering the extremely low level of lncR 7-1 in Huh-7.5 cells that was not detected by qRT-PCR in our study, the upregulated HCV protein after lncR 7 knockdown was believed to be mainly the effect of suppression of variant 2 by GmRs that target both variants. These results pointed out a negative regulation of HCV translation, but not replication, by lncR 7-2. Given the inconsistent effects caused by two GmRs targeting lncRs 3 and 10, we cannot exclude that the changes of HCV expression is caused by off-target effect of lncR3-GmR 2 and lncR 10-GmR 1. In contrast, viral RNA and viral protein were both decreased after lncR 8 suppression (Figure 3B,C). Based on these results, we learned that lncR 7-2 is a negative regulator of HCV, while lncR 8 supports HCV replication. Therefore, we focused on lncR 8 in the following. When higher concentration of lncR 8-GmR was added in cells, HCV RNA expression showed a stronger decrease, further confirming a correlation between lncR 8 level and HCV replication level (Figure 3D).
3.5. LncR 8/Lnc-ITM2C-1 Is a Short-Term Cis-Acting Regulator of Its Neighbor GPR55
Previous studies showed that lncRNAs can regulate neighboring genes [47]. The genes for Integral Membrane Protein 2C (ITM2C) and G protein-coupled receptor 55 (GPR55) are within 10 kb distance of lncR 8 in the genome (Figure 4A). To gain further insight into the regulatory mechanism of lncR 8, we evaluated the expression of neighboring genes at 6 days after HCV RNA transfection as well as 2 days after lncR 8 suppression in Huh-7.5 cells. Though ITM2C was identified with high expression level in HCV-induced HCC tissues compared to HCV-induced HCC non-tumor liver tissues [48], we found only a very mild increase of ITM2C induced by HCV replication in Huh-7.5 cells (Figure 4B). Furthermore, no change of ITM2C mRNA levels was observed after lncR 8 knockdown (Figure 4C). This rules out a cis-regulatory activity of lncR 8 on ITM2C during HCV replication.
The mRNA expression of the other neighboring gene GPR55 was not significantly altered after 6 days of HCV replication (Figure 4B). HCV triggered lncR 8 expression but did not change GPR55 expression after 6 days, on first glance arguing against a correlation between lncR 8 and GPR55. However, lncR 8 knockdown suppressed GPR55 expression at 48 h post GmR and HCV treatment in Huh-7.5 cells (Figure 4C). In addition, samples after lncR 8-GmRs treatment and further HCV transfection for 12 h and 24 h were examined. Downregulation of GPR55 mRNA levels was also observed at these early time points when lncR 8 was suppressed efficiently (Figure 4D,E). These data strongly indicate a positive regulation of GPR55 by lncR 8 in HCV transfected cells. Considering the different time length in the experimental settings, we hypothesize that lncR 8 controls GPR55 at early times (12, 24, 48 h), while at late times (6 d) the effect of lncR 8 on GPR55 expression may be counteracted by other mechanisms. Taken together, the positive effect of lncR 8 on GPR55 by cis-regulation may act only within a short time period after HCV replication.
3.6. LncR 8/Lnc-ITM2C-1 Is a Negative regulator of the Antiviral Response
Several lncRNAs were proven to affect HCV replication by regulating the interferon response [13,15,25,26,29,49]. To investigate this possibility for lncR 8, we examined the expression levels of four ISGs, CXCL10, ISG15, Mx1, and IFITM1, which are involved in immune responses against HCV [14]. In accordance with previous studies, these four ISGs showed increased expression levels after 6 days of HCV replication in the presence of endogenous plus ectopically added miR-122 (Figure 5A) or without ectopically added but only with endogenous miR-122 in the Huh-7.5 cells (Figure S2D), showing a successfully induced immune response after HCV replication in Huh-7.5 cells. Furthermore, 48 h post HCV transfection followed by lncR 8 silencing for 24 h in Huh-7.5 cells, significant increases of ISG levels compared to control cells were also observed (Figure 5B), except for CXCL10 when lncR 8-GmR 1 was used. This indicates that lncR 8 is a negative regulator of ISGs. In addition, following 24 h of lncR 8-GmR incubation, samples were obtained at 12 and 24 h post HCV transfection. Under these conditions, ISGs, except for CXCL10, were upregulated by lncR 8 silencing (Figure 6A), while HCV RNA level was not altered (Figure 6B). Since GAPDH was used for data normalization, an additional house-keeping gene (β-actin) was used as a negative control target, which was not changed due to lncR 8-GmR treatment compared to negative control cells (Figure 6B). These results show that the upregulation of ISGs expression by lncR 8 suppression occurs earlier than the decrease of HCV RNA levels. Taken together, our data indicate that the suppression of HCV may be the result of ISGs′ increase induced by lncR 8 knockdown.
3.7. LncR 8/Lnc-ITM2C-1 Is Upregulated by HCVcc Infection and Facilitates HCV Infection
To understand the function of lncR 8 in real HCV infection, HCV infectious particles were prepared and used to infect Huh-7.5 cells at MOI of 0.3 for 12 h, 24 h,2 d, and 6 d. lncR 8 and MDA5 were upregulated by HCV infection for 2 d. However, this effect disappears at 6 d post infection (Figure 7B,D). IFN-β was not changed due to HCV infection, while another type I IFN, IFN-α, and type III IFN, IL28A, were upregulated at 2 d and 6 d post infection (Figure 7E). ISG15 and IFITM1 were upregulated at 6 d post HCV infection (Figure 7F), similar to that we observed after HCV RNA transfection (Figure 5A). At earlier time, IFITM1 expression level was also increased due to HCV infection, while CXCL10 was only induced at 12 h post HCV infection, and Mx1 was downregulated after HCV infection for 12 h, 24 h, and 2 d but increased only after 6 d.
In cells first treated with GmR for 24 h and then infected with HCV for 48 h, HCV viral genome and titer was decreased in samples when lncR 8 was decreased by GmRs (Figure 8A–C). Representative ISGs were upregulated in HCV infected cells with lncR8-GmR treatment compared to negative control (Figure 8G). Similar upregulation of ISGs and downregulation of HCV NS3 expression by lncR 8 knockdown were also observed in Huh-7 cells (Figure 8B,G). Similar to the results observed when treated with HCV in vitro transcribed RNA (Figure 6A), the upregulation of ISGs expression was observed early at 12 h post GmR treatment and HCV infection (Figure 9E), while the downregulation of HCV RNA only occurred at 48 h, indicating that the downregulation on ISGs expression by lncR 8 happened earlier than the downregulation on HCV infection. GPR55 was downregulated by lncR 8 knockdown at all the time points we tested (Figure 8D and Figure 9C), similar to what we observed when cells were transfected with HCV RNA (Figure 4C,E). Though IFN-β was not influenced by lncR 8 change at the time points we tested, both IFN-α and IL28A were upregulated by lncR 8 inhibition in Huh-7.5 cells (Figure 8E and Figure 9D). Taken together, lncR 8 is positively regulated by HCV and has a role in stimulating HCV replication by suppression of interferon responses.
3.8. GPR55 Negatively Regulates ISGs
Since both GPR55 and ISGs are negatively regulated by lncR 8, it is interesting to know whether there is a correlation between GPR55 and ISGs. Therefore, GPR55 expression was inhibited by two different GmRs in Huh-7.5 cells for 48 h. Suppression of GPR55 promotes the expression of ISG15, Mx1, and IFITM1 (Figure 10). This finding provides a possible link between lncR 8 and ISGs expression.
3.9. LncR 8/Lnc-ITM2C-1 Is Induced by polyIC
Poly(I:C) is a synthetic analog of double-stranded RNA (dsRNA), a molecular pattern associated with viral infection that induces the innate immune response. When Poly(I:C) was used to treat Huh-7.5 and Huh-7 cells, increasing expression level of ISGs were observed in both cells. lncR 8 was upregulated in Huh-7.5 cells (Figure 11A), which suggests that lncR 8 is not induced specifically by HCV. However, lncR 8 was not changed after poly(I:C) treatment in Huh-7 cells (Figure 11A), indicating different responses in these two cells. Poly(I:C) is known to trigger MDA5-mediated interferon signaling [50]. MDA5 and IFN-β showed upregulation both in Huh-7.5 and Huh-7 cells treated with poly(I:C) (Figure 11B,C). Relatively lower levels of ISGs were induced by poly(I:C) treatment in Huh-7.5 cells compared to that in Huh-7 cells (Figure 11D), which is consistent with both the general induction of ISGs in the cells and the higher permissiveness of Huh-7.5 cells for HCV replication compared with Huh-7 cells.
Importantly, when Huh-7.5 cells were treated with poly(I:C) in combination with lncR 8 GapmeRs for lncR 8 knockdown for 8 h, the ISGs showed increased expression level even compared with control cells with only poly(I:C) treatment (Figure 12). This shows that lncR 8 negatively regulates representative ISGs expression when poly(I:C) was used instead of HCV.
3.10. LncR 8/Lnc-ITM2C-1 Is Downregulated by JAK/STAT Pathway
To learn whether lncR 8 is an ISG, which can be induced by IFN-α, like other known lncRNAs, Huh-7.5 cells were treated with IFN-α and collected after 8 h. qRT-PCR results show that lncR 8 was negatively regulated by IFN-α (Figure 13A). To determine whether the negative regulation of lncR 8 by IFN-α is dependent on JAK-STAT pathway, we treated the Huh-7.5 cells with or without the JAK inhibitor, ruxolitinib, followed by IFN-α treatement. Increased lncR 8 expression was observed when ruxolitinib was added (Figure 13B), indicating that lncR 8 is not an ISG but is negatively regulated by the immune response through the JAK-STAT signaling pathway.
4. Discussion
By using microarray assays, 68 transcripts showed altered expression level upon HCV treatment in Huh-7.5 cells (log fold change > 2, log10P value > 2) (Figure 1D). Compared to the lncRNAs identified in the study of Carnero and coworkers [29], the number we obtained is much lower. Surprisingly, among the 68 altered candidates, no overlapping genes were found between these two studies (Carnero et al., 2016) (Figure 1F,G). It is reasonable to believe that the different experimental conditions in these two studies are the major reason for this difference. Consistent with other previous studies, the coding genes we identified as HCV-upregulated (Figure 1G), like wingless-type MMTV integration site family member 10A (WNT10A), dual specificity phosphatase and pro isomerase domain containing 1 (DUPD1), and fibroblast growth factor 21 (FGF21), were previously described to be upregulated by HCV [51,52,53]. Phosphatidylinositol-4-phosphate 3-kinase catalytic subunit type 2 gamma (PIK3C2G) is required for HCV replication [54]. Downregulated leukocyte cell-derived chemotaxin 2 (LECT2) is a direct target of Wnt/β-catenin signaling in HCC and could be a potential biomarker of HCC in patients [55,56]. Thus, our findings of most coding genes we identified are conformed to previous studies. In contrast, not in line with previous data and also not consistent with our qRT-PCR results [14], ISGs CXCL10, ISG15, Mx1, and IFITM1 were not found to be deregulated in the microarrays. MDA5, which is the main sensor in RIG-I defective Huh-7.5 cells [50], was not detected to be differentially regulated in the microarrays (data not shown). Known lncRNAs like GAS5 and EGOT did not show changes due to HCV replication, which is in contrast to previous studies [22,29]. Despite the different experimental settings, the discrepancy between our microarray results with previous studies and our qRT-PCR results can be caused by several other factors. In the first place, low abundancies of lncRNAs could cause high variance of sequencing results [13]. Perhaps even more importantly, low reproducibility of microarray results can occur when experiments are performed by different laboratories, or in the same laboratory but not in a close time period [57]. Adequate number of biological replicates is needed to exclude major sources of variances and exert reliable biological effects [57,58,59]. Except for what mentioned above, different sequencing methods could also lead to largely different results, like the candidates that were obtained by next generation sequencing (NGS) in our recently published paper [60].
Nevertheless, four lncRNA candidates identified by microarray assays, lncRs 3, 7-2, 8, and 10, were verified by qRT-PCR to be HCV-upregulated lncRNAs (Figure 2A). We performed knockdown experiments of lncRNAs to address their effect on HCV replication. Suppressing lncRs 3, 7-2, and 10 did not change the expression of HCV RNA genome, except that lncR 3-GmR 2 induced a moderate increased level of HCV RNA (Figure 3B). Upregulation of HCV protein expression was observed after knockdown of lncR 7 by two GmRs (Figure 3C). These results pointed out an antiviral role of lncR 7-2 by negatively regulating HCV translation, but not replication. In addition, the presence of lncR 7-2 in both nucleus and cytoplasm fractionation (Figure 2B) indicates that lncR 7-2 may regulate mRNA stability or translation, protein transport or post-translational modifications, in addition to regulation of nuclear events [41,42]. Previously, lncR 7-2 was reported to be a direct target of Notch and was positively regulated in T-cell acute lymphoblastic leukemia [61]. Since hepatitis C virus NS3 protein can activate the Notch-signaling pathway [62], upregulated lncR 7-2 may be the result of the activated Notch pathway that was induced by HCV. Further investigation is still needed to decipher the regulation mechanism of lncR 7 by HCV.
In contrast, lncR 8 suppression with two independent GmRs consistently decreased HCV genomic RNA and protein production (Figure 3B,C), indicating that lncR 8 is required for HCV replication in Huh-7.5 cells. In this study, we further investigated lncR 8. LncRNAs can often regulate their neighboring genes in cis, so we examined the expression of nearby genes, ITM2C and GPR55. GPR55 was downregulated after lncR 8 suppression at 12, 24, and 48 h in HCV-transfected cells (Figure 4C,E), though this regulation was apparently not maintained at later times since no change of GPR55 expression was observed when lncR 8 was upregulated 6 days post HCV replication (Figure 2A and Figure 4B). Thus, lncR 8 may regulate GPR55 by cis-regulation only within a short period after HCV replication. Similar results were observed when cells were infected with HCV virus instead of RNA transfection (Figure 7C, Figure 8D and Figure 9C).
To elucidate the mechanism of proviral activity of lncR 8, ISGs expression were examined after lncR 8 suppression. Surprisingly, two selected ISGs in this study, Mx1 and IFITM1, were upregulated after lncR 8 knockdown in both HCV RNA transfected and virus infected Huh-7.5 cells (Figure 5B and Figure 8G). This suggests that lncR 8 negatively regulates Mx1 and IFITM1 during HCV replication and infection. Moreover, the negative effect of lncR 8 on ISGs was also observed at early times when HCV RNA genome abundance was not yet changed (Figure 6A,B and Figure 9E), suggesting that the HCV suppression was probably caused by ISGs increase induced by lncR 8 knockdown. HCV infection of Huh-7.5 cells for 2 days triggered increase of lncR 8 expression compared to uninfected cells, while this regulation was not observed in cells infected with HCV for 6 days. Interestingly, though HCV RNA transfection can induce increased ISGs expression despite of the negative regulation of lncR 8 on ISGs (Figure 5A), HCV infection did not trigger increase of CXCL10 and Mx1 in Huh-7.5 cells (Figure 7F). Since transfection sends the HCV RNA directly into the cells, successfully bypassing the membrane recognition and fast immune response induced by membrane receptors, this may lead to longer survival time of HCV replication. Furthermore, it is RIG-I but not MDA5 that recognize in vitro transcribed RNAs in the cytosol [63], while MDA5 is crucial for interferon production against the infection of picornaviruses [64]. It is worth noting that Huh-7.5 cells have impaired RIG-I pathways. Thus, HCV RNA added through transfection failed to be recognized by RIG-I in the Huh-7.5 cells cytosol. Taken together, these findings may explain, on the one hand, the presence of lncR 8 induction in Huh-7.5 cells transfected with HCV RNA and, on the other hand, the absence of lncR 8 induction in cells infected HCV virus at later time points. This may directly lead to the upregulation of ISGs levels in HCV transfected cells, and unaffected level of ISGs mRNA in HCV infected cells. Similar upregulation of ISGs and downregulation of HCV NS3 expression by lncR 8 knockdown were also observed in Huh-7 cells (Figure 8A,G), indicating that lncR 8 is also required for HCV infection in Huh-7 cells and this regulation is independent of RIG-I.
Considering the different chromosome locations of ISGs and lncR 8, the negative regulation on ISGs by lncR 8 must occur through a trans-acting mechanism, which resembles the effect of EGOT and lncRNA-CMPK2/NRIR on HCV [15,29]. Enrichment of lncR 8 in the nucleus (Figure 2B) suggests that the regulation on ISGs could be through regulation of a nuclear event like transcriptional regulation, epigenetic DNA/chromatin modification, or control of pre-mRNA splicing [14,42,47]. To elucidate the possibility that lncR 8 regulates ISGs through its neighboring gene GPR55, GPR55 was inhibited by two different GmRs in Huh-7.5 cells for 48 h. Interestingly, suppression of GPR55 promotes the expression of ISG15, Mix1, and IFITM1 (Figure 10). This finding provides a possible link between lncR 8 and ISGs expression, indicating that lncR 8 favors HCV replication by regulating its neighboring gene GPR55, which in turn negatively regulates expression of ISGs (Figure 14). Recently, GPR55 has gained much attention due to its activation by endogenous cannabinoids (EC) and a proinflammatory role in innate immunity [65,66,67]. ECs have been associated with fibrosis progression in HCV-infected patients [68]. On the other hand, elevated levels of ECs were reported in plasma of patients with chronic hepatitis C and indicated potential immunosuppressive and profibrogenic roles [69]. GPR55 is a third cannabinoid receptor which is novel because it is different from the other two classical receptors, CB1 and CB2 [67]. High levels of GPR55 were found in monocyte and natural killer (NK) cells. GPR55 enhances IL-12 and TNF-α production in monocytes and stimulates signature cytokines as well as cytolytic activity in NK cells [66]. While the detailed function of GPR55 during HCV replication remains to be determined, the involvement of GPR55 in the negative regulation of ISGs by lncR 8 indicates a potential anti-inflammatory role of GPR55 and lncR 8 during early HCV replication.
Unlike other lncRNAs that can be induced by IFN-α, lncR8 is negatively regulated by IFN-α (Figure 13A) through the JAK-STAT pathway (Figure 13B). We speculated that lncR 8 is normally maintained at low expression level because of IFN-α inhibition. However, we know that irrespective of persistent immune and inflammatory response induced by HCV in vivo, HCV survives in the infected cell. This indicates that HCV develops strategies to bypass the immune response, i.e. release lncR 8 from the control of IFN-α. The innate immune response is insufficient to control viral replication. In the battle of HCV and host cells, increased levels of ISGs should be induced by the immune response against HCV. Most ISGs function by increasing the antiviral response or by inhibiting viral replication. Nevertheless, lncR 8 induced by HCV helps HCV replication by positively regulating its neighboring gene GPR55, which in turn negatively regulates ISGs, like ISG15, Mx1, and IFITM1, at early time points. By this mechanism, lncR 8 may contribute to the failure of interferon action and elimination of ongoing HCV infection. Despite of the upregulation of lncR 8 after HCV infection, the IFITM1 level was still increased at early times (Figure 7F), indicating an involvement of other regulation factors. Though further studies will be required to elucidate the underlying mechanisms, our study benefits a better understanding of lncRNAs in the HCV-host battle.
Supplementary Materials
The following are available online at https://0-www-mdpi-com.brum.beds.ac.uk/1999-4915/11/6/549/s1, Figure S1: Materials related to Figure 3A. Figure S2 (related to Figure 1C, Figure 2A, Figure 4B and Figure 5B). ISGs were upregulated after HCV transfection. (A) HCV NS3 level, (B) lncR 8, (C) lncR 8 neighboring genes ITM2C and GPR55, and (D) indicated ISGs in samples treated as described in Figure 1 but without miR-122 were measured 6 days after HCV transfection. qRT-PCR data was normalized to GAPDH. The data are shown as the mean ± SEM of at least three independent experiments. * p ≤ 0.05, ** p ≤ 0.01, *** p ≤ 0.001, and **** p ≤ 0.0001.
Author Contributions
Conceptualization, P.H., G.K.G., L.A.S., and M.N.; Methodology, P.H., J.W., and M.N.; Software, P.H. and J.W.; Validation, P.H.; Formal analysis, P.H.; Investigation, P.H.,J.W., G.K.G., and L.A.S; Resources, M.N; Data curation, P.H.; Writing—original draft preparation, P.H.; Writing—review and editing, P.H. and M.N.; Visualization, P.H.; Supervision, M.N.; Project administration, M.N.; Funding acquisition, J.W. and M.N.
Funding
This research was funded by a Land Hessen LOEWE grant (Medical RNomics) (P.H. and M.N.), Deutsche Forschungsgemeinschaft (DFG, German Research Foundation) – Project Number 197785619 – SFB 1021 (J.W., G.K.G., L.A.S., and M.N.), and ECCPS/DZL (J.W.).
Acknowledgments
We thank Ralf Bartenschlager (Heidelberg, Germany) for the Jc1 clone, Charles M. Rice (New York, USA) for Huh-7.5 cells, and Selena Guggenberger and Tim Schneider (Giessen, Germany) for experimental help.
Conflicts of Interest
The authors declare no conflict of interest.
References
- Nouroz, F.; Shaheen, S.; Mujtaba, G.; Noreen, S. An overview on hepatitis C virus genotypes and its control. Egypt. J. Med. Hum. Genet. 2015, 16, 291–298. [Google Scholar] [CrossRef] [Green Version]
- Choo, Q.-L.; Kuo, G.; Weiner, A.J.; Overby, L.R.; Bradley, D.W.; Houghton, M. Isolation of a cDNA Clone Derived from a Blood-Borne Non-A, Non-B Viral Hepatitis Genome. Science 1989, 244, 359–362. [Google Scholar] [CrossRef] [PubMed]
- Pezacki, J.P.; Singaravelu, R.; Lyn, R.K. Host-virus interactions during hepatitis C virus infection: A complex and dynamic molecular biosystem. Mol. Biosyst. 2010, 6, 1131–1142. [Google Scholar] [CrossRef] [PubMed]
- Barriocanal, M.; Fortes, P. Long Non-coding RNAs in Hepatitis C Virus-Infected Cells. Front. Microbiol. 2017, 8, 1833. [Google Scholar] [CrossRef] [PubMed]
- Lindenbach, B.D.; Rice, C.M. The ins and outs of hepatitis C virus entry and assembly. Nat. Rev. Microbiol. 2013, 11, 688–700. [Google Scholar] [CrossRef] [PubMed] [Green Version]
- Dubuisson, J.; Cosset, F.L. Virology and cell biology of the hepatitis C virus life cycle: An update. J. Hepatol. 2014, 61 (Suppl. 1), S3–S13. [Google Scholar] [CrossRef] [PubMed]
- Paul, D.; Madan, V.; Bartenschlager, R. Hepatitis C virus RNA replication and assembly: Living on the fat of the land. Cell Host Microbe 2014, 16, 569–579. [Google Scholar] [CrossRef] [PubMed]
- Appel, N.; Schaller, T.; Penin, F.; Bartenschlager, R. From structure to function: New insights into hepatitis C virus RNA replication. J. Biol. Chem. 2006, 281, 9833–9836. [Google Scholar] [CrossRef] [PubMed]
- Niepmann, M. Hepatitis C virus RNA translation. Curr. Top. Microbiol. Immunol. 2013, 369, 143–166. [Google Scholar] [CrossRef] [PubMed]
- Heim, M.H.; Thimme, R. Innate and adaptive immune responses in HCV infections. J. Hepatol. 2014, 61 (Suppl. 1), S14–S25. [Google Scholar] [CrossRef] [Green Version]
- Gokhale, N.S.; Vazquez, C.; Horner, S.M. Hepatitis C Virus. Strategies to Evade Antiviral Responses. Future Virol. 2014, 9, 1061–1075. [Google Scholar] [CrossRef] [PubMed]
- Sun, J.; Rajsbaum, R.; Yi, M. Immune and non-immune responses to hepatitis C virus infection. World J. Gastroenterol. 2015, 21, 10739–10748. [Google Scholar] [CrossRef]
- Barriocanal, M.; Carnero, E.; Segura, V.; Fortes, P. Long Non-Coding RNA BST2/BISPR is Induced by IFN and Regulates the Expression of the Antiviral Factor Tetherin. Front. Immunol. 2014, 5, 655. [Google Scholar] [CrossRef] [PubMed]
- Valadkhan, S.; Fortes, P. Regulation of the Interferon Response by lncRNAs in HCV Infection. Front. Microbiol. 2018, 9, 181. [Google Scholar] [CrossRef] [PubMed]
- Kambara, H.; Niazi, F.; Kostadinova, L.; Moonka, D.K.; Siegel, C.T.; Post, A.B.; Carnero, E.; Barriocanal, M.; Fortes, P.; Anthony, D.D.; et al. Negative regulation of the interferon response by an interferon-induced long non-coding RNA. Nucleic Acids Res. 2014, 42, 10668–10680. [Google Scholar] [CrossRef] [PubMed] [Green Version]
- Wong, M.T.; Chen, S.S. Emerging roles of interferon-stimulated genes in the innate immune response to hepatitis C virus infection. Cell. Mol. Immunol. 2016, 13, 11–35. [Google Scholar] [CrossRef]
- Sumpter, R., Jr.; Loo, Y.M.; Foy, E.; Li, K.; Yoneyama, M.; Fujita, T.; Lemon, S.M.; Gale, M., Jr. Regulating intracellular antiviral defense and permissiveness to hepatitis C virus RNA replication through a cellular RNA helicase, RIG-I. J. Virol. 2005, 79, 2689–2699. [Google Scholar] [CrossRef]
- Thimme, R.; Binder, M.; Bartenschlager, R. Failure of innate and adaptive immune responses in controlling hepatitis C virus infection. FEMS Microbiol. Rev. 2012, 36, 663–683. [Google Scholar] [CrossRef] [Green Version]
- Messina, J.P.; Humphreys, I.; Flaxman, A.; Brown, A.; Cooke, G.S.; Pybus, O.G.; Barnes, E. Global Distribution and Prevalence of Hepatitis C Virus Genotypes. Hepatology 2015, 61, 77–87. [Google Scholar] [CrossRef]
- Ramakrishnaiah, V.; Thumann, C.; Fofana, I.; Habersetzer, F.; Pan, Q.; de Ruiter, P.E.; Willemsen, R.; Demmers, J.A.; Stalin Raj, V.; Jenster, G.; et al. Exosome-mediated transmission of hepatitis C virus between human hepatoma Huh7.5 cells. Proc. Natl. Acad. Sci. USA 2013, 110, 13109–13113. [Google Scholar] [CrossRef] [Green Version]
- Wang, P.; Xu, J.F.; Wang, Y.J.; Cao, X.T. An interferon-independent lncRNA promotes viral replication by modulating cellular metabolism. Science 2017, 358, 1051–1055. [Google Scholar] [CrossRef] [PubMed] [Green Version]
- Qian, X.; Xu, C.; Zhao, P.; Qi, Z. Long non-coding RNA GAS5 inhibited hepatitis C virus replication by binding viral NS3 protein. Virology 2016, 492, 155–165. [Google Scholar] [CrossRef] [PubMed]
- Yu, F.; Zheng, J.; Mao, Y.; Dong, P.; Lu, Z.; Li, G.; Guo, C.; Liu, Z.; Fan, X. Long Non-coding RNA Growth Arrest-specific Transcript 5 (GAS5) Inhibits Liver Fibrogenesis through a Mechanism of Competing Endogenous RNA. J. Biol. Chem. 2015, 290, 28286–28298. [Google Scholar] [CrossRef] [Green Version]
- Xie, Q.; Chen, S.; Tian, R.; Huang, X.; Deng, R.; Xue, B.; Qin, Y.; Xu, Y.; Wang, J.; Guo, M.; et al. Long Noncoding RNA ITPRIP-1 Positively Regulates the Innate Immune Response through Promotion of Oligomerization and Activation of MDA5. J. Virol. 2018, 92. [Google Scholar] [CrossRef] [PubMed]
- Nishitsujia, H.; Ujinoa, S.; Yoshioa, S.; Sugiyamaa, M.; Mizokamia, M.; Kantoa, T.; Shimotohnoa, K. Long noncoding RNA #32 contributes to antiviral responses by controlling interferon-stimulated gene expression. Proc. Natl. Acad. Sci. USA 2016, 113, 10388–10393. [Google Scholar] [CrossRef] [Green Version]
- Huang, J.; Li, Y.; Lu, Z.; Che, Y.; Sun, S.; Mao, S.; Lei, Y.; Zang, R.; Li, N.; Sun, N.; et al. Long non-coding RNA GAS5 is induced by interferons and plays an antitumor role in esophageal squamous cell carcinoma. Cancer Med. 2018. [Google Scholar] [CrossRef] [PubMed]
- Sur, S.; Sasaki, R.; Devhare, P.; Steele, R.; Ray, R.; Ray, R.B. Association between microRNA-373 and long non-coding RNA NORAD in hepatitis C virus infected hepatocytes impairs Wee1 expression for growth promotion. J. Virol. 2018. [Google Scholar] [CrossRef] [PubMed]
- Pietschmann, T.; Kaul, A.; Koutsoudakis, G.; Shavinskaya, A.; Kallis, S.; Steinmann, E.; Abid, K.; Negro, F.; Dreux, M.; Cosset, F.L.; et al. Construction and characterization of infectious intragenotypic and intergenotypic hepatitis C virus chimeras. Proc. Natl. Acad. Sci. USA 2006, 103, 7408–7413. [Google Scholar] [CrossRef] [PubMed] [Green Version]
- Carnero, E.; Barriocanal, M.; Prior, C.; Pablo Unfried, J.; Segura, V.; Guruceaga, E.; Enguita, M.; Smerdou, C.; Gastaminza, P.; Fortes, P. Long noncoding RNA EGOT negatively affects the antiviral response and favors HCV replication. EMBO Rep. 2016, 17, 1013–1028. [Google Scholar] [CrossRef]
- Wang, N.; Wang, Q.; Shen, D.; Sun, X.; Cao, X.; Wu, D. Downregulation of microRNA-122 promotes proliferation, migration, and invasion of human hepatocellular carcinoma cells by activating epithelial-mesenchymal transition. Oncotarg. Ther. 2016, 9, 2035–2047. [Google Scholar] [CrossRef]
- R: A Language and Environment for Statistical Computing. Available online: http://www.R-project.org (accessed on 1 March 2016).
- Ritchie, M.E.; Phipson, B.; Wu, D.; Hu, Y.; Law, C.W.; Shi, W.; Smyth, G.K. limma powers differential expression analyses for RNA-sequencing and microarray studies. Nucleic Acids Res. 2015, 43, e47. [Google Scholar] [CrossRef] [PubMed]
- Gentleman, R.C.; Carey, V.J.; Bates, D.M.; Bolstad, B.; Dettling, M.; Dudoit, S.; Ellis, B.; Gautier, L.; Ge, Y.; Gentry, J.; et al. Bioconductor: Open software development for computational biology and bioinformatics. Genome Biol. 2004, 5, R80. [Google Scholar] [CrossRef] [PubMed]
- Silver, J.D.; Ritchie, M.E.; Smyth, G.K. Microarray background correction: Maximum likelihood estimation for the normal-exponential convolution. Biostatistics 2009, 10, 352–363. [Google Scholar] [CrossRef] [PubMed]
- Schmittgen, T.D.; Livak, K.J. Analyzing real-time PCR data by the comparative CT method. Nat. Protoc. 2008, 3, 1101–1108. [Google Scholar] [CrossRef] [PubMed]
- Volders, P.J.; Verheggen, K.; Menschaert, G.; Vandepoele, K.; Martens, L.; Vandesompele, J.; Mestdagh, P. An update on LNCipedia: A database for annotated human lncRNA sequences. Nucleic Acids Res. 2015, 43, 4363–4364. [Google Scholar] [CrossRef] [PubMed]
- Niepmann, M.; Shalamova, L.A.; Gerresheim, G.K.; Rossbach, O. Signals Involved in Regulation of Hepatitis C Virus RNA Genome Translation and Replication. Front. Microbiol. 2018, 9, 395. [Google Scholar] [CrossRef] [PubMed]
- Jopling, C.L.; Yi, M.K.; Lancaster, A.M.; Lemon, S.M.; Sarnow, P. Modulation of Hepatitis C Virus RNA Abundance by a Liver-Specific MicroRNA. Science 2005, 309, 1577–1581. [Google Scholar] [CrossRef] [PubMed] [Green Version]
- Henke, J.I.; Goergen, D.; Zheng, J.; Song, Y.; Schuettler, C.G.; Fehr, C.; Juenemann, C.; Niepmann, M. microRNA-122 stimulates translation of hepatitis C virus. EMBO 2008, 27, 3300–3310. [Google Scholar] [CrossRef] [PubMed]
- Chang, J.; Nicolas, E.; Marks, D.; Sander, C.; Lerro, A.; Buendia, M.A.; Xu, C.; Mason, W.S.; Moloshok, T.; Bort, R.; et al. miR-122, a Mammalian Liver-Specific microRNA, is Processed from hcr mRNA and MayDownregulate the High Affinity Cationic Amino Acid Transporter CAT-1. RNA Biol. 2004, 1, 106–113. [Google Scholar] [CrossRef] [PubMed] [Green Version]
- Zhang, J.; Fan, D.; Jian, Z.; Chen, G.G.; Lai, P.B. Cancer Specific Long Noncoding RNAs Show Differential Expression Patterns and Competing Endogenous RNA Potential in Hepatocellular Carcinoma. PLoS ONE 2015, 10, e0141042. [Google Scholar] [CrossRef] [PubMed]
- Morlando, M.; Ballarino, M.; Fatica, A. Long Non-Coding RNAs: New Players in Hematopoiesis and Leukemia. Front. Med. 2015, 2, 23. [Google Scholar] [CrossRef] [PubMed]
- Pessa, H.K.; Will, C.L.; Meng, X.; Schneider, C.; Watkins, N.J.; Perala, N.; Nymark, M.; Turunen, J.J.; Luhrmann, R.; Frilander, M.J. Minor spliceosome components are predominantly localized in the nucleus. Proc. Natl. Acad. Sci. USA 2008, 105, 8655–8660. [Google Scholar] [CrossRef] [PubMed] [Green Version]
- Lennox, K.A.; Behlke, M.A. Mini-review:current strategies to knockdown long non-coding RNAs. J. Rare Dis. Res. Treat. 2016, 1, 66–70. [Google Scholar]
- Chan, J.H.; Lim, S.H.; Wong, W.F. Antisense oligonucleotides from design to therapeutic application. Clin. Exp. Pharmacol. Physiol. 2006, 33, 533–540. [Google Scholar] [CrossRef]
- Multiplex qPCR—How to Get Started. Available online: https://www.idtdna.com/pages/education/decoded/article/multiplex-qpcr-how-to-get-started (accessed on 4 January 2018).
- Kopp, F.; Mendell, J.T. Functional Classification and Experimental Dissection of Long Noncoding RNAs. Cell 2018, 172, 393–407. [Google Scholar] [CrossRef] [Green Version]
- Hu, J.; Gao, D.Z. Distinction immune genes of hepatitis-induced heptatocellular carcinoma. Bioinformatics 2012, 28, 3191–3194. [Google Scholar] [CrossRef] [Green Version]
- Ouyang, J.; Zhu, X.; Chen, Y.; Wei, H.; Chen, Q.; Chi, X.; Qi, B.; Zhang, L.; Zhao, Y.; Gao, G.F.; et al. NRAV, a long noncoding RNA, modulates antiviral responses through suppression of interferon-stimulated gene transcription. Cell Host Microbe 2014, 16, 616–626. [Google Scholar] [CrossRef]
- Cao, X.; Ding, Q.; Lu, J.; Tao, W.; Huang, B.; Zhao, Y.; Niu, J.; Liu, Y.J.; Zhong, J. MDA5 plays a critical role in interferon response during hepatitis C virus infection. J. Hepatol. 2015, 62, 771–778. [Google Scholar] [CrossRef]
- Liu, J.; Wang, Z.; Tang, J.; Tang, R.; Shan, X.; Zhang, W.; Chen, Q.; Zhou, F.; Chen, K.; Huang, A.; et al. Hepatitis C virus core protein activates Wnt/beta-catenin signaling through multiple regulation of upstream molecules in the SMMC-7721 cell line. Arch. Virol. 2011, 156, 1013–1023. [Google Scholar] [CrossRef]
- Kukla, M.; Berdowska, A.; Stygar, D.; Gabriel, A.; Mazur, W.; Logiewa-Bazger, B.; Sobala-Szczygiel, B.; Buldak, R.J.; Rokitka, M.; Zajecki, W.; et al. Serum FGF21 and RBP4 levels in patients with chronic hepatitis C. Scand. J. Gastroenterol. 2012, 47, 1037–1047. [Google Scholar] [CrossRef]
- Ahmad, W.; Ijaz, B.; Hassan, S. Gene expression profiling of HCV genotype 3a initial liver fibrosis and cirrhosis patients using microarray. J. Transl. Med. 2012, 10, 41. [Google Scholar] [CrossRef] [PubMed]
- Berger, K.L.; Cooper, J.D.; Heaton, N.S.; Yoon, R.; Oakland, T.E.; Jordan, T.X.; Mateu, G.; Grakoui, A.; Randall, G. Roles for endocytic trafficking and phosphatidylinositol 4-kinase III alpha in hepatitis C virus replication. Proc. Natl. Acad. Sci. USA 2009, 106, 7577–7582. [Google Scholar] [CrossRef] [PubMed] [Green Version]
- Okabe, H.; Delgado, E.; Lee, J.M.; Yang, J.; Kinoshita, H.; Hayashi, H.; Tsung, A.; Behari, J.; Beppu, T.; Baba, H.; et al. Role of leukocyte cell-derived chemotaxin 2 as a biomarker in hepatocellular carcinoma. PLoS ONE 2014, 9, e98817. [Google Scholar] [CrossRef] [PubMed]
- Ovejero, C.; Cavard, C.; Perianin, A.; Hakvoort, T.; Vermeulen, J.; Godard, C.; Fabre, M.; Chafey, P.; Suzuki, K.; Romagnolo, B.; et al. Identification of the leukocyte cell-derived chemotaxin 2 as a direct target gene of beta-catenin in the liver. Hepatology 2004, 40, 167–176. [Google Scholar] [CrossRef] [PubMed]
- Jaksik, R.; Iwanaszko, M.; Rzeszowska-Wolny, J.; Kimmel, M. Microarray experiments and factors which affect their reliability. Biol. Direct 2015, 10, 46. [Google Scholar] [CrossRef] [PubMed]
- Stretch, C.; Khan, S.; Asgarian, N.; Eisner, R.; Vaisipour, S.; Damaraju, S.; Graham, K.; Bathe, O.F.; Steed, H.; Greiner, R.; et al. Effects of sample size on differential gene expression, rank order and prediction accuracy of a gene signature. PLoS ONE 2013, 8, e65380. [Google Scholar] [CrossRef] [PubMed]
- Chen, J.J.; Hsueh, H.M.; Delongchamp, R.R.; Lin, C.J.; Tsai, C.A. Reproducibility of microarray data: A further analysis of microarray quality control (MAQC) data. BMC Bioinform. 2007, 8, 412. [Google Scholar] [CrossRef]
- Gerresheim, G.K.; Bathke, J.; Michel, A.M.; Andreev, D.E.; Shalamova, L.A.; Rossbach, O.; Hu, P.; Glebe, D.; Fricke, M.; Marz, M.; et al. Cellular Gene Expression during Hepatitis C Virus Replication as Revealed by Ribosome Profiling. Int. J. Mol. Sci. 2019, 20, 1321. [Google Scholar] [CrossRef]
- Durinck, K.; Wallaert, A.; Van de Walle, I.; Van Loocke, W.; Volders, P.J.; Vanhauwaert, S.; Geerdens, E.; Benoit, Y.; Van Roy, N.; Poppe, B.; et al. The Notch driven long non-coding RNA repertoire in T-cell acute lymphoblastic leukemia. Haematologica 2014, 99, 1808–1816. [Google Scholar] [CrossRef] [Green Version]
- Iwai, A.; Takegami, T.; Shiozaki, T.; Miyazaki, T. Hepatitis C virus NS3 protein can activate the Notch-signaling pathway through binding to a transcription factor, SRCAP. PLoS ONE 2011, 6, e20718. [Google Scholar] [CrossRef]
- Wienert, B.; Shin, J.; Zelin, E.; Pestal, K.; Corn, J.E. In vitro-transcribed guide RNAs trigger an innate immune response via the RIG-I pathway. PLoS Biol. 2018, 16, e2005840. [Google Scholar] [CrossRef] [PubMed]
- Loo, Y.M.; Fornek, J.; Crochet, N.; Bajwa, G.; Perwitasari, O.; Martinez-Sobrido, L.; Akira, S.; Gill, M.A.; Garcia-Sastre, A.; Katze, M.G.; et al. Distinct RIG-I and MDA5 signaling by RNA viruses in innate immunity. J. Virol. 2008, 82, 335–345. [Google Scholar] [CrossRef]
- Zhou, J.; Burkovskiy, I.; Yang, H.; Sardinha, J.; Lehmann, C. CB2 and GPR55 Receptors as Therapeutic Targets for Systemic Immune Dysregulation. Front. Pharmacol. 2016, 7, 264. [Google Scholar] [CrossRef]
- Chiurchiu, V.; Lanuti, M.; De Bardi, M.; Battistini, L.; Maccarrone, M. The differential characterization of GPR55 receptor in human peripheral blood reveals a distinctive expression in monocytes and NK cells and a proinflammatory role in these innate cells. Int. Immunol. 2015, 27, 153–160. [Google Scholar] [CrossRef] [PubMed]
- Yang, H.; Zhou, J.; Lehmann, C. GPR55—A putative “type 3” cannabinoid receptor in inflammation. J. Basic Clin. Physiol. Pharmacol. 2016, 27, 297–302. [Google Scholar] [CrossRef]
- Pesce, M.; D’Alessandro, A.; Borrelli, O.; Gigli, S.; Seguella, L.; Cuomo, R.; Esposito, G.; Sarnelli, G. Endocannabinoid-related compounds in gastrointestinal diseases. J. Cell. Mol. Med. 2018, 22, 706–715. [Google Scholar] [CrossRef] [PubMed]
- Patsenker, E.; Sachse, P.; Chicca, A.; Gachet, M.S.; Schneider, V.; Mattsson, J.; Lanz, C.; Worni, M.; de Gottardi, A.; Semmo, M.; et al. Elevated levels of endocannabinoids in chronic hepatitis C may modulate cellular immune response and hepatic stellate cell activation. Int. J. Mol. Sci. 2015, 16, 7057–7076. [Google Scholar] [CrossRef]
Figure 1.
Transcriptome analysis of HCV-deregulated genes in Huh-7.5 cells. HCV NS3 protein level was detected by immunofluorescence (A) and western blotting (B) 6 days after transfection of HCV full length RNA and treatment with miR-122 duplex or miR-122 as described (Section 2.5). Treatment with anti-miR-122 LNA mixmer alone or with HCV was also performed. qRT-PCR was performed to check the HCV RNA targeting the NS3 coding region (C). GAPDH was used as a reference gene for normalization. * p < 0.05. Total RNA was isolated from Huh-7.5 cells with above treatments in two independent experiments. These RNAs were used for microarray experiments. Comparison of expression levels of sequences from HCV infected cells to uninfected cells was carried out. The volcano plot shows the results for all genes (D). Deregulated lncRNAs (E) and protein-coding genes (F) with fold change > 4 and p ˂ 0.01 (log fold change > 2, log10P value > 2) are shown in the heatmap. Z value was calculated. The color scale is shown at the bottom. Information about lncRNAs is listed in Table 3. The bubble plot shows enriched KEGG pathway annotation of differentially expressed genes (G).

Figure 2.
Four selected lncRNA candidates are upregulated by HCV. (A) The differential expression of five selected lncRNAs was confirmed by qRT-PCR 6 days after HCV transfection. GAS5 was used as a positive control. Data were normalized to GAPDH. Fold changes of lncRNA expression comparing HCV-treated cells to control cells are indicated at the top of each bar when statistically significant. Experiments were repeated a minimum of three times, with at least two replicates each time, and are represented as mean ± SEM. * p ≤ 0.05, ** p ≤ 0.01, and *** p ≤ 0.001. (B) The subcellular localization of lncR 3, lncR 7-2, lncR 8, and lncR 10 was measured by qRT–PCR after cell fractionation. RNA was collected from untreated cells, miR-122 treated, and miR-122 plus HCV RNA treated Huh-7.5 cells. GAPDH was used as cytoplasmic control. U6 and U99 were used as nuclear controls. Percentage of nuclear and cytoplasmic RNA levels were calculated depending on 2−∆Ct, where ∆Ct = Ct of the gene in nucleus - Ct in cytoplasm. The graph shows the average of at least three independent experiments, and represents data as mean ± SEM.

Figure 3.
Suppression of lncR 8 inhibits HCV replication. (A)The efficiency of GmRs suppressing lncRs 3, 7-2, 8, and 10 was determined by qRT-PCR in Huh-7.5 cells. One day prior to HCV treatment, GmRs targeting lncRNA candidates and Neg. ctr.GmR were transfected in Huh-7.5 cells. Cells were collected at 48 h post HCV transfection. qRT-PCR data of targeted genes was normalized to GAPDH. The data are shown as the mean ± SEM of at least three independent experiments. * p≤ 0.05, ** p ≤ 0.01, *** p ≤ 0.001, and **** p ≤ 0.0001.HCV RNA and protein level after GmR treatment were detected by qRT-PCR (B) and western blotting (C). HCV RNA level after different concentration of lncR 8-GmR treatment was detected by qRT-PCR (D). qRT-PCR data of HCV RNA in (B) was normalized to GAPDH. Another housekeeping gene β-actin was used as a negative control. Altered HCV level with significance are marked with numbers at the top of the bar. The numbers indicate fold changes of HCV RNA expression after GmRs treatment, where positive numbers mean upregulation, negative numbers mean downregulation. The upper panel in (C) is representative western blot of HCV NS3 protein. The lower panel is the quantification of protein bands from western blot was performed by using Image J (NIH). IntDen ratio of each NS3 band relative to each GAPDH band was presented. The data are shown as the mean ± SEM of at least three independent experiments.

Figure 4.
LncR 8 positively regulates neighboring gene GPR55. (A) Genomic location of lncR 8 and the relationship with the genes encoding ITM2C (Integral Membrane Protein 2C) and GPR55 (G protein-coupled receptor 55). (B) ITM2C and GPR55 expression in HCV-transfected samples and controls was measured 6 days after transfection and compared. Cells were treated as described in Figure 1. qRT-PCR data was normalized to GAPDH. The data are shown as the mean ± SEM of at least three independent experiments. *** p ≤ 0.001, and **** p ≤ 0.0001. Huh-7.5 cells were treated with Neg. ctr. GmR and lncR8-GmRs one day prior to HCV transfection. Cells were collected at indicated time points post HCV transfection. (C) ITM2C and GPR55 expression level at 2 days after lncR 8-GmRs and HCV transfection. qRT-PCR data was normalized to GAPDH. The knockdown of lncR 8 (D) and the effect on neighboring gene GPR55 (E) was examined at these early time points by qRT-PCR. To illustrate the differences in basal expression levels, the values are shown relative to GAPDH, expressed as 2−ΔCt. The data are shown as the mean ± SEM of at least three independent experiments. * p ≤ 0.05, ** p ≤ 0.01, *** p ≤ 0.001, and **** p ≤ 0.0001.

Figure 5.
LncR 8 negatively regulates ISGs expression. (A) Indicated ISGs expression in samples treated as described in Figure 1 were measured 6 days after HCV transfection. qRT-PCR data was normalized to GAPDH. The data are shown as the mean ± SEM of at least three independent experiments. * p ≤ 0.05, ** p ≤ 0.01, *** p ≤ 0.001, and **** p ≤ 0.0001. (B) ISGs expression level at 48 h after GmRs and HCV transfection were measured. Cells were treated in the same condition as described in Figure 3A. qRT-PCR data was normalized to GAPDH. The data are shown as the mean ± SEM of at least three independent experiments.

Figure 6.
Regulation of ISGs by lncR 8 is earlier than regulation of HCV.ISGs expression level (A) and HCV level (B) at early time points (12 h and 24 h) were examined by qRT-PCR in the samples described in Figure 4. GAPDH was used to normalize. Negative control gene β-actin was not altered by lncR 8 knockdown (B). The data are shown as the mean ± SEM of at least three independent experiments. * p≤ 0.05, ** p ≤ 0.01, *** p ≤ 0.001, and **** p ≤ 0.0001.

Figure 7.
lncR 8 and IFITM1 are upregulated by HCV infection. The expression of HCV(A), lncR 8 (B), neighboring genes (C), MDA5 (D), and indicated IFNs (E) were confirmed by qRT-PCR at 2- or 6-days post HCV infection. NS3 level was also tested in cells infected with a replication defective mutant version of the HCV genome (NS5B replicase inactivating "GND" mutation). Expression of ISGs (F) was also detected at earlier time points post HCV infection. Data were normalized to GAPDH. Fold changes of mRNA expression comparing HCV infected cells to control cells are indicated at the top of each bar when statistically significant. Experiments were repeated a minimum of three times, with at least two replicates each time, and are represented as mean ± SEM. * p ≤ 0.05, ** p ≤ 0.01, *** p ≤ 0.001, and **** p ≤ 0.0001.

Figure 8.
Suppression of lncR 8 inhibits HCV infection and promotes ISGs expression in both Huh-7.5 and Huh-7 cells. (A)The efficiency of GmRs suppressing lncR 8 was determined by qRT-PCR in Huh-7.5 and Huh-7 cells. One day prior to HCV treatment, GmRs targeting lncRNA candidates and Neg. ctr. GmR were transfected in cells. Cells treated with mock ctr. (without GmRs) were also detected to show that no unspecific influence was induced by Neg. ctr. GmR on lncR 8. Cells were collected at 48 h post HCV infection. qRT-PCR data of targeted genes was normalized to GAPDH. The data are shown as the mean ± SEM of at least three independent experiments. * p ≤ 0.05, ** p ≤ 0.01, and *** p ≤ 0.001. HCV RNA and virus titer after GmR treatment were detected by qRT-PCR (B) and focus-forming units (FFU) assay (C). GPR55 (D), IFNs (E), and ISGs (G) expression were also detected. Basal relative expression level of ISGs expression in Huh-7.5 and Huh-7 cells was shown in (F). Altered mRNA expressions with significance are marked with numbers at the top of the bar. The numbers indicate fold changes of expression after GmRs treatment, where positive numbers mean upregulation, negative numbers mean downregulation.

Figure 9.
Suppression of lncR 8 promotes ISGs and inhibits GPR55 expression at early time. (A) The efficiency of GmRs suppressing lncR 8 was determined by qRT-PCR in Huh-7.5 cells. HCV RNA (B), GPR55 (C), indicated IFNs (D), and ISGs (E) after GmR treatment were detected by qRT-PCR. One day prior to HCV treatment, GmRs targeting lncRNA candidates and Neg. ctr. GmR were transfected in Huh-7.5 cells. Cells were collected at 12 h and 24 h post HCV infection. qRT-PCR data of targeted genes was normalized to GAPDH. The data are shown as the mean ± SEM of at least three independent experiments. * p ≤ 0.05, ** p ≤ 0.01, *** p ≤ 0.001, and **** p ≤ 0.0001. Altered mRNA level with significance are marked with numbers at the top of the bar. The numbers indicate fold changes of mRNA expression after GmRs treatment, where positive numbers mean upregulation, negative numbers mean downregulation.

Figure 10.
Suppression of GPR55 promotes several ISGs expression. Two GmRs targeting GPR55 and Neg. ctr.GmR were transfected in Huh-7.5 cells. Cells were collected at 48 h later and ISGs expression was measured by qRT-PCR. qRT-PCR data was normalized to GAPDH. The data are shown as the mean ± SEM of at least three independent experiments. * p ≤ 0.05 and ** p ≤ 0.01. Altered mRNA level with significance are marked with numbers at the top of the bar. The numbers indicate fold changes of mRNA expression after GmRs treatment.

Figure 11.
lncR 8 is efficiently induced by poly(I:C) treatment in Huh-7.5 cells but not in Huh-7 cells. Cells were treated with 5ug or 10 ug poly(I:C) (pIC) and collected after 8 h incubation. qRT-PCR data of targeting genes, including lncR 8, MDA5, IFN-β and ISGs, was normalized to GAPDH. The data are shown as the mean ± SEM of at least three independent experiments. * p ≤ 0.05, ** p ≤ 0.01, *** p ≤ 0.001, and **** p ≤ 0.0001. Altered mRNA level with significance are marked with numbers at the top of the bar. The numbers indicate fold changes of mRNA expression after treatment, where positive numbers mean upregulation, negative numbers mean downregulation.

Figure 12.
Knockdown of lncR 8 upregulates representative ISGs after poly(I:C) treatment. One day prior to poly(I:C) treatment, GmRs targeting lncR 8 and Neg. ctr. were transfected in Huh-7.5 cells. Cells were treated with 5ug poly(I:C) and collected after 8 h incubation. qRT-PCR data of ISGs was normalized to GAPDH. The data are shown as the mean ± SEM of at least three independent experiments. * p ≤ 0.05 and **p ≤ 0.01. Altered mRNA level with significance are marked with numbers at the top of the bar. The numbers indicate fold changes of mRNA expression after treatment, where positive numbers mean upregulation, negative numbers mean downregulation.

Figure 13.
IFN treatment depresses lncR 8 through JAK/STAT pathway. Cells were treated with either mock or IFN-α, and collected after 8 h incubation (A). For JAK/STAT inhibition, JAK/STAT inhibitor or mock was added 1 h before IFN treatment (B). qRT-PCR data of targeting genes was normalized to GAPDH. The data are shown as the mean ± SEM of at least three independent experiments. * p ≤ 0.05, ** p ≤ 0.01, *** p ≤ 0.001, and **** p ≤ 0.0001. Altered mRNA level with significance are marked with numbers at the top of the bar. The numbers indicate fold changes of mRNA expression after treatment, where positive numbers mean upregulation, negative numbers mean downregulation.

Figure 14.
A model depicts the role of lncR 8 and GPR55 during HCV replication. Indicated is that HCV induces lncR 8/lnc-ITM2C-1 expression, while lncR 8 favors HCV replication by regulating its neighboring gene GPR55, which in turn negatively regulates expression of ISGs.
Figure 14.
A model depicts the role of lncR 8 and GPR55 during HCV replication. Indicated is that HCV induces lncR 8/lnc-ITM2C-1 expression, while lncR 8 favors HCV replication by regulating its neighboring gene GPR55, which in turn negatively regulates expression of ISGs.


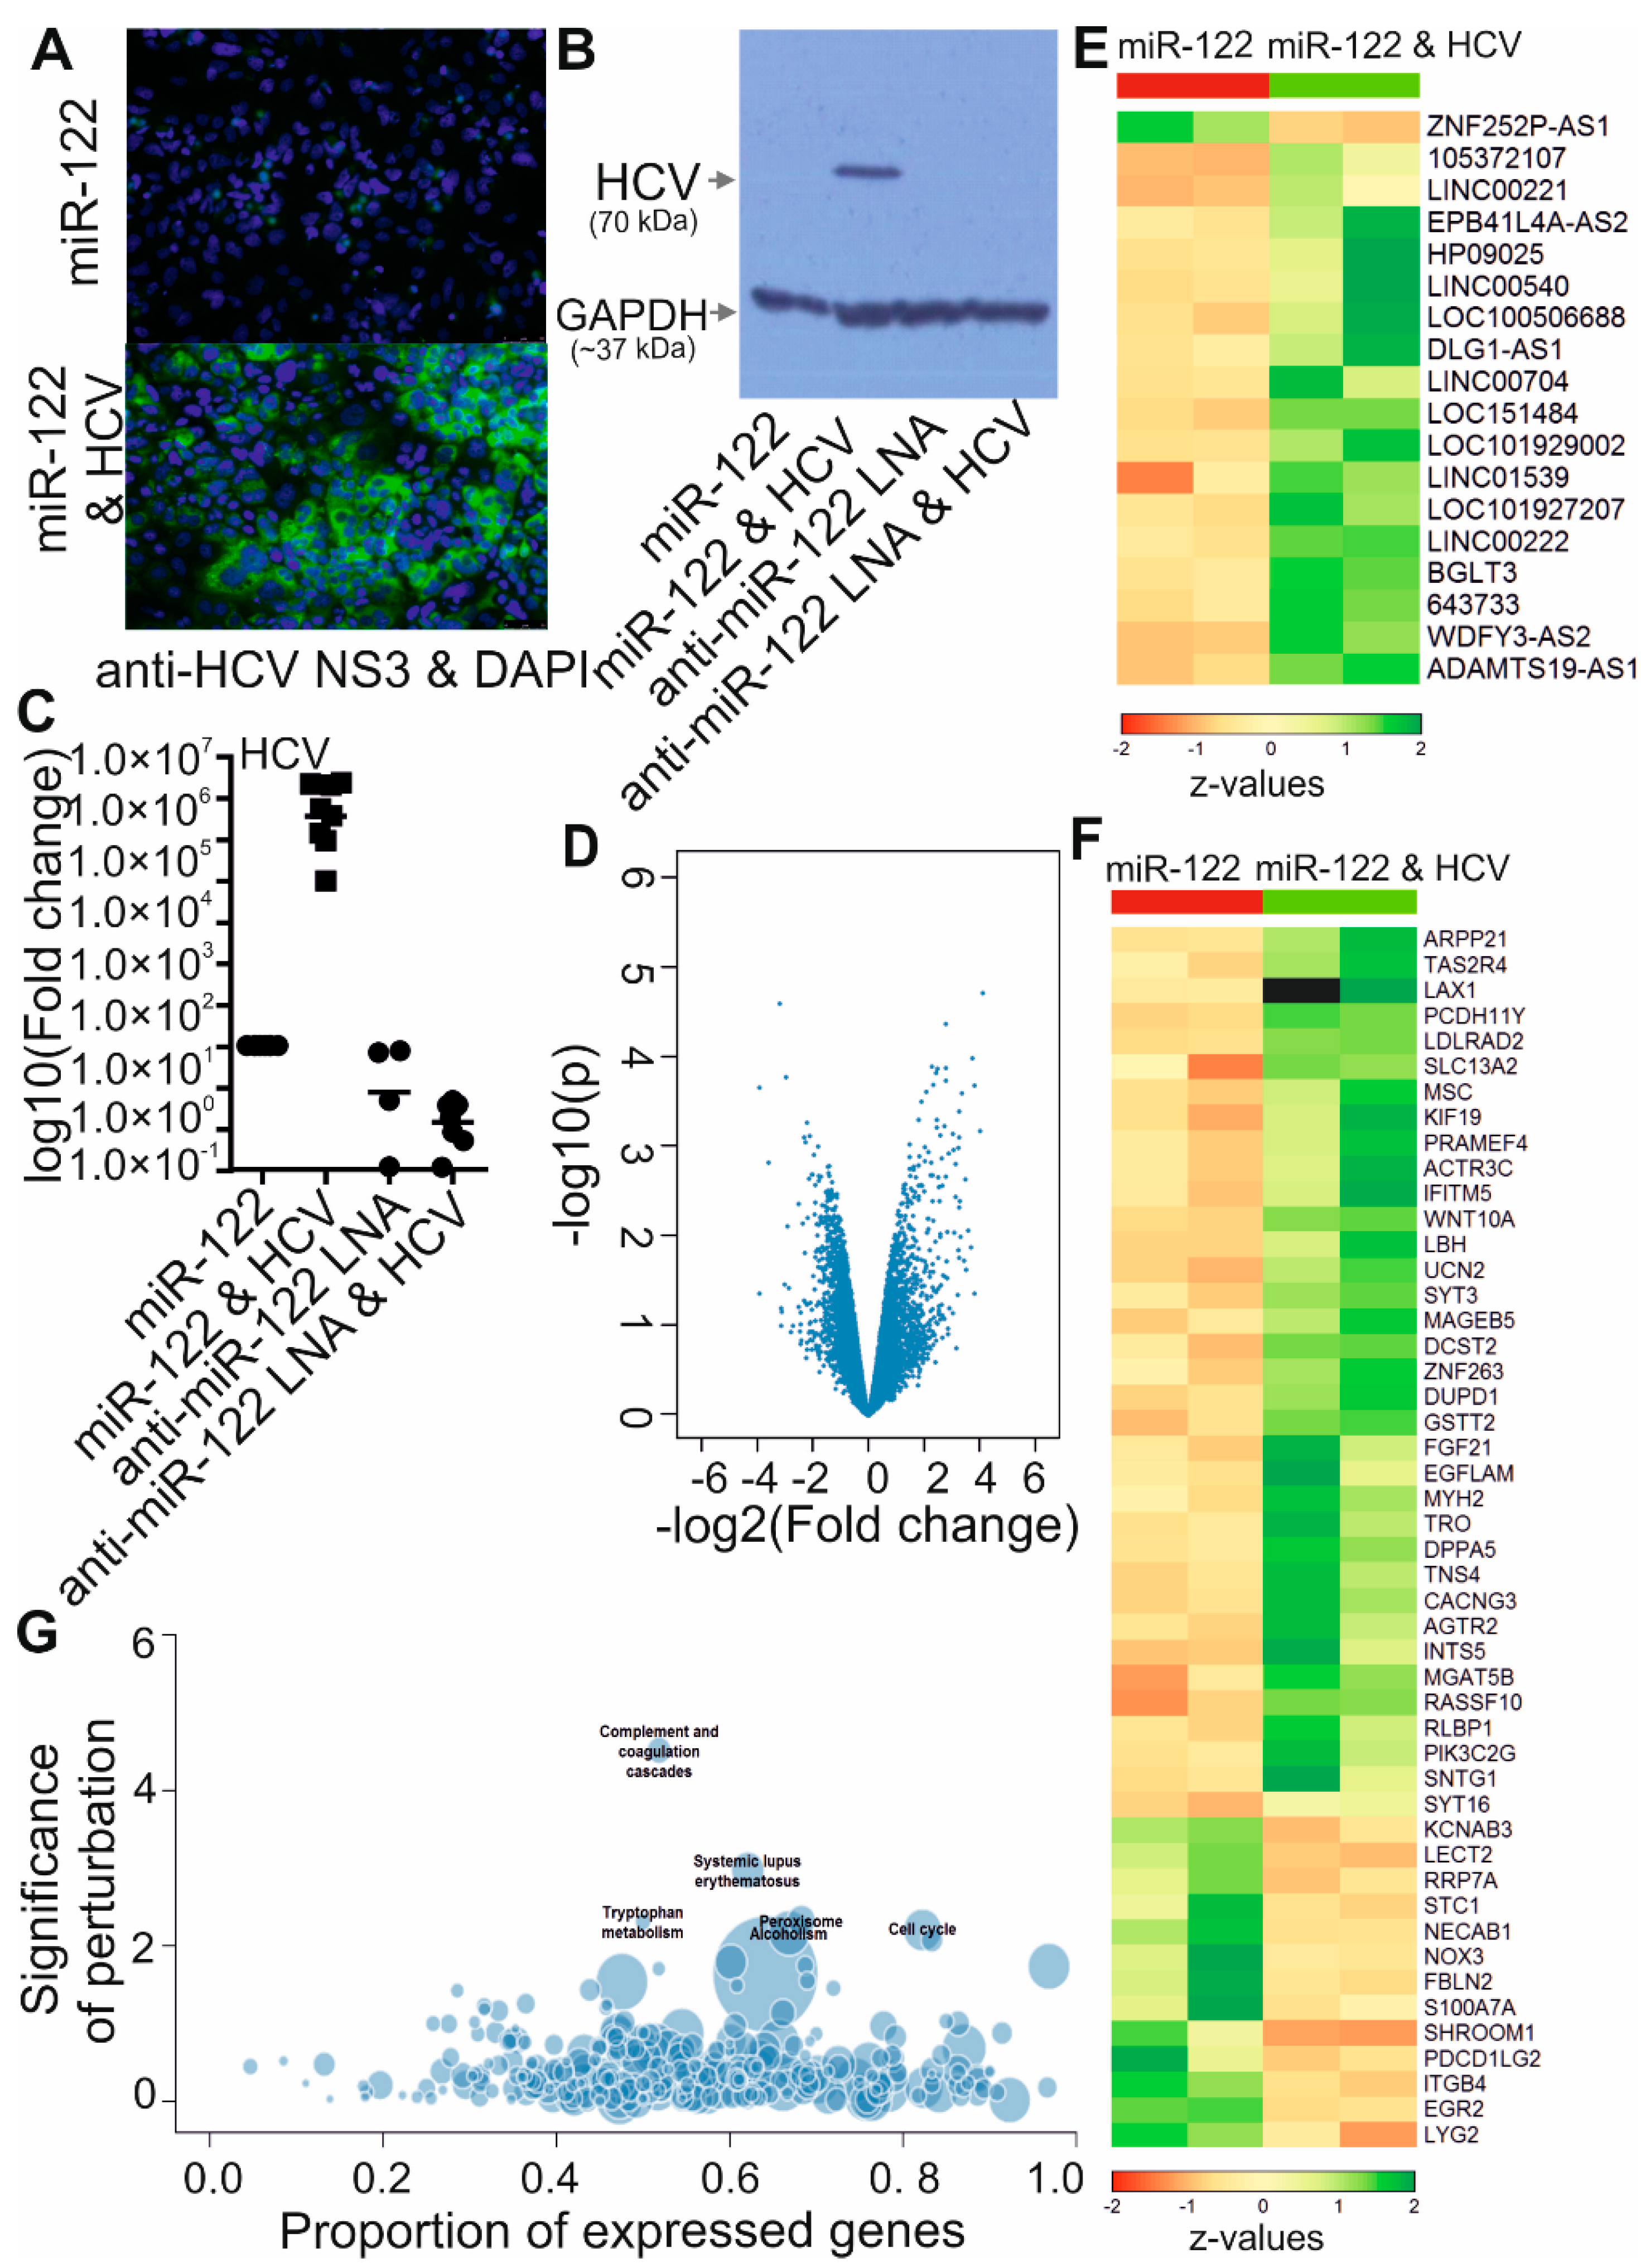
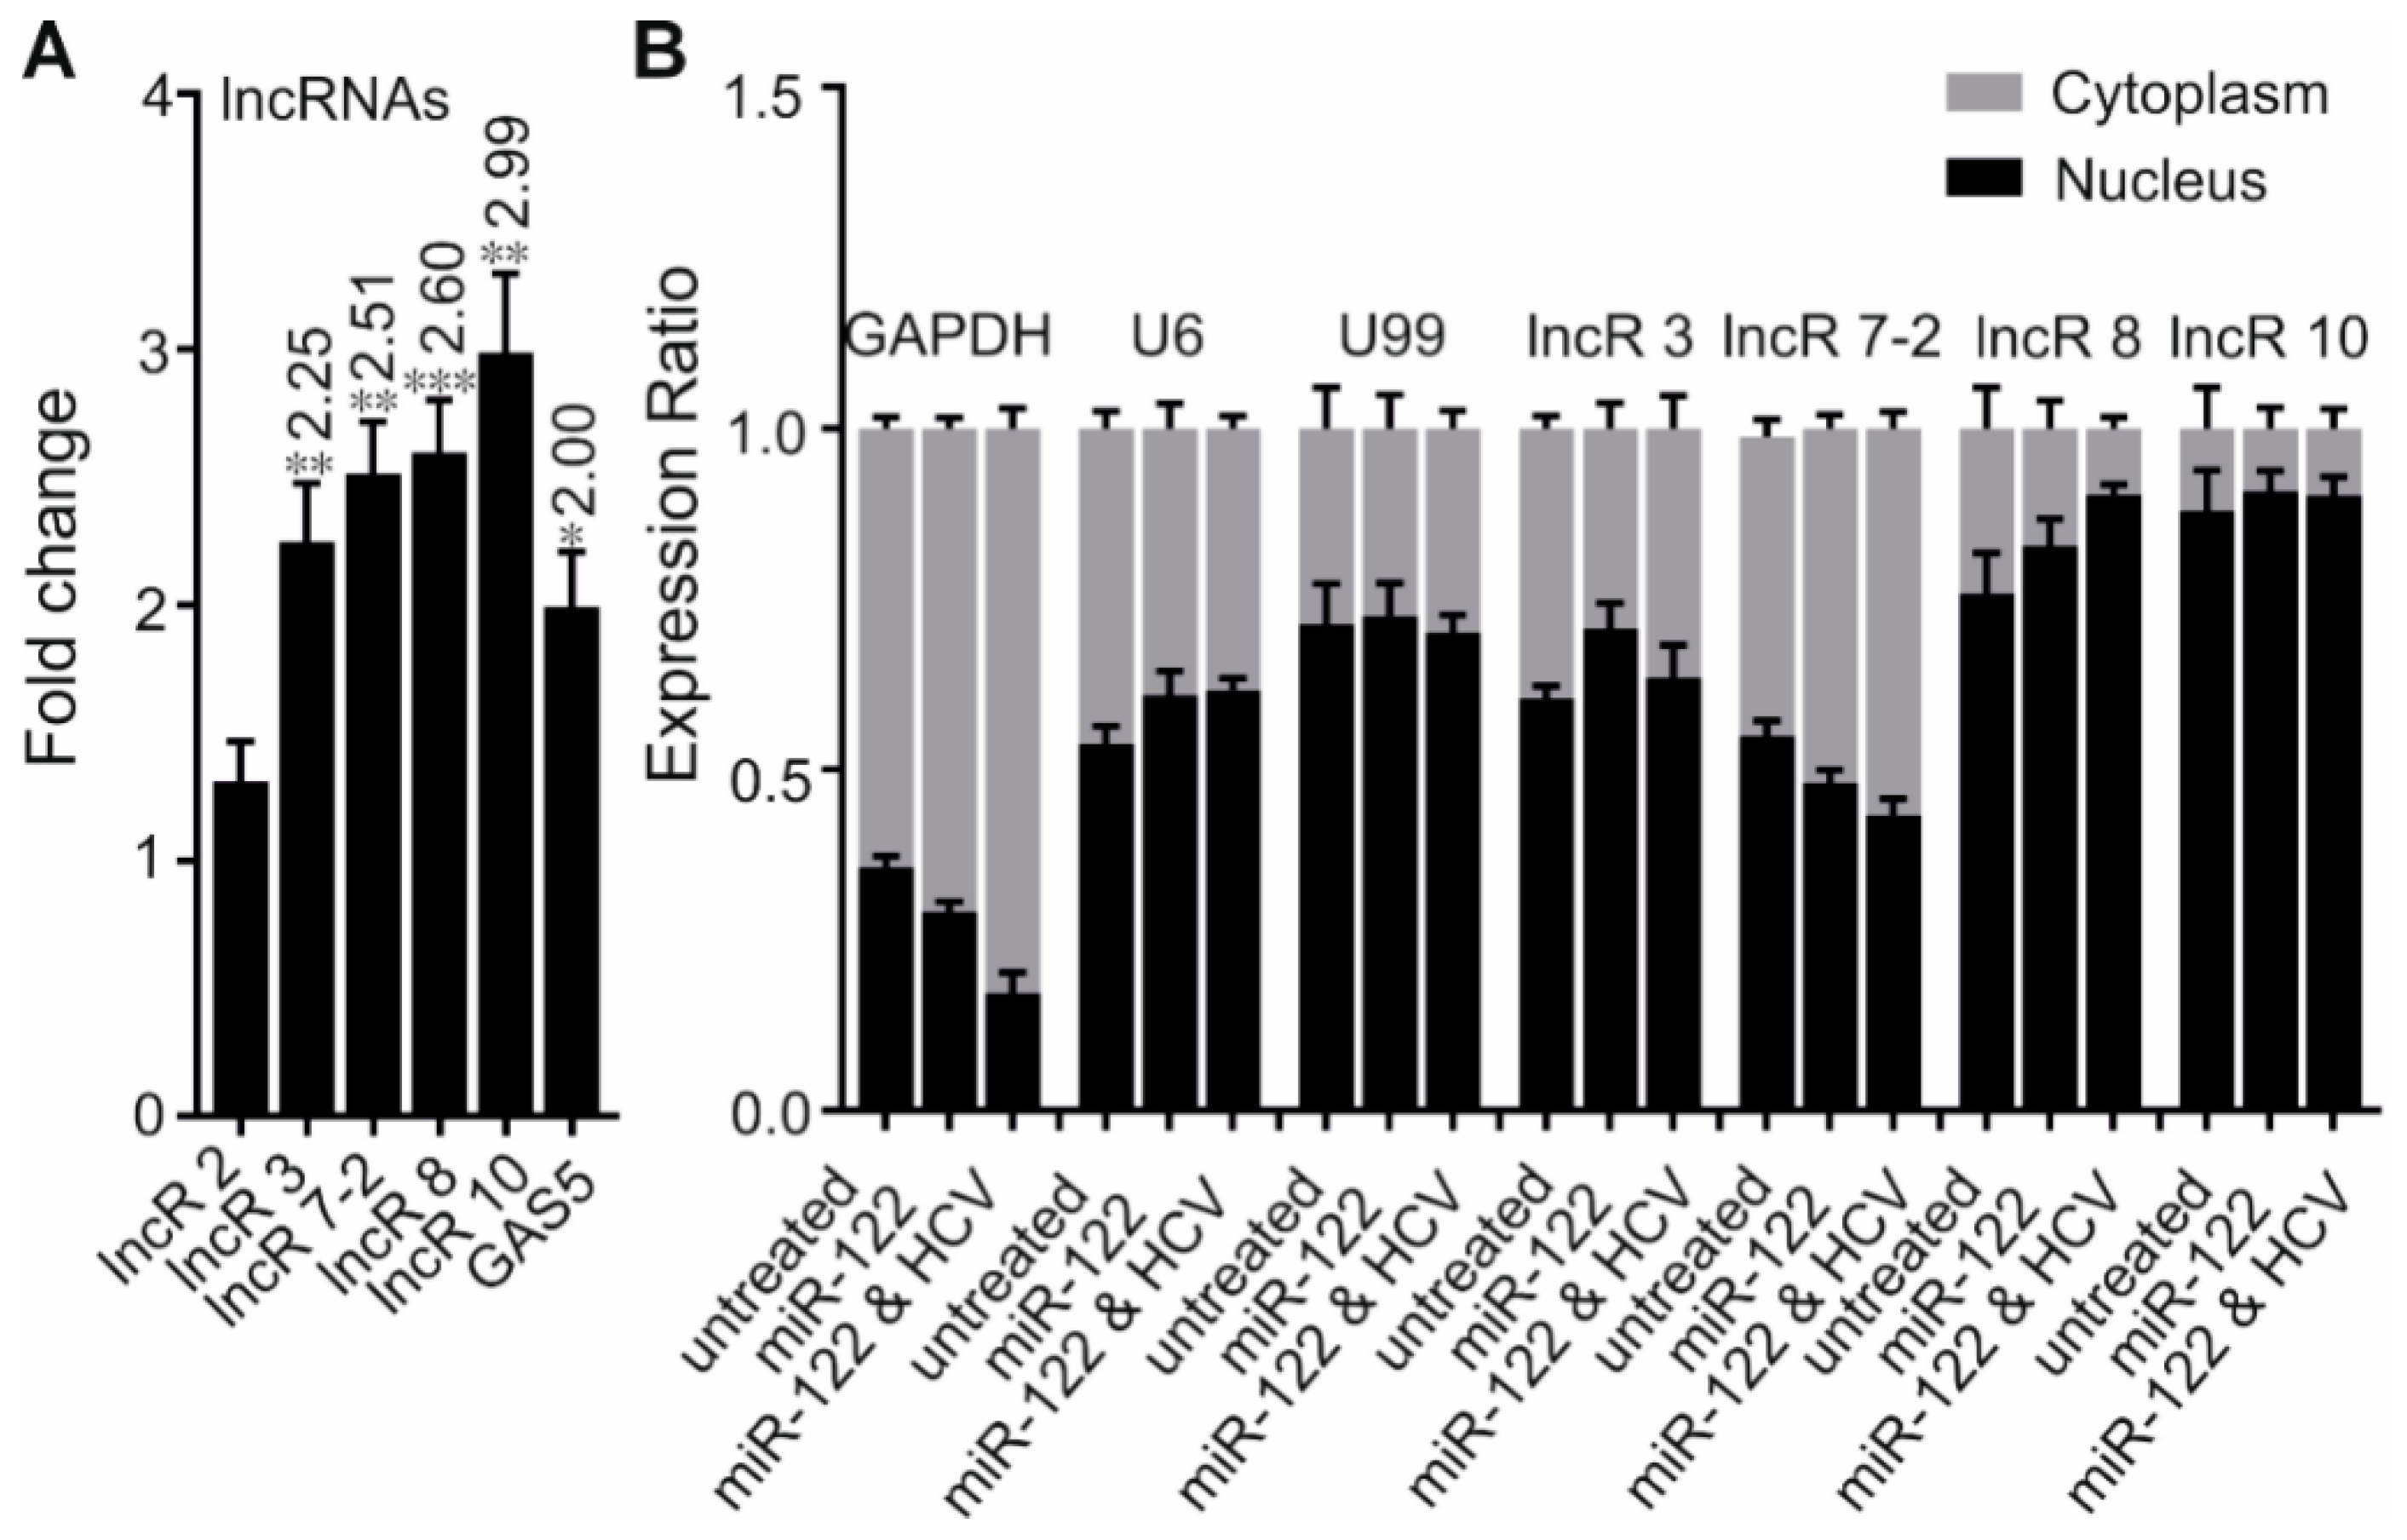
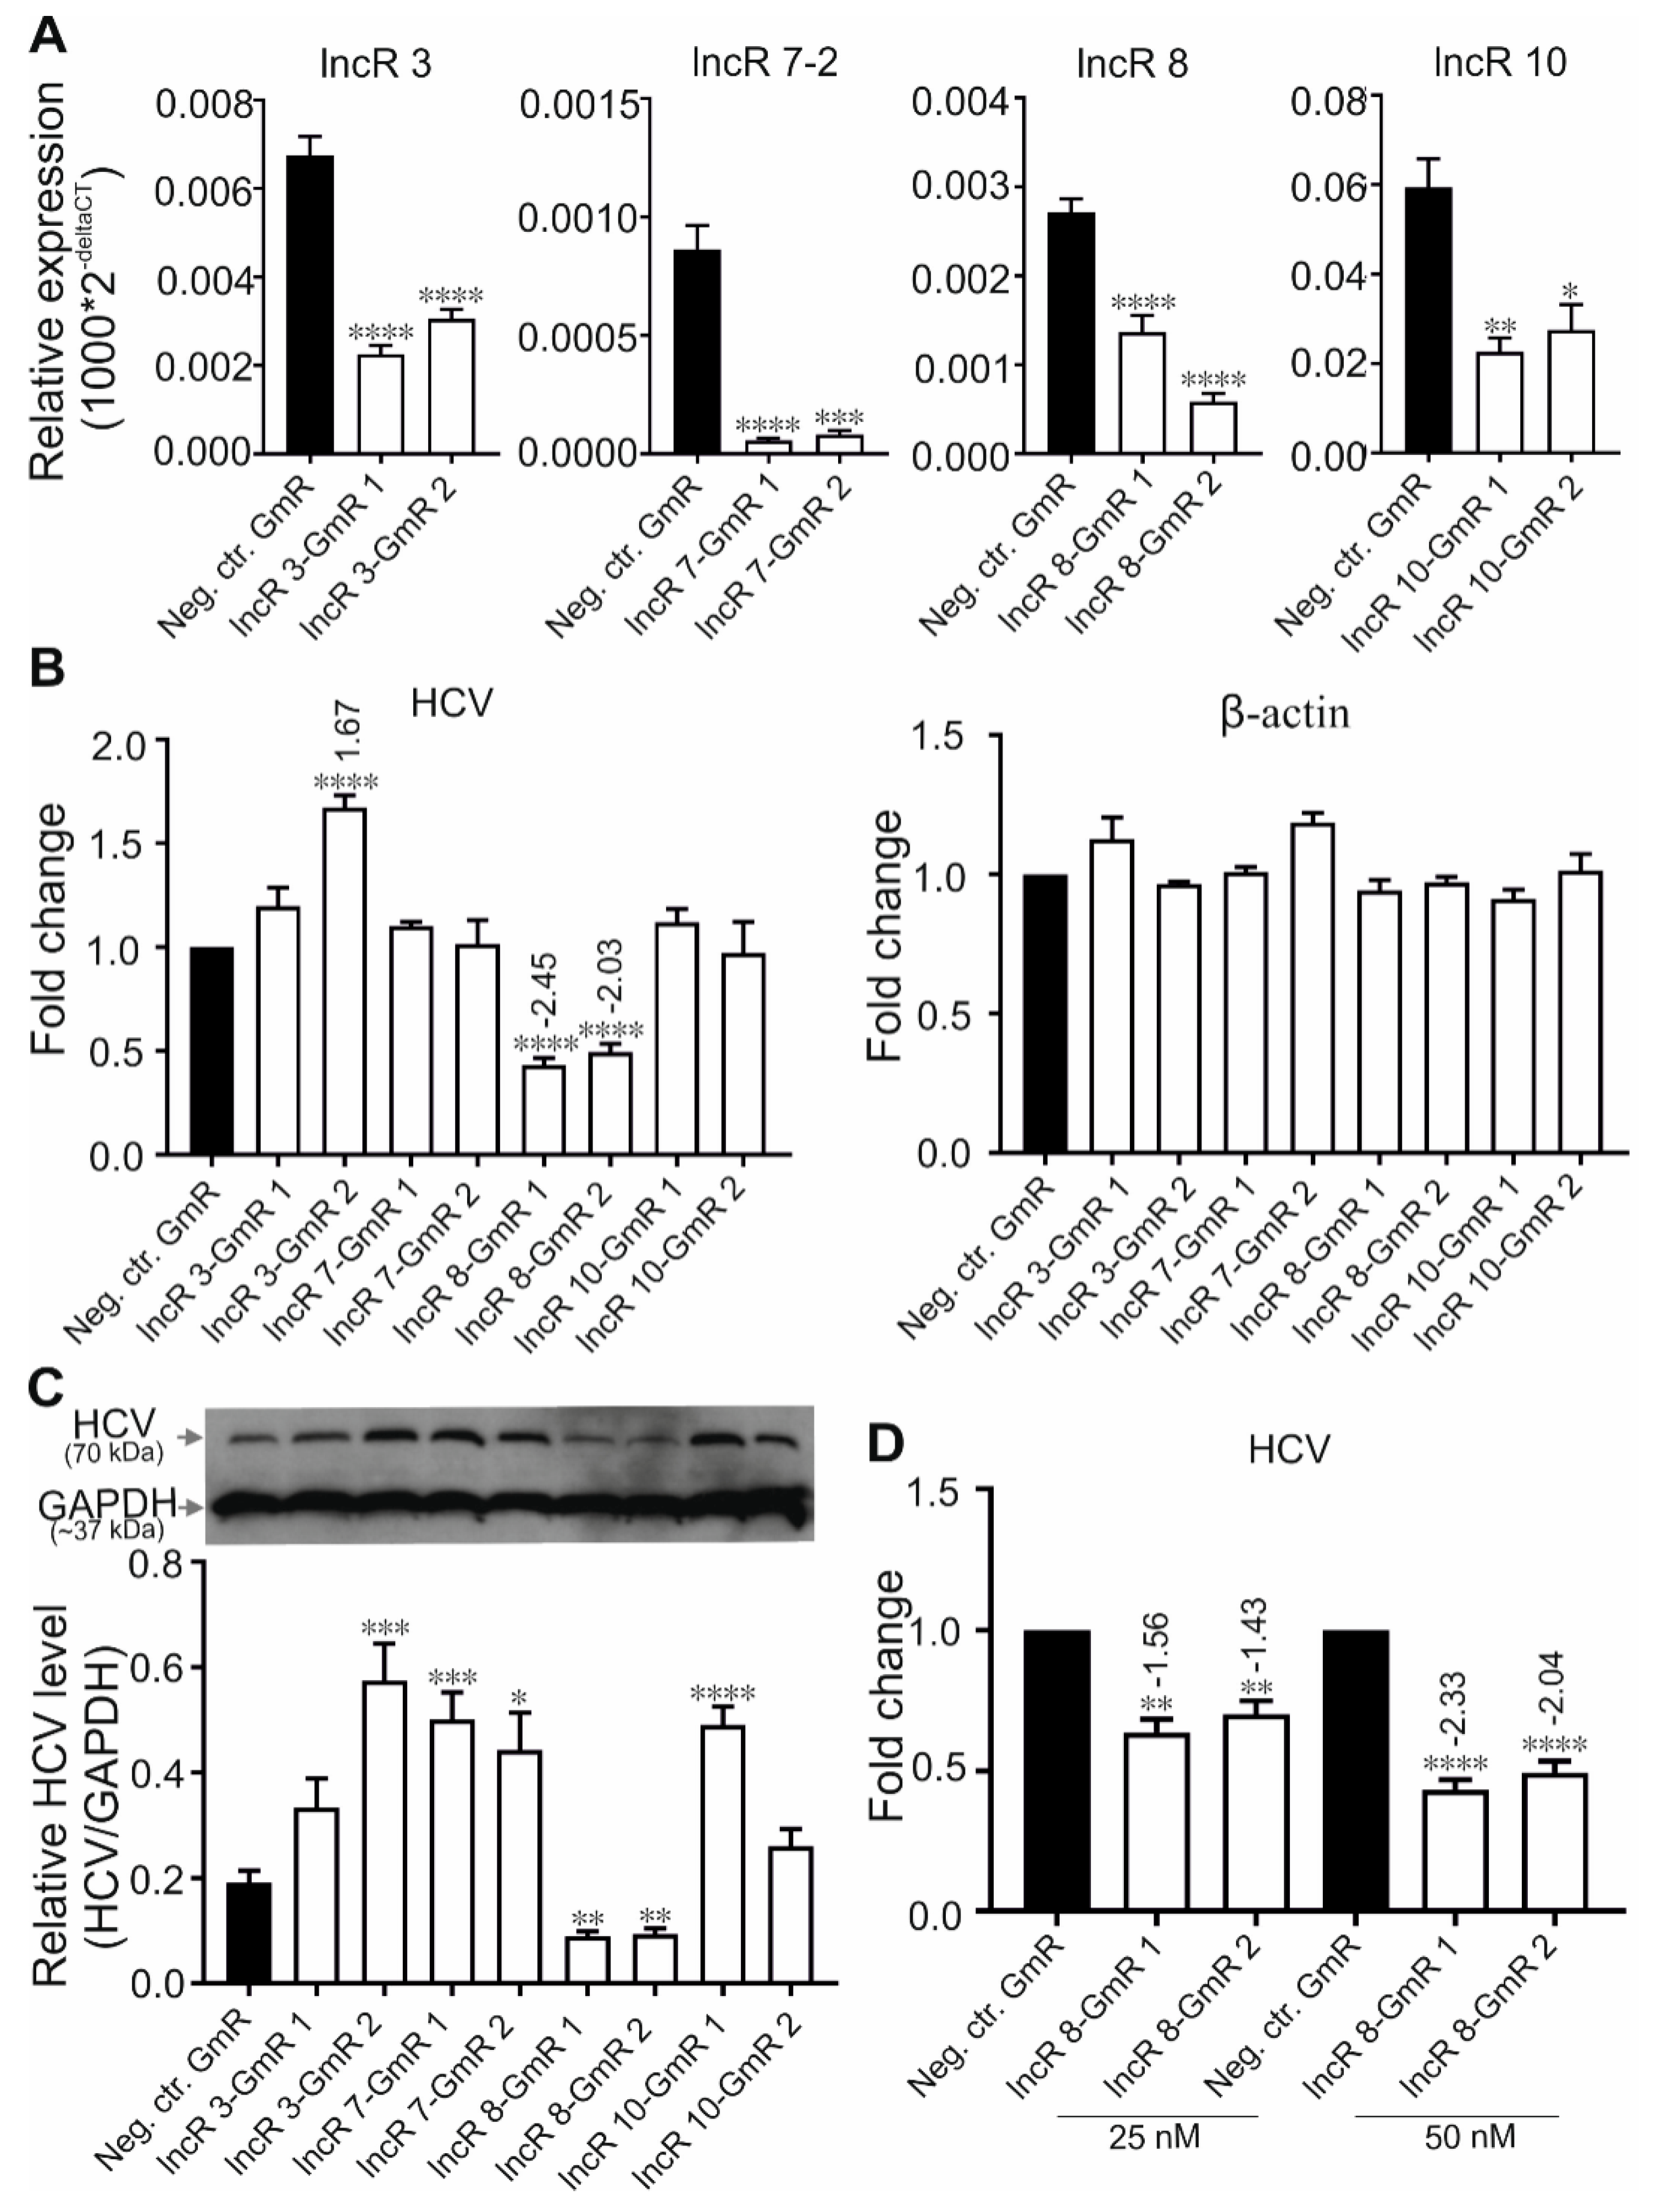
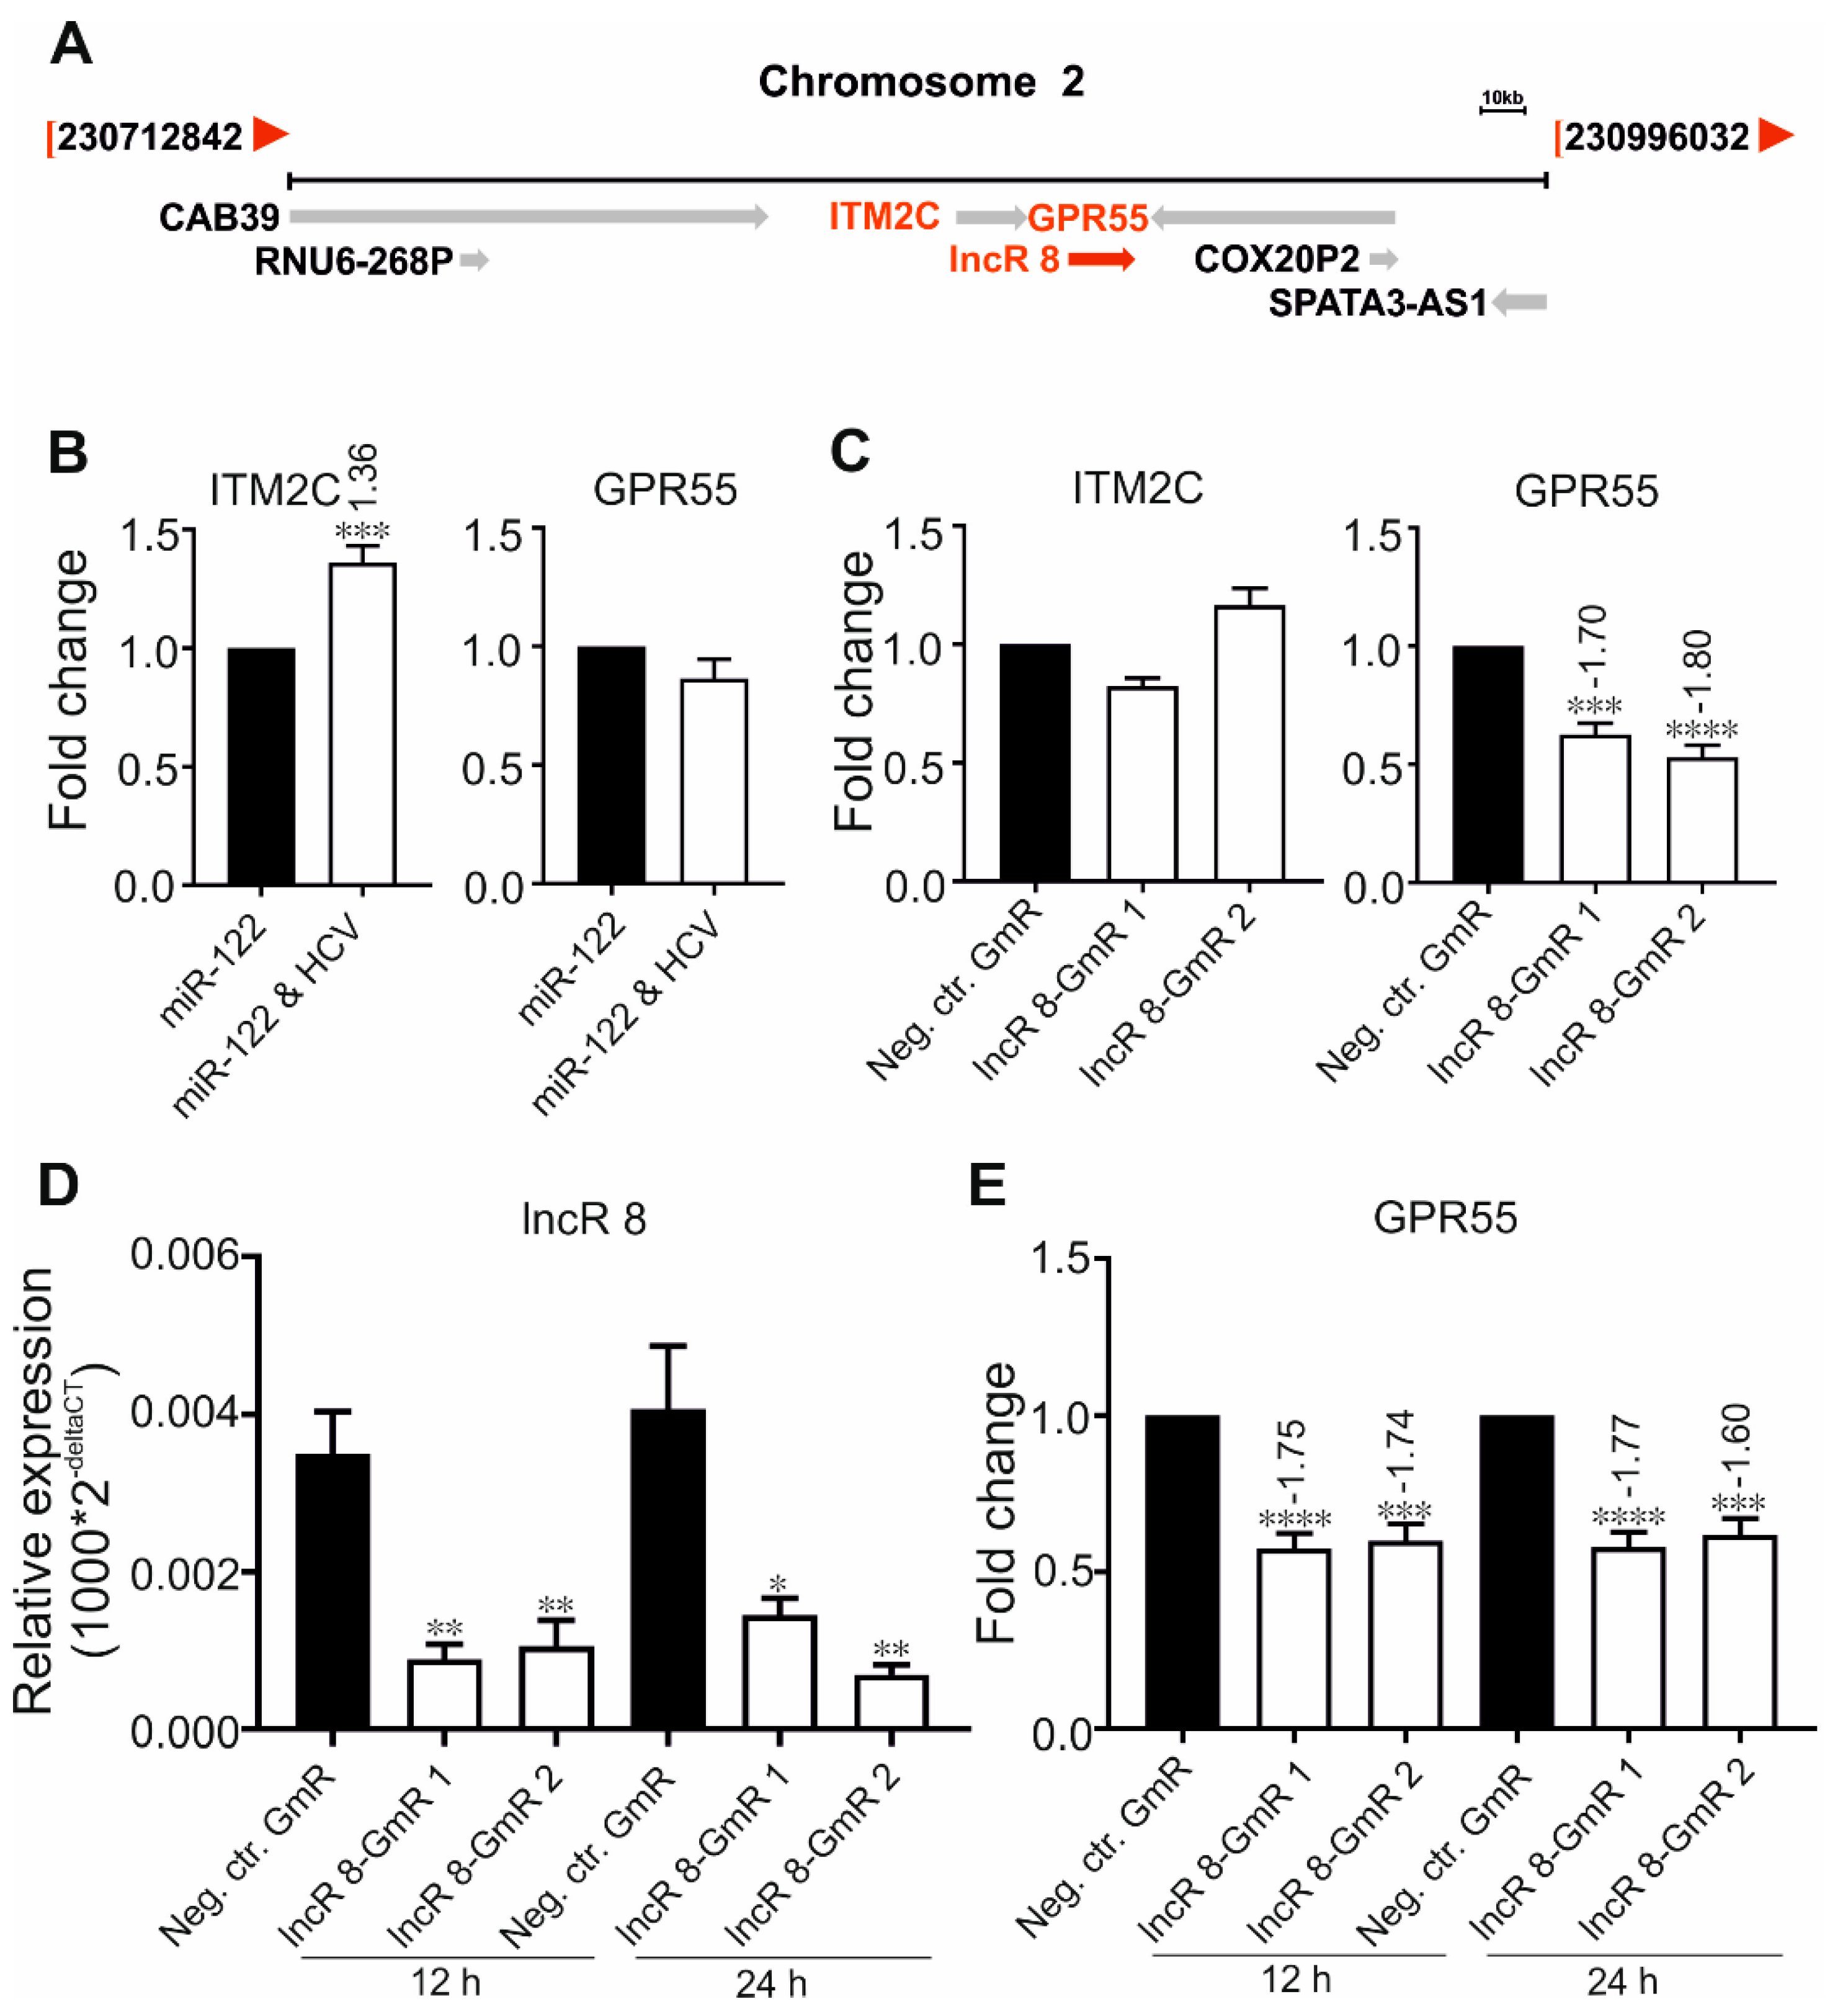
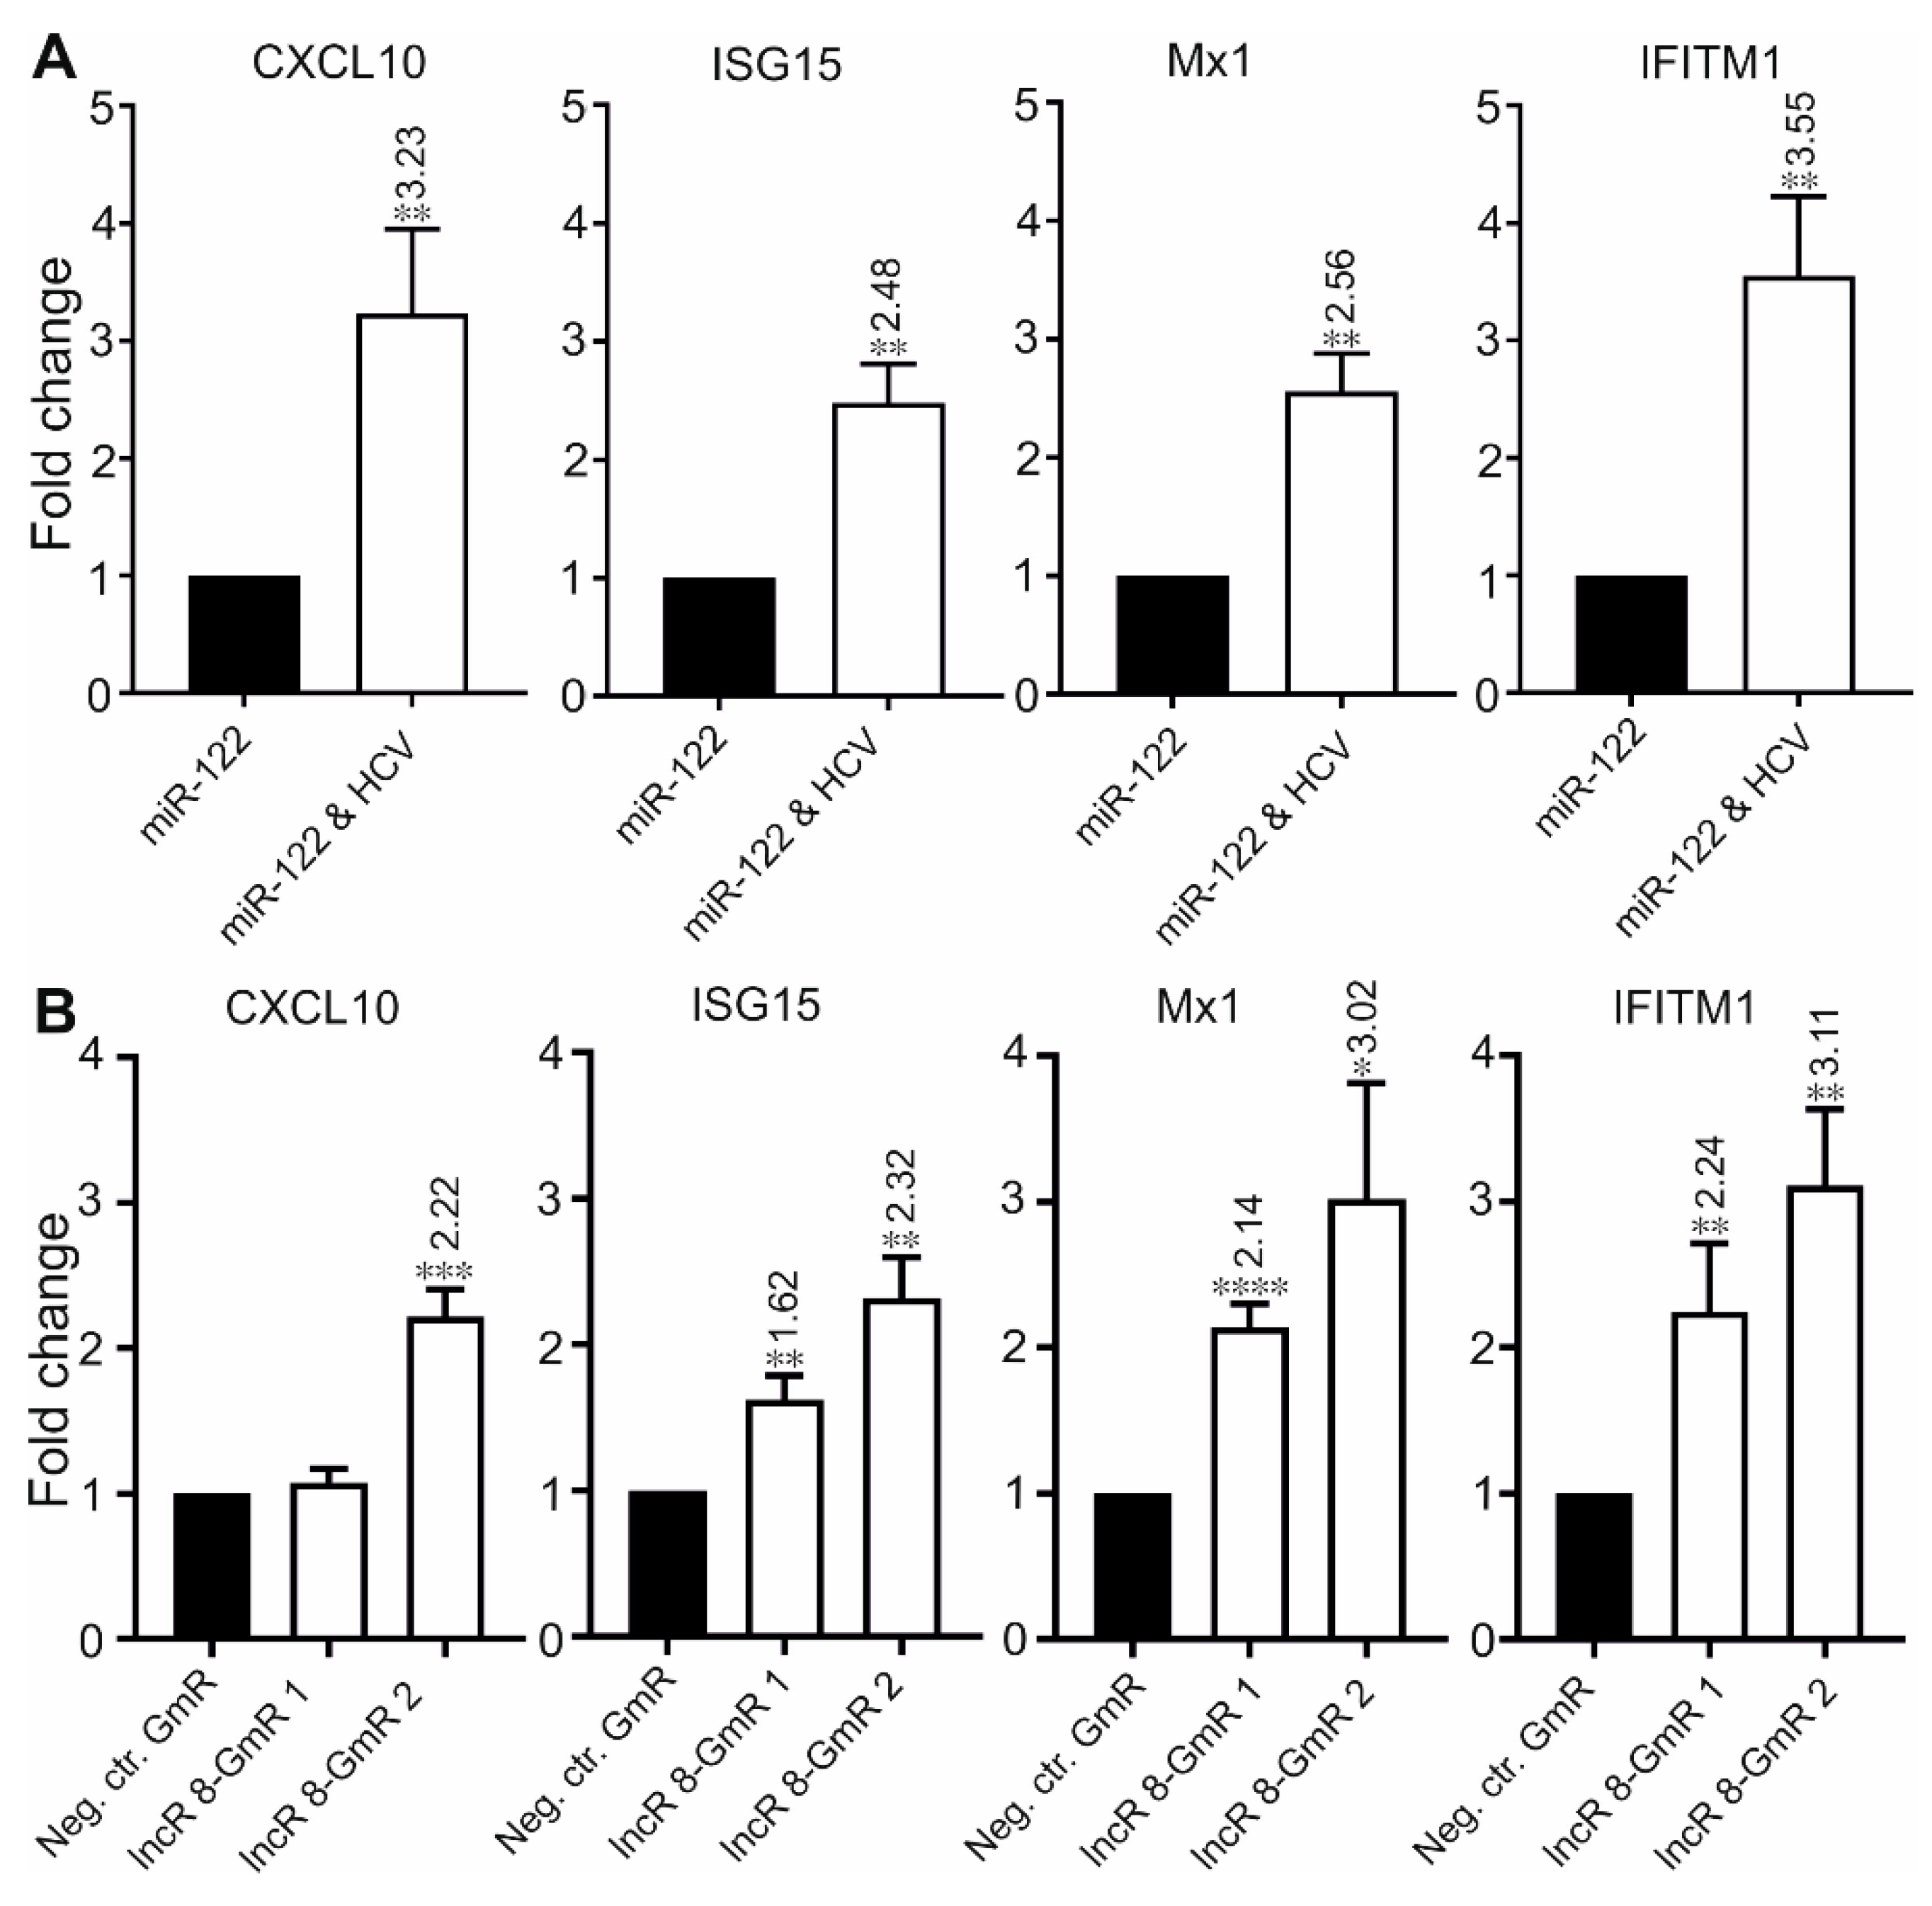
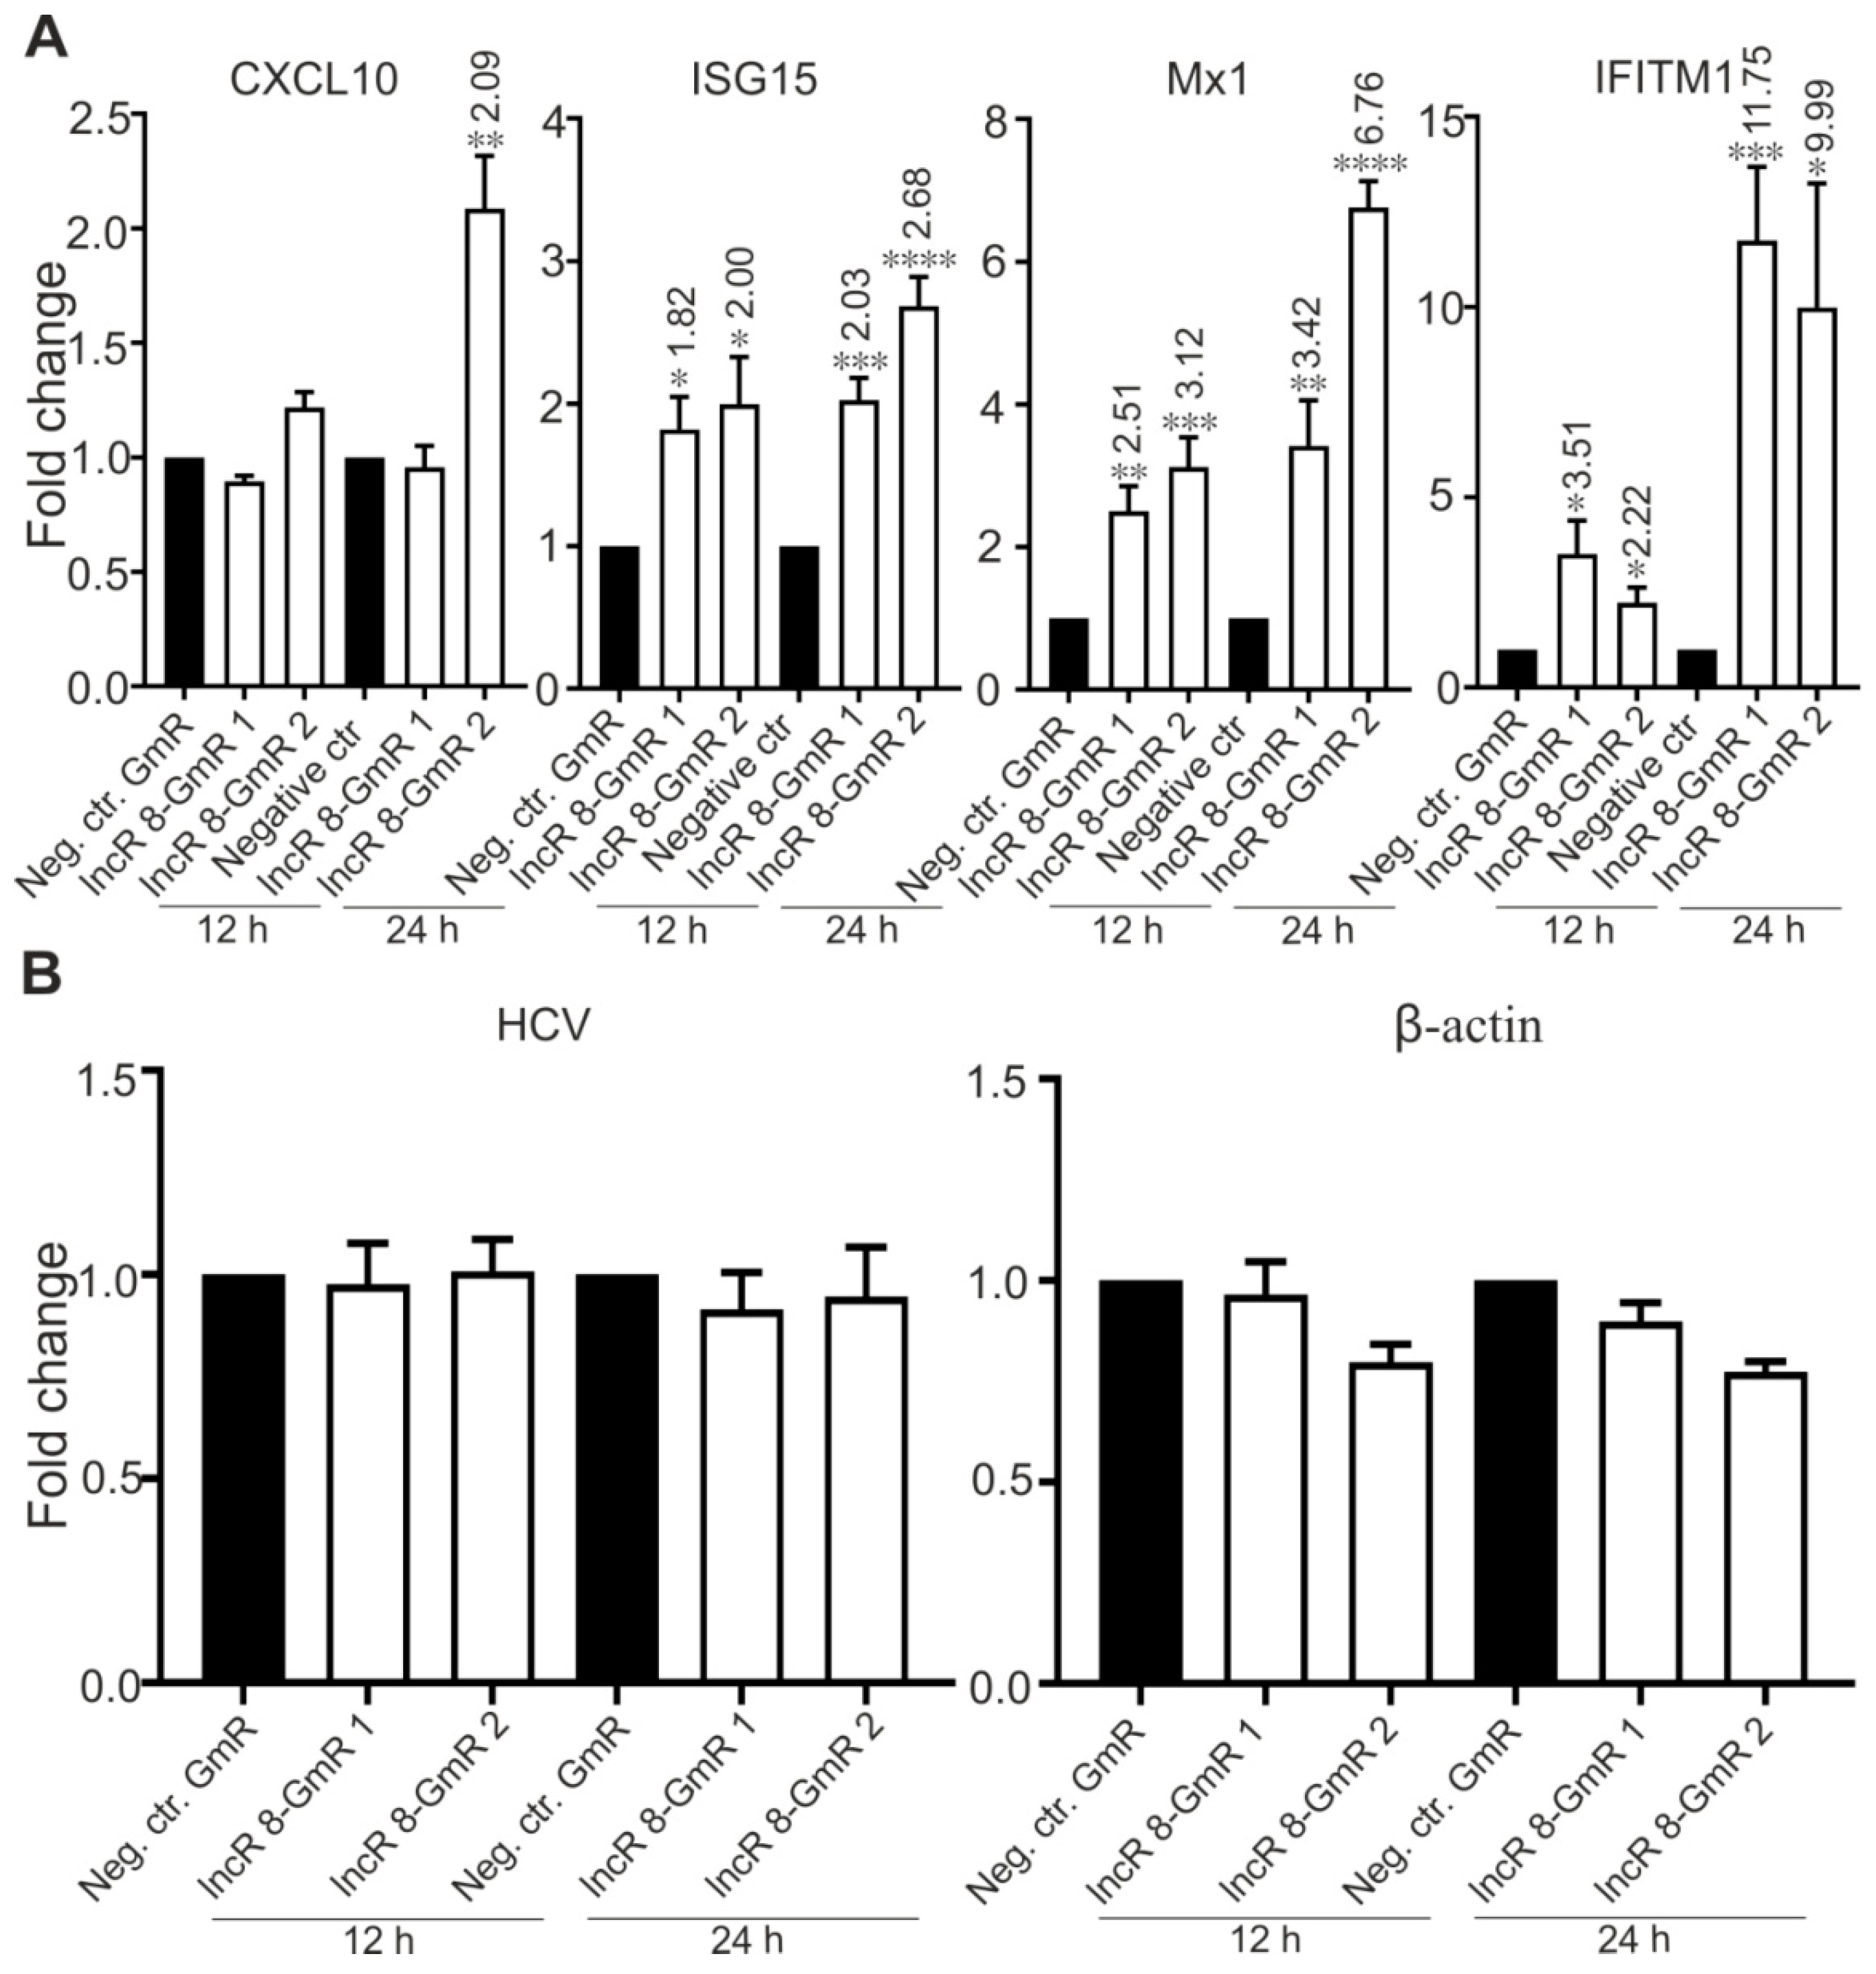
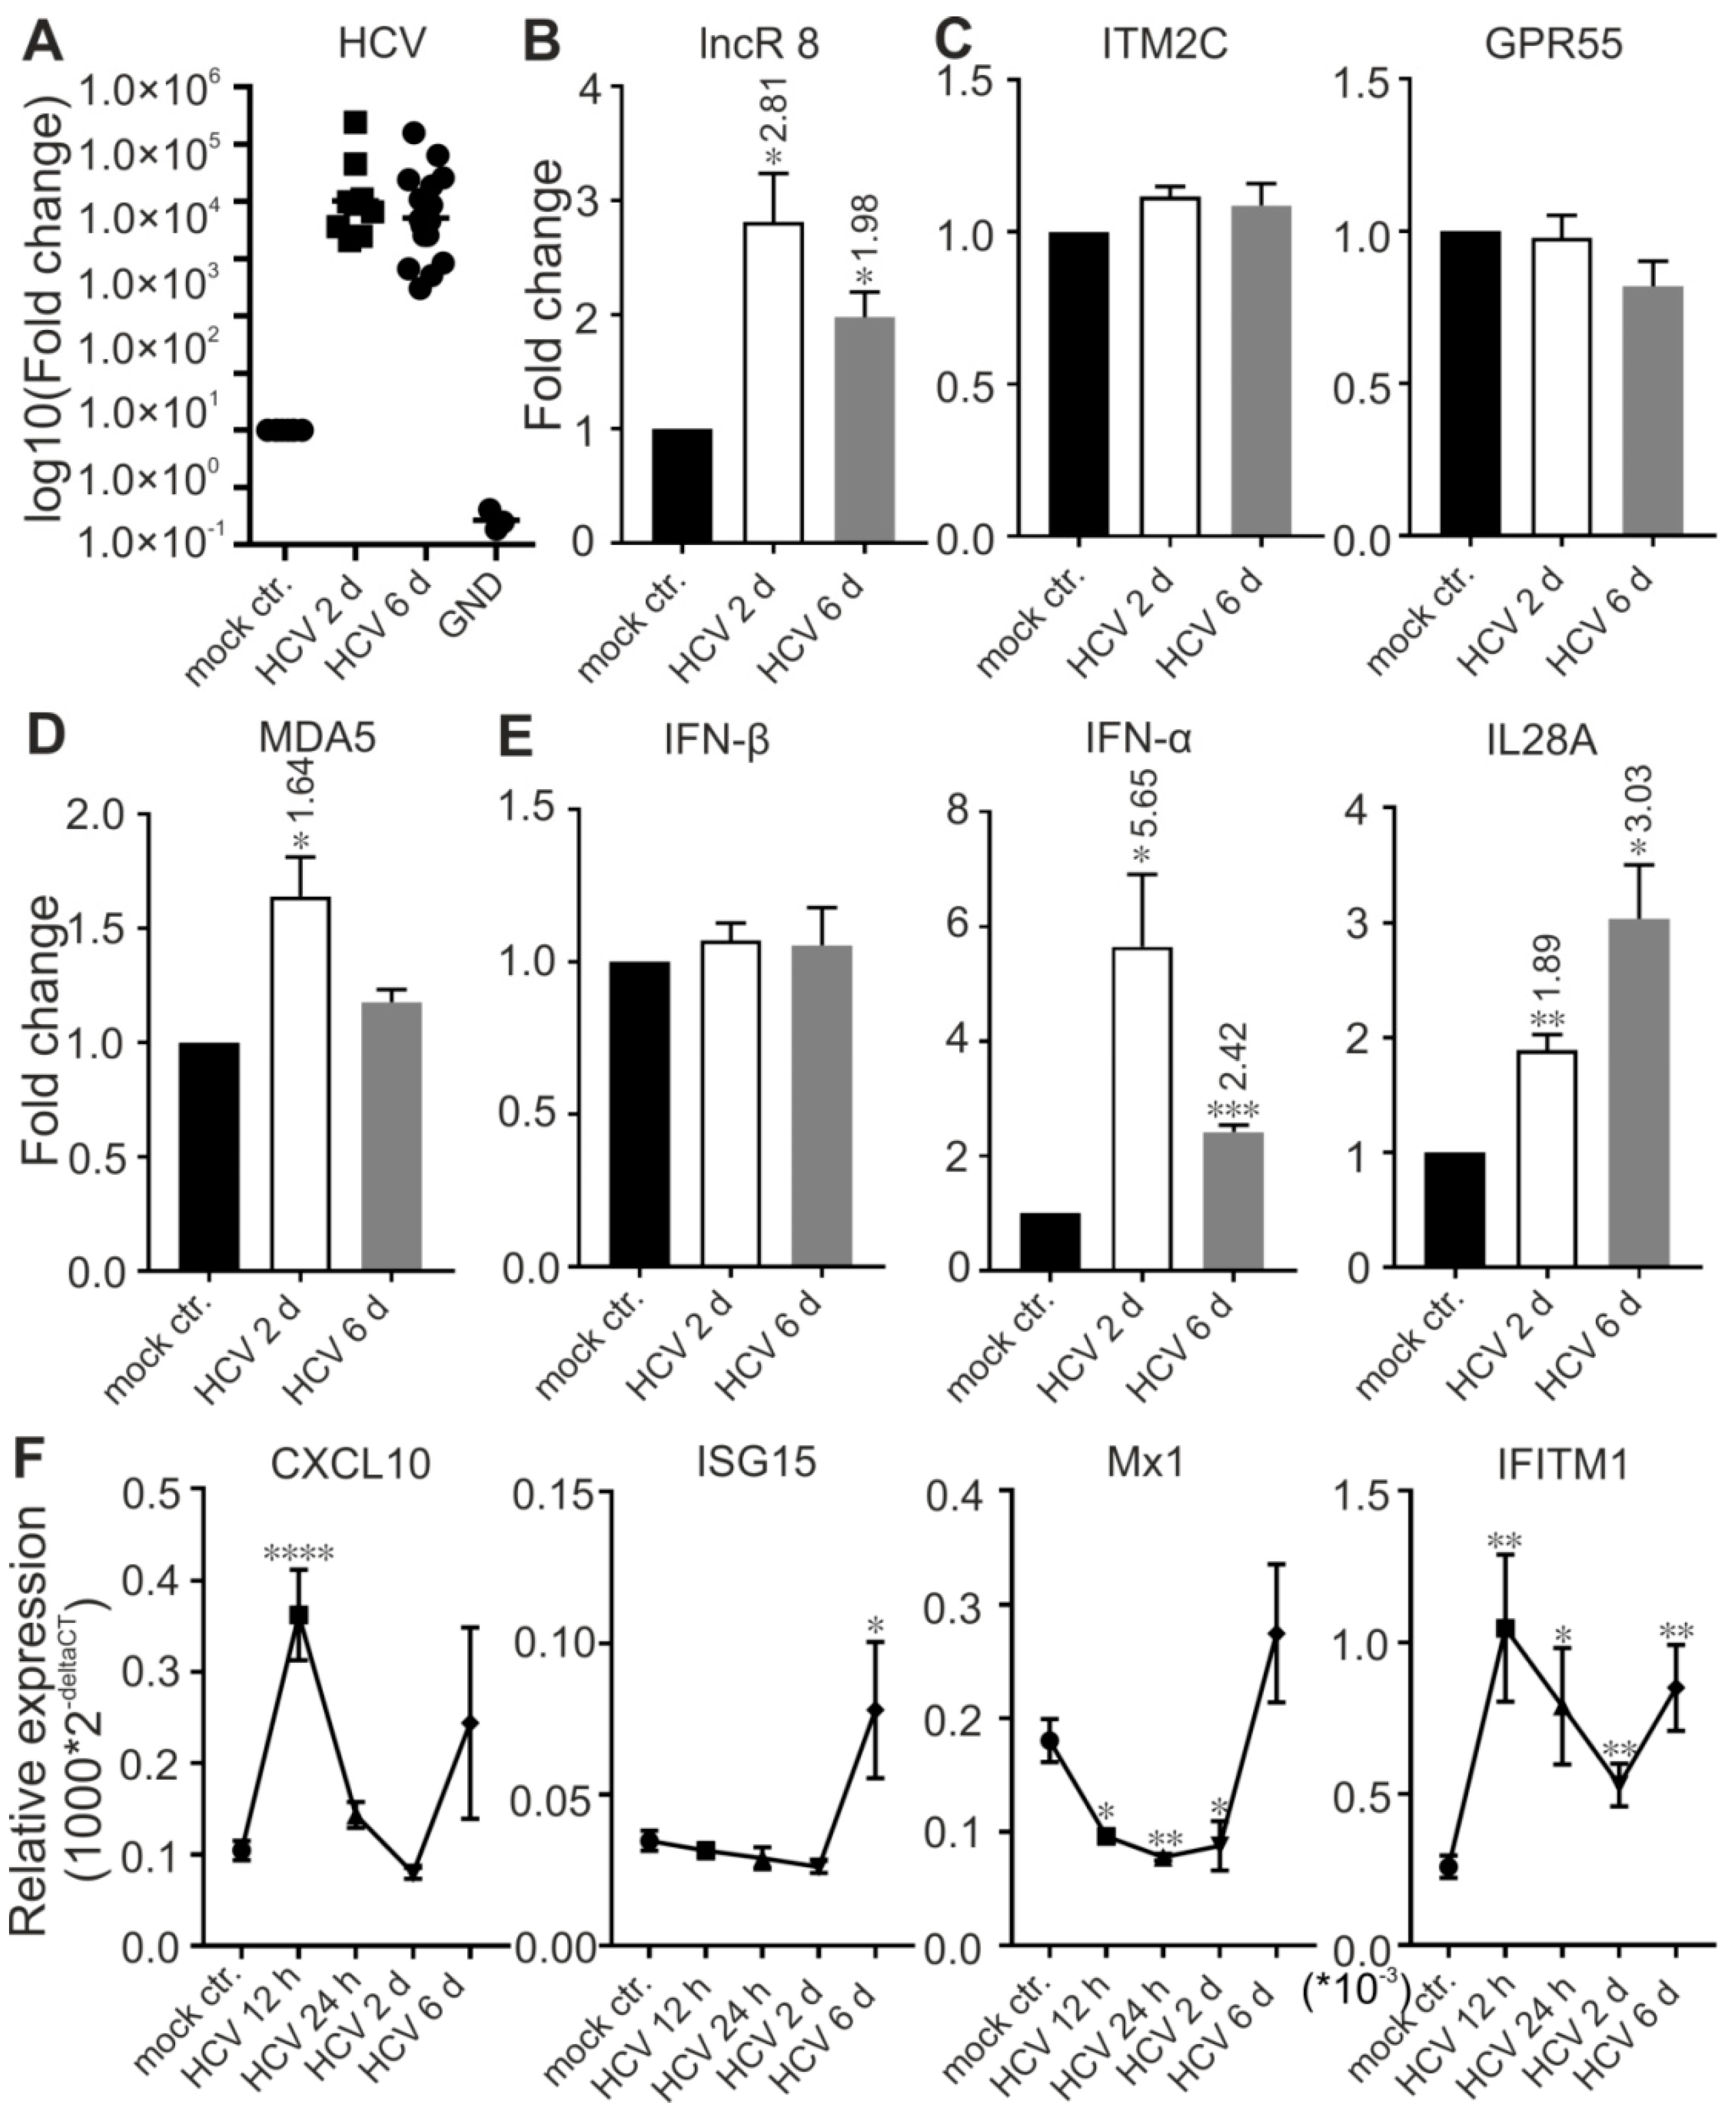
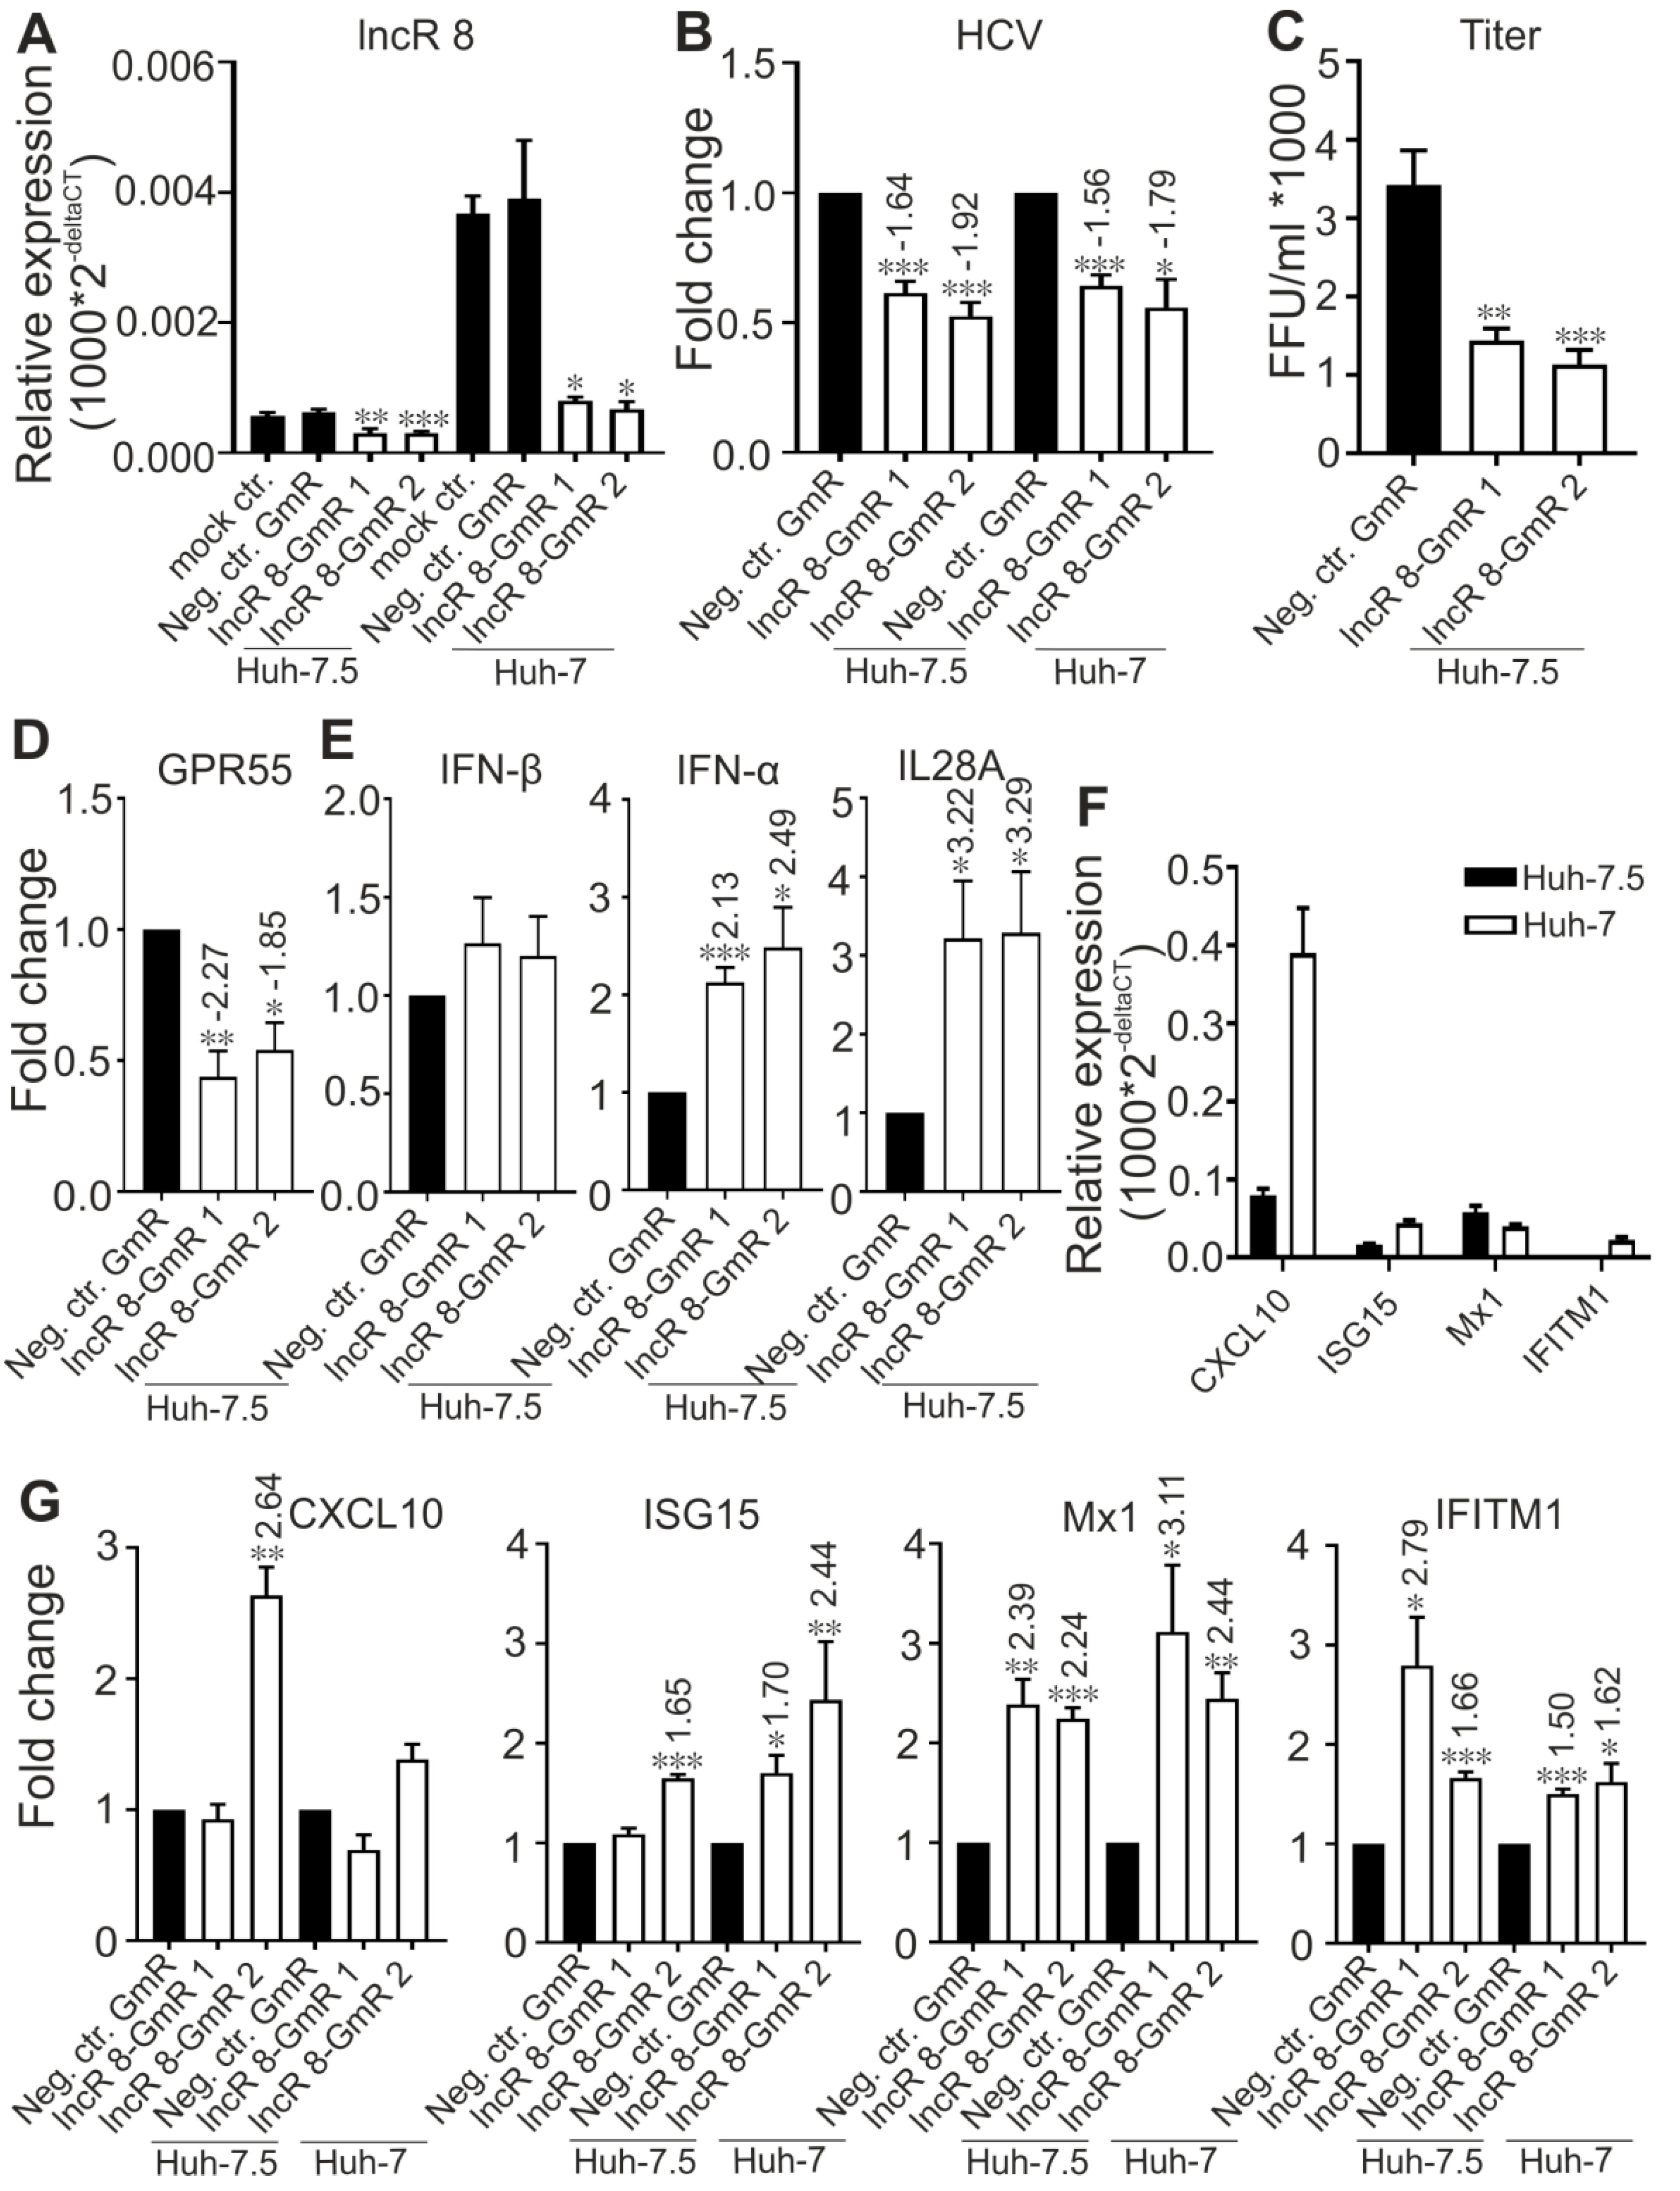
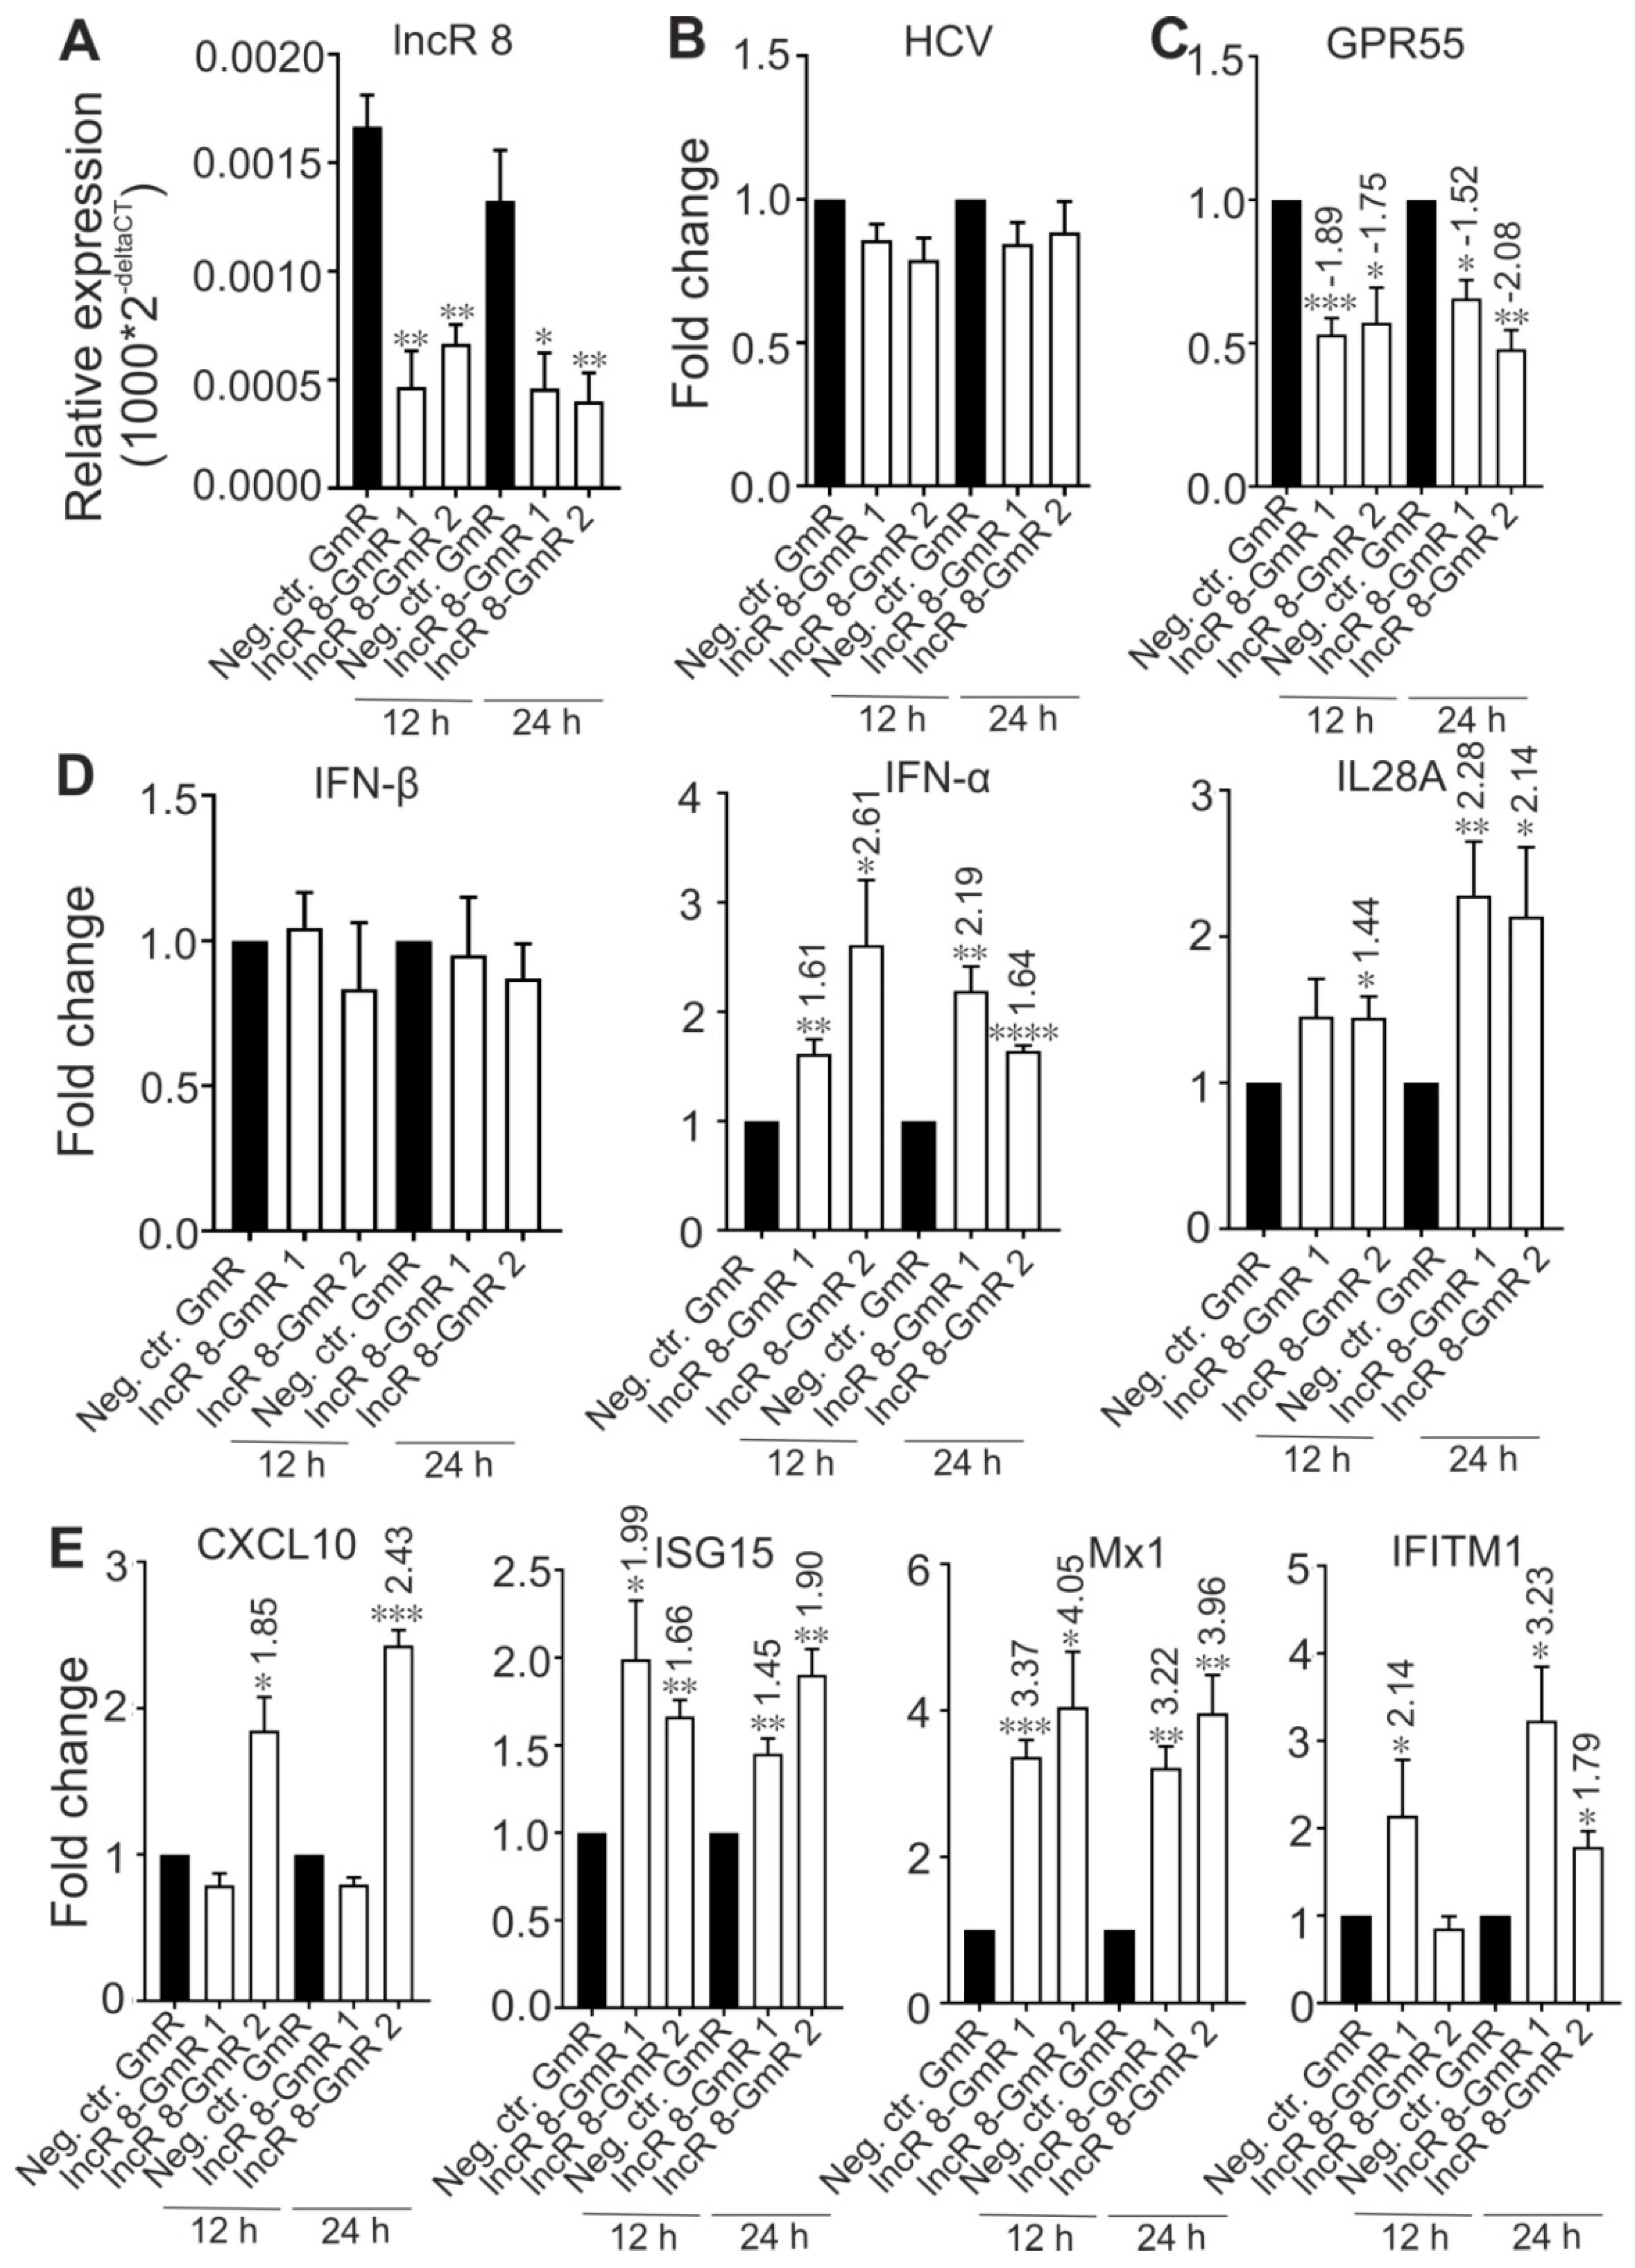
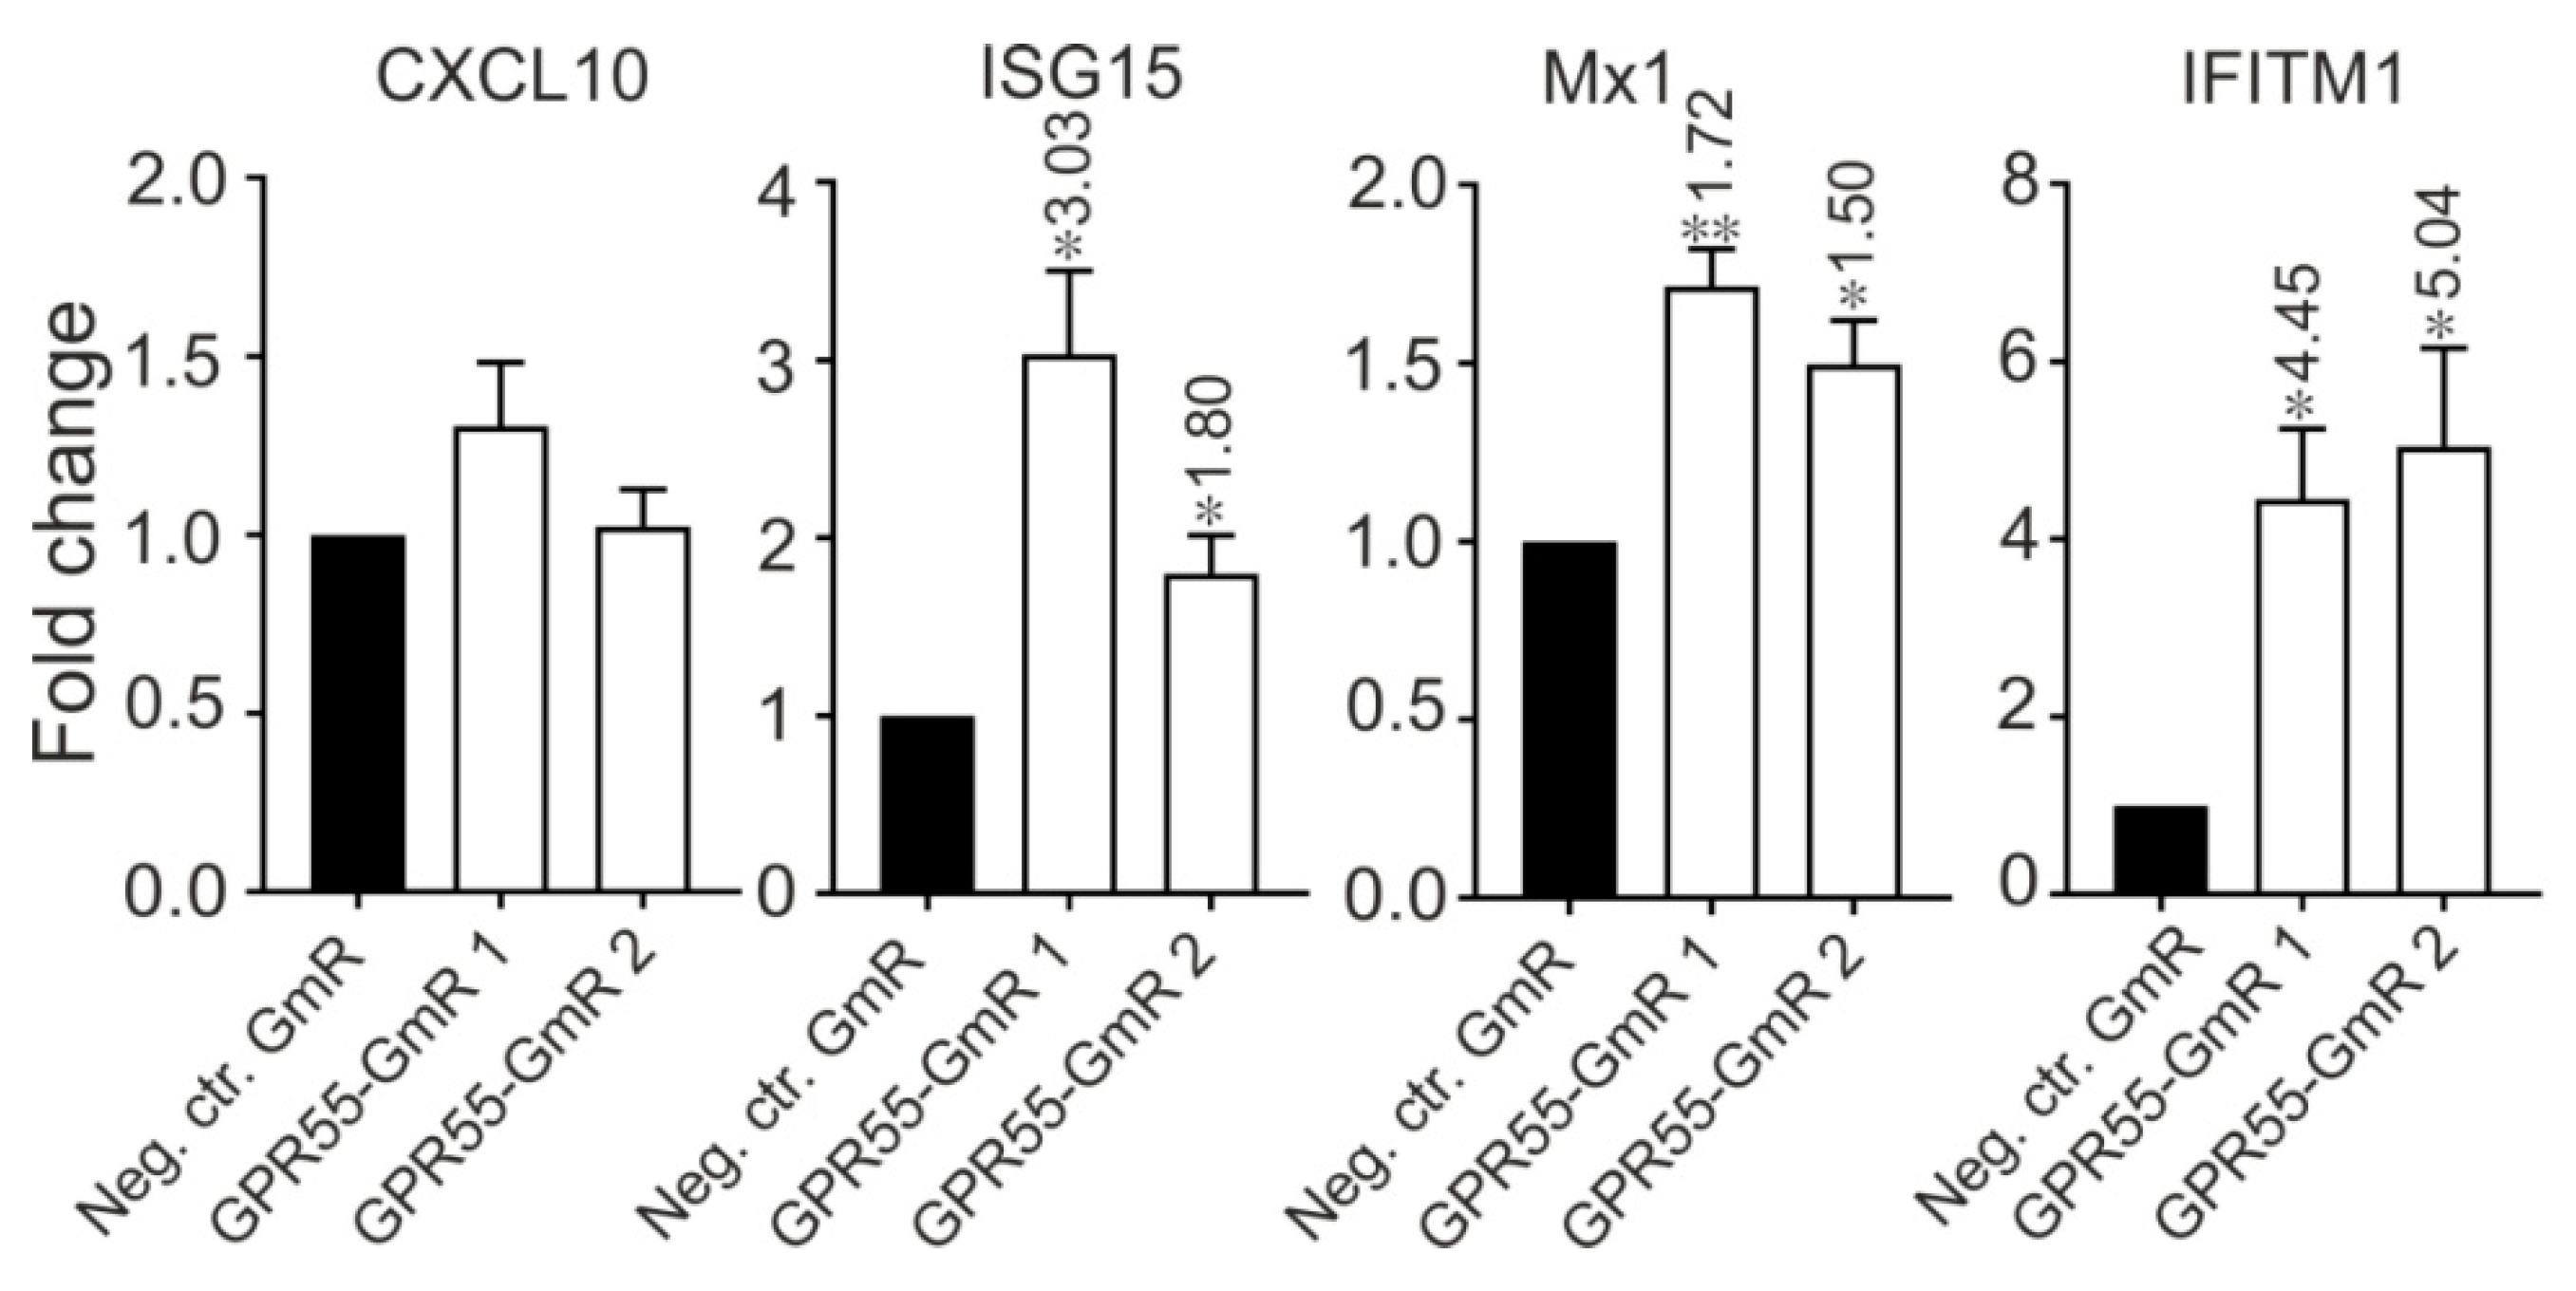
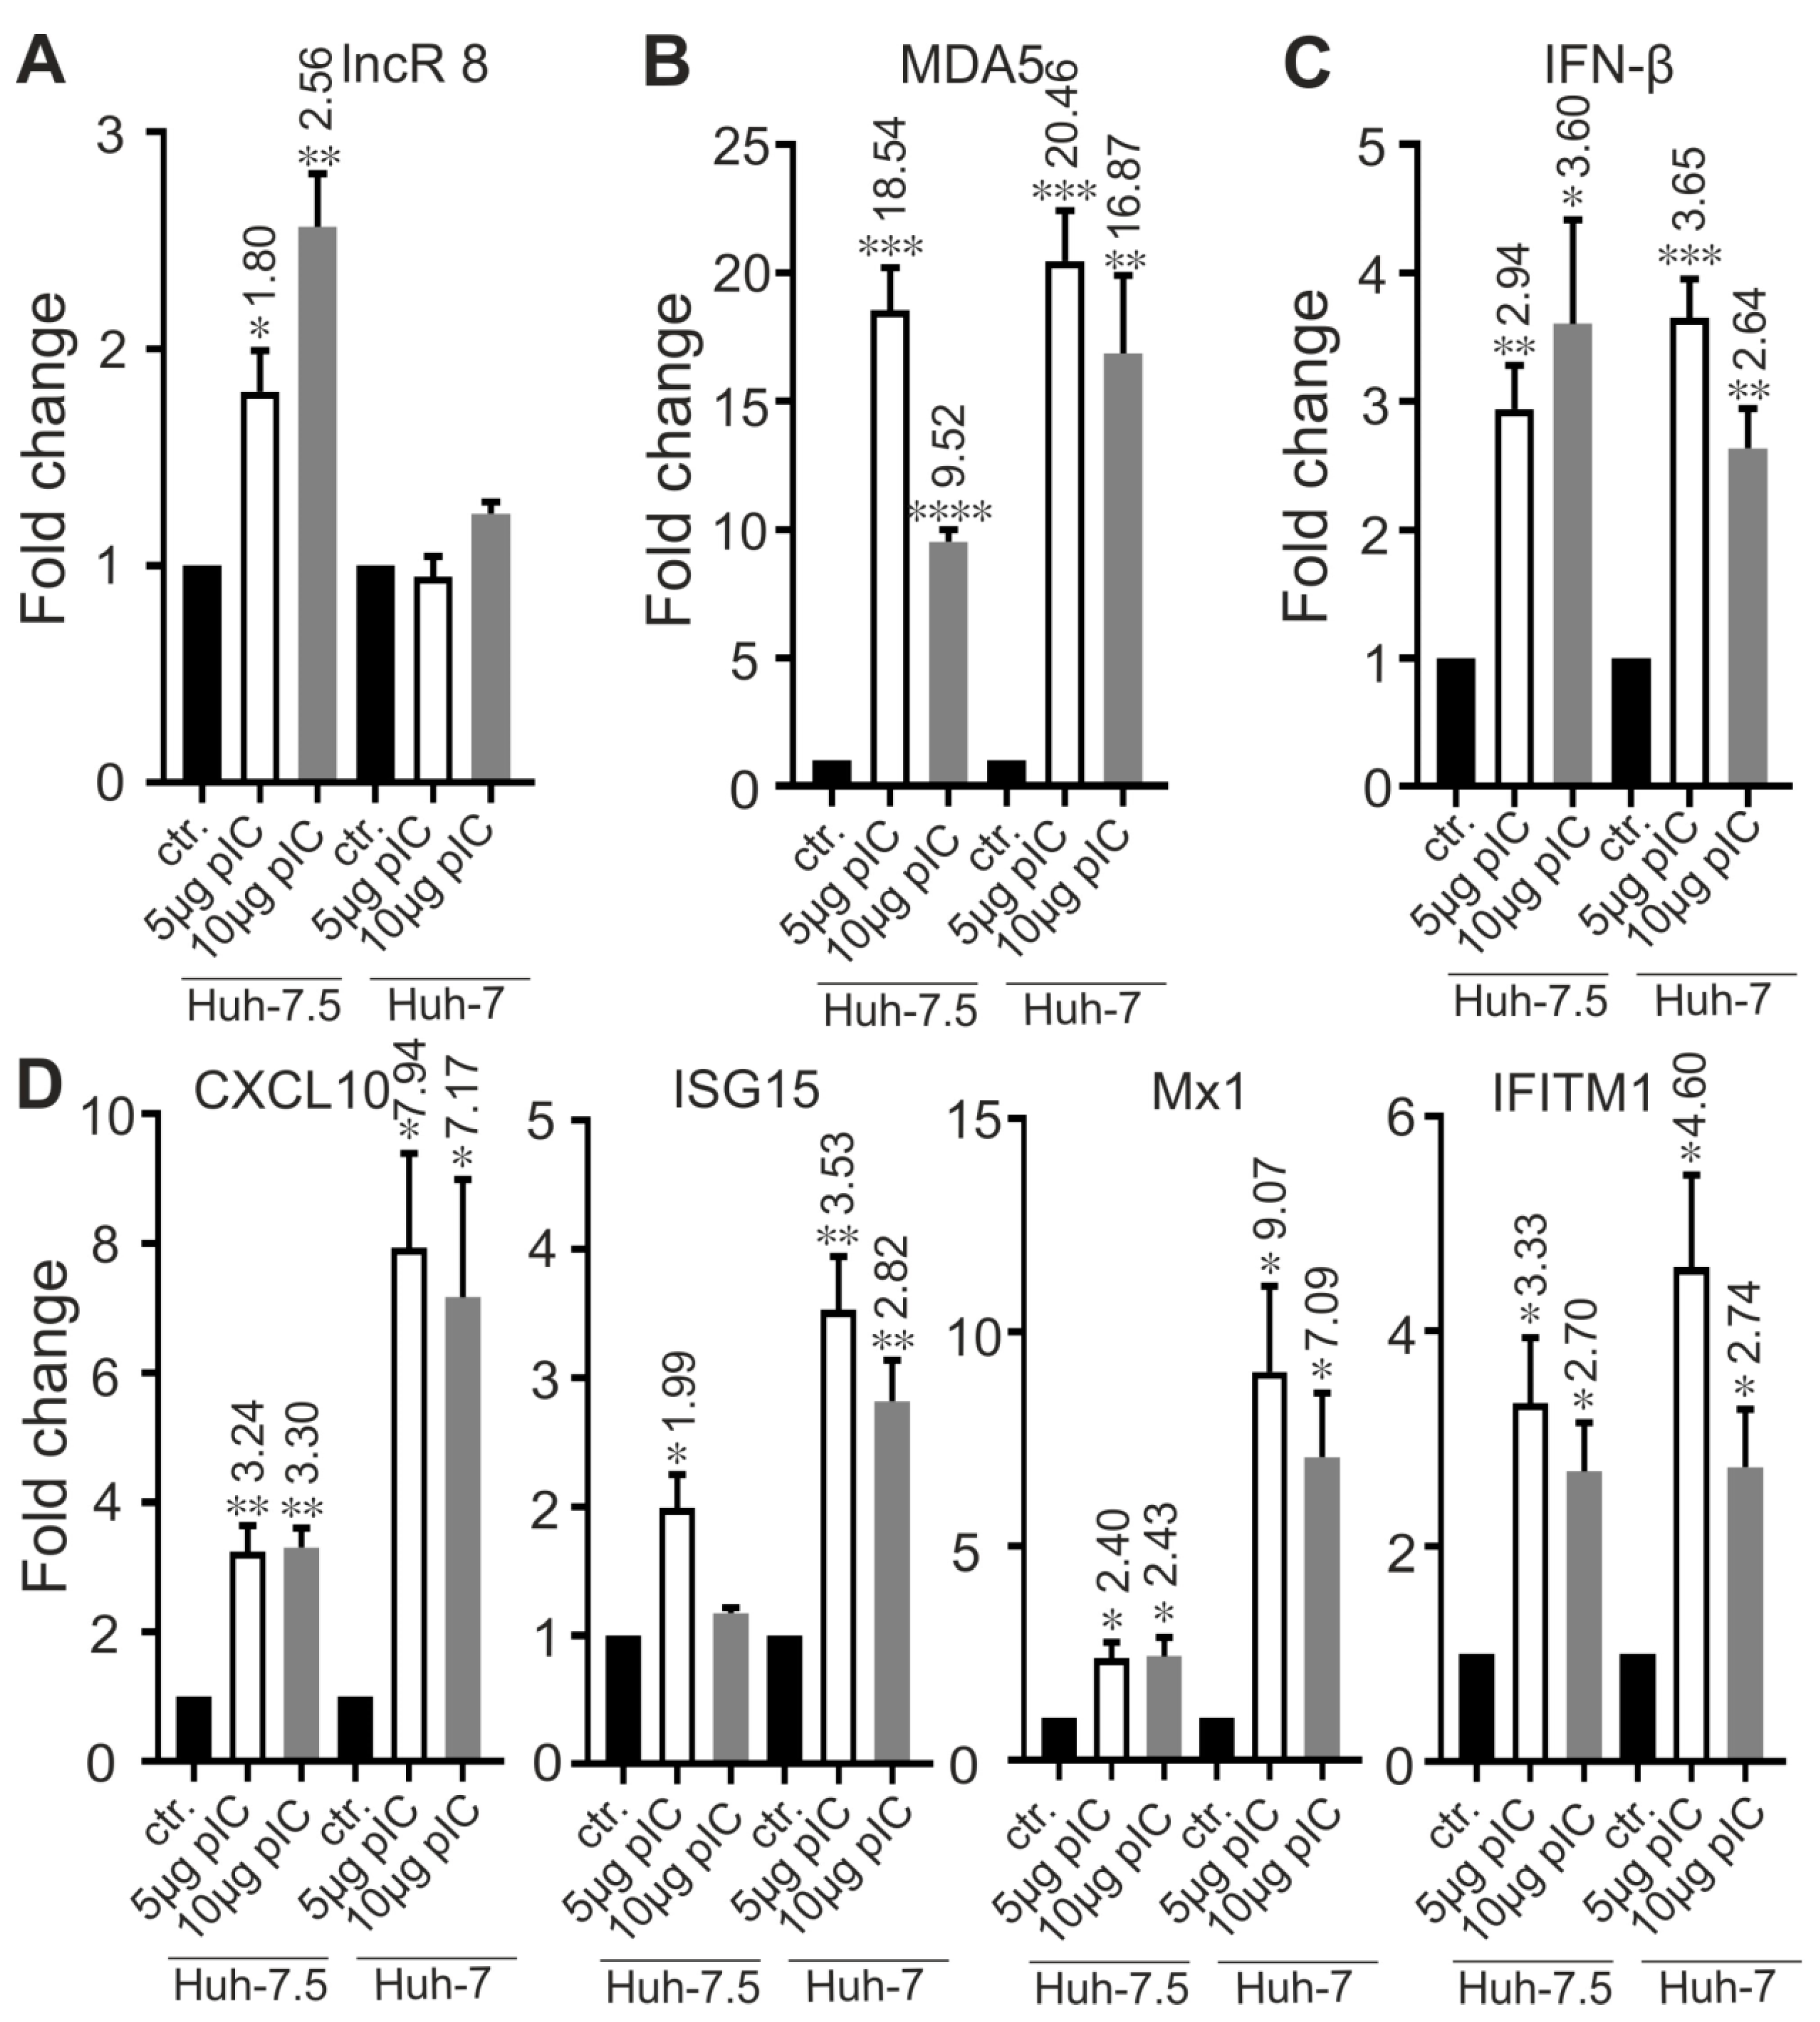
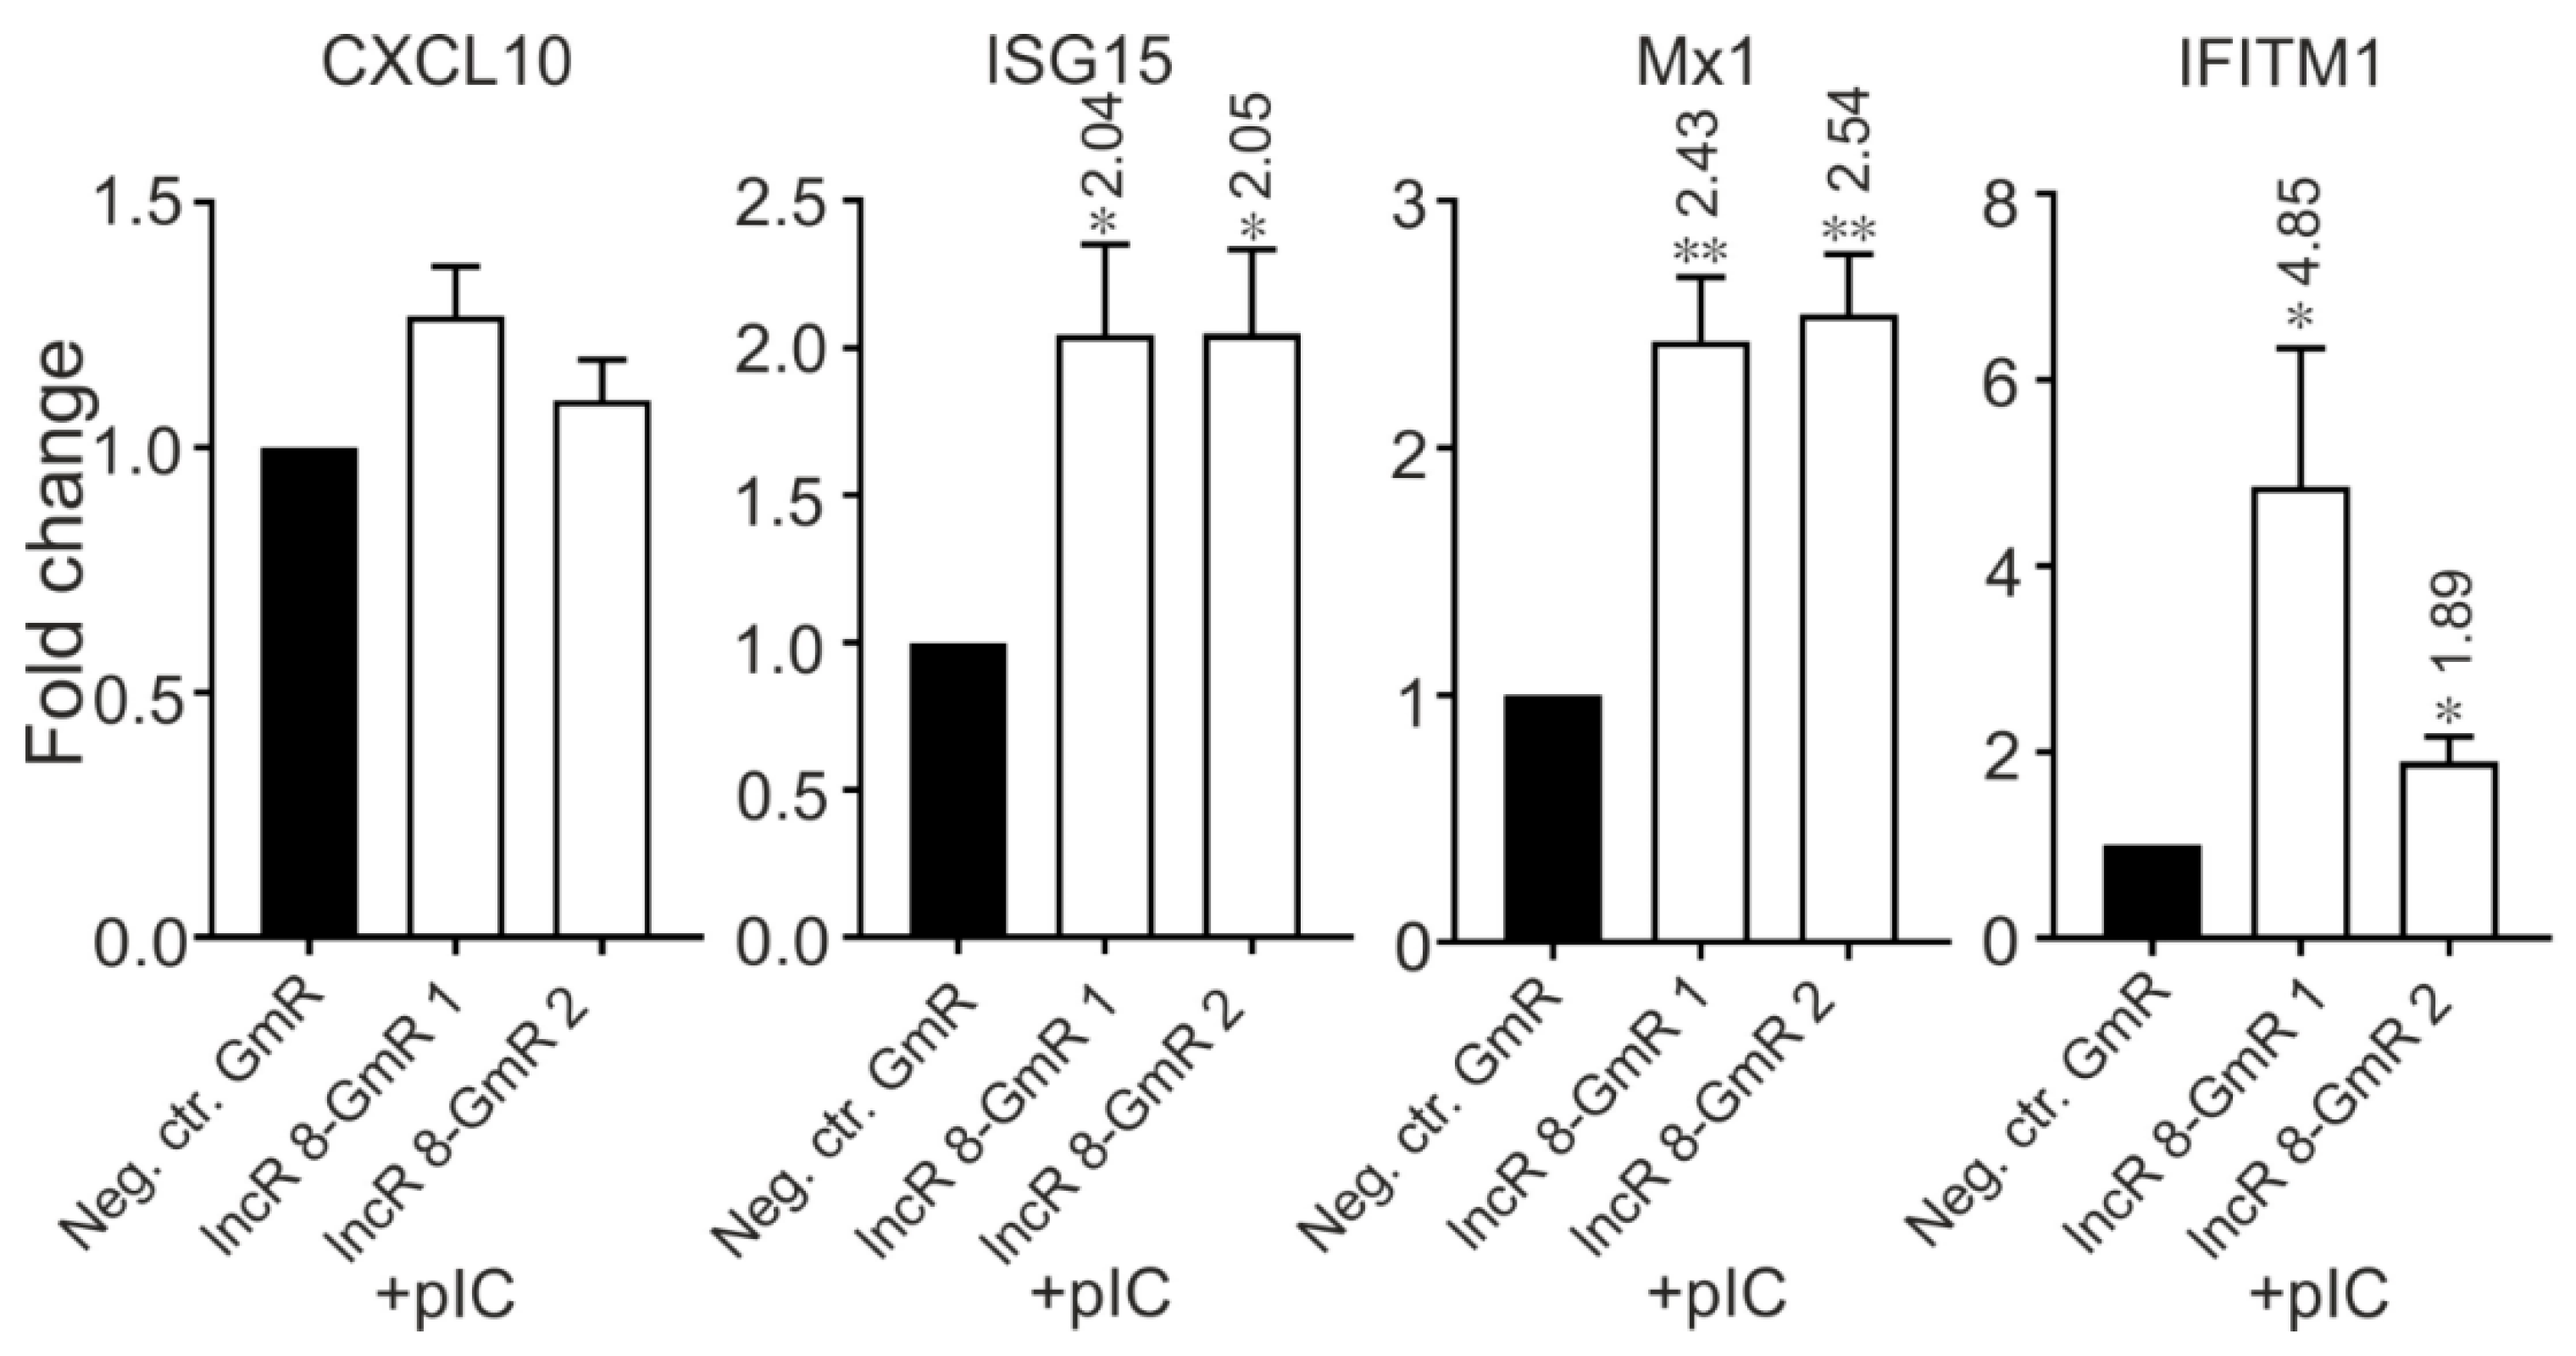
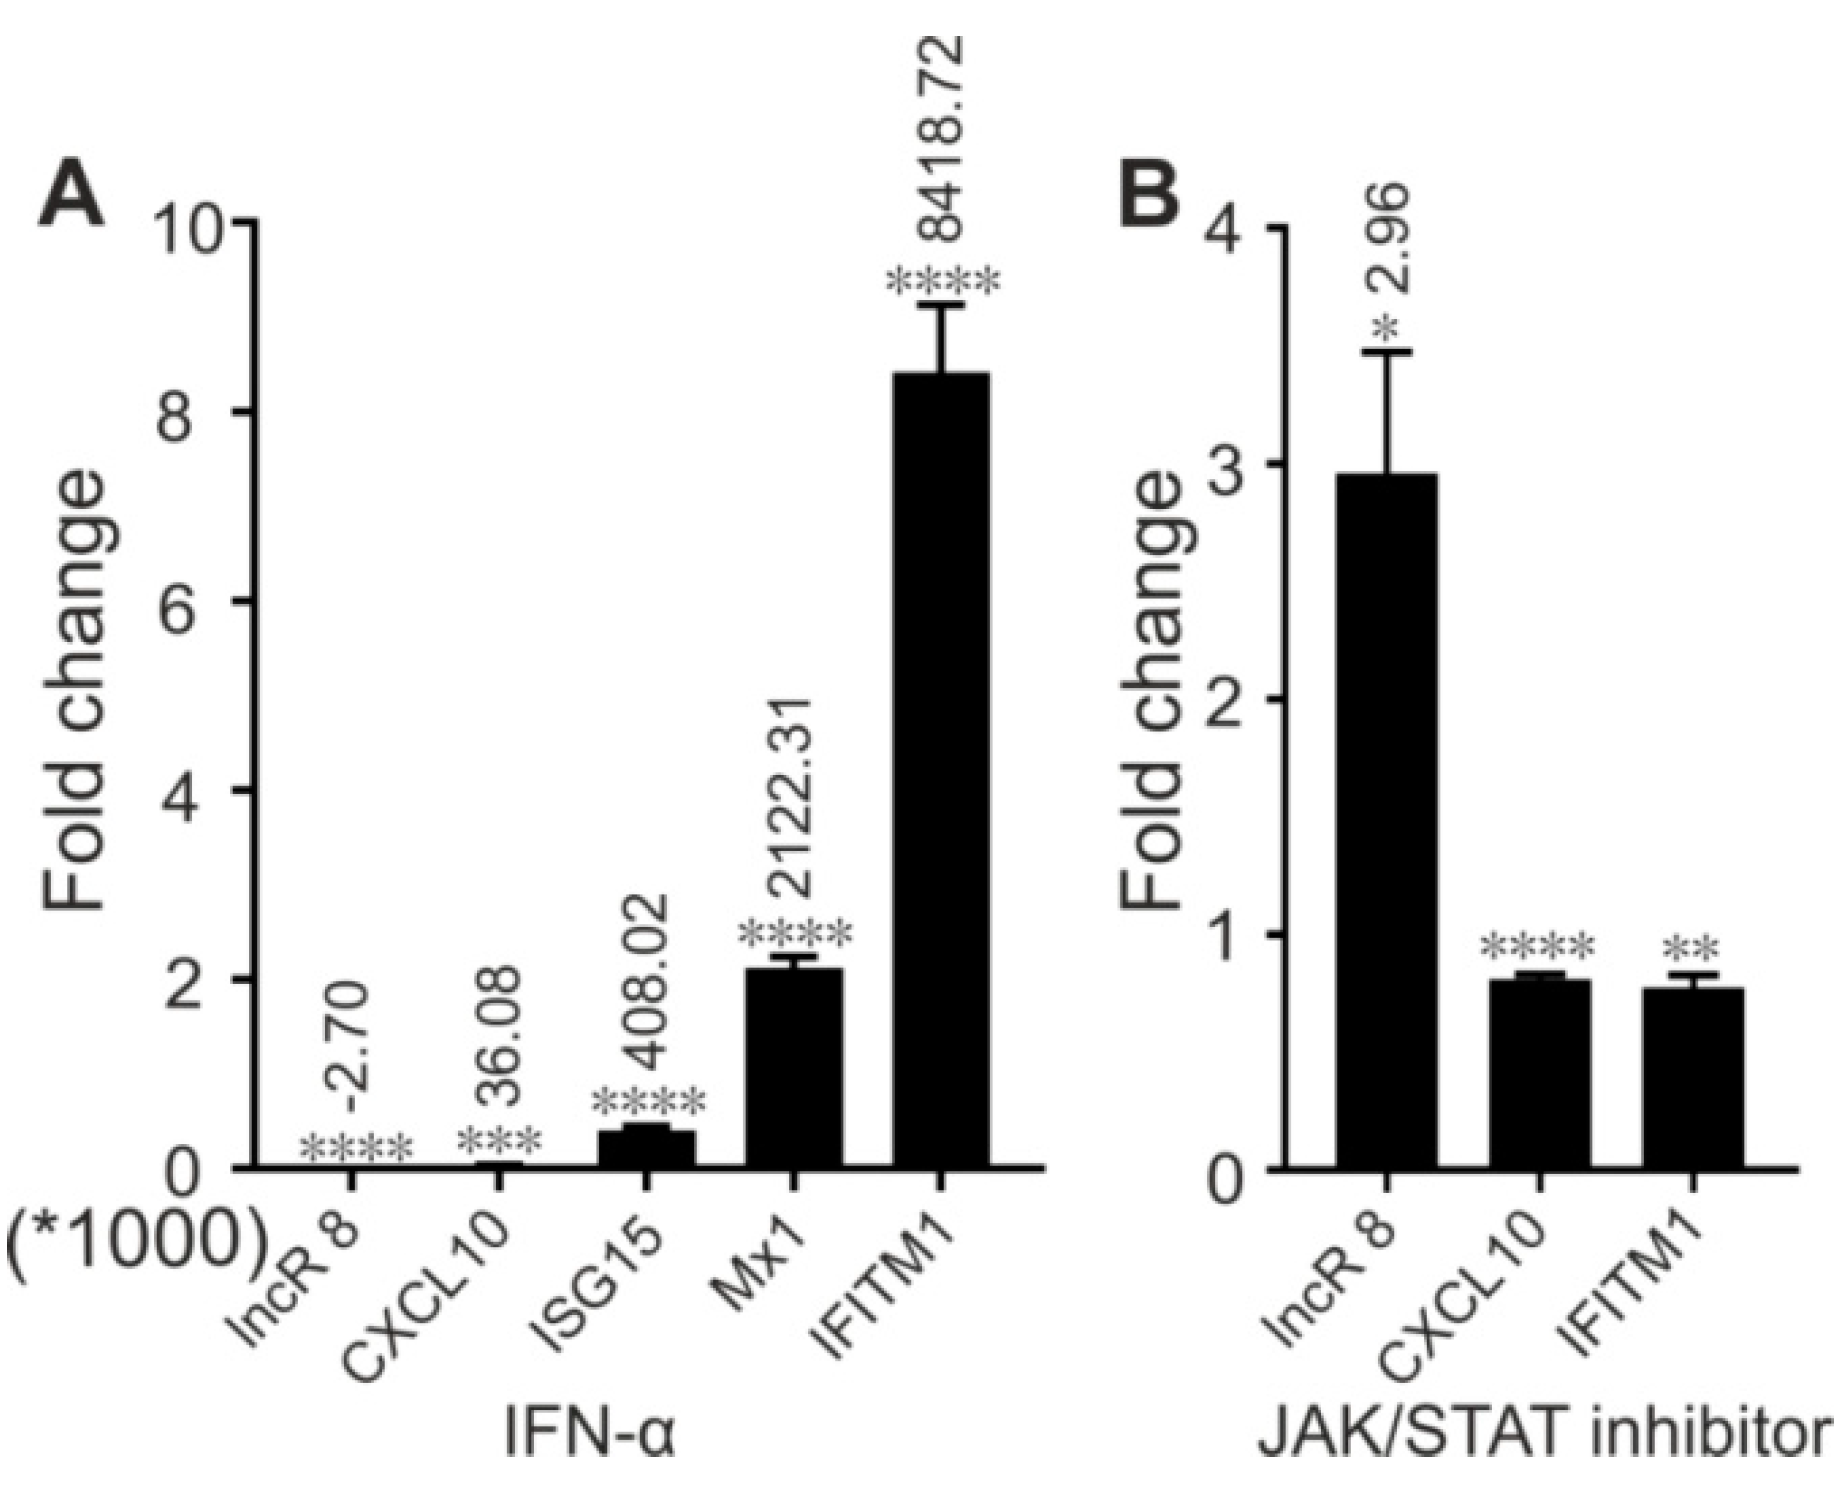
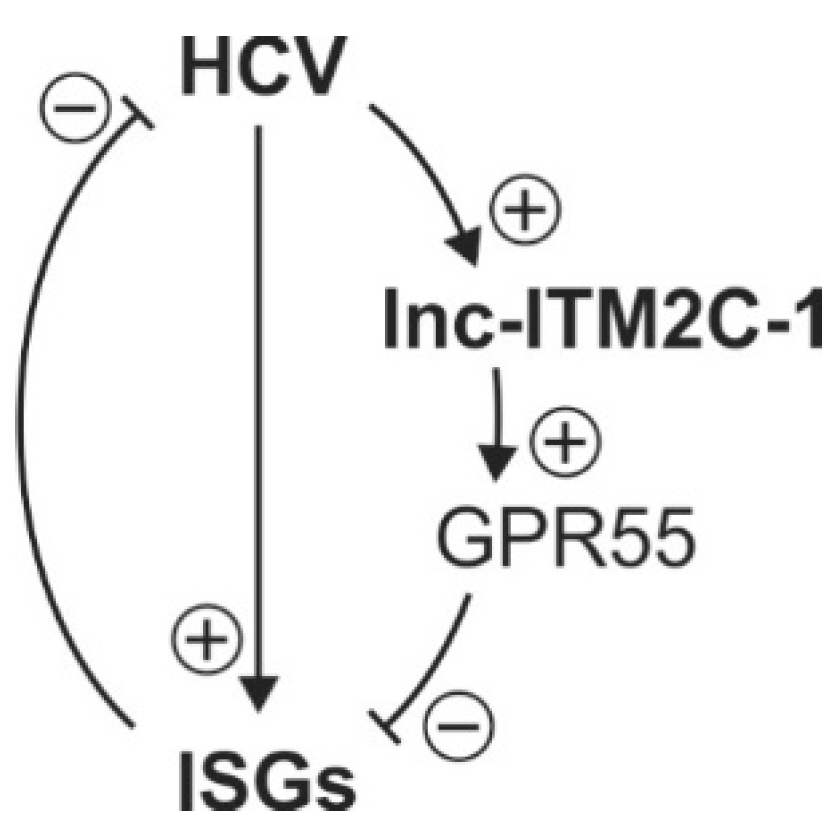
Table 1.
Primers for lncRNAs.
| Target Gene | Primer Sequences (5′-3′) | Amplicon Size (bp) |
|---|---|---|
| LncR 2 | F: CTCCCAGAACCTATCGGCAT | 130 |
| R: CACAAAGCCTGCGTTCATTC | ||
| LncR 3 | F: AGGATGTGACTGCCAGGTAATG | 100 |
| R: CAGACCCAGCCTAGCACACAG | ||
| LncR 33′ | F: GTGACCCAACTAGAGCCAATAGG | 135 |
| R: CTCAAATCAGCTCATGACCATAAG | ||
| LncR 7-1 | F: AGGCTACAGGAGGCACTGAGGG | 144 |
| R: GGAGCCATCTGGGAGAATGAAATAC | ||
| LncR 7-2 | F: GAGGCTACAGGAGGCACTCTTTG | 79 |
| R: GGAGCCATCTGGGAGAATGAAATAC | ||
| LncR 73′ | F: TCGGGTTCTTGATTTGATTCTC | 142 |
| R: TGGACCAAGTATCCTCTAAAAATG | ||
| LncR 8 | F: GGTTTTTTGACCTTGGCAATG | 102 |
| R: GTGACCCTTGGTGGCTGTTTAT | ||
| LncR 83′ | F: GATTCTGTCTCATCCAATCAAGACT | 123 |
| R: GTTGTGCTGAGGATTCTGGGT | ||
| LncR 10 | F: CGGAAATGCCTAATCTGAACTT | 80 |
| R: TAGAGCGGACCCACGAAAC | ||
| LncR 103′ | F: CCCCTGATGCTTCATAATGG | 111 |
| R: AGTTCTAACCTAATTTCCCATCAC |
This table lists the sequence of primers for each lncRNA target and the size of amplicons. Two different sets of primers were purchased for lncRs 3, 7, 8, 10. One targets the 5′ end of the sequence, the other the 3′ end. Primers targeting the 3′end of the lncRNA sequences were labeled with 3′. F: Forward, R: Reverse.
Table 2.
Primers for HCV, reference genes, and ISGs.
| Target Gene | Primer Sequences (5′-3′) | Amplicon Size (bp) |
|---|---|---|
| GAPDH | F: GAGTCAACGGATTTGGTCGT | 224 |
| R: GATCTCGCTCCTGGAAGATG (= RT) | ||
| U6 | F: CTCGCTTCGGCAGCACA | 94 |
| R: AACGCTTCACGAATTTGCGT | ||
| U99 | F: CCTCCTTTTCTTGGCGGGGA | 138 |
| R: CGTTTGAGGATAGAACCAGC | ||
| β-actin | F: CATGTACGTTGCTATCCAGGC | 250 |
| R: CTCCTTAATGTCACGCACGAT | ||
| Jc1-NS3 | RT: GTATGCCACGGCATTCAAG | 190 |
| F: GATATAGGTCGACGGCTCCA | ||
| R: TTCCTCGGAACAACCATCTC | ||
| GAS5 | F: CCTGTGAGGTATGGTGCTGG | 383 |
| R: GGTCCAGGCAAGTTGGACTC | ||
| ITM2C | F: GTGGTGTGCTGTATGAGGACT | 93 |
| R: CGTAGTTCTCGTCGAGGTAGAT | ||
| GPR55 | F: GAAAACCCTACAGTTTGCAGTCC | 123 |
| R: GAGGTGGCAGCATAATCGGG | ||
| CXCL10 | F: GTGGCATTCAAGGAGTACCTC R: TGATGGCCTTCGATTCTGGATT | 198 |
| ISG15 | F: ACTCATCTTTGCCAGTACAGGAG R: CAGCATCTTCACCGTCAGGTC | 88 |
| Mx1 | F: TGCATCGACCTCATTGACTC R: ACCTTGCCTCTCCACTTATC | 218 |
| IFITM1 | F: ACTCCGTGAAGTCTAGGGACA R: AGAGCCGAATACCAGTAACAG | 149 |
| MDA5 | F:TCGAATGGGTATTCCACAGACG | 152 |
| R:GTGGCGACTGTCCTCTGAA | ||
| IFN-β | F:GCTTGGATTCCTACAAAGAAGCA | 166 |
| R:ATAGATGGTCAATGCGGCGTC | ||
| IFN-α | F: GGAGGTTGTCAGAGCAGA | 150 |
| R: AATGACAGAATTCATGAAAGCGT | ||
| IL28A | F: CAGCCTCAGAGTGTTTCTTCT | 117 |
| R: TCCAGTCACGGTCAGCA |
This table lists the sequence of primers and the size of amplicons for targets including HCV NS3 coding region, reference genes and ISGs. F: Forward, R: Reverse, RT: Reverse transcription.
Table 3.
Characteristics of the lncRNA candidates.
| lncRNA | Ref. | Chr | Length(bp) | Gene Symbol | Name |
|---|---|---|---|---|---|
| lncR 3 | NR_033376.1 | 6 | 1753 | lincRNA 222 | LINC00222 |
| lncR 7-2 | NR_104615.1 | 5 | 3451 | LOC100506688 | Lnc-SLC12A7-4:5 |
| lncR 8 | NR_038238.1 | 2 | 1893 | LOC151484 | Lnc-ITM2C-1 |
| lncR 10 | NR_026974.1 | 8 | 3250 | ZNF252P antisense RNA 1 | ZNF252P-AS1 |
Ref.: NCBI Reference Sequence.
Table 4.
Protein-coding potential of lncRNAs.
| Metric | lncR 3 | lncR 7-2 | lncR 8 | lncR 10 |
|---|---|---|---|---|
| CPAT coding probability | 1.33% | 10.83% | 69.31% | 80.45% |
| PhyloCSF score | −67.4569 | 13.6639 | −112.1426 | 11.7381 |
| PRIDE reprocessing 2.0 | 0 | 0 | 0 | 0 |
| Lee translation initiation sites | 0 | 0 | 0 | 0 |
| Bazzini small ORFs | 0 | 0 | 0 | 0 |
The table lists the results of analysis using different metrics to address the protein-coding potential of candidates from LNCipedia. 5.2 (http://www.lncipedia.org).
© 2019 by the authors. Licensee MDPI, Basel, Switzerland. This article is an open access article distributed under the terms and conditions of the Creative Commons Attribution (CC BY) license (http://creativecommons.org/licenses/by/4.0/).
Share and Cite
MDPI and ACS Style
Hu, P.; Wilhelm, J.; Gerresheim, G.K.; Shalamova, L.A.; Niepmann, M. Lnc-ITM2C-1 and GPR55 Are Proviral Host Factors for Hepatitis C Virus. Viruses 2019, 11, 549. https://0-doi-org.brum.beds.ac.uk/10.3390/v11060549
AMA Style
Hu P, Wilhelm J, Gerresheim GK, Shalamova LA, Niepmann M. Lnc-ITM2C-1 and GPR55 Are Proviral Host Factors for Hepatitis C Virus. Viruses. 2019; 11(6):549. https://0-doi-org.brum.beds.ac.uk/10.3390/v11060549
Chicago/Turabian StyleHu, Pan, Jochen Wilhelm, Gesche K. Gerresheim, Lyudmila A. Shalamova, and Michael Niepmann. 2019. "Lnc-ITM2C-1 and GPR55 Are Proviral Host Factors for Hepatitis C Virus" Viruses 11, no. 6: 549. https://0-doi-org.brum.beds.ac.uk/10.3390/v11060549
Note that from the first issue of 2016, this journal uses article numbers instead of page numbers. See further details here.