
The Bacteriophage Pf-10—A Component of the Biopesticide “Multiphage” Used to Control Agricultural Crop Diseases Caused by Pseudomonas syringae

 , , ,
, , , 
Abstract
:1. Introduction
2. Materials and Methods
2.1. Bacterial Strains and Culture Conditions
2.2. Phage Isolation and Propagation
2.3. Transmission Electron Microscopy
2.4. Host Range
2.5. Thermal and pH Stability Tests
2.6. The Effects of Ca2+ and Mg2+ on the Killing Activity of Pf-10
2.7. Adsorption Assay
2.8. One-Step Growth Curve
2.9. Genome Sequencing, Assembly and Sequence Analysis
2.10. The Genome Packaging Strategy
2.11. Comparative Genomics
2.12. Accession Number
2.13. Statistical Analysis
3. Results and Discussion
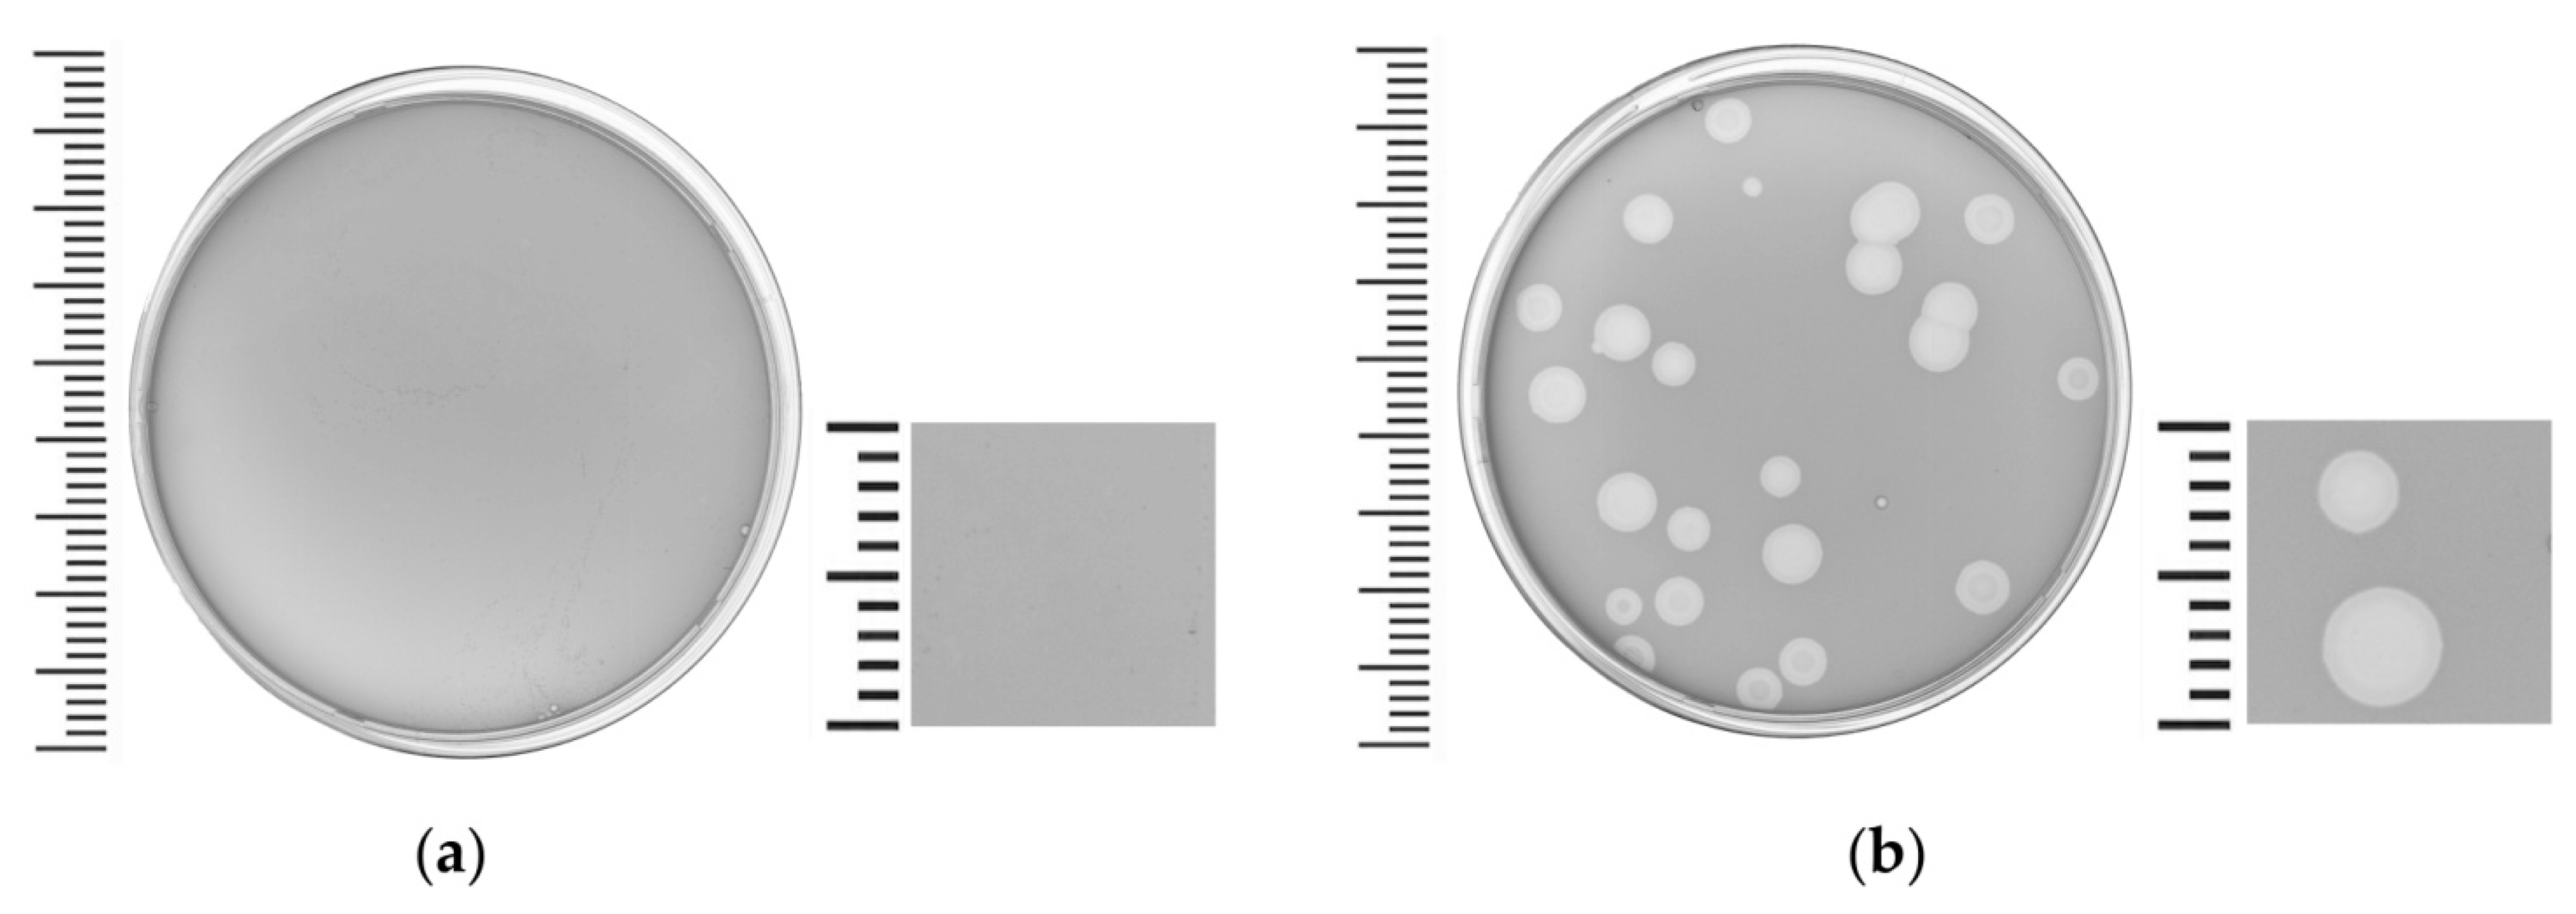
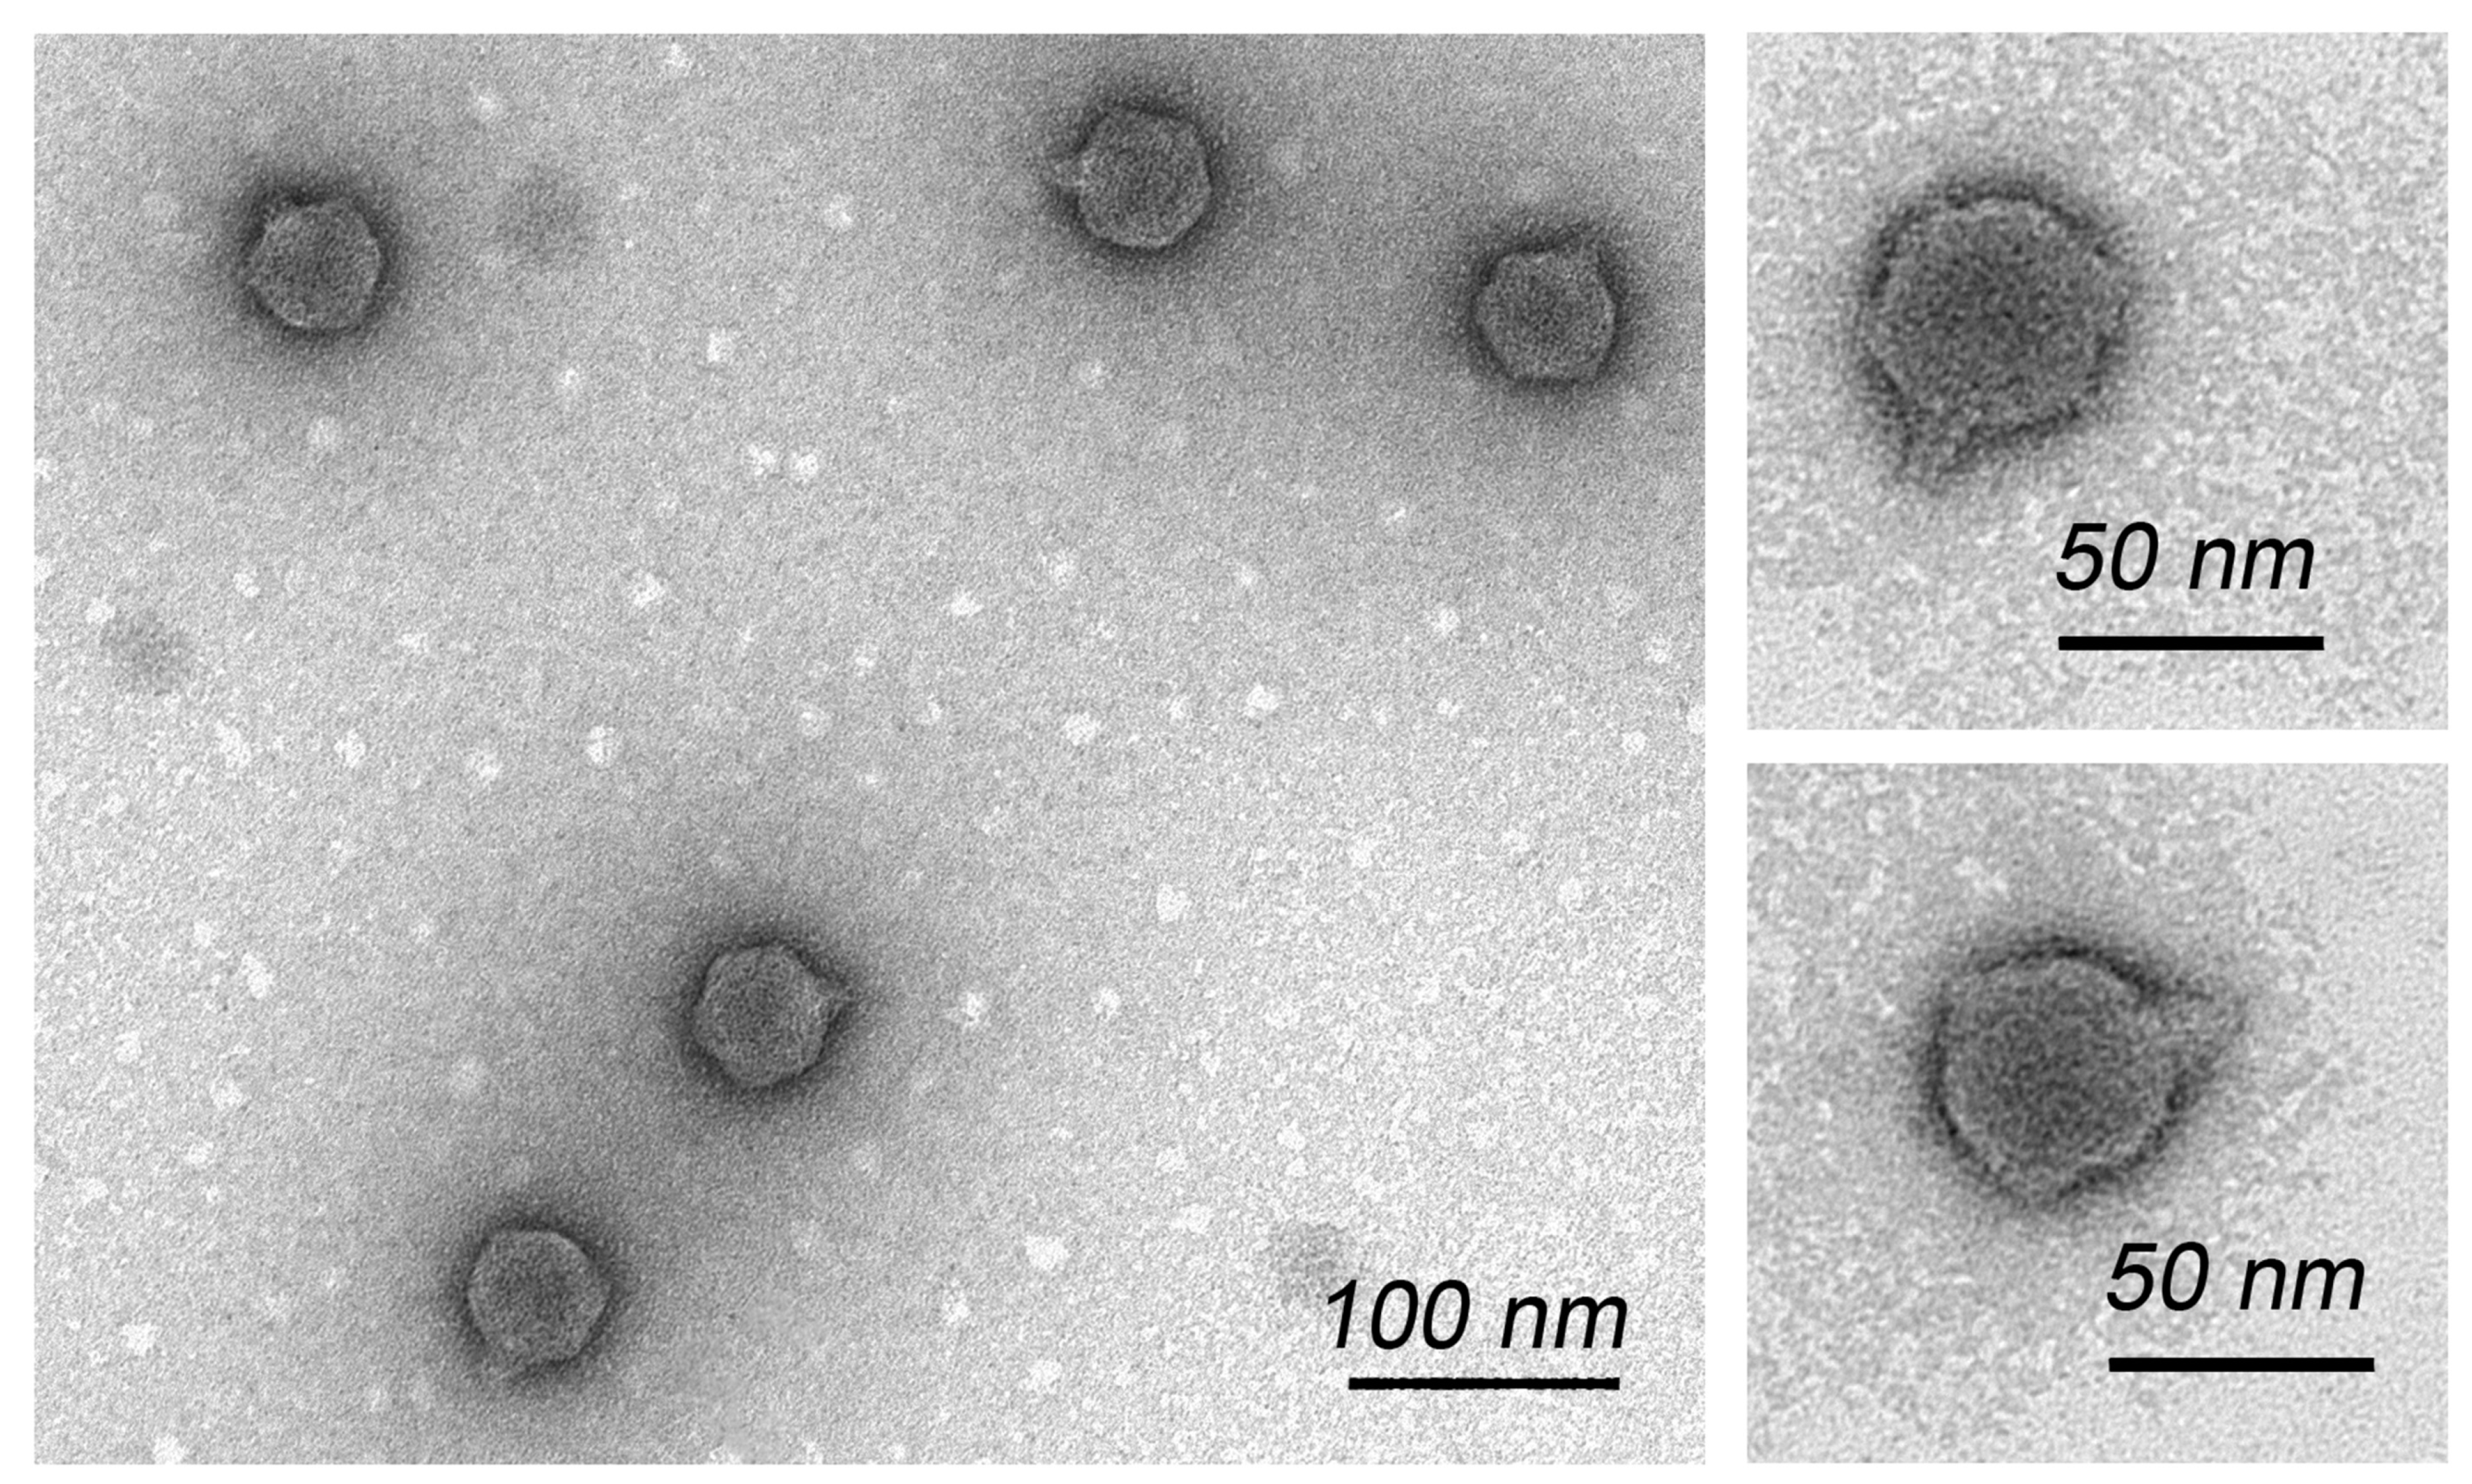
3.1. Phage Isolation, Host Range and Morphology


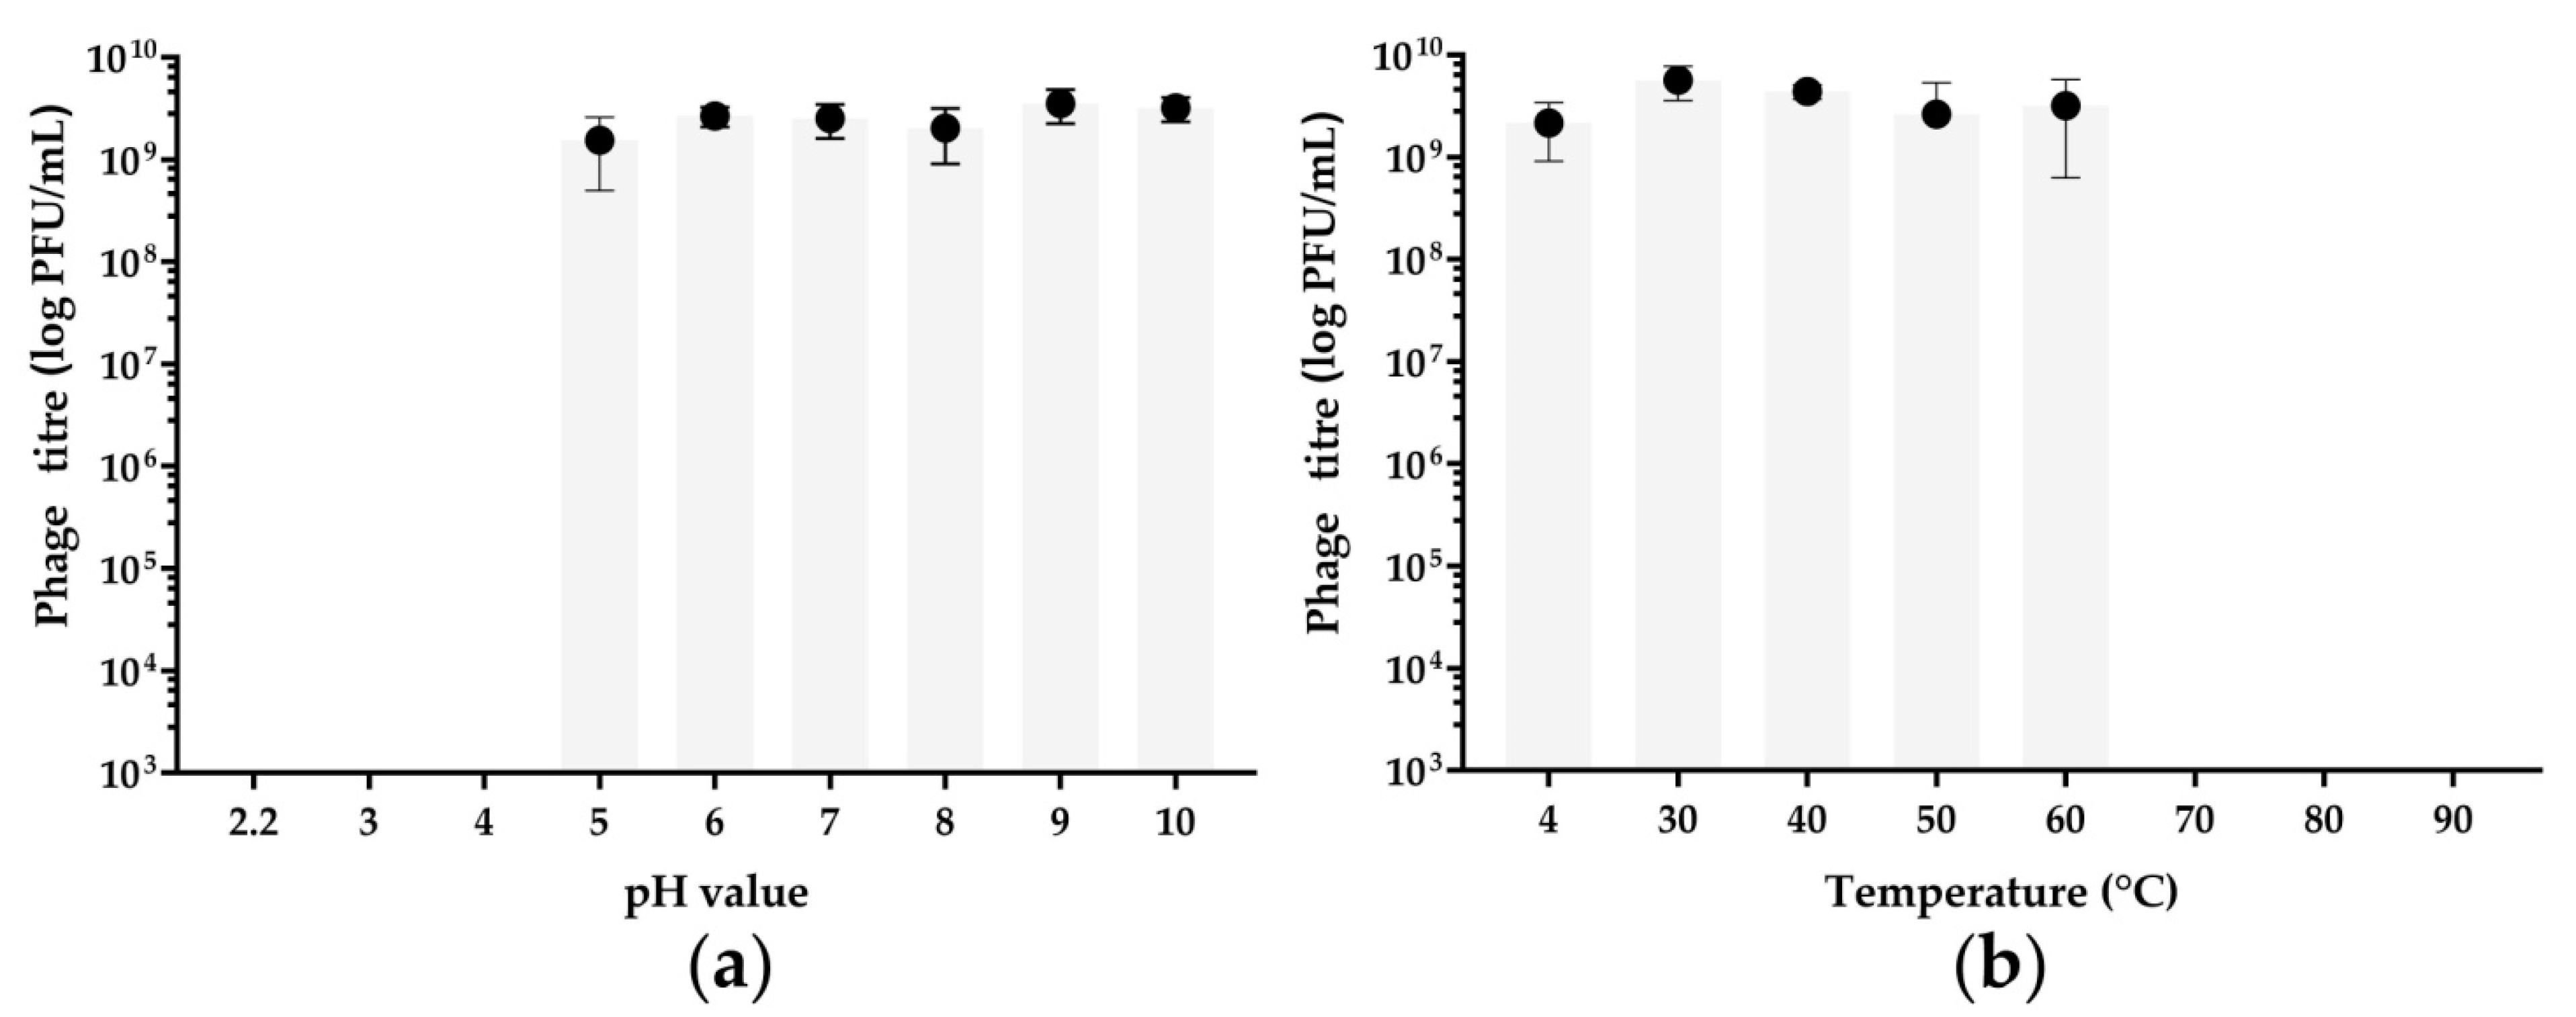
3.2. pH and Thermal Stability Tests
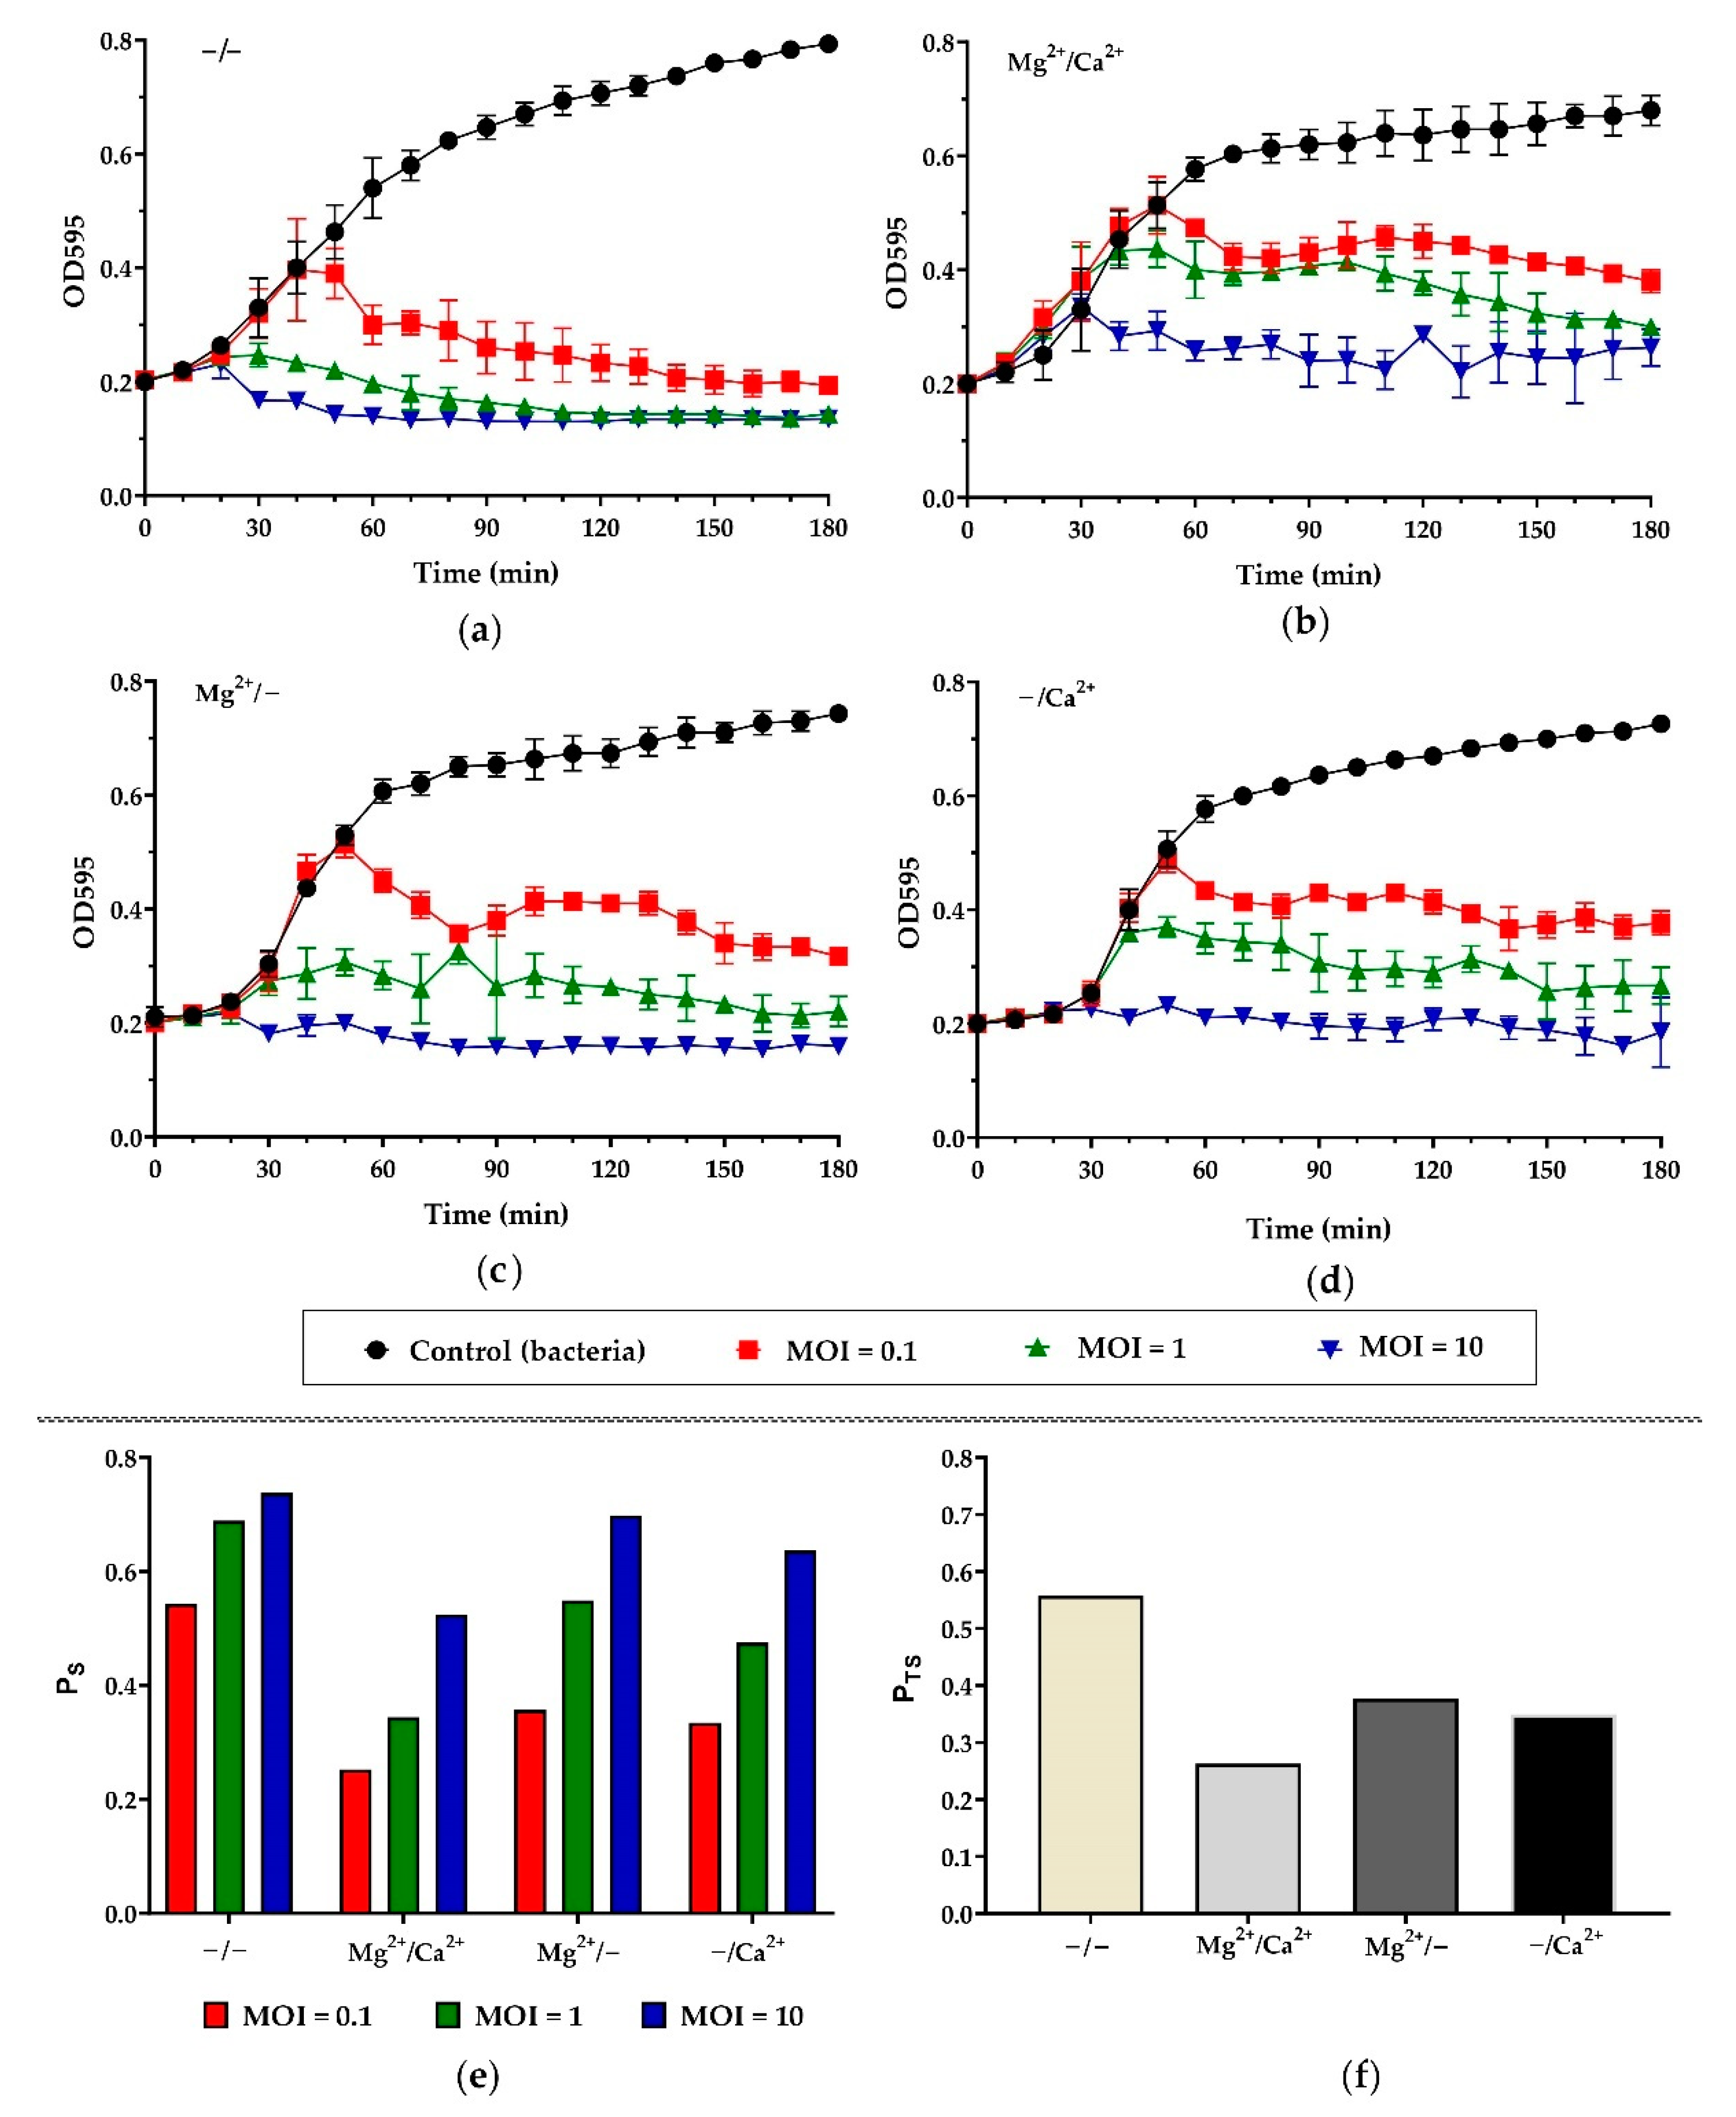
3.3. Killing Assay and the Effect of Ca2+ and Mg2+ on the Killing Activity of Pf-10

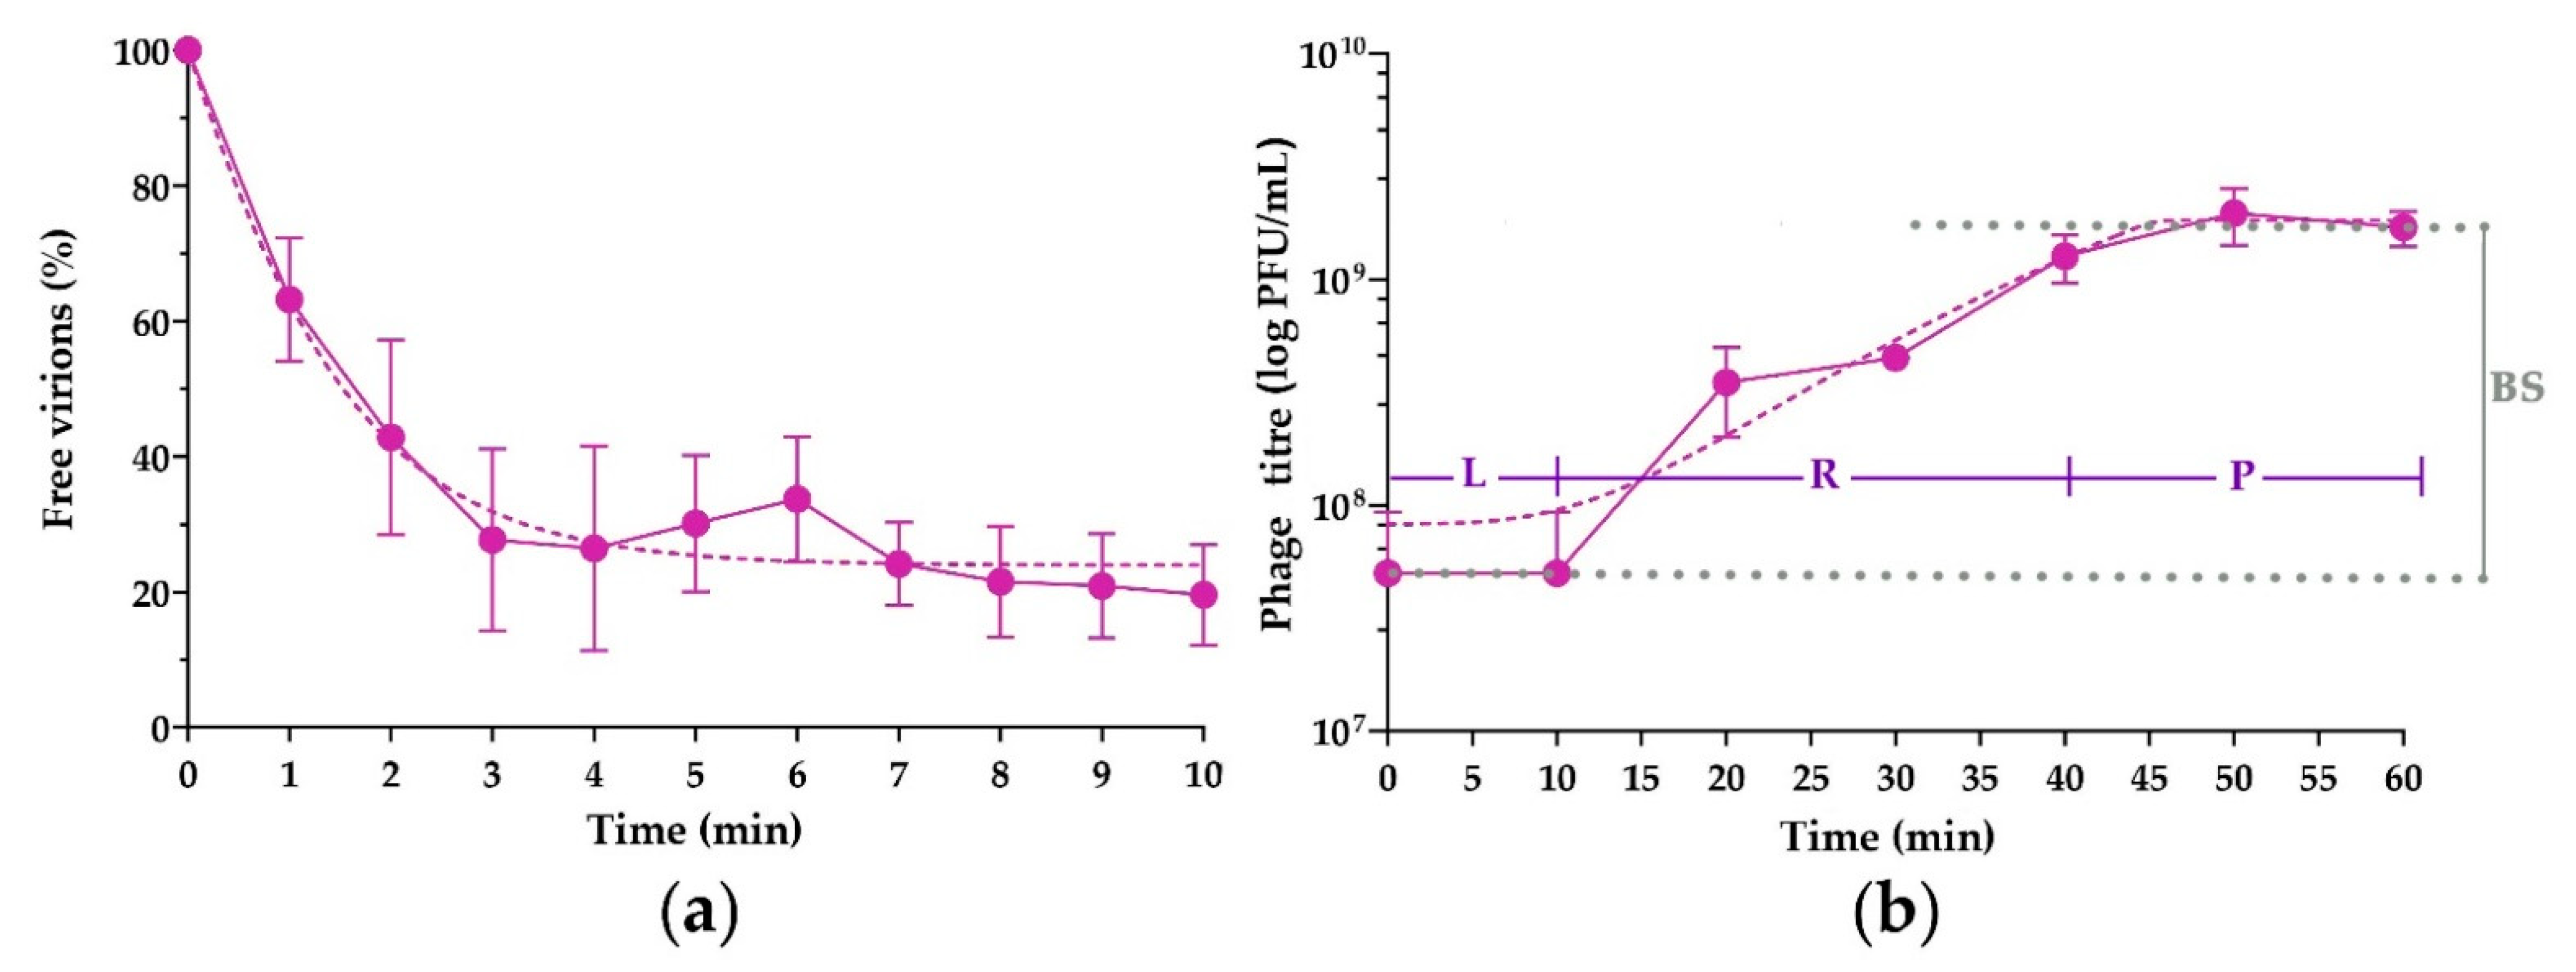
3.4. Adsorption Assay and One-Step Growth Curve
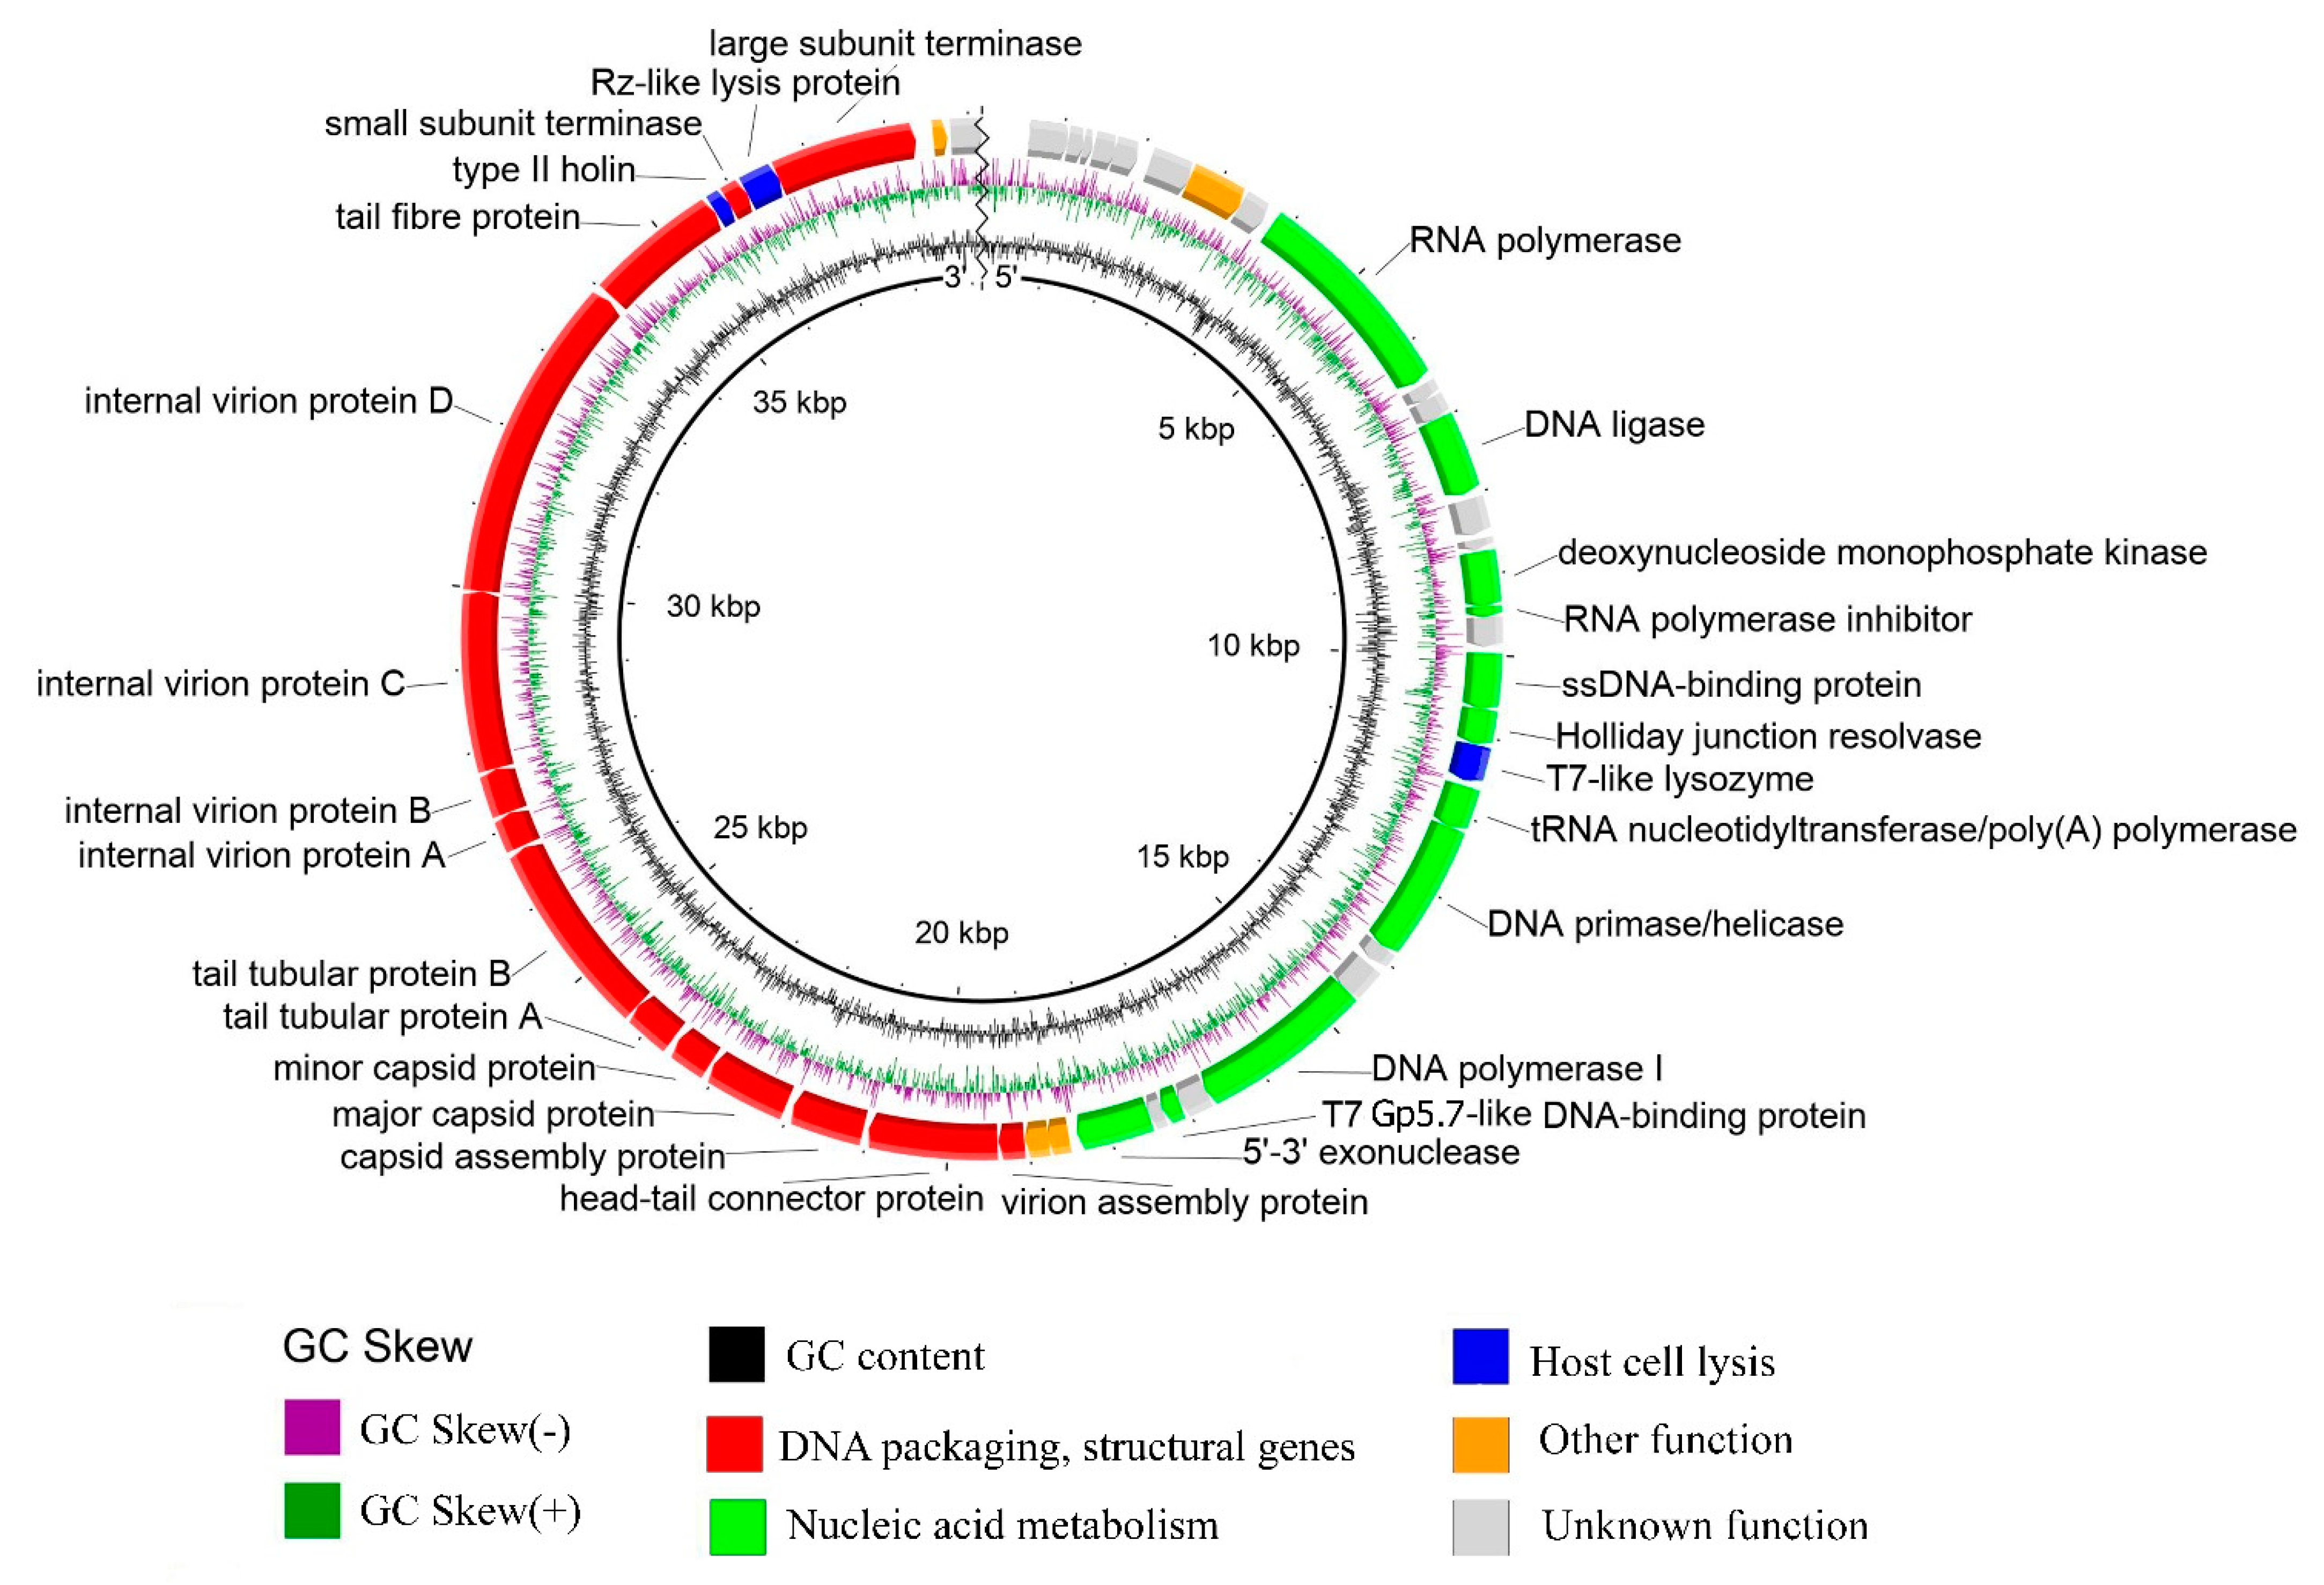
3.5. General Genome Organization
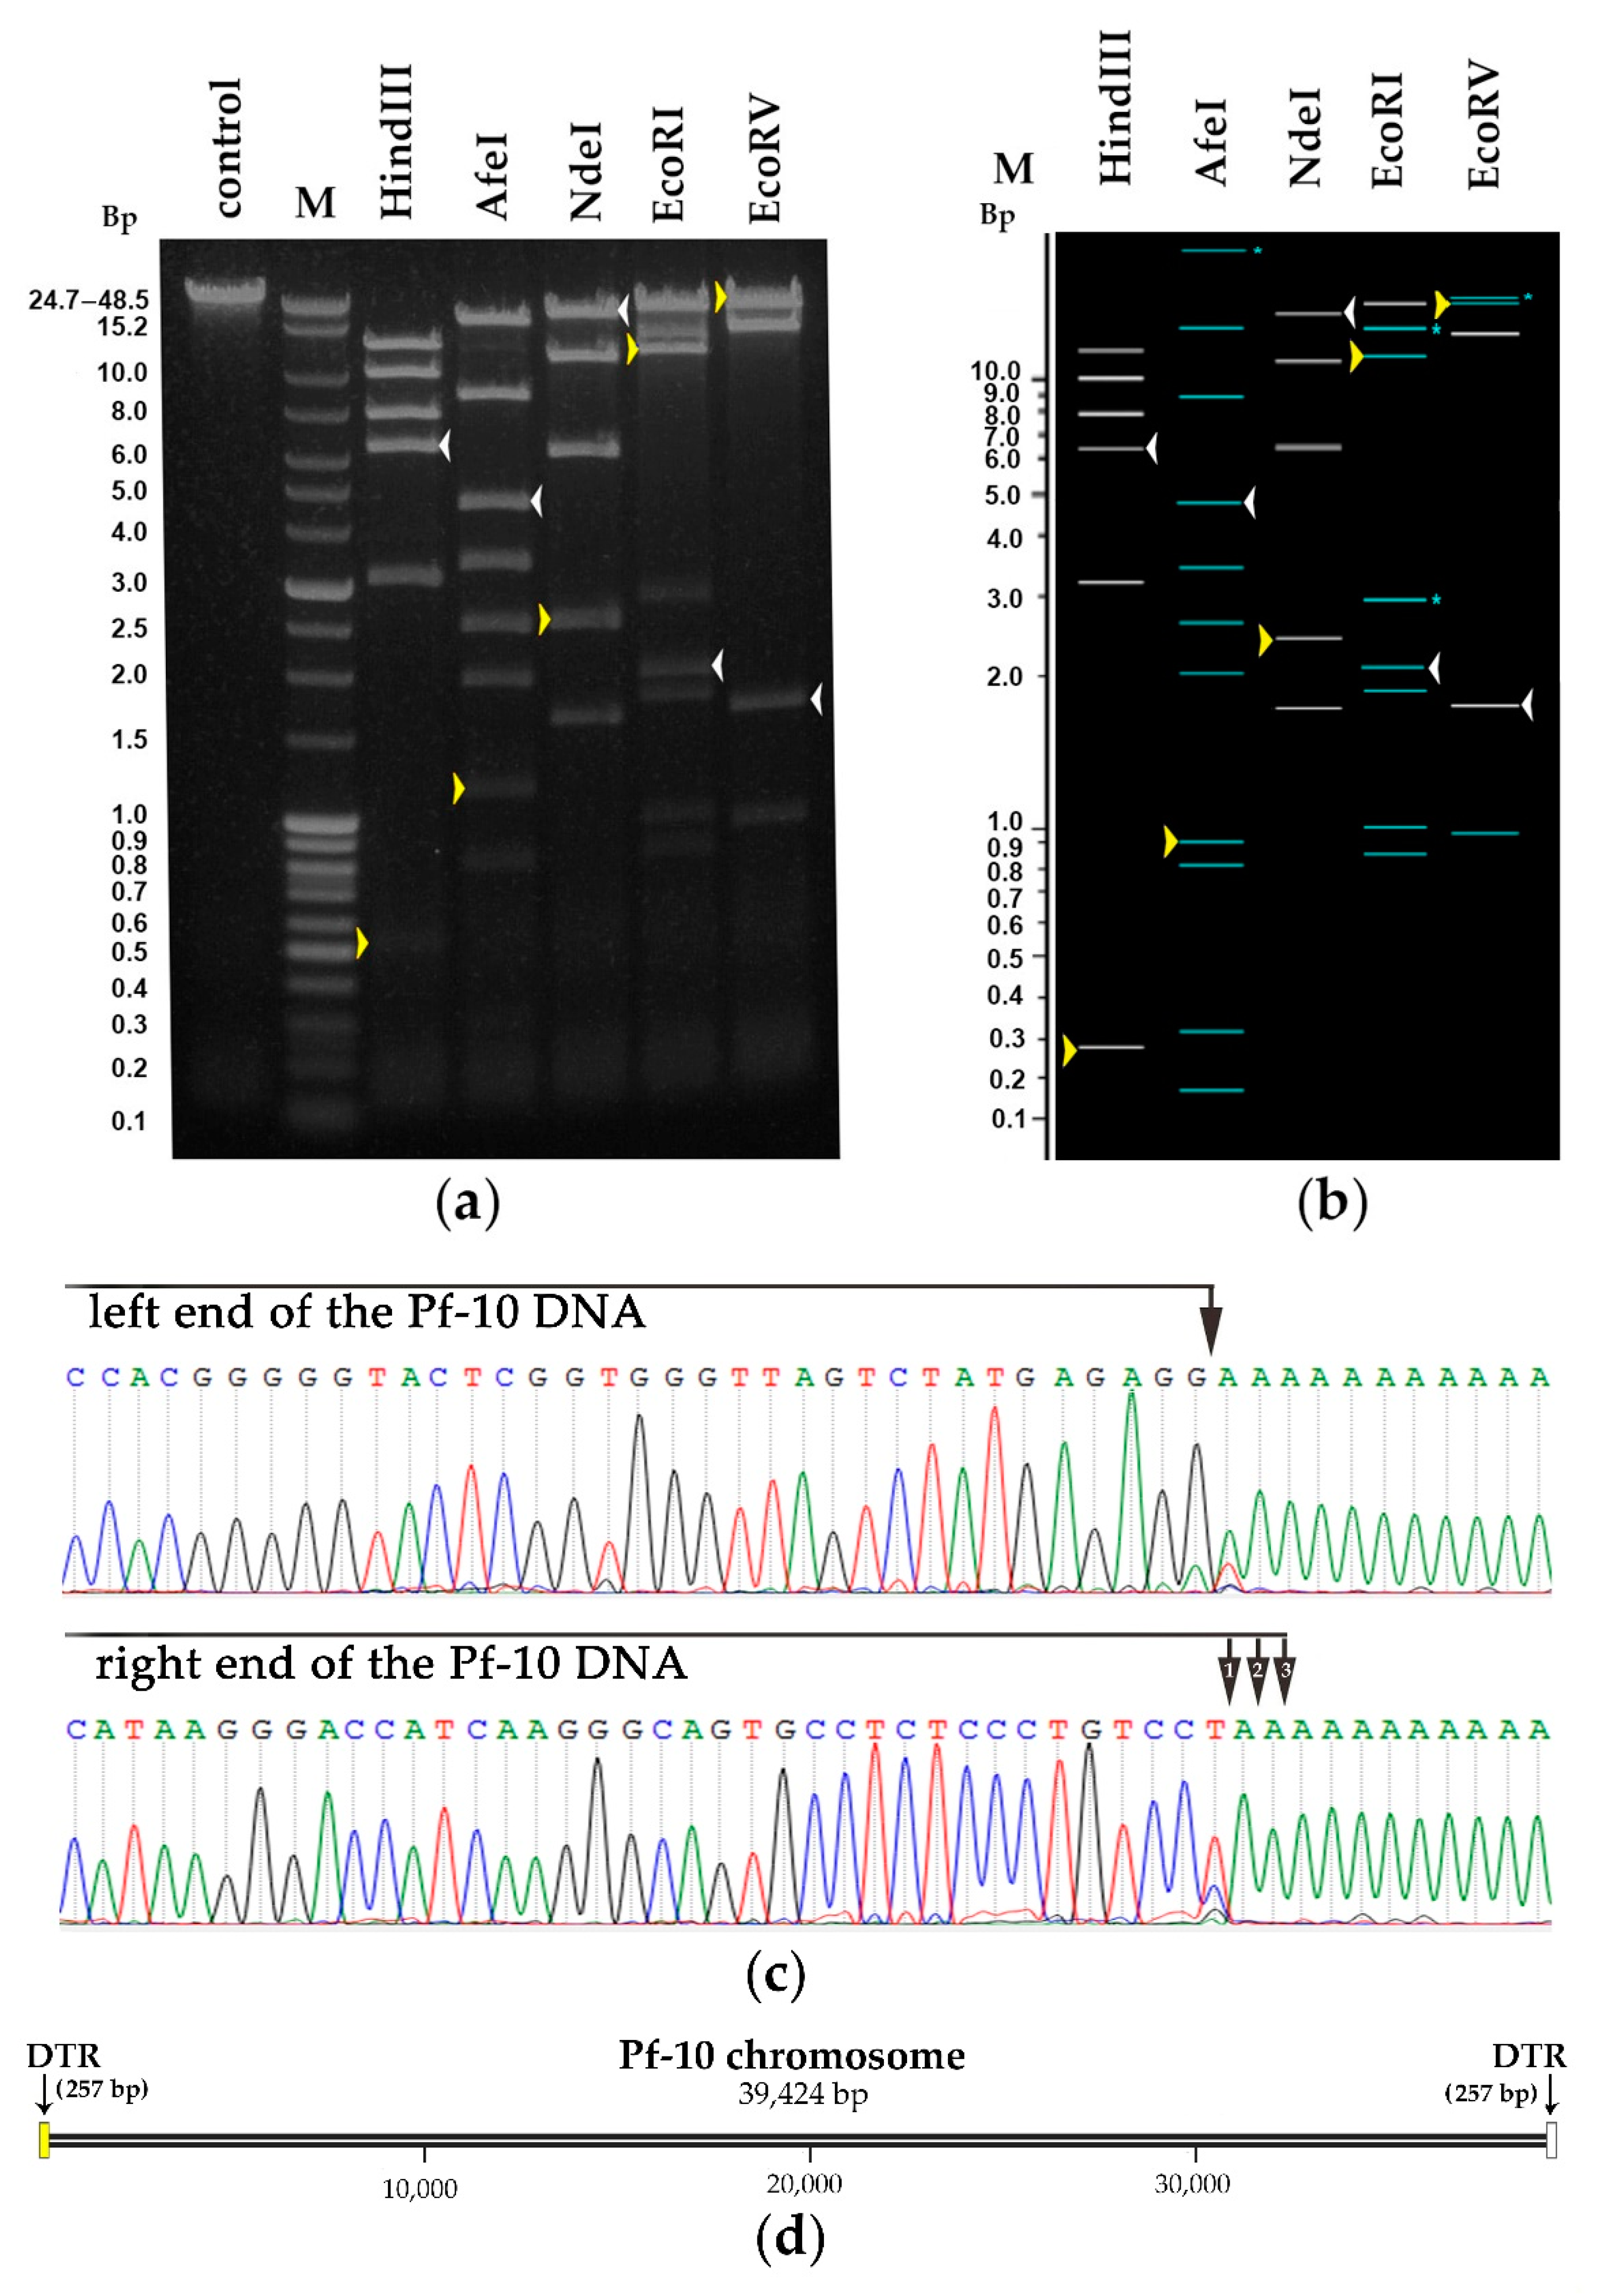
3.5.1. DNA Packaging Genes and the Genome Packaging Strategy
3.5.2. Structure/Morphogenesis and Lytic Genes
3.5.3. Replication Genes
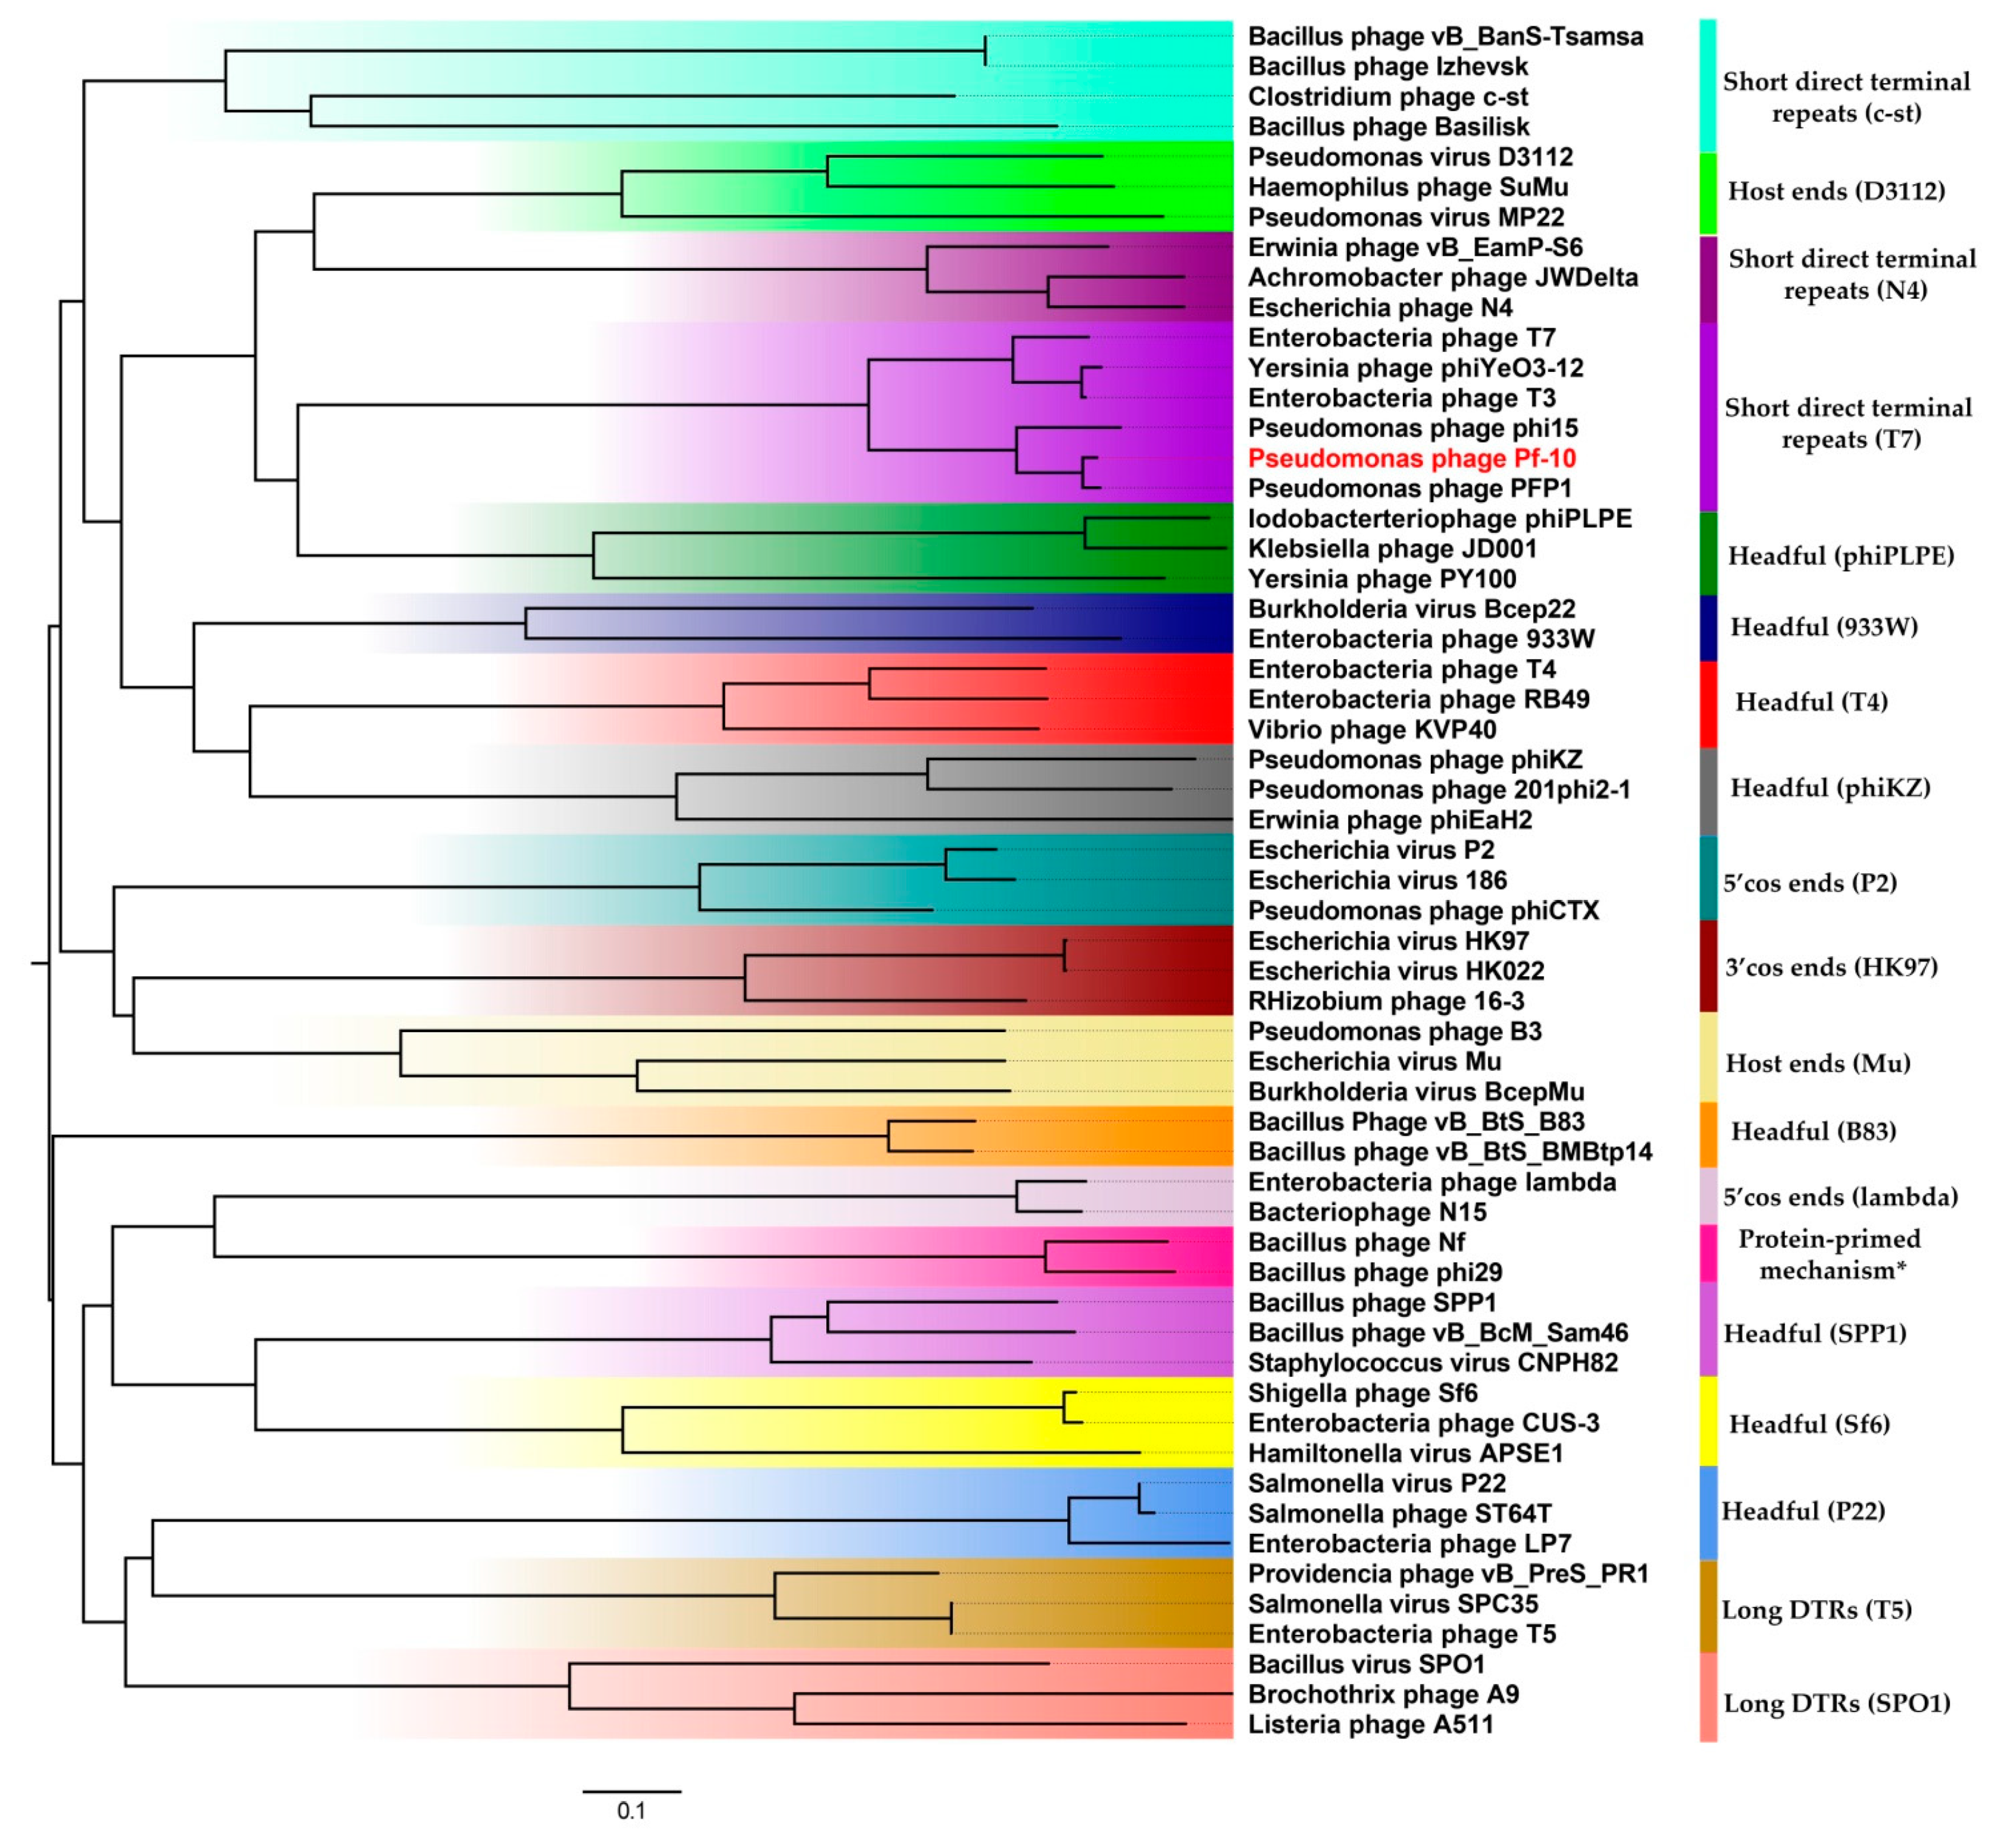
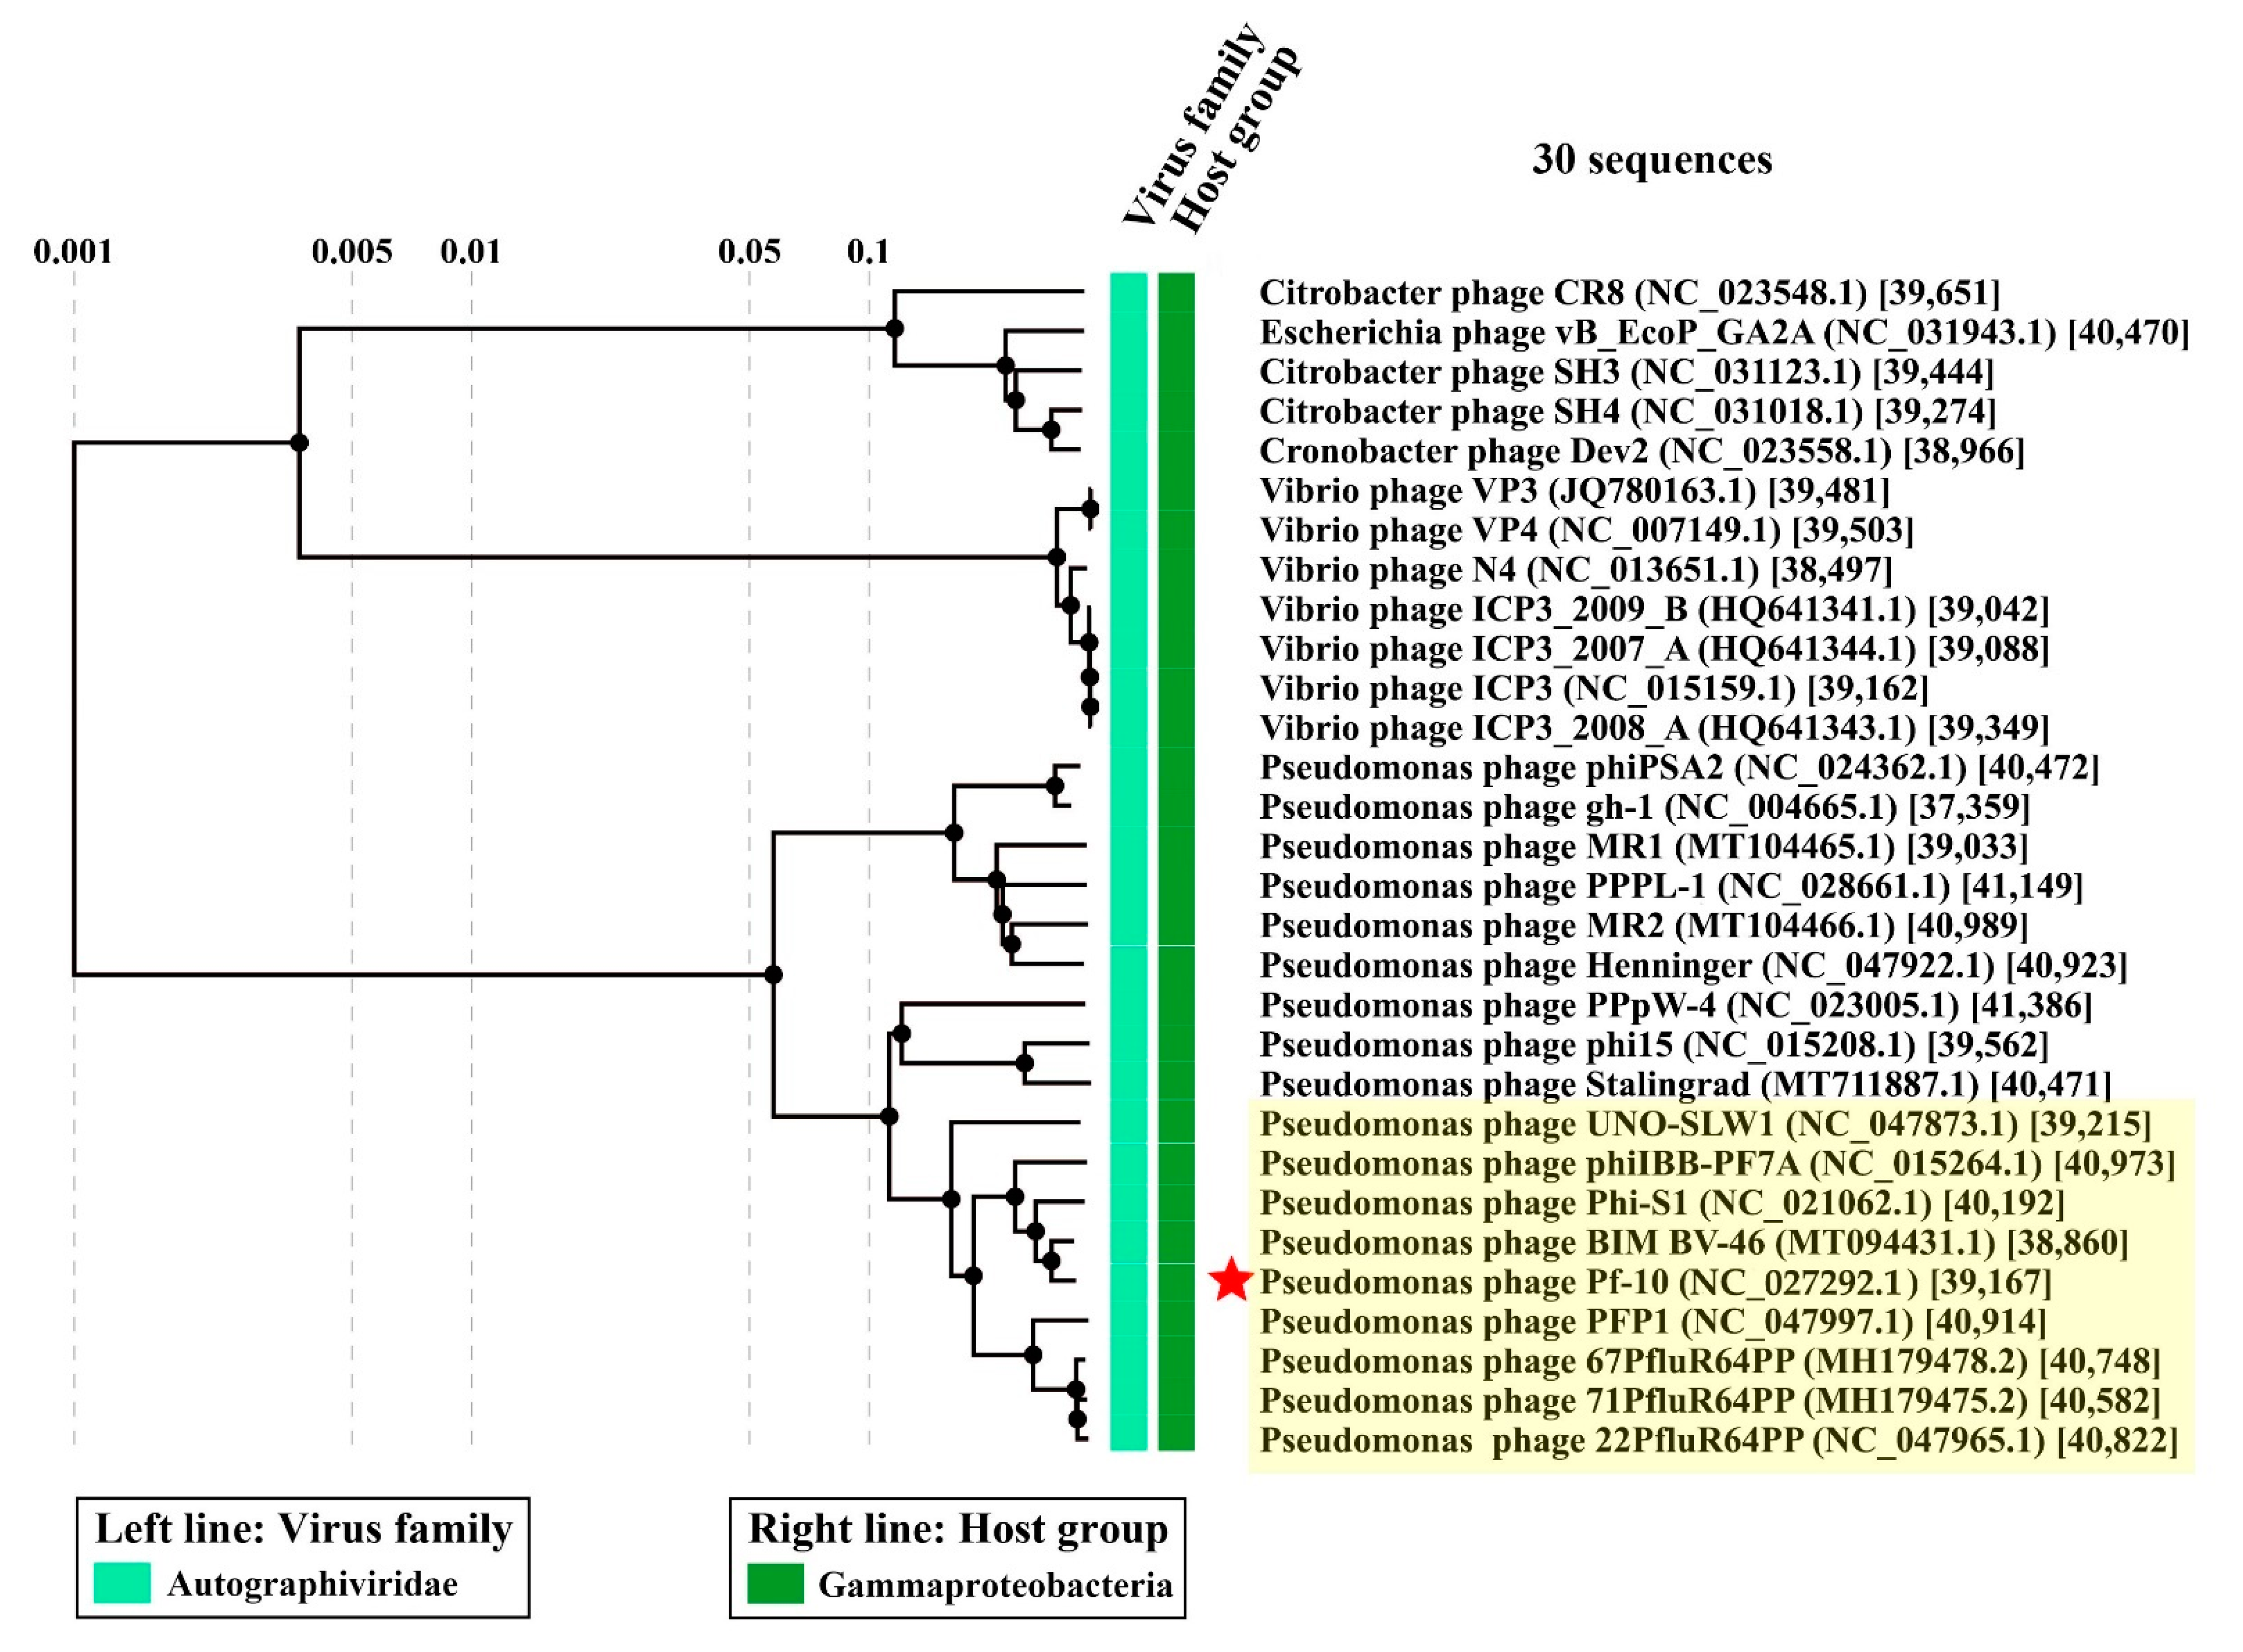
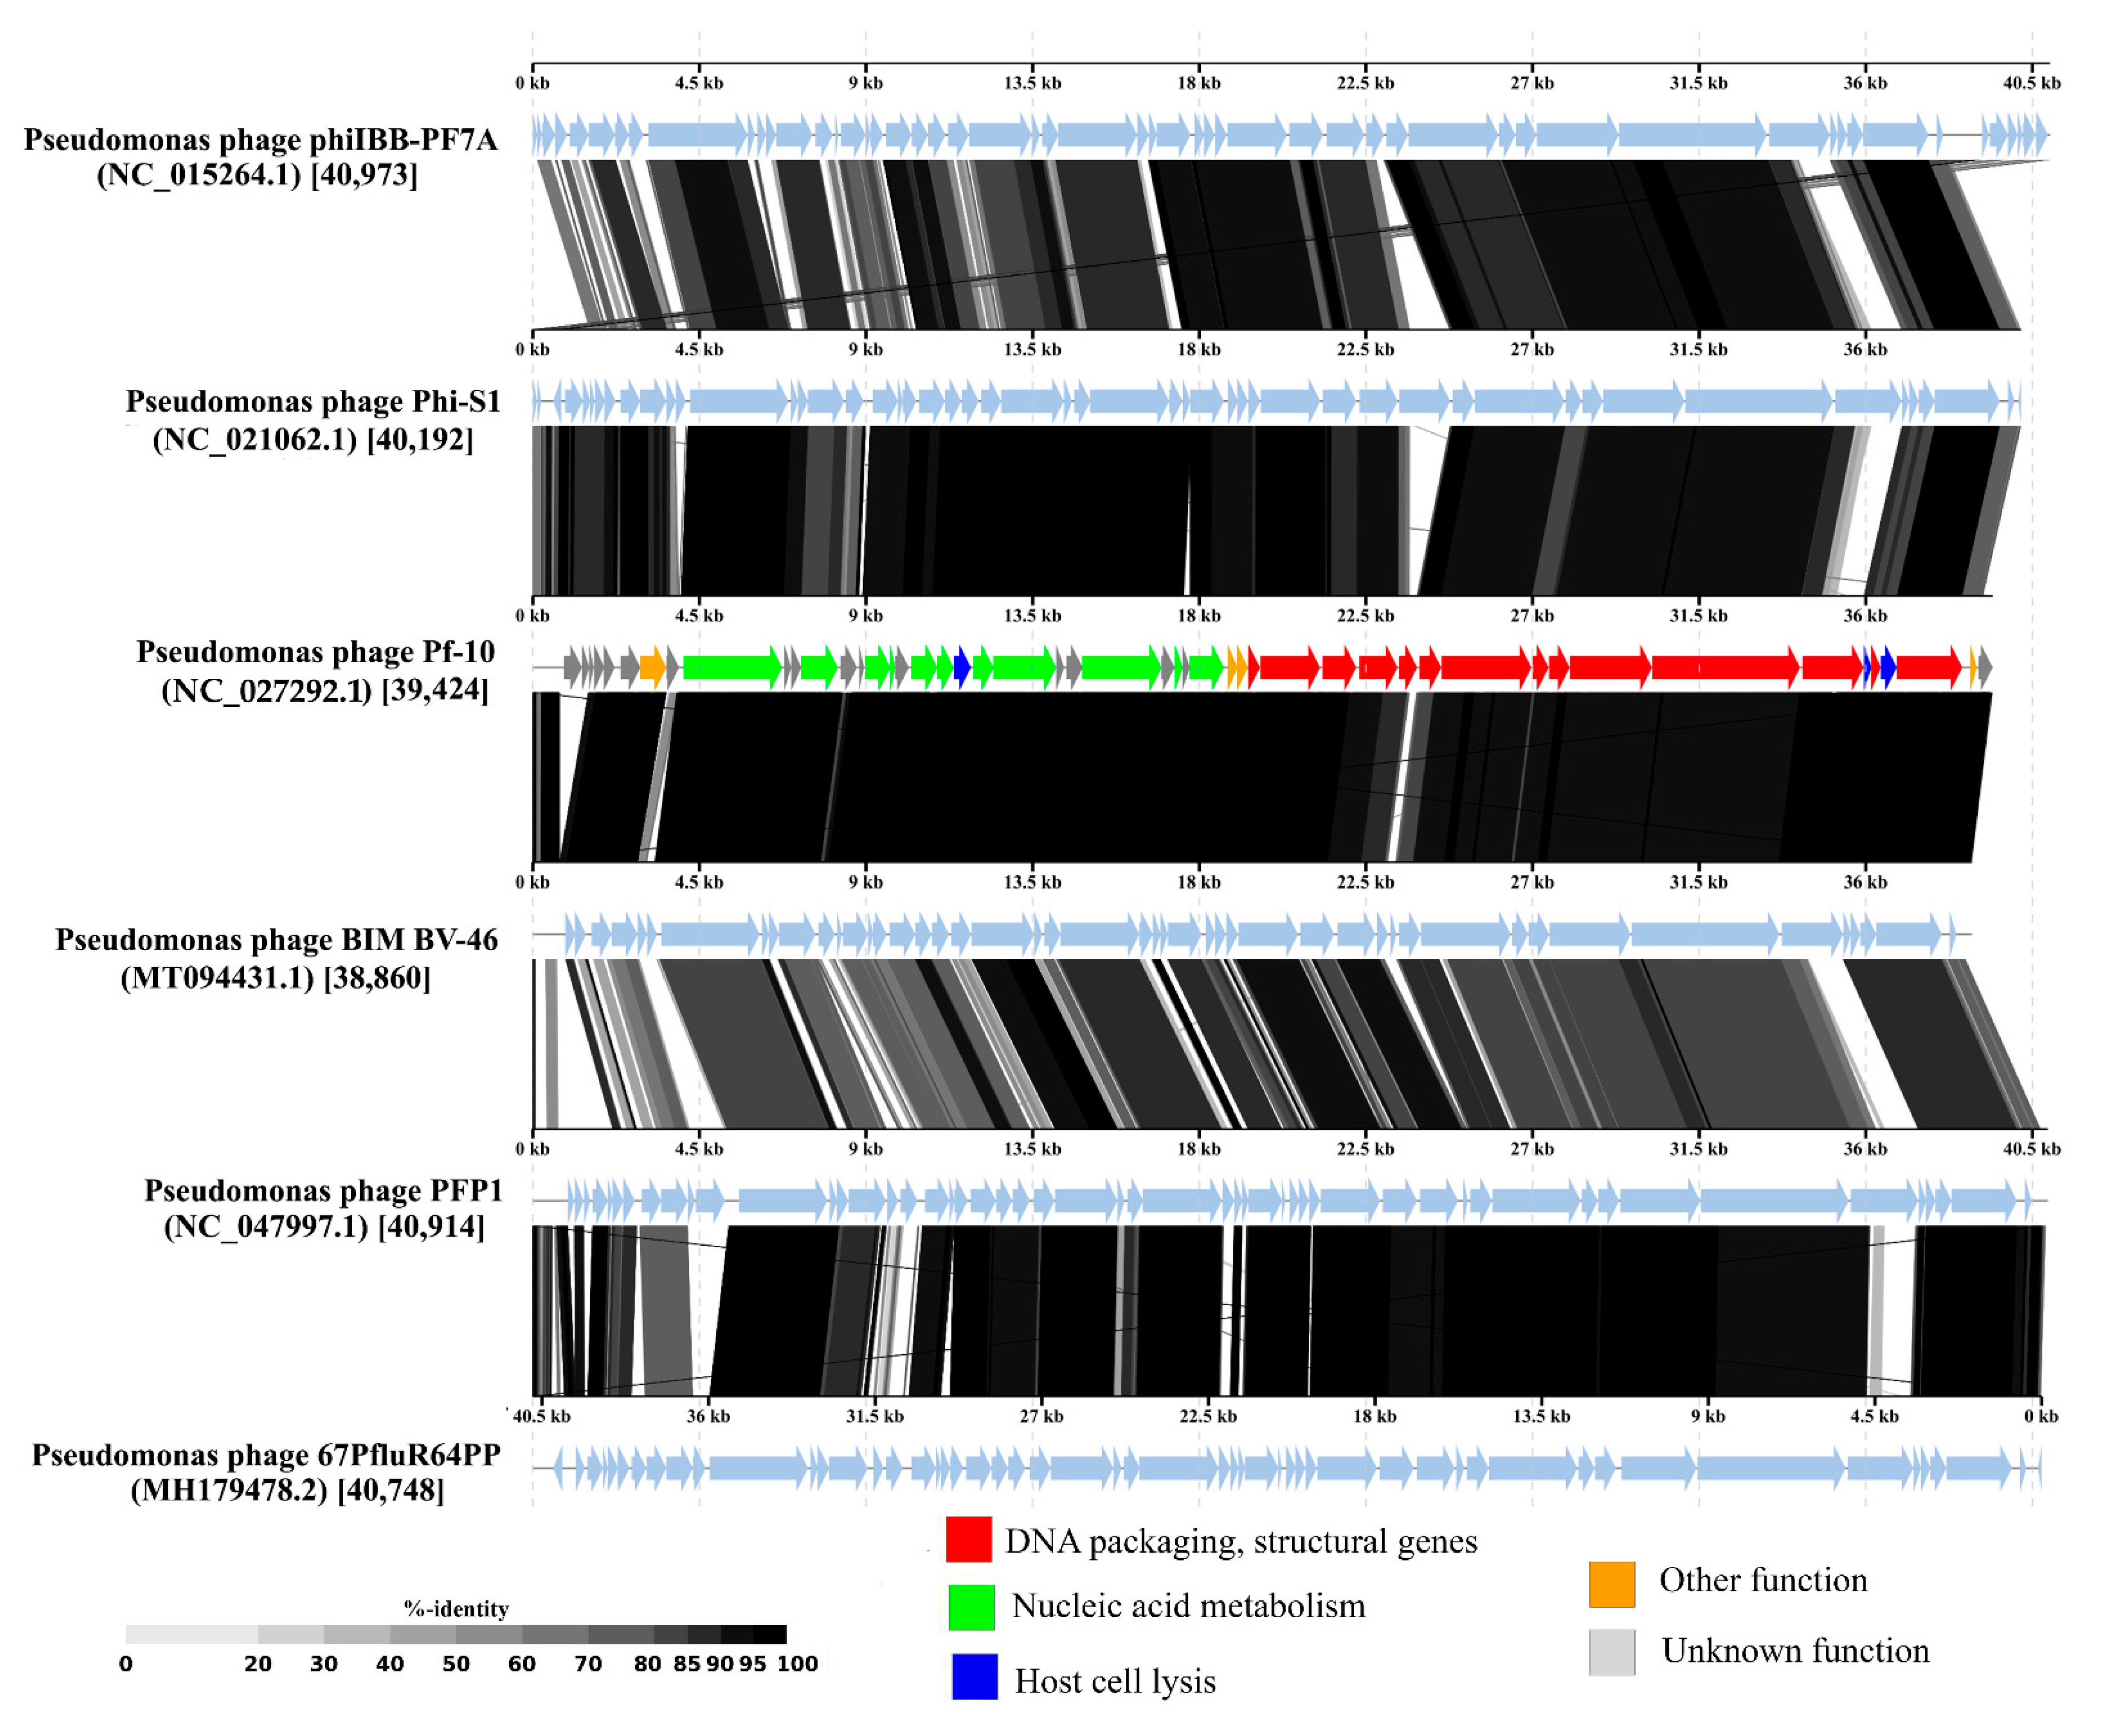
3.6. Comparative Genomics
4. Conclusions
Supplementary Materials
Author Contributions
Funding
Institutional Review Board Statement
Informed Consent Statement
Data Availability Statement
Acknowledgments
Conflicts of Interest
References
- Kałużna, M.; Willems, A.; Pothier, J.F.; Ruinelli, M.; Sobiczewski, P.; Puławska, J. Pseudomonas cerasi sp. nov. (non Griffin, 1911) isolated from diseased tissue of cherry. Syst. Appl. Microbiol. 2016, 39, 370–377. [Google Scholar] [CrossRef] [PubMed]
- Moragrega, C.; Llorente, I.; Manceau, C.; Montesinos, E. Susceptibility of European pear cultivars to Pseudomonas syringae pv. syringae using immature fruit and detached leaf assays. Eur. J. Plant Pathol. 2003, 109, 319–326. [Google Scholar] [CrossRef]
- Saygili, H.; Aysan, Y.; Ustun, N.; Mirik, M.; Sahin, F. Tomato Pith Necrosis Disease Caused by Pseudomonas species in Turkey. In Pseudomonas syringae Pathovars and Related Pathogens—Identification, Epidemiology and Genomics; Fatimi, M., Collmer, A., Sante Iacobellis, N., Mansfield, J.W., Murillo, J., Schaad, N.W., Ullrich, M., Eds.; Springer: Dordrecht, The Netherlands, 2008. [Google Scholar]
- Gross, D.C.; DeVay, J.E. Role of syringomycin in holcus spot of maize and systemic necrosis of cowpea caused by Pseudomonas syringae. Physiol. Plant Pathol. 1977, 11, 1–11. [Google Scholar] [CrossRef]
- Glass, N.L.; Kosuge, T. Cloning of the gene for indoleacetic acid-lysine synthetase from Pseudomonas Syringae subsp. savastanoi. J. Bacteriol. 1986, 166, 598–603. [Google Scholar] [CrossRef] [Green Version]
- Brathwaite, C.W.; Dickey, R.S. Production of basal soft rot symptom and maceration of carnation tissue by Pseudomonas caryophylli and Corynebacterium species. Phytopathology 1970, 60, 1040–1045. [Google Scholar] [CrossRef]
- Krejzar, V.; Mertelík, J.; Pánková, I.; Kloudová, K.; Kudela, V. Pseudomonas marginalis associated with soft rot of Zantedeschia spp. Plant Prot. Sci. 2008, 44, 85–90. [Google Scholar] [CrossRef] [Green Version]
- Iličić, R.; Jelušić, A.; Marković, S.; Barać, G.; Bagi, F.; Popović, T. Pseudomonas cerasi, the new wild cherry pathogen in Serbia and the potential use of recG helicase in bacterial identification. Ann. Appl. Biol. 2021, 12717. [Google Scholar] [CrossRef]
- Mazzaglia, A.; Studholme, D.J.; Taratufolo, M.C.; Cai, R.; Almeida, N.F.; Goodman, T.; Guttman, D.S.; Vinatzer, B.A.; Balestra, G.M. Pseudomonas syringae pv. actinidiae (PSA) isolates from recent bacterial canker of kiwifruit outbreaks belong to the same genetic lineage. PLoS ONE 2012, 7, e36518. [Google Scholar] [CrossRef]
- Choi, O.; Kang, B.; Lee, Y.; Kim, S.; Oh, J.; Kim, H.; Kim, J. Bacterial shoot blight caused by Pseudomonas cerasi, a new pathogen of pear tree. Australas. Plant Dis. Notes 2020, 15, 24. [Google Scholar] [CrossRef]
- Freeman, B.C.; Beattie, G.A. Bacterial growth restriction during host resistance to Pseudomonas syringae is associated with leaf water loss and localized cessation of vascular activity in Arabidopsis thaliana. Mol. Plant-Microbe Interact. 2009, 22, 857–867. [Google Scholar] [CrossRef] [Green Version]
- Arrebola, E.; Cazorla, F.M.; Perez-García, A.; de Vicente, A. Chemical and metabolic aspects of antimetabolite toxins produced by Pseudomonas syringae pathovars. Toxins 2011, 3, 1089–1110. [Google Scholar] [CrossRef] [Green Version]
- Bender, C.L.; Alarcón-Chaidez, F.; Gross, D.C. Pseudomonas syringae phytotoxins: Mode of action, regulation, and biosynthesis by peptide and polyketide synthetases. Microbiol. Mol. Biol. Rev. 1999, 63, 266–292. [Google Scholar] [CrossRef] [Green Version]
- Dye, D.W.; Bradbury, J.F.; Goto, M.; Hayward, A.C.; Lelliott, R.A.; Schroth, M.N. International standards for naming pathovars of phytopathogenic bacteria and a list of pathovar names and pathotype strains. Rev. Plant Pathol. 1980, 59, 153–168. [Google Scholar]
- Young, J.M. Taxonomy of Pseudomonas syringae. J. Plant Pathol. 2010, 92, S1.5–S1.14. [Google Scholar]
- Uppalapati, S.R.; Ishiga, Y.; Wangdi, T.; Urbanczyk-Wochniak, E.; Ishiga, T.; Mysore, K.S.; Bender, C.L. Pathogenicity of Pseudomonas syringae pv. tomato on tomato seedlings: Phenotypic and gene expression analyses of the virulence function of coronatine. Mol. Plant-Microbe Interact. 2008, 21, 383–395. [Google Scholar] [CrossRef] [Green Version]
- Gašić, K.; Pavlović, Z.; Santander, R.D.; Meredith, C.; Aćimović, S.G. First report of Pseudomonas syringae pv. syringae associated with bacterial blossom blast on apple (Malus pumila) in the United States. Plant Dis. 2018, 102, 1848. [Google Scholar] [CrossRef]
- Cazorla, F.M.; Torés, J.A.; Olalla, L.; Pérez-García, A.; Farré, J.M.; de Vicente, A. Bacterial apical necrosis of mango in southern Spain: A disease caused by Pseudomonas syringae pv. syringae. Phytopathology 1998, 88, 614–620. [Google Scholar] [CrossRef] [PubMed] [Green Version]
- Latorre, B.A. Isolation of Pseudomonas syringae pv. syringae from cankers and effect of free moisture on its epiphytic populations on sweet cherry trees. Plant Dis. 1985, 69, 409–412. [Google Scholar] [CrossRef] [Green Version]
- Roos, I.M.M.; Hattingh, M.J. Systemic invasion of plum leaves and shoots by Pseudomonas syringae pv. syringae introduced into petioles. Phytopathology 1987, 77, 1253–1257. [Google Scholar] [CrossRef]
- Mohan, S.K.; Schaad, N.W. An improved agar plating assay for detecting Pseudomonas syringae pv. syringae and P. s. pv. phaseolicola in contaminated bean seed. Phytopathology 1987, 77, 1390–1395. [Google Scholar] [CrossRef]
- Toben, H.; Mavridis, A.; Rudolph, K.W.E. Basal glume rot (Pseudomonas syringae pv. atrofaciens) on wheat and barley in FRG and resistance screening of wheat. EPPO Bull. 1989, 19, 119–125. [Google Scholar] [CrossRef]
- Matveeva, I.E.V.; Pekhtereva, E.S.; Polityko, V.A.; Ignatov, A.N.; Nikolaeva, E.V.; Schaad, N.W. Distribution and Virulence of Pseudomonas syringae pv. atrofaciens, Causal Agent of Basal Glume Rot, in Russia. In Pseudomonas Syringae and Related Pathogens; Springer: Dordrecht, The Netherlands, 2003. [Google Scholar]
- Brooks, D.M.; Bender, C.L.; Kunkel, B.N. The Pseudomonas syringae phytotoxin coronatine promotes virulence by overcoming salicylic acid-dependent defences in Arabidopsis thaliana. Mol. Plant Pathol. 2005, 6, 629–639. [Google Scholar] [CrossRef]
- Grgurina, I.; Mariotti, F.; Fogliano, V.; Gallo, M.; Scaloni, A.; Iacobellis, N.S.; Lo Cantore, P.; Mannina, L.; van Axel Castelli, V.; Greco, M.L.; et al. A new syringopeptin produced by bean strains of Pseudomonas syringae pv. syringae. Biochim. Biophys. Acta Protein Struct. Mol. Enzymol. 2002, 1597, 81–89. [Google Scholar] [CrossRef]
- Passera, A.; Compant, S.; Casati, P.; Maturo, M.G.; Battelli, G.; Quaglino, F.; Antonielli, L.; Salerno, D.; Brasca, M.; Toffolatti, S.L.; et al. Not just a pathogen? Description of a plant-beneficial Pseudomonas syringae strain. Front. Microbiol. 2019, 10, 1409. [Google Scholar] [CrossRef] [PubMed] [Green Version]
- Balestra, G.M.; Bovo, M. Effectiveness of copper compounds in the control of bacterial diseases of kiwifruit plants. Acta Hortic. 2003, 610, 399–402. [Google Scholar] [CrossRef]
- La Torre, A.; Iovino, V.; Caradonia, F. Copper in plant protection: Current situation and prospects. Phytopathol. Mediterr. 2018, 57, 201–236. [Google Scholar]
- Lamichhane, J.R.; Osdaghi, E.; Behlau, F.; Köhl, J.; Jones, J.B.; Aubertot, J.N. Thirteen decades of antimicrobial copper compounds applied in agriculture. A Review. Agron. Sustain. Dev. 2018, 38, 28. [Google Scholar] [CrossRef] [Green Version]
- McManus, P.S.; Stockwell, V.O.; Sundin, G.W.; Jones, A.L. Antibiotic use in plant agriculture. Annu. Rev. Phytopathol. 2002, 40, 443–465. [Google Scholar] [CrossRef]
- Buttimer, C.; McAuliffe, O.; Ross, R.P.; Hill, C.; O’Mahony, J.; Coffey, A. Bacteriophages and bacterial plant diseases. Front. Microbiol. 2017, 8, 34. [Google Scholar] [CrossRef] [Green Version]
- Frampton, R.A.; Pitman, A.R.; Fineran, P.C. Advances in bacteriophage-mediated control of plant pathogens. Int. J. Microbiol. 2012, 2012, 326452. [Google Scholar] [CrossRef] [Green Version]
- Frampton, R.A.; Acedo, E.L.; Young, V.L.; Chen, D.; Tong, B.; Taylor, C.; Easingwood, R.A.; Pitman, A.R.; Kleffmann, T.; Bostina, M.; et al. Genome, proteome and structure of a T7-like bacteriophage of the kiwifruit canker phytopathogen Pseudomonas syringae pv. actinidiae. Viruses 2015, 7, 3361–3379. [Google Scholar] [CrossRef] [PubMed]
- Jørgensen, J.B.; Djurhuus, A.M.; Carstens, A.B.; Kot, W.; Neve, H.; Morris, C.E.; Hansen, L.H. Presentation of three novel tailed phages targeting multiple strains of Pseudomonas syringae. Phage 2020, 1, 245–250. [Google Scholar] [CrossRef]
- Amarillas, L.; Estrada-Acosta, M.; León-Chan, R.G.; López-Orona, C.; Lightbourn, L. Complete genome sequence of Phobos: A novel bacteriophage with unusual genomic features that infects Pseudomonas syringae. Arch. Virol. 2020, 165, 1485–1488. [Google Scholar] [CrossRef] [PubMed]
- Wojtus, J.K.; Frampton, R.A.; Warring, S.; Hendrickson, H.; Fineran, P.C. Genome sequence of a Jumbo bacteriophage that infects the kiwifruit phytopathogen Pseudomonas syringae pv. actinidiae. Microbiol. Resour. Announc. 2019, 8, e00224-19. [Google Scholar] [CrossRef] [Green Version]
- Smith, A.R.W.; Zamze, S.E.; Hignett, R.C. Morphology and hydrolytic activity of A7, a typing phage of Pseudomonas syringae pv. morsprunorum. Microbiology 1994, 140, 905–913. [Google Scholar] [CrossRef] [Green Version]
- Ni, P.; Wang, L.; Deng, B.; Jiu, S.; Ma, C.; Zhang, C.; Almeida, A.; Wang, D.; Xu, W.; Wang, S. Characterization of a lytic bacteriophage against Pseudomonas syringae pv. actinidiae and its endolysin. Viruses 2021, 13, 631. [Google Scholar] [CrossRef]
- Pilipchuk, T.A.; Gerasimovich, A.D.; Ananieva, I.N.; Kolomiets, E.I.; Popov, F.A.; Novik, G.I. Biopesticide “Multiphage” based on phages of phytopathogenic bacteria Pseudomonas syringae and Pseudomonas fluorescens used in agriculture to control plant diseases. Microb. Biotechnol. Fundam. Appl. Asp. 2015, 7, 197–219. [Google Scholar]
- Pilipchuk, T.A. Bacteriophages of plant pathogenic bacteria Pseudomonas syringae as a preparation basis for fight against bacterioses of vegetable crops. Collect. Sci. Artic. YSU SSS 2018, 24, 207–215. [Google Scholar]
- Buzikov, R.M.; Pilipchuk, T.A.; Valentovich, L.N.; Kalamiyets, E.I.; Shadrin, A.M. Complete genome sequence of Pseudomonas syringae BIM B-268, a plant pathogen strain used for in vitro testing of agricultural bacteriophage efficiency. Microbiol. Resour. Announc. 2021, 10, e0041321. [Google Scholar] [CrossRef]
- Piligrimova, E.G.; Kazantseva, O.A.; Nikulin, N.A.; Shadrin, A.M. Bacillus phage vB_BtS_B83 previously designated as a plasmid may represent a new Siphoviridae genus. Viruses 2019, 11, 624. [Google Scholar] [CrossRef] [Green Version]
- Kazantseva, O.A.; Piligrimova, E.G.; Shadrin, A.M. vB_BcM_Sam46 and vB_BcM_Sam112, members of a new bacteriophage genus with unusual small terminase structure. Sci. Rep. 2021, 11, 12173. [Google Scholar] [CrossRef]
- Konopacki, M.; Grygorcewicz, B.; Dołęgowska, B.; Kordas, M.; Rakoczy, R. PhageScore: A simple method for comparative evaluation of bacteriophages lytic activity. Biochem. Eng. J. 2020, 161, 107652. [Google Scholar] [CrossRef]
- Kropinski, A.M. Measurement of the rate of attachment of bacteriophage to cells. Methods Mol. Biol. 2009, 501, 151–155. [Google Scholar] [CrossRef] [PubMed]
- Hyman, P.; Abedon, S.T. Practical methods for determining phage growth parameters. Methods Mol. Biol. 2009, 501, 172–202. [Google Scholar] [CrossRef]
- Bankevich, A.; Nurk, S.; Antipov, D.; Gurevich, A.A.; Dvorkin, M.; Kulikov, A.S.; Lesin, V.M.; Nikolenko, S.I.; Pham, S.; Prjibelski, A.D.; et al. SPAdes: A new genome assembly algorithm and its applications to single-cell sequencing. J. Comput. Biol. 2012, 19, 455–477. [Google Scholar] [CrossRef] [Green Version]
- Brettin, T.; Davis, J.J.; Disz, T.; Edwards, R.A.; Gerdes, S.; Olsen, G.J.; Olson, R.; Overbeek, R.; Parrello, B.; Pusch, G.D.; et al. RASTtk: A Modular and extensible implementation of the RAST algorithm for building custom annotation pipelines and annotating batches of genomes. Sci. Rep. 2015, 5, 8365. [Google Scholar] [CrossRef] [Green Version]
- Altschul, S.F.; Gish, W.; Miller, W.; Myers, E.W.; Lipman, D.J. Basic local alignment search tool. J. Mol. Biol. 1990, 215, 403–410. [Google Scholar] [CrossRef]
- Söding, J.; Biegert, A.; Lupas, A.N. The HHpred interactive server for protein homology detection and structure prediction. Nucleic Acids Res. 2005, 33, W244–W248. [Google Scholar] [CrossRef] [Green Version]
- Laslett, D.; Canback, B. ARAGORN, a Program to detect tRNA genes and tmRNA genes in nucleotide sequences. Nucleic Acids Res. 2004, 32, 11–16. [Google Scholar] [CrossRef]
- Alikhan, N.F.; Petty, N.K.; Ben Zakour, N.L.; Beatson, S.A. BLAST ring image generator (BRIG): Simple prokaryote genome comparisons. BMC Genom. 2011, 12, 402. [Google Scholar] [CrossRef] [Green Version]
- Merrill, B.D.; Ward, A.T.; Grose, J.H.; Hope, S. Software-based analysis of bacteriophage genomes, physical ends, and packaging strategies. BMC Genom. 2016, 17, 679. [Google Scholar] [CrossRef] [PubMed] [Green Version]
- Katoh, K.; Standley, D.M. MAFFT multiple sequence alignment software version 7: Improvements in performance and usability. Mol. Biol. Evol. 2013, 30, 772–780. [Google Scholar] [CrossRef] [Green Version]
- Kumar, S.; Stecher, G.; Li, M.; Knyaz, C.; Tamura, K. MEGA X: Molecular evolutionary genetics analysis across computing platforms. Mol. Biol. Evol. 2018, 35, 1547–1549. [Google Scholar] [CrossRef]
- Comeau, A.M.; Hatfull, G.F.; Krisch, H.M.; Lindell, D.; Mann, N.H.; Prangishvili, D. Exploring the prokaryotic virosphere. Res. Microbiol. 2008, 159, 306–313. [Google Scholar] [CrossRef]
- Nishimura, Y.; Yoshida, T.; Kuronishi, M.; Uehara, H.; Ogata, H.; Goto, S. ViPTree: The viral proteomic tree server. Bioinformatics 2017, 33, 2379–2380. [Google Scholar] [CrossRef]
- Contreras-Moreira, B.; Vinuesa, P. GET_HOMOLOGUES, a versatile software package for scalable and robust microbial pangenome analysis. Appl. Environ. Microbiol. 2013, 79, 7696–7701. [Google Scholar] [CrossRef] [Green Version]
- Kristensen, D.M.; Kannan, L.; Coleman, M.K.; Wolf, Y.I.; Sorokin, A.; Koonin, E.v.; Mushegian, A. A low-polynomial algorithm for assembling clusters of orthologous groups from intergenomic symmetric best matches. Bioinformatics 2010, 26, 1481–1487. [Google Scholar] [CrossRef] [PubMed] [Green Version]
- Santos, S.B.; Carvalho, C.; Azeredo, J.; Ferreira, E.C. Population dynamics of a Salmonella lytic phage and its host: Implications of the host bacterial growth rate in modelling. PLoS ONE 2014, 9, e102507. [Google Scholar] [CrossRef] [PubMed] [Green Version]
- García, R.; Latz, S.; Romero, J.; Higuera, G.; García, K.; Bastías, R. Bacteriophage Production Models: An Overview. Front. Microbiol. 2019, 10, 1187. [Google Scholar] [CrossRef] [PubMed]
- Tokman, J.I.; Kent, D.J.; Wiedmann, M.; Denes, T. Temperature significantly affects the plaquing and adsorption efficiencies of Listeria phages. Front. Microbiol. 2016, 7, 631. [Google Scholar] [CrossRef]
- Magill, D.; Kulakov, L.; Skvortsov, T. Genomic hypervariability of phage Andromeda is unique among known dsDNA viruses. Queen’s University Belfast, School of Pharmacy, Medical Biology Centre, Belfast, Northern Ireland, UK. bioRXiv 2019, 619015. [Google Scholar] [CrossRef]
- Yu, X.; Xu, Y.; Gu, Y.; Zhu, Y.; Liu, X. Characterization and genomic study of “phiKMV-Like” phage PAXYB1 infecting Pseudomonas aeruginosa. Sci. Rep. 2017, 7, 13068. [Google Scholar] [CrossRef] [PubMed] [Green Version]
- Lee, L.F.; Boezi, J.A. Characterization of bacteriophage gh-1 for Pseudomonas putida. J. Bacteriol. 1966, 92, 1821–1827. [Google Scholar] [CrossRef] [PubMed] [Green Version]
- Alvi, I.A.; Asif, M.; Tabassum, R.; Aslam, R.; Abbas, Z.; Ur Rehman, S. RLP, a bacteriophage of the family Podoviridae, rescues mice from bacteremia caused by multi-drug-resistant Pseudomonas aeruginosa. Arch. Virol. 2020, 165, 1289–1297. [Google Scholar] [CrossRef] [PubMed]
- Sajben-Nagy, E.; Maróti, G.; Kredics, L.; Horváth, B.; Párducz, Á.; Vágvölgyi, C.; Manczinger, L. Isolation of new Pseudomonas tolaasii bacteriophages and genomic investigation of the lytic phage BF7. FEMS Microbiol. Lett. 2012, 332, 162–169. [Google Scholar] [CrossRef] [PubMed] [Green Version]
- Casjens, S.R.; Gilcrease, E.B. Determining DNA Packaging strategy by analysis of the termini of the chromosomes in tailed-bacteriophage virions. Methods Mol. Biol. 2009, 502, 91–111. [Google Scholar] [CrossRef] [Green Version]
- Li, M.; Chen, X.; Ma, Y.; Li, Z.; Zhao, Q. Complete genome sequence of PFP1, a novel T7-like Pseudomonas fluorescens bacteriophage. Arch. Virol. 2018, 163, 3423–3426. [Google Scholar] [CrossRef]
- Vincze, T.; Posfai, J.; Roberts, R.J. NEBcutter: A program to cleave DNA with restriction enzymes. Nucleic Acids Res. 2003, 31, 3688–3691. [Google Scholar] [CrossRef] [Green Version]
- Sillankorva, S.; Neubauer, P.; Azeredo, J. Pseudomonas fluorescens biofilms subjected to phage phiIBB-PF7A. BMC Biotechnol. 2008, 8, 79. [Google Scholar] [CrossRef] [Green Version]
- Sillankorva, S.; Kropinski, A.M.; Azeredo, J. Genome sequence of the broad-host-range Pseudomonas phage Φ-S1. J. Virol. 2012, 86, 10239. [Google Scholar] [CrossRef] [Green Version]
- Kazimierczak, J.; Wójcik, E.A.; Witaszewska, J.; Guziński, A.; Górecka, E.; Stańczyk, M.; Kaczorek, E.; Siwicki, A.K.; Dastych, J. Complete genome sequences of Aeromonas and Pseudomonas phages as a supportive tool for development of antibacterial treatment in aquaculture. Virol. J. 2019, 16, 4. [Google Scholar] [CrossRef] [PubMed]
- Weigel, C.; Seitz, H. Bacteriophage replication modules. FEMS Microbiol. Rev. 2006, 30, 321–381. [Google Scholar] [CrossRef] [PubMed]
- Turner, D.; Kropinski, A.M.; Adriaenssens, E.M. A Roadmap for genome-based phage taxonomy. Viruses 2021, 13, 506. [Google Scholar] [CrossRef] [PubMed]


Publisher’s Note: MDPI stays neutral with regard to jurisdictional claims in published maps and institutional affiliations. |
© 2021 by the authors. Licensee MDPI, Basel, Switzerland. This article is an open access article distributed under the terms and conditions of the Creative Commons Attribution (CC BY) license (https://creativecommons.org/licenses/by/4.0/).
Share and Cite
Kazantseva, O.A.; Buzikov, R.M.; Pilipchuk, T.A.; Valentovich, L.N.; Kazantsev, A.N.; Kalamiyets, E.I.; Shadrin, A.M. The Bacteriophage Pf-10—A Component of the Biopesticide “Multiphage” Used to Control Agricultural Crop Diseases Caused by Pseudomonas syringae. Viruses 2022, 14, 42. https://0-doi-org.brum.beds.ac.uk/10.3390/v14010042
Kazantseva OA, Buzikov RM, Pilipchuk TA, Valentovich LN, Kazantsev AN, Kalamiyets EI, Shadrin AM. The Bacteriophage Pf-10—A Component of the Biopesticide “Multiphage” Used to Control Agricultural Crop Diseases Caused by Pseudomonas syringae. Viruses. 2022; 14(1):42. https://0-doi-org.brum.beds.ac.uk/10.3390/v14010042
Chicago/Turabian StyleKazantseva, Olesya A., Rustam M. Buzikov, Tatsiana A. Pilipchuk, Leonid N. Valentovich, Andrey N. Kazantsev, Emilia I. Kalamiyets, and Andrey M. Shadrin. 2022. "The Bacteriophage Pf-10—A Component of the Biopesticide “Multiphage” Used to Control Agricultural Crop Diseases Caused by Pseudomonas syringae" Viruses 14, no. 1: 42. https://0-doi-org.brum.beds.ac.uk/10.3390/v14010042