Article

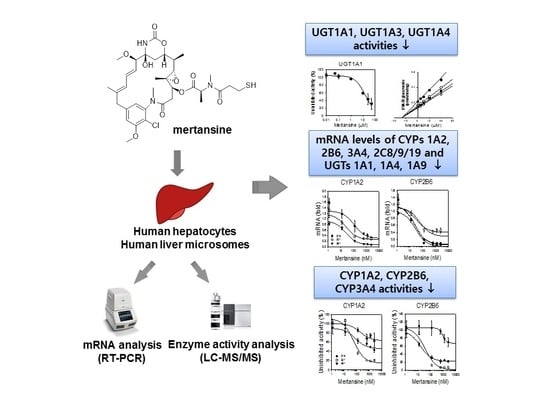
Mertansine Inhibits mRNA Expression and Enzyme Activities of Cytochrome P450s and Uridine 5′-Diphospho-Glucuronosyltransferases in Human Hepatocytes and Liver Microsomes

Drug Metabolism and Bioanalysis Laboratory, College of Pharmacy, The Catholic University of Korea, Bucheon 14662, Korea
*
Author to whom correspondence should be addressed.
Submission received: 18 February 2020 / Revised: 28 February 2020 / Accepted: 1 March 2020 / Published: 2 March 2020
(This article belongs to the Special Issue Drug Metabolism/Transport and Pharmacokinetics)

Abstract

:
Mertansine, a tubulin inhibitor, is used as the cytotoxic component of antibody–drug conjugates (ADCs) for cancer therapy. The effects of mertansine on uridine 5′-diphospho-glucuronosyltransferase (UGT) activities in human liver microsomes and its effects on the mRNA expression of cytochrome P450s (CYPs) and UGTs in human hepatocytes were evaluated to assess the potential for drug–drug interactions (DDIs). Mertansine potently inhibited UGT1A1-catalyzed SN-38 glucuronidation, UGT1A3-catalyzed chenodeoxycholic acid 24-acyl-β-glucuronidation, and UGT1A4-catalyzed trifluoperazine N-β-d-glucuronidation, with Ki values of 13.5 µM, 4.3 µM, and 21.2 µM, respectively, but no inhibition of UGT1A6, UGT1A9, and UGT2B7 enzyme activities was observed in human liver microsomes. A 48 h treatment of mertansine (1.25–2500 nM) in human hepatocytes resulted in the dose-dependent suppression of mRNA levels of CYP1A2, CYP2B6, CYP3A4, CYP2C8, CYP2C9, CYP2C19, UGT1A1, and UGT1A9, with IC50 values of 93.7 ± 109.1, 36.8 ± 18.3, 160.6 ± 167.4, 32.1 ± 14.9, 578.4 ± 452.0, 539.5 ± 233.4, 856.7 ± 781.9, and 54.1 ± 29.1 nM, respectively, and decreased the activities of CYP1A2-mediated phenacetin O-deethylase, CYP2B6-mediated bupropion hydroxylase, and CYP3A4-mediated midazolam 1′-hydroxylase. These in vitro DDI potentials of mertansine with CYP1A2, CYP2B6, CYP2C8/9/19, CYP3A4, UGT1A1, and UGT1A9 substrates suggest that it is necessary to carefully characterize the DDI potentials of ADC candidates with mertansine as a payload in the clinic.

Graphical Abstract

1. Introduction

Maytansine was first isolated in 1972 from the plant Maytenus ovatus [1] and showed potent cytotoxic effects in cell-based systems and efficacy in animal tumor models by binding to tubulin and blocking microtubule assembly [1,2,3,4,5]. However, maytansine failed as an anticancer drug in human clinical trials because of its unacceptable systemic toxicity [5,6,7]. Many maytansinoids, chemical derivatives of maytansine, showed higher cytotoxicity—by 100–1000 times—than other tubulin inhibitors, vincristine and vinblastine, in cancer cell lines in vitro [7,8]. The structure–antitumor activity relationship revealed that the ester side chain of maytansine plays an important role in the anti-tumor activity as well as tubulin binding [8]. Maytansinoids with potent cytotoxicity are clinically used and studied as the cytotoxic component of antibody–drug conjugates (ADCs) or aptamer-drug conjugates to reduce side effects and increase treatment effectiveness [7,8,9,10,11,12,13,14,15]. Mertansine (Figure 1, called DM1), a thiol-containing maytansinoid, is attached to a monoclonal antibody through a reaction of the thiol group with a linker to create an ADC. Several ADCs containing mertansine have been developed, including bivatuzumab mertansine, cantuzumab mertansine, lorvotuzummab mertansine, and trastuzumab emtansine (T-DM1, Kadcyla®) [6,7,8,9,10,11,12,13,14,15]. T–DM1 is an ADC drug approved in early 2013 for the treatment of human epidermal growth factor receptor 2 (HER2)-positive metastatic breast cancer that combines the biological activity of HER2 antibody (Herceptin or trastuzumab) with the targeted delivery of a potent antimicrotubule agent mertansine to HER2-expressing breast cancer cells [16,17,18,19,20]. A meta-analysis of a total of five randomized clinical trials involving 3,720 patients with HER2-positive metastatic breast cancer revealed that T-DM1 significantly prolonged the progression-free survival and overall survival with tolerated toxicity compared to other anti-HER2 therapies [20]. However, patients who received T-DM1 treatment exhibited a significantly higher risk ratio of hepatotoxicity and thrombocytopenia [20].
Cytochrome P450s (CYPs) and uridine-5′-diphospho-glucuronosyltransferases (UGTs) are critical drug-metabolizing enzymes and are often involved in drug–drug interactions (DDIs) [21,22,23,24,25,26,27]. The in vitro inhibitory and induction potentials of drugs on CYPs and UGTs in human liver microsomes and hepatocytes have been evaluated to help identify clinical DDIs [26].
After an intravenous injection of [3H]-mertansine at 0.2 mg/kg in rats, the radioactivity of mertansine was rapidly cleared from the blood and extensively distributed to highly perfused organs such as liver, kidney, spleen, lungs, heart, adrenal, and the gastrointestinal tract with high tissue-to-blood radioactivity ratios (ca. 1~11) for 24 h, declining to minimal levels by 120 h [28]. The majority of dosed mertansine radioactivity was recovered in feces over 120 h, with biliary excretion as the major route (~46% of dosed radioactivity over 72 h), but 5% of dosed radioactivity was recovered in urine over 120 h [28,29]. Mertansine was extensively metabolized to 11 metabolites via S-oxidation, hydrolysis, S-methylation, and glutathione conjugation [28,30,31]. It competitively inhibited CYP2C8-mediated paclitaxel 6α-hydroxylation and CYP2D6-mediated dextromethorphan O-demethylation with Ki values of 11 and 14 µM, respectively, in human liver microsomes; mertansine also inactivated midazolam 1′-hydroxylation in recombinant human CYP3A4 with a Ki of 3.4 µM and a kinact of 0.058 min−1, but it exhibited no induction potential up to 1 µM [31,32].
Other tubulin inhibitors, such as colchicine and monomethyl auristatin E (MMAE), have been reported to downregulate CYP mRNA expression through the disruption of the microtubulin cellular skeletal structure that is necessary for the proper functioning of nuclear receptor signaling cascades [33,34,35]. However, to our knowledge, no studies have investigated the inhibitory potential of mertansine on UGTs, the second major group of enzymes responsible for drug metabolism [27], in human liver microsomes and the suppression potential of mertansine on mRNA expression or activities of major CYPs and UGTs in human hepatocytes.
The purpose of this study was to investigate the in vitro inhibitory potentials of mertansine on human UGT activities including UGT1A1, UGT1A3, UGT1A4, UGT1A6, UGT1A9, and UGT2B7 in ultrapooled human liver microsomes and to evaluate the effect of mertansine on the mRNA levels of human CYP1A2, CYP2B6, CYP3A4, CYP2C8, CYP2C9, CYP2C19, UGT1A1, UGT1A4, and UGT1A9 in human hepatocytes to assess the potential for mertansine-induced drug interactions.

2. Materials and Methods

2.1. Materials

Mertansine (96.9% purity) was obtained from BrightGene Biomedical Technology (Jiangsu, China). Acetaminophen, N-acetylserotonin, alamethicin, chenodeoxycholic acid, 6-(4-chlorophenyl)imidazo[2,1-b](1,3)thiazole-5-carbaldehyde-O-(3,4-dichlorobenzyl)oxime (CITCO), dimethyl sulfoxide (DMSO), l-glutamine, meloxicam, mycophenolic acid, naloxone, naloxone 3-β-d-glucuronide, omeprazole, phenacetin, rifampin, trifluoperazine, Trizma HCl, Trizma Base, uridine 5′-diphosphoglucuronic acid (UDPGA), and William’s Medium E were obtained from Sigma-Aldrich (St. Louis, MO, USA). 13C2,15N-acetaminophen, d9-1′-hydroxybufuralol, 1′-hydroxymidazolam, bupropion, hydroxy-bupropion, trypan blue, matrigel, ultrapooled human liver microsomes (150 donors, mixed gender), Biocoat™ Hepatocyte Culture Medium, BiocoatTM Collagen 96-well and 48-well plates, and cryopreserved plateable human hepatocytes (lots 319, 53-year-old male donor; 321, 58-year-old female donor; and 361, 48-year-old female donor) were purchased from Corning Life Sciences (Woburn, MA, USA). N-acetylserotonin β-d-glucuronide, chenodeoxycholic acid 24-acyl-β-glucuronide, diclofenac, ketoconazole, mycophenolic acid β-d-glucuronide, propofol β-d-glucuronide, SN-38 glucuronide, and trifluoperazine N-β-d-glucuronide were obtained from Toronto Research Chemicals (Toronto, ON, Canada). SN-38 was obtained from Santa Cruz Biotechnology (Dallas, TX, USA). TaqMan® RNA-to-CTTM 1-Step Kit, TaqMan® Gene Expression Assays, and gene-specific probes and primers for real-time reverse transcription polymerase chain reaction (RT-PCR) were obtained from Applied Biosystems (Foster City, CA, USA). Midazolam was purchased from Cayman Chemical (Ann Arbor, MI, USA). Cryopreserved hepatocyte recovery medium, cryopreserved hepatocyte plating medium, and fetal bovine serum (FBS) were purchased from Invitrogen (Carlsbad, CA, USA). CellTiter 96® AQueous One Solution Cell Proliferation Assay (MTS) kit was obtained from Promega (Madison, WI, USA). Acetonitrile, methanol, and water (LC-MS grade) were obtained from Fisher Scientific Co. (Fair Lawn, NJ, USA). RNeasy Micro Kit was purchased from QIAZEN (Germantown, MD, USA). All other reagents used were the highest quality available.

2.2. Inhibitory Potential of Mertansine on Human Major UGTs in Human Liver Microsomes

The inhibitory potential of mertansine on UGT1A1, UGT1A3, UGT1A4, UGT1A6, UGT1A9, and UGT2B7 activities was evaluated using liquid chromatography–tandem mass spectrometry (LC-MS/MS) with a cocktail of UGT substrates and ultrapooled human liver microsomes [36]. Each incubation mixture was prepared to a final volume of 100 μL as follows: ultrapooled human liver microsomes (0.2 mg/mL), 5 mM UDPGA, 10 mM magnesium chloride, alamethicin (25 μg/mL), 50 mM Tris buffer (pH 7.4), various concentrations of mertansine in methanol (final concentrations of 0.01–50 μM), and the cocktail sets of UGT enzyme-specific substrates. Two cocktail sets were used: set A contained 0.5 μM SN-38 for UGT1A1, 2 μM chenodeoxycholic acid for UGT1A3, and 0.5 μM trifluoperazine for UGT1A4; and set B contained 1 μM N-acetylserotonin for UGT1A6, 0.2 μM mycophenolic acid for UGT1A9, and 1 μM naloxone for UGT2B7. The reactions were initiated by adding UDPGA and incubated in a shaking water bath for 60 min at 37 °C. Reactions were terminated by adding 50 μL of ice-cold acetonitrile containing internal standards (IS, propofol glucuronide for set A and meloxicam for set B). Incubation mixtures were centrifuged at 13,000 g for 8 min at 4 °C. Next, 50 μL of each supernatant of sets A and B was mixed, and aliquots (5 μL) were analyzed using LC-MS/MS. All assays were performed in triplicate and average values were used in the analysis.
The LC-MS/MS system was comprised of an Agilent 6495 triple quadrupole mass spectrometer coupled with an Agilent 1290 Infinity system (Agilent Technologies, Wilmington, DE, USA). The column and autosampler temperatures were set to 40 °C and 4 °C, respectively. Six glucuronide metabolites and two ISs were simultaneously separated using an Atlantis dC18 system (3 μm, 2.1 mm i.d. ×100 mm, Waters Technologies, Milford, MA, USA) with a gradient elution of 5% acetonitrile in 0.1% formic acid (MP A) and 95% acetonitrile in 0.1% formic acid (MP B) at a flow rate of 0.3 mL/min. Separation was achieved using the following sequence: 10% MP B for 1 min, 10% to 60% MP B for 1 min, 60% to 95% MP B for 1 min, 95% MP B for 2 min, 95% to 10% MP B for 0.1 min, and 10% MP B for 2.9 min. The electrospray ionization (ESI) source settings in both positive and negative ion modes were as follows: gas temperature, 200 °C; gas flow, 14 L/min; nebulizer, 40 psi; sheath gas temperature, 380 °C; sheath gas flow, 11 L/min; capillary voltage, 4500 V; and nozzle voltage, 500 V. Each metabolite was quantified via selected reaction monitoring in the negative ion mode (chenodeoxycholic acid 24-acyl-β-glucuronide, m/z 567.1 to 391.2; mycophenolic acid β-d-glucuronide, m/z 495.0 to 319.0; propofol glucuronide (IS), m/z 353.0 to 177.0) and in the positive ion mode (SN-38 glucuronide, m/z 568.9 to 392.9; trifluoperazine N-β-d-glucuronide, m/z 583.9 to 407.9; N-acetylserotonin β-d-glucuronide, m/z 394.0 to 219.0; naloxone 3-β-d-glucuronide, m/z 503.9 to 309.9; meloxicam (IS), m/z 351.9 to 115.0). Data were processed using MassHunter software (Version B.07.00, Agilent Technologies, Wilmington, DE, USA).

2.3. Kinetic Analysis for the Inhibition of UGT1A1, UGT1A3, and UGT1A4 by Mertansine

Kinetic analysis was conducted to determine the Ki values and inhibition mode of mertansine for UGT1A1, UGT1A3, and UGT1A4 enzymes. Human liver microsomes (0.1 mg/mL) were incubated with various concentrations of SN-38 (0.2–2 μM) for UGT1A1, chenodeoxycholic acid (0.5–5 μM) for UGT1A3 or trifluoperazine (0.2–2 μM) for UGT1A4, 5 mM UDPGA, 25 μg/mL alamethicin, 10 mM MgCl2, and various concentrations of mertansine (2.5, 5, 10, 20 μM for UGT1A1; 1, 2, 5, 10, 20 μM for UGT1A3; and 2.5, 5, 10, 20, 40 μM for UGT1A4) in 50 mM Tris buffer (pH 7.4) to a total incubation volume of 100 μL. Reactions were initiated by addition of UDPGA at 37 °C and stopped after 30 min by placing the incubation tubes on ice and adding 100 μL of internal standard (500 ng/mL meloxicam for SN-38 glucuronide and trifluoperazine N-β-d-glucuronide or propofol glucuronide for chenodeoxycholic acid 24-acyl-β-glucuronide) in ice-cold acetonitrile. The incubation mixtures were then centrifuged at 13,000 g for 4 min, and 50 μL of the supernatant was diluted with 50 μL of water. Aliquots (5 μL) were then analyzed using LC-MS/MS.

2.4. Induction of Mertansine on Human Major CYPs and UGTs in Human Hepatocytes

Plateable cryopreserved human hepatocytes (lots 319, 321, and 361) were thawed in cryopreserved hepatocyte recovery medium according to the manufacturer’s protocol.

2.4.1. Cytotoxicity of Mertansine in Human Hepatocytes

To estimate the cytotoxicity of mertansine, viable hepatocytes (lot 319) cells were seeded in a collagen type 1 precoated 96-well plate in 100 μL of hepatocyte plating medium (6 × 10⁴ cells/well) and incubated for 4 h at 37 °C in 5% CO2. Next, the plating medium was removed, and a matrigel medium containing 0.25 mg/mL of Matrigel™ matrix was applied to each cell prior to incubation for 24 h at 37 °C in 5% CO2. The hepatocytes were incubated with 0.0125, 0.0625, 0.125, 0.250, 0.625, 1.25, 2.5, and 6.25 μM mertansine in triplicate for 48 h at 37 °C in 5% CO2. The medium was exchanged with fresh medium containing mertansine every 24 h. Then, 20 μL of MTS solution was added to each well and the plate was incubated for 1 h at 37 °C in 5% CO2. The absorbance of the reaction mixture was measured at 492 nm.

2.4.2. Treatment of Mertansine in Human Hepatocytes

To evaluate the induction effect of mertansine on drug-metabolizing enzymes, three different cryopreserved human hepatocytes (lots 319, 321, and 361) were thawed in cryopreserved hepatocyte recovery medium, and viable cells were seeded in collagen type 1 precoated 48-well plates in 250 μL of hepatocyte plating medium (6 × 10⁵ cells/well) and incubated for 4 h at 37 °C in 5% CO2. Next, the plating medium was removed and replaced with matrigel medium containing 0.25 mg/mL of Matrigel™ matrix prior to incubation at 37 °C for 24 h. The hepatocytes were incubated with 1.25, 12.5, 125, 625, 1250, and 2500 nM mertansine, vehicle (0.1% DMSO in hepatocyte culture media), and prototypical inducers including 50 μM omeprazole, 10 nM CITCO, and 10 μM rifampicin in triplicate. Samples were incubated for 48 h at 37 °C in 5% CO2, and the medium was exchanged with 250 μL of fresh medium containing drugs or the vehicle every 24 h.

2.4.3. CYP1A2, CYP2B6, and CYP3A4 Activity Measurement

The effects of mertansine on CYP1A2, CYP2B6, and CYP3A4 activities were evaluated. Plates were prepared with a vehicle, omeprazole, CITCO, rifampin, and mertansine, and incubated for 48 h. Next, 150 µL of a CYP cocktail solution containing 40 µM phenacetin (CYP1A2 substrate), 20 µM bupropion (CYP2B6 substrate), and 20 µM midazolam (CYP3A4 substrate) in William’s E buffer was added to each well and incubated for 30 min, and then 100 µL aliquots of the incubate from each well were stored at −80 °C until LC-MS/MS analysis. 13C2,15N-acetaminophen (0.1 µg/mL, IS for acetaminophen), and d9-1′-hydroxybufuralol (0.01 µg/mL, IS for hydroxybupropion and 1′-hydroxymidazolam) in methanol were added to 50 µL of the medium obtained from each well. Mixtures were vortexed for 2 min and then centrifuged at 13,000 g for 4 min at 4 °C. The supernatant (40 µL) was diluted with 60 µL of deionized water and then mixed for 2 min by vortexing. An aliquot (5 µL) was analyzed using LC-MS/MS [37], and CYP1A2, CYP2B6, and CYP3A4 enzyme activities were expressed as formation rates (pmol/million cells/min).

2.4.4. RNA Purification and RT-PCR Analysis

At the end point of the experiment, total RNA was immediately isolated using an RNeasy Micro Kit, and RNA concentration and purity were determined using an absorbance test at 260 nm/280 nm using a NanoVue Plus spectrophotometer (GE Healthcare Bio-Sciences Corp., Piscataway, NJ, USA). Samples were stored at −80 °C until RT-PCR analysis.
RT-PCR analysis was performed using an RT-PCR detection system (Bio-Rad, Hercules, CA, USA) with a TaqMan® RNA-to-CT™ 1-Step Kit and TaqMan® Gene Expression Assay Kits (CYP1A2, Hs01070369_m1; CYP2B6, Hs03044634_m1; CYP3A4, Hs00430021_m1; CYP2C8, Hs00426387_m1; CYP2C9, Hs00426397_m1; CYP2C19, Hs00559368_m1; UGT1A1, Hs02511055_s1; UGT1A4, Hs01655285_s1; UGT1A9, Hs02516855_sH) according to the manufacturer’s protocol. Total RNA (15 ng) in each reaction sample was used for RT-PCR: 25 min for reverse transcription at 48 °C, 15 min for enzyme activation at 95 °C, 44 cycles of denaturation (each 15 s) at 95 °C, and 1 min annealing/extension at 60 °C. The relative threshold cycle (ΔCt) values of all samples, including CYP1A2, CYP2B6, CYP3A4, CYP2C8, CYP2C9, CYP2C19, UGT1A1, UGT1A4, and UGT1A9, were normalized to the ΔCt value of glyceraladehyde 3-phosphate dehydrogenase (GAPDH). The relative mRNA abundance was then calculated with the normalized relative Ct value (ΔΔCt) of each sample using the formula: 2−(ΔΔCt).

2.5. Data Analysis

The percentage changes in enzymatic activities were calculated as (CYP activity with test compound treatment/CYP activity with vehicle control treatment) × 100. The IC50 (the concentration of the inhibitor needed for half-maximal inhibition) values were calculated using SigmaPlot ver. 12.5 (Systat Software, Inc.; San Jose, CA, USA). Ki (the inhibition constant) and the inhibition mode of UGT1A1, UGT1A3, and UGT1A4 activities were determined using Enzyme Kinetics ver. 1.1 (Systat Software, Inc.).

3. Results

3.1. Inhibition of UGT Enzyme Activities by Mertansine in Human Liver Microsomes

Mertansine inhibited UGT1A1-catalyzed SN-38 glucuronidation, UGT1A3-catalyzed chenodeoxycholic acid 24-acyl-β-glucuronidation, and UGT1A4-catalyzed trifluoperazine N-β-d-glucuronidation with IC50 values of 16.2 µM, 6.4 µM, and 23.3 µM, respectively, but negligibly inhibited UGT1A6-catalyzed N-acetylserotonin β-d-glucuronidation, UGT1A9-catalyzed mycophenolic acid β-d-glucuronidation, and UGT2B7-catalyzed naloxone 3-β-d-glucuronidation in human liver microsomes at 50 µM (Figure 2, Table 1).
Mertansine noncompetitively inhibited UGT1A1-catalyzed SN-38 glucuronidation with a Ki value of 13.5 μM, and competitively inhibited UGT1A3-catalyzed chenodeoxycholic acid 24-acyl-glucuronidation and UGT1A4-catalyzed trifluoperazine N-β-D-glucuronidation, with Ki values of 4.3 and 21.2 μM, respectively (Figure 3, Table 1).

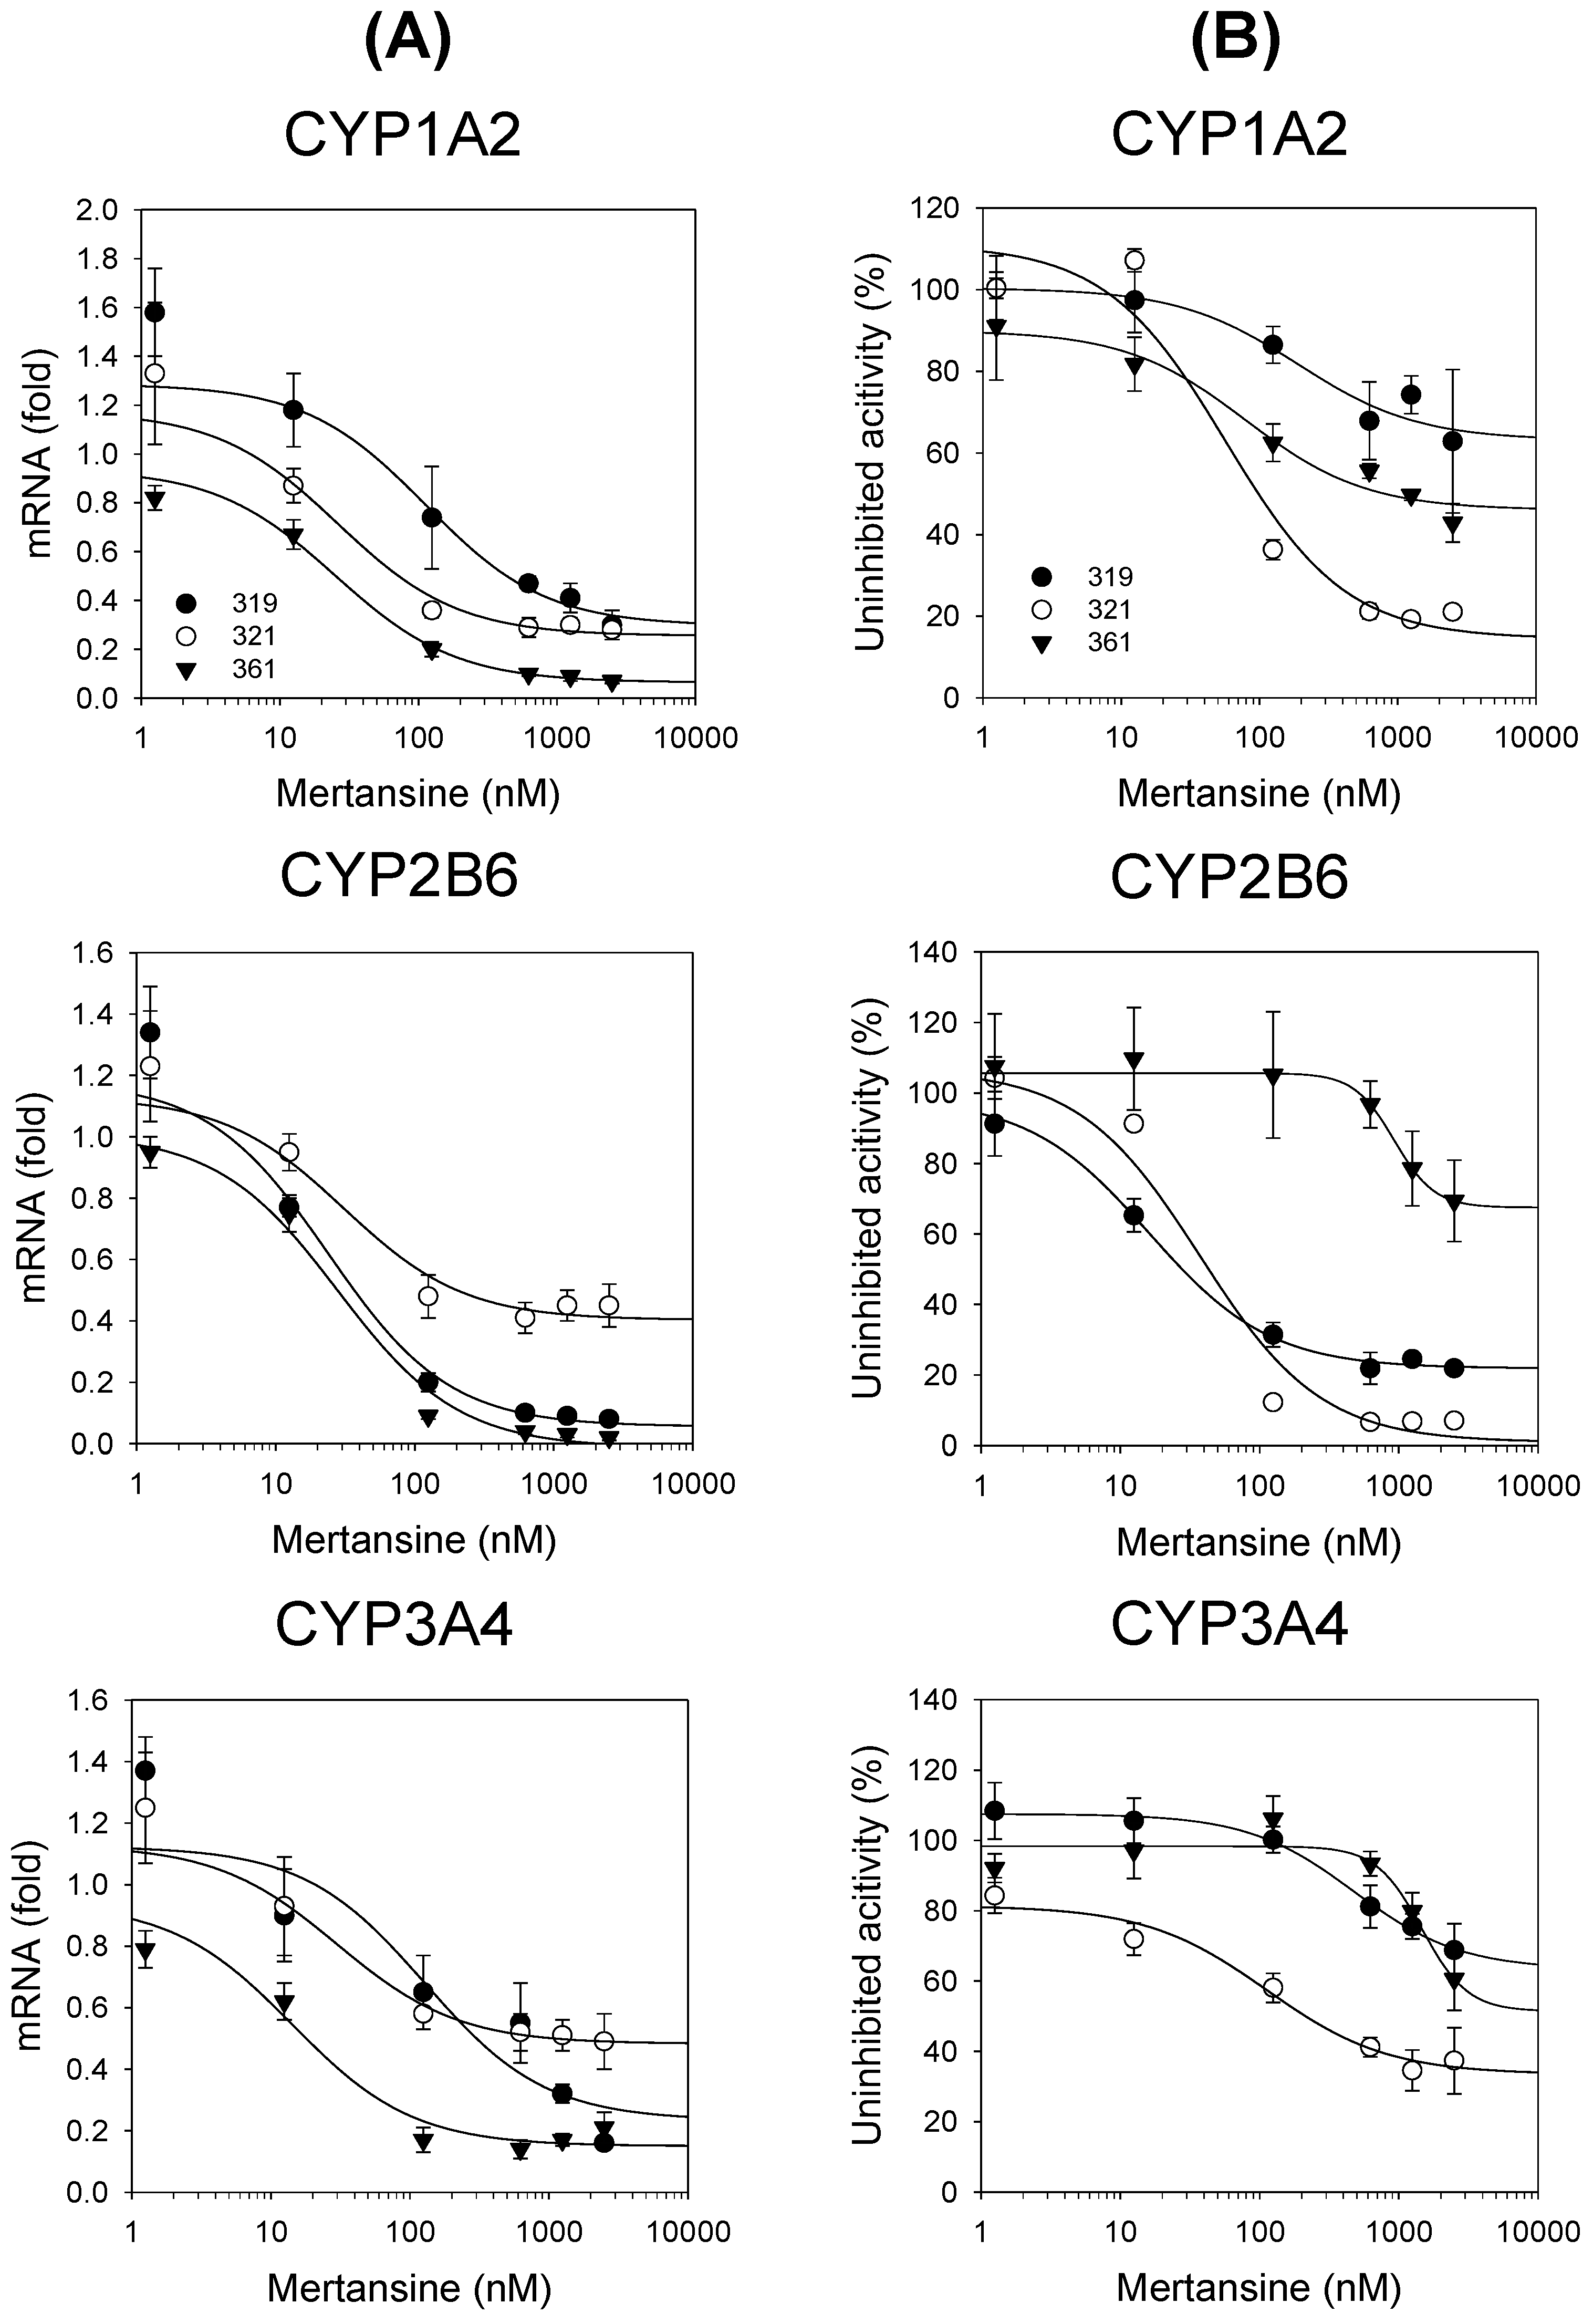
3.2. Effects of Mertansine on CYP and UGT mRNA Levels in Human Hepatocytes

In the MTS colorimetric assay, mertansine did not cause toxicity in human hepatocytes (lot 319), as the viability of hepatocytes following 48 h mertansine treatment (1.25–6250 nM) was over 96.2%.
The functionality of the hepatocyte was confirmed by the increase of mRNA levels and enzyme activities of CYPs following 48 h treatment with prototypical inducers using RT-PCR and LC-MS/MS, respectively, compared to the vehicle (Table 2). Fifty micromoles of omeprazole, a representative aromatic hydrocarbon receptor inducer (AHR), increased the CYP1A2 mRNA levels by enhancing the AHR binding to the promoter region of CYP1A2 [38] and CYP1A2-mediated phenacetin O-deethylase activity by 58.7–299.3 and 11.7–61.8 fold, respectively (Table 2). 10 μM rifampin, a potent pregnane X receptor (PXR) inducer, increased mRNA levels of CYP3A4 by enhancing the PXR binding to the promoter region of CYP3A4 [39] and CYP3A4-mediated midazolam 1′-hydroxylase by 74.0–146.7 and 3.6–9.8 fold, respectively (Table 2). Additionally, 10 nM CITCO increased CYP2B6 mRNA levels and CYP2B6-mediated bupropion hydroxylase activity by 5.6–8.7 and 3.8–15.7 fold, respectively (Table 2), which was mediated by the transcriptional activation by the enhancement of constitutive androstane receptor binding to the promoter region of CYP2B6 [40]. 10 μM rifampin increased mRNA levels of CYP2C8, CYP2C9, CYP2C19, UGT1A1, UGT1A4, and UGT1A9 by 3.7–4.8, 2.9–5.3, 2.0–2.2, 2.5–3.0, 3.9–4.5, and 2.0–2.2 fold, respectively, and 50 μM omeprazole increased the mRNA levels of UGT1A1 and UGT1A4 by 3.9–7.0 and 3.3–4.1 fold, respectively, in three human hepatocytes (Table 2).
Mertansine led to the dose-dependent suppression of mRNA expression of CYP1A2 (from 1.2 to 0.22 fold), CYP2B6 (from 1.2 to 0.18 fold), and CYP3A4 (from 1.1 to 0.29 fold) in three human hepatocytes (Figure 4A). Mertansine decreased the activities of CYP1A2-mediated phenacetin O-deethylase by 27.8–79.0%, CYP2B6-mediated bupropion hydroxylase by 23.9–93.1%, and CYP3A4-mediated midazolam 1′-hydroxylase by 30.8–62.7%, compared to the enzyme activities treated with the vehicle in three human hepatocytes (Figure 4B).
Mertansine dose-dependently suppressed the mRNA levels of CYP2C8 (from 1.2 to 0.09 fold), CYP2C9 (from 1.2 to 0.32 fold), CYP2C19 (from 1.3 to 0.23 fold), UGT1A1 (from 1.1 to 0.37 fold), UGT1A4 (from 1.1 to 0.45 fold), and UGT1A9 (from 1.2 to 0.09 fold), in three human hepatocytes (Figure 5). Table 3 lists the IC50 values for mertansine on the suppression of mRNA expression of CYPs and UGTs in three human hepatocytes.

4. Discussion

In this study, the effects of mertansine on the inhibition of UGT activities in human liver microsomes and its effects on mRNA expression of CYPs and UGTs in human hepatocytes were evaluated to assess the potential for mertansine-induced drug interactions.
Mertansine was a noncompetitive inhibitor of UGT1A1-catalyzed SN-38 glucuronidation with a Ki value of 13.5 μM, and a competitive inhibitor of UGT1A3-catalyzed 24-acyl-β-glucuronidation and UGT1A4-catalyzed trifluoperazine N-β-d-glucuronidation with Ki values of 4.3 and 21.2 μM, respectively, in human liver microsomes (Figure 3). These findings suggest the potential for DDIs between mertansine and UGT1A1, UGT1A3, or UGT1A4 substrates when used concomitantly. However, the maximum plasma concentrations of mertansine were 7.2 ± 2.7 nM, with the highest level of 30 nM after the intravenous infusion of 3.6 mg/kg T-DM1 every 3 weeks in HER2-positve breast cancer patients [16,17,18,19]. Therefore, the ratio of maximal unbound plasma concentrations of mertansine to Ki values (0.00004–0.0002) was much lower than the ratio indicating the likelihood of drug interaction (0.1), suggesting that mertansine-induced drug interactions via the inhibition of UGT activity are unlikely during T-DM1 therapies.
In addition, although mertansine is a competitive inhibitor of CYP2C8 and CYP2D6 activities with Ki values of 11 and 14 µM, respectively, and it also irreversibly inhibits CYP3A4 activity with Ki of 3.4 µM and kinact of 0.058 min−1, mertansine would not cause serious CYP-mediated DDI during the T-DM1 therapies considering the plasma concentrations [32].
The mRNA levels and enzyme activities of CYP1A2, CYP2B6, and CYP3A4 were induced to levels comparable to typical inducers, such as omeprazole, CITCO, and rifampin, following 48 h treatment in three human hepatocytes (Table 2), indicating that the induction system used herein was reliable. The induction effects of mertansine on CYPs and UGTs were assessed using therapeutic to clinically non-achievable high concentrations (1.25–2500 nM) in three human hepatocytes. Mertansine dose-dependently suppressed the mRNA expression of CYP1A2, CYP2B6, and CYP3A4 with IC50 values of 93.7 ± 109.1, 36.8 ± 18.3, and 160.6 ± 167.4 nM, respectively, in thee human hepatocytes (Figure 4A, Table 3). Additionally, mertansine decreased the activities of CYP1A2-mediated phenacetin O-deethylase, CYP2B6-mediated bupropion hydroxylase, and CYP3A4-mediated midazolam 1′-hydroxylase by mean values of 48.3%, 63.5%, and 39.7%, respectively, at the highest concentration (2500 nM) in three human hepatocytes (Figure 4B). Mertansine dose-dependently suppressed the mRNA expression of CYP2C8, CYP2C9, CYP2C19, UGT1A1, and UGT1A9 mRNA levels with IC50 values of 32.1 ± 14.9, 578.4 ± 452.0, 539.5 ± 233.4, 856.7 ± 781.9, and 54.1 ± 29.1 nM, respectively, with a little suppression of UGT1A4 mRNA levels (IC50 value > 2500 nM) (Figure 5, Table 3). These suppressions were not likely to be due to cytotoxic effects because the viability of hepatocytes was not affected by mertansine treatment (1.25–6250 nM). The suppression of CYP mRNA by mertansine was similar to those of other tubulin inhibitors, such as MMAE and colchicine [33,34,35]. In previous studies, 100 and 1000 nM MMAE treatment suppressed CYP1A2, CYP2B6, and CYP3A4 mRNA expression by 61–90% and 95–97%, respectively, and decreased CYP activities by 40–71% and 45–81%, respectively, in three human hepatocytes [32]. These findings support the idea that the suppression of CYP and UGT mRNA levels by mertansine may result from the disruption of cytoskeletal structures formed by microtubule networks, which are important for the functioning of the nuclear receptor signaling cascade [33,34,35,41]. These in vitro results suggest the clinical evaluation of the DDI potential of mertansine with CYP1A2, CYP2B6, CYP3A4, CYP2C8/9/19, UGT1A1, and UGT1A9 substrates.
Several ADCs with mertansine as a payload have been under clinical trials since the approval of T-DM1 [7,10,11,12,13,14]. Liver is the major organ for the distribution and metabolism of antibody maytansinoid conjugates and its catabolites, and the hepatic concentrations of mertansine or ravtansine therefore depend on the catabolism of ADC within the liver [7,18,29,42]. The extensive tissue distribution of mertansine after the administration of mertansine itself in rats led to higher hepatic levels of mertansine compared to plasma levels [28]. Although the maximal plasma concentration of the catabolite mertansine is low (≤7.2 ± 2.7 nM) in T-DM1 treated cancer patients [16,17,18,19], a clinical evaluation of DDIs regarding the reduced mRNA levels by repeated treatment of T-DM1 and the CYP1A2, CYP2B6, CYP2C8/9/19, CYP3A4, UGT1A1, and UGT1A9 substrates may be necessary on the basis of these in vitro findings.

5. Conclusions

Mertansine inhibited UGT1A1, UGT1A3, and UGT1A4 enzyme activities in human liver microsomes and dose-dependently suppressed the mRNA levels of CYP1A2, CYP2B6, CYP3A4, CYP2C8, CYP2C9, CYP2C19, UGT1A1, UGT1A4, and UGT1A9 after 48 h treatment of 1.25–2500 nM mertansine in three human hepatocytes. Additionally, mertansine treatment resulted in the decrease of CYP1A2, CYP2B6, and CYP3A4 enzyme activities. These in vitro DDI potentials of mertansine with substrate drugs for major CYPs and UGTs enzymes indicate that the evaluation of the DDI potentials of ADC candidates with mertansine as a payload is necessary.

Author Contributions

Conceptualization, W.-G.C. and H.S.L.; methodology, W.-G.C., R.P., D.K.K., Y.S., and Y.-Y.C.; software, W.-G.C., R.P. and H.S.L.; investigation, W.-G.C., R.P., D.K.K., and Y.S.; data curation, W.-G.C. and H.S.L.; writing—original draft preparation, W.-G.C. and D.K.K.; writing—review and editing, Y.-Y.C. and H.S.L.; supervision, H.S.L.; project administration, H.S.L.; funding acquisition, H.S.L. All authors have read and agreed to the published version of the manuscript.

Funding

This work was supported by the Korea Health Technology R&D Project through the Korea Health Industry Development Institute (KHIDI), funded by the Ministry of Health & Welfare, Republic of Korea (HI12C1852) and the National Research Foundation of Korea (NRF) grant funded by the Korea government (MSIT) (NRF-2015M3A9E1028325).

Conflicts of Interest

The authors declare no conflicts of interest. The funders had no role in the design of the study; in the collection, analyses, or interpretation of data; in the writing of the manuscript; or in the decision to publish the results.

References

  1. Kupchan, S.M.; Komoda, Y.; Court, W.A.; Thomas, G.J.; Smith, R.M.; Karim, A.; Gilmore, C.J.; Haltiwanger, R.C.; Bryan, R.F. Tumor inhibitors. LXXIII. Maytansine, a novel antileukemic ansa macrolide from Maytenus ovatus. J. Am. Chem. Soc. 1972, 94, 1354–1356. [Google Scholar] [CrossRef]
  2. Huang, A.B.; Lin, C.M.; Hamel, E. Maytansine inhibits nucleotide binding at the exchangeable site of tubulin. Biochem. Biophys. Res. Commun. 1985, 128, 1239–1246. [Google Scholar] [CrossRef]
  3. Hamel, E. Natural products which interact with tubulin in the vinca domain: Maytansine, rhizoxin, phomopsin A, dolastatins 10 and 15 and halichondrin B. Pharm. Ther. 1992, 55, 31–51. [Google Scholar] [CrossRef]
  4. Sawada, T.; Kato, Y.; Kobayashi, H.; Hashimoto, Y.; Watanabe, T.; Sugiyama, Y.; Iwasaki, S. A fluorescent probe and a photoaffinity labeling reagent to study the binding site of maytansine and rhizoxin on tubulin. Bioconjugate Chem. 1993, 4, 284–289. [Google Scholar] [CrossRef] [PubMed]
  5. Widdison, W.C.; Wilhelm, S.D.; Cavanagh, E.E.; Whiteman, K.R.; Leece, B.A.; Kovtun, Y.; Goldmacher, V.S.; Xie, H.; Steeves, R.M.; Lutz, R.J.; et al. Semisynthetic maytansine analogues for the targeted treatment of cancer. J. Med. Chem. 2006, 49, 4392–4408. [Google Scholar] [CrossRef] [PubMed]
  6. Lopus, M.; Oroudjev, E.; Wilson, L.; Wilhelm, S.; Widdison, W.; Chari, R.; Jordan, M.A. Maytansine and cellular metabolites of antibody-maytansinoid conjugates strongly suppress microtubule dynamics by binding to microtubules. Mol. Cancer Ther. 2010, 9, 2689–2699. [Google Scholar] [CrossRef] [Green Version]
  7. Taplin, S.; Vashisht, K.; Walles, M.; Calise, D.; Kluwe, W.; Bouchard, P.; Johnson, R. Hepatotoxicity with antibody maytansinoid conjugates: A review of preclinical and clinical findings. J. Appl. Toxicol. 2018, 38, 600–615. [Google Scholar] [CrossRef] [PubMed]
  8. Cassady, J.M.; Chan, K.K.; Floss, H.G.; Leistner, E. Recent developments in the maytansinoid antitumor agents. Chem. Pharm. Bull. 2004, 52, 1–26. [Google Scholar] [CrossRef] [Green Version]
  9. Sun, X.; Widdison, W.; Mayo, M.; Wilhelm, S.; Leece, B.; Chari, R.; Singh, R.; Erickson, H. Design of antibody-maytansinoid conjugates allows for efficient detoxification via liver metabolism. Bioconj. Chem. 2011, 22, 728–735. [Google Scholar] [CrossRef]
  10. Chen, H.; Lin, Z.; Arnst, K.E.; Miller, D.D.; Li, W. Tubulin inhibitor-based antibody-drug conjugates for cancer therapy. Molecules 2017, 22, 1281. [Google Scholar] [CrossRef] [Green Version]
  11. Dan, N.; Setua, S.; Kashyap, V.K.; Khan, S.; Jaggi, M.; Yallapu, M.M.; Chauhan, S.C. Antibody-drug conjugates for cancer therapy: Chemistry to clinical implications. Pharmaceuticals 2018, 11, 32. [Google Scholar] [CrossRef] [Green Version]
  12. Lambert, J.M.; Morris, C.Q. Antibody-drug conjugates (ADCs) for personalized treatment of solid tumors: A review. Adv. Ther. 2017, 34, 1015–1035. [Google Scholar] [CrossRef] [PubMed] [Green Version]
  13. Marcucci, F.; Casterta, C.A.; Romeo, E.; Rumio, C. Antibody-drug conjugates (ADC) against cancer stem-like cells (CSC): Is there still room for optimism? Front. Oncol. 2019, 9, 167. [Google Scholar] [CrossRef] [Green Version]
  14. Wolska-Washer, A.; Robak, T. Safety and tolerability of antibody-drug conjugates in cancer. Drug Saf. 2019, 42, 295–314. [Google Scholar] [CrossRef] [PubMed] [Green Version]
  15. Collins, D.M.; Bossenmaier, B.; Kollmorgen, G.; Niederfellner, G. Acquired resistance to antibody-drug conjugates. Cancers 2019, 11, 394. [Google Scholar] [CrossRef] [PubMed] [Green Version]
  16. Krop, I.E.; Beeram, M.; Modi, S.; Jones, S.F.; Holden, S.N.; Yu, W.; Girish, S.; Tibbitts, J.; Yi, J.H.; Sliwkowski, M.X.; et al. Phase I study of trastuzumab-DM1, an HER2 antibody-drug conjugate, given every 3 weeks to patients with HER2-positive metastatic breast cancer. J. Clin. Oncol. 2010, 28, 2698–2704. [Google Scholar] [CrossRef] [PubMed]
  17. Burris, H.A., 3rd; Rugo, H.S.; Vukelja, S.J.; Vogel, C.L.; Borson, R.A.; Limentani, S.; Tan-Chiu, E.; Krop, I.E.; Michaelson, R.A.; Girish, S.; et al. Phase II study of the antibody drug conjugate trastuzumab-DM1 for the treatment of human epidermal growth factor receptor 2 (HER2)-positive breast cancer after prior HER2-directed therapy. J. Clin. Oncol. 2011, 29, 398–405. [Google Scholar] [CrossRef]
  18. Yamamoto, H.; Ando, M.; Aogi, K.; Iwata, H.; Tamura, K.; Yonemori, K.; Shimizu, C.; Hara, F.; Takabatake, D.; Hattori, M.; et al. Phase I and pharmacokinetic study of trastuzumab emtansine in Japanese patients with HER2-positive metastatic breast cancer. Jpn. J. Clin. Oncol. 2015, 45, 12–18. [Google Scholar] [CrossRef] [Green Version]
  19. Girish, S.; Gupta, M.; Wang, B.; Lu, D.; Krop, I.E.; Vogel, C.L.; Burris, H.A., 3rd; LoRusso, P.M.; Yi, J.H.; Saad, O.; et al. Clinical pharmacology of trastuzumab emtansine (T-DM1): An antibody-drug conjugate in development for the treatment of HER2-positive cancer. Cancer Chemother. Pharmacol. 2012, 69, 1229–1240. [Google Scholar] [CrossRef] [Green Version]
  20. Yan, H.; Yu, K.; Zhang, K.; Liu, L.; Li, Y. Efficacy and safety of trastuzumab emtansine (T-DM1) in the treatment of HER2-positive metastatic breast cancer (MBC): A meta-analysis of randomized controlled trial. Oncotarget 2017, 8, 102458–102467. [Google Scholar] [CrossRef] [Green Version]
  21. Zanger, U.M.; Schwab, M. Cytochrome P450 enzymes in drug metabolism: Regulation of gene expression, enzyme activities, and impact of genetic variation. Pharmacol. Ther. 2013, 138, 103–141. [Google Scholar] [CrossRef] [PubMed]
  22. Sychev, D.A.; Ashraf, G.M.; Svistunov, A.A.; Maksimov, M.L.; Tarasov, V.V.; Chubarev, V.N.; Otdelenov, V.A.; Denisenko, N.P.; Barreto, G.E.; Aliev, G. The cytochrome P450 isoenzyme and some new opportunities for the prediction of negative drug interaction in vivo. Drug Des. Dev. 2018, 12, 1147–1156. [Google Scholar] [CrossRef] [PubMed] [Green Version]
  23. Manikandan, P.; Nagini, S. Cytochrome P450 structure, function and clinical significance: A review. Curr. Drug Targets 2018, 19, 38–54. [Google Scholar] [CrossRef] [PubMed]
  24. Fowler, S.; Morcos, P.N.; Cleary, Y.; Martin-Facklam, M.; Parrott, N.; Gertz, M.; Yu, L. Progress in prediction and interpretation of clinically relevant metabolic drug–drug interactions: A minireview illustrating recent developments and current opportunities. Curr. Pharmacol. Rep. 2017, 3, 36–49. [Google Scholar] [CrossRef] [Green Version]
  25. Hu, D.G.; Hulin, J.U.; Nair, P.C.; Haines, A.Z.; McKinnon, R.A.; Mackenzie, P.I.; Meech, R. The UGTome: The expanding diversity of UDP glycosyltransferases and its impact on small molecule metabolism. Pharmacol. Ther. 2019, 204, 107414. [Google Scholar] [CrossRef]
  26. Hariparsad, N.; Ramsden, D.; Palamanda, J.; Dekeyser, J.G.; Fahmi, O.A.; Kenny, J.R.; Einolf, H.; Mohutsky, M.; Pardon, M.; Amy Siu, Y.; et al. Considerations from the IQ induction working group in response to drug-drug interaction guidance from regulatory agencies: Focus on downregulation, CYP2C induction, and CYP2B6 positive control. Drug Metab. Dispos. 2017, 45, 1049–1059. [Google Scholar] [CrossRef]
  27. Cerny, M.A. Prevalence of non-cytochrome P450-mediated metabolism in food and drug administration-approved oral and intravenous drugs: 2006–2015. Drug Metab. Dispos. 2016, 44, 1246–1252. [Google Scholar] [CrossRef] [Green Version]
  28. Shen, B.Q.; Bumbaca, D.; Yue, Q.; Saad, O.; Tibbitts, J.; Khojasteh, S.C.; Girish, S. Non-clinical disposition and metabolism of DM1, a component of trastuzumab emtansine (T-DM1), in Sprague Dawley rats. Drug Metab. Lett. 2015, 9, 119–131. [Google Scholar] [CrossRef]
  29. Shen, B.Q.; Bumbaca, D.; Saad, O.; Yue, Q.; Pastuskovas, C.V.; Khojasteh, S.C.; Tibbitts, J.; Kaur, S.; Wang, B.; Chu, Y.W.; et al. Catabolic fate and pharmacokinetic characterization of trastuzumab emtansine (T-DM1): An emphasis on preclinical and clinical catabolism. Curr. Drug Metab. 2012, 13, 901–910. [Google Scholar] [CrossRef]
  30. Erickson, H.K.; Lambert, J.M. ADME of antibody-maytansinoid conjugates. AAPS J. 2012, 14, 799–805. [Google Scholar] [CrossRef] [Green Version]
  31. Han, T.H.; Zhao, B. Absorption, metabolism, and excretion considerations for the development of antibody-drug conjugates. Drug Metab. Dispos. 2014, 42, 1914–1920. [Google Scholar] [CrossRef] [PubMed]
  32. Davis, J.A.; Rock, D.A.; Wienkers, L.C.; Pearson, J.T. In vitro characterization of the drug-drug interaction potential of catabolites of antibody-maytansinoid conjugates. Drug Metab. Dispos. 2012, 40, 1927–1934. [Google Scholar] [CrossRef] [PubMed] [Green Version]
  33. Wolenski, F.S.; Xia, C.Q.; Ma, B.; Han, T.H.; Shyu, W.C.; Balani, S.K. CYP suppression in human hepatocytes by monomethyl auristatin E, the payload in brentuximab vedotin (Adcetris®), is associated with microtubule disruption. Eur. J. Drug Metab. Pharmacok. 2018, 43, 347–354. [Google Scholar] [CrossRef] [PubMed]
  34. Dvorak, Z.; Modriansky, M.; Pichard-Garcia, L.; Balaguer, P.; Vilarem, M.J.; Ulrichová, J.; Maurel, P.; Pascussi, J.M. Colchicine down-regulates Cytochrome P450 2B6, 2C8, 2C9, and 3A4 in human hepatocytes by affecting their glucocorticoid receptor-mediated regulation. Mol. Pharm. 2003, 64, 160–169. [Google Scholar] [CrossRef] [PubMed] [Green Version]
  35. Dvorak, Z.; Ulrichova, J.; Modriansky, M. Role of microtubules network in CYP gene expression. Curr. Drug Metab. 2005, 6, 545–552. [Google Scholar] [CrossRef] [PubMed]
  36. Kwon, S.S.; Kim, J.H.; Jeong, H.U.; Cho, Y.Y.; Oh, S.R.; Lee, H.S. Inhibitory effects of aschantin on cytochrome P450 and uridine 5′-diphospho-glucuronosyltransferase enzyme activities in human liver microsomes. Molecules 2016, 21, 554. [Google Scholar] [CrossRef] [Green Version]
  37. Cho, Y.Y.; Jeong, H.U.; Kim, J.H.; Lee, H.S. Effect of honokiol on the induction of drug metabolizing enzymes in human hepatocytes. Drug Des. Devel. Ther. 2014, 8, 2137–2145. [Google Scholar]
  38. Yoshinari, K.; Ueda, R.; Kusano, K.; Yoshimura, T.; Nagata, K.; Yamazoe, Y. Omeprazole transactivates human CYP1A1 and CYP1A2 expression through the common regulatory region containing multiple xenobiotic-responsive elements. Biochem. Pharm. 2008, 76, 139–145. [Google Scholar] [CrossRef]
  39. Luo, G.; Cunningham, M.; Kim, S.; Burn, T.; Lin, J.; Sinz, M.; Hamilton, G.; Rizzo, C.; Jolley, S.; Gilbert, D.; et al. CYP3A4 induction by drugs: Correlation between a pregnane X receptor reporter gene assay and CYP3A4 expression in human hepatocytes. Drug Metab. Dispos. 2002, 30, 795–804. [Google Scholar] [CrossRef] [Green Version]
  40. Wang, H.; Faucette, S.; Moore, R.; Sueyoshi, T.; Negishi, M.; LeCluyse, E. Human constitutive androstane receptor mediates induction of CYP2B6 gene expression by phenytoin. J. Biol. Chem. 2004, 279, 29295–29301. [Google Scholar] [CrossRef] [Green Version]
  41. Lu, Y.; Chen, J.; Xiao, M.; Li, W.; Miller, D.D. An overview of tubulin inhibitors that interact with the colchicine binding site. Pharm. Res. 2012, 29, 2943–2971. [Google Scholar] [CrossRef] [PubMed] [Green Version]
  42. Walles, M.; Rudolph, B.; Wolf, T.; Bourgailh, J.; Suetterlin, M.; Moenius, T.; Peraus, G.; Heudi, O.; Elbast, W.; Lanshoeft, C.; et al. New insights in tissue distribution, metabolism, and excretion of [3H]-labeled antibody maytansinoid conjugates in female tumor-bearing nude rats. Drug Metab. Dispos. 2016, 44, 897–910. [Google Scholar] [CrossRef] [PubMed] [Green Version]
Figure 1. The chemical structure of mertansine.
Pharmaceutics 12 00220 g001
Figure 2. Inhibitory effects of mertansine on six uridine 5′-diphospho-glucuronosyltransferase (UGT) enzyme activities in ultrapooled human liver microsomes. The cocktail UGT substrate concentrations contained 0.5 µM SN-38 for UGT1A1, 2 µM chenodeoxycholic acid for UGT1A3, 0.5 µM trifluoperazine for UGT1A4, 1 µM N-acetylserotonin for UGT1A6, 0.2 µM mycophenolic acid for UGT1A9, and 1 µM naloxone for UGT2B7. Data are expressed as means ± SD (n = 3).
Pharmaceutics 12 00220 g002
Figure 3. Dixon plots for the inhibitory effects of mertansine on (A) UGT1A1-catalyzed SN-38 glucuronidation, (B) UGT1A3-catalyzed chenodeoxycholic acid 24-acyl glucuronidation, and (C) UGT1A4-catalyzed trifluoperazine N-β-d-glucuronidation in ultrapooled human liver microsomes. Several substrate concentrations were evaluated: (A) SN-38; 0.2 μM ( Pharmaceutics 12 00220 i001); 0.5 μM ( Pharmaceutics 12 00220 i002); 1 μM (▼); 2 μM (▽); (B) chenodeoxycholic acid; 0.5 μM ( Pharmaceutics 12 00220 i001); 1 μM ( Pharmaceutics 12 00220 i002); 2 μM (▼); 5 μM (▽); and (C) trifluoperazine; 0.2 μM ( Pharmaceutics 12 00220 i001); 0.5 μM ( Pharmaceutics 12 00220 i002); 1 μM (▼); 2 μM (▽). Data are expressed as means ± SD (n = 3).
Pharmaceutics 12 00220 g003
Figure 4. Effects of mertansine on (A) the mRNA levels of CYP1A2, CYP2B6, and CYP3A4; and (B) the activities of CYP1A2-catalyzed phenacetin O-deethylase, CYP2B6-catalyzed bupropion hydroxylase, and CYP3A4-catalyzed midazolam hydroxylase compared to the vehicle (0.1% DMSO) after 48 h mertansine treatment (1.25–2500 nM) in three human hepatocytes: lots 319 ( Pharmaceutics 12 00220 i001), 321 ( Pharmaceutics 12 00220 i002), and 361 (▼). Data are expressed as means ± SD (n = 3).
Pharmaceutics 12 00220 g004
Figure 5. Effects of mertansine on mRNA levels of CYP2C8, CYP2C9, CYP2C19, UGT1A1, UGT1A4, and UGT1A9 after 48 h treatment in three human hepatocytes: lots 319 ( Pharmaceutics 12 00220 i001), 321 ( Pharmaceutics 12 00220 i002), and 361 (▼). Data are expressed as means ± SD (n = 3).
Pharmaceutics 12 00220 g005
Table 1. Inhibitory potentials of mertansine on six UGT enzyme activities in ultrapooled human liver microsomes.
UGTsEnzyme ActivitiesIC50 (µM)Ki (µM)Inhibition Mode
1A1SN-38 glucuronidation16.213.5Noncompetitive
1A3Chenodeoxycholic acid 24-acyl-β-glucuronidation6.44.3Competitive
1A4Trifluoperazine N-β-d-glucuronidation23.321.2Competitive
1A6N-acetylserotonin β-d-glucuronidationNo inhibition--
1A9Mycophenolic acid β-d-glucuronidationNo inhibition--
2B7Naloxone 3-β-d-glucuronidationNo inhibition--
-: not assayed.
Table 2. Effects of prototypical inducers such as omeprazole, 6-(4-chlorophenyl)imidazo[2,1-b](1,3)thiazole-5-carbaldehyde-O-(3,4-dichlorobenzyl)oxime (CITCO), and rifampicin on the mRNA expression of cytochrome p450s (CYPs) and UGTs and the enzyme activities of CYP1A2, CYP2B6, and CYP3A4 after 48 h treatment in three human hepatocytes (lots 319, 321, and 361). Data are expressed as means ± SD (n = 3).
EnzymesmRNA (Fold Change)Enzyme Activities (pmol/106 Cells/min)
Lot 319Lot 321Lot 361Lot 319Lot 321Lot 361
Omeprazole 50 μM
Vehicle control1.0 1.0 1.0 1.6 ± 0.40 a3.10 ± 0.26 a1.3 ± 0.16 a
CYP1A2132.4 ± 0.2258.7 ± 4.7299.3 ± 49.018.5 ± 3.3 a89.45 ± 4.52 a81.0 ± 0.53 a
UGT1A16.97 ± 0.944.05 ± 0.533.9 ± 0.24---
UGT1A43.31 ± 0.354.13 ± 0.663.7 ± 0.62---
CITCO 10 nM
Vehicle control1.0 1.0 1.0 0.68 ± 0.23 b0.72 ± 0.10 b3.43 ± 0.48 b
CYP2B67.4 ± 1.95.6 ± 1.68.7 ± 0.329.2 ± 0.28 b11.3 ± 0.49 b12.9 ± 0.51 b
Rifampin 10 μM
Vehicle control1.00 1.00 1.00 16.6 ± 3.78 c4.3 ± 0.09 c7.1 ± 0.67 c
CYP3A474.0 ± 10.3146.7 ± 24.9129.8 ± 0.574.9 ± 3.36 c42.0 ± 9.8 c25.6 ± 1.0 c
CYP2C83.7 ± 0.574.8 ± 0.844.0 ± 0.16---
CYP2C95.3 ± 0.022.9 ± 0.113.7 ± 0.36---
CYP2C192.2 ± 0.092.0 ± 0.182.1 ± 0.25---
UGT1A12.9 ± 0.133.0 ± 0.112.5 ± 0.37---
UGT1A44.0 ± 0.224.5 ± 0.594.5 ± 0.87---
UGT1A92.0 ± 0.232.2 ± 0.312.1 ± 0.23---
-: not assayed; vehicle control: 0.1% DMSO treatment; a: CYP1A2-catalyzed phenacetin O-deethylase activity; b: CYP2B6-catalyzed bupropion 1′-hydroxylase activity; c: CYP3A4-catalyzed midazolam 1′-hydroxylase activity.
Table 3. IC50 values for mertansine on the suppression of mRNA expression of CYPs and UGTs after 48 h mertansine treatment (1.25–2500 nM) in three human hepatocytes (lots 319, 321, and 361).
EnzymesIC50 (nM)
Lot 319Lot 321Lot 361Mean ± SD
CYP1A2219.734.327.393.7 ± 109.1
CYP2B625.057.827.636.8 ± 18.3
CYP3A4344.5120.516.8160.6 ± 167.4
CYP2C848.720.027.532.1 ± 14.9
CYP2C9788.2887.559.6578.4 ± 452.0
CYP2C19573.5754.1291.0539.5 ± 233.4
UGT1A1784.5113.41672.1856.7 ± 781.9
UGT1A4>2500>2500>2500>2500
UGT1A986.931.444.154.1 ± 29.1

