Article

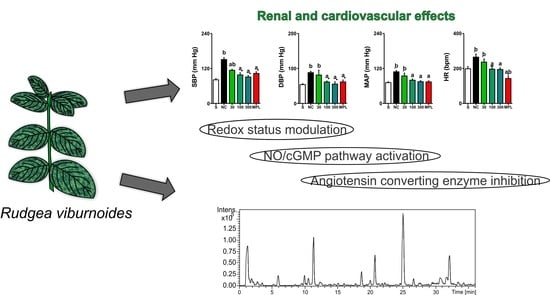
Prolonged Administration of Rudgea viburnoides (Cham.) Benth. Prevents Impairment of Redox Status, Renal Dysfunction, and Cardiovascular Damage in 2K1C-Hypertensive Rats by Inhibiting ACE Activity and NO-GMPC Pathway Activation

by
Fernanda Viana Paulin
1,
Rhanany Alan Calloi Palozi
2,
Bethânia Rosa Lorençone
2,
Arthur Ladeira Macedo
1,
Lucas Pires Guarnier
2,
Cleide Adriane Signor Tirloni
2,
Paulo Vitor Moreira Romão
2,
Arquimedes Gasparotto Junior
2 and
Denise Brentan Silva
1,*
1
Laboratório de Produtos Naturais e Espectrometria de Massas (LaPNEM), Faculdade de Ciências Farmacêuticas, Alimentos e Nutrição (FACFAN), Universidade Federal do Mato Grosso do Sul, Campo Grande 79070-900, Brazil
2
Laboratório de Farmacologia Cardiovascular (LaFaC), Faculdade de Ciências da Saúde, Universidade Federal da Grande Dourados, Dourados 79825-070, Brazil
*
Author to whom correspondence should be addressed.
Pharmaceutics 2021, 13(10), 1579; https://doi.org/10.3390/pharmaceutics13101579
Submission received: 1 September 2021 / Revised: 25 September 2021 / Accepted: 26 September 2021 / Published: 28 September 2021
(This article belongs to the Special Issue Medicinal Plants Discovery Targeting Cardiovascular Diseases)

Abstract

:
Rudgea viburnoides is widely found in the Brazilian Cerrado, and commonly used in Brazilian folk medicine. In this study, we evaluated the effects of prolonged administration of the aqueous extract from R. viburnoides leaves (AERV) on impaired redox status, renal dysfunction, and cardiovascular damage in 2K1C hypertensive rats, as well as its chemical composition by LC-DAD-MS. Renal hypertension (two kidney, one-clip model) was surgically induced in male Wistar rats and AERV (30, 100 and 300 mg/kg) was administered orally five weeks after surgery for 28 days. Renal function was assessed and urinary electrolytes, pH, and density were measured. Electrocardiography, blood pressure and heart rate were recorded. Cardiac and mesenteric vascular beds were isolated for cardiac morphometry and evaluation of vascular reactivity, and aortic rings were also isolated for measurement of cyclic guanosine monophosphate levels, and the redox status was assessed. Prolonged treatment with AERV preserved urine excretion and electrolyte levels (Na+, K+, Ca2+ and Cl), reversed electrocardiographic changes, left ventricular hypertrophy and changes in vascular reactivity induced by hypertension, and reduced blood pressure and heart rate. This effect was associated with a positive modulation of tissue redox state, activation of the NO/cGMP pathway, and inhibition of the angiotensin-converting enzyme. Glycosylated iridoids, chlorogenic acids, glycosylated triterpenes, O-glycosylated flavonols, and triterpenoid saponins were annotated. AERV showed no acute toxicity in female Wistar rats. Therefore, AERV treatment reduced the progression of cardiorenal disease in 2K1C hypertensive rats, which can be involved with an important attenuation of oxidative stress, angiotensin-converting enzyme inhibition, and activation of the NO/cGMP pathway.

Graphical Abstract

1. Introduction

Hypertension, a multifactorial disease characterized by sustained elevation of the blood pressure (BP) levels, affects 1.13 billion people around the world. It is a risk factor for cardiovascular diseases, including chronic kidney disease, atherosclerosis, stroke, and heart attack [1,2].
According to the 2017 Guidelines for Arterial Hypertension Management in Primary Health Care in Portuguese Language Countries, Brazil has 17 million hypertensive patients, and cardiovascular disease (CVD) is the leading cause of death. The outlook is that by 2025, this number is expected to grow 80% mainly due to smoking, sedentary lifestyle, obesity, poor diet, and high alcohol consumption [3].
The recommended drugs to treat hypertension include beta blockers, calcium channel blockers, diuretics, and renin-angiotensin system inhibitors. In addition, changes in lifestyle are recommended, such as regular physical exercise, healthy eating, and body weight control. These measures are mainly aimed at preventing cardiovascular complications and metabolic changes due to hypertension [4]. Allied to this, the uses of alternative therapies have increased, mainly in underdeveloped or developing countries, such as the application of medicinal plants [5].
Medicinal plants have been used by populations over several generations to treat several disorders, such as hypertension [6]. In this context, Rudgea viburnoides (Cham.) Benth. (Rubiaceae) is a widely known species in the Brazilian Cerrado, popularly named as ‘congonha de bugre’, ‘congonha’, ‘bugre’, and ‘porangaba’ [7,8]. It is traditionally used as hypotensive, antiarrhythmic, diuretic, blood depurative, in slimming diets, and to treat kidney and bladder infections [9].
From R. viburnoides, chemical and pharmacological studies are still scarce. Preclinical studies have reported nephroprotective [10], diuretic [11], lipid-lowering, and anti-inflammatory effects [12]. In addition, no toxic effects were reported after acute administration of 5000 mg/kg of the ethanolic extract obtained from the leaves of R. viburnoides in rats and mice [11]. Among its main compounds, there are chlorogenic and caffeic acids, flavonoids [8,12], triterpenes, and saponins [13].
Considering that the R. viburnoides is widely used in traditional medicine to treat hypertension, it is interesting and important to investigate its abilities to promote cardioprotective effects in hypertensive rats, as well as expand the chemical information about its composition. Therefore, the aim of this study was to evaluate the aqueous extract obtained from leaves of R. viburnoides (AERV) on impairment of redox status, renal dysfunction, and cardiovascular damage in 2K1C-hypertensive rats.

2. Materials and Methods

2.1. Drugs and Reagents

Xylazine, ketamine hydrochloride (Syntec, São Paulo, SP, Brazil), and heparin (Hipolabor, Belo Horizonte, MG, Brazil) were used in the experiments. The reagents acetylcholine chloride, angiotensin II, indomethacin, metoprolol, NaCl, MgSO4, CaCl2, dextrose, phenylephrine, KH2PO4, ethylenediaminetetraacetic acid, 2′,7′-dichlorofluorescein-diacetate, 5,5′-dithiobis, sodium nitroprusside, bovine serum albumin, KCl, NaHCO3, reduced glutathione, Tris-HCl, xylenol orange, and ethylenediaminetetraacetic acid were purchased from Sigma–Aldrich (St. Louis, MO, USA). For LC-DAD-MS analyses, methanol, acetonitrile, and formic acid were HPLC grade and purchased from J.T. Baker (Phillipsburg, NJ, USA).

2.2. Plant Material and Extraction

Rudgea viburnoides leaves were harvested at the Private Natural Heritage Reserve of the Federal University of Mato Grosso do Sul (RPPN/UFMS) (S20°30′32.0′′–W54°36′57.7′′). Dr. Flávio Macedo Alves identified the plant, and a voucher was deposited at CGMS Herbarium under number 74319. This study is registered at National Genetic Heritage Management System (SisGen, access date 25 August 2021) of the Brazilian ministry of environment under number ACD1712.
The leaves were dried (50 °C for 48 h), powdered (knife mill), and extracted by accelerated solvent extractor Dionex™ ASE™ using hexane and subsequent water, with a plant–solvent ratio of 1:30. The following parameters were applied for extraction: three cycles of 4 min with hexane (100 °C, purge of 100 s and rinse of 60%) to degrease the sample and two cycles of 4 min using distilled water (100 °C, rinse of 100% and purge of 60 s) to obtain the aqueous extract. This extract was lyophilized to obtain the aqueous extract from leaves of R. viburnoides (AERV) with yielded of 9.9%. AERV was maintained at −20 °C until the experiments. The hexane and AERV extracts were obtained with the yielded of 10% and 26.7%, respectively.

2.3. Chemical Analyses by LC-DAD-MS

AERV was solubilized in methanol and ultrapure water 1:1 (v/v) at 2 mg/mL. This solution was filtered on syringe filter (Millex, PTFE, 0.22 μm, Millipore) and 5 μL was injected on the chromatographic system. For the LC-DAD-MS analyses, an UFLC Shimadzu Prominence chromatographic system coupled to a diode array detector (DAD) and a mass spectrometer (MicrOTOF-Q III, Bruker Daltonics, Billerica, MA, USA) was used. The mass spectrometer was provided by an electrospray ion source and analyzers quadrupole and time-of-flight. A Kinetex C18 (2.6 μm, 100 A, 150 × 2.1 mm) chromatographic column (Phenomenex, Torrance, CA, USA) was used; the flow rate was 0.3 mL/min and the chromatographic column was maintained at 50 °C in the analyses. All the LC and MS parameters were the same described by Younis et al. [14], and negative and positive ion modes were applied. The molecular formulae were determined based on the accurate mass (±7 ppm) and mSigma below 30. The negative mode chromatogram was used to calculate the relative area of the annotated compounds.

2.4. Ethnopharmacological Studies

2.4.1. Animals

Male and female Wistar rats (13–14 weeks) were acquired from the Federal University of Mato Grosso do Sul (UFMS). These animals (randomized and housed) were maintained at 22 ± 2 °C under a 12:12 h light:dark cycle and ad libitum access to food and water. The Ethics Committee in Animal Experimentation from UFMS previously approved the procedures (protocol number 947/2018). The procedures were conducted in accordance with the Guidelines for the Care and Use of Laboratory Animals as adopted and promulgated by the United States National Health Institute [15].

2.4.2. Acute Toxicity

Acute toxicity was evaluated in female rats according to protocol 425 from the Organization for Economic Co-operation and Development [16]. The extract AERV (three single doses at 30, 300, and 2000 mg/kg) or water (1 mL/kg) were administered to female rats (n = 8, oral gavage). Following administration, animals were closely observed during the first 24 h and daily for 14 consecutive days. Mortality, body weight gain, and food and water consumption were daily observed and recorded. The animal behavior was also individually observed as described by Malone and Robichaud [17]. On the fifteenth day, the rats were euthanized by isoflurane anesthesia followed by exsanguination. Heart, lung, spleen, liver, kidneys, uterus, and ovaries were removed, weighed, and macroscopically examined. Heart, liver, and kidney samples were fixed in 10% buffered formalin. Samples were sectioned and stained with hematoxylin/eosin (H&E). Analyses were performed under light microscopy (40×) (Olympus CX 31) (Supplementary Material).

2.4.3. Hypertension Induction (Goldblatt Model; Two Kidneys, One Clip; 2K1C)

After the anesthesia by intraperitoneal injection of ketamine at 100 mg/kg and xylazine 20 mg/kg, the male rats were submitted to laparotomy, the left renal artery was isolated, and a silver clip (1.5 mm lumen) was placed to partially limit blood flow [18]. Systolic blood pressure (SBP) was weekly measured by the tail-cuff method. Only animals with SBP above 140 mm Hg were used in experiments.

2.4.4. Experimental Design

Six experimental groups with 8 to 10 animals were randomized after five weeks of surgery. For 28 days, the animals were orally treated with vehicle (filtered water; positive control), metoprolol (MPL, 20 mg/kg), and AERV at doses 30, 100, or 300 mg/kg. The negative control (NC) was the Sham-operated rats that were treated with the vehicle.

2.4.5. Renal Function

The renal function was evaluated according to methods previously described [19]. After the treatments, the animals were placed in metabolic cages. The urinary volume was measured and expressed as mL/100 g of body weight. A digital pH meter (Q400MT; Quimis Instruments, Diadema, SP, Brazil) was applied to determine the pH. A refractometer NO107 (Nova Instruments, Piracicaba, SP, Brazil) was used to estimate the density. For the determinations of sodium (Na+), potassium (K+), chloride (Cl), and calcium (Ca2+) levels, an automatic biochemistry analyzer (COBAS INTEGRA 400 plus; Roche®) was used.

2.4.6. Electrocardiography

On the morning of the twenty-ninth day, all animals underwent electrocardiography (ECG). The animals were anesthetized (ketamine 100 and xylazine 20 mg/kg; intramuscularly). The electrodes were positioned on the animal’s two forelimbs and two hindlimbs. After 5 min to acclimatize, ECG waves were recorded for more 5 min. The segments (ms): PR, QRS, QT, and QTc wave amplitudes (mV): P, Q, R, and S were recorded. A 12-lead ECG recorder was applied to record electrocardiography (WinCardio, Micromed, Brasilia, Brazil).

2.4.7. Blood Pressure (BP) Assessment

After electrocardiography, all rats received a heparin injection (50 IU; subcutaneously). The carotid artery (left) was coupled to a pressure transducer (PowerLab® recording system—program Chart, v 4.1; all from ADI Instruments, Castle Hill, Australia), which was initially isolated and cannulated. Then, the following parameters were recorded for 20 min: diastolic blood pressure (DBP), systolic blood pressure (SBP), and mean arterial pressure (MAP).

2.4.8. Biochemical Parameters

After the BP recording, from the carotid artery (left) the blood samples were obtained, and by centrifugation (1500× g, 10 min) the serum samples were acquired. An automated biochemical analyzer (Roche Cobas Integra 400 plus) was applied to measure Na+, K+, urea, and creatinine levels. The serum angiotensin converting enzyme (ACE) activity was measured according by Santos et al. [20].

2.4.9. Mesenteric Vascular Beds (MVBs) Reactivity

After blood collection and before euthanasia, the mesenteric vascular beds (MVBs) were obtained as described by McGregor [21]. The organs were placed in an organ bath and perfused at 6 mL/min with PSS (119 mM NaCl, 4.7 mM KCl, 2.4 mM CaCl2, 1.2 mM MgSO4, 25.0 mM NaHCO3, 1.2 mM KH2PO4, 11.1 mM dextrose, and 0.03 mM EDTA) at 37 °C and gassed with 95% O2/5% CO2. A pressure transducer coupled to a PowerLab® recording system (Chart, v 4.1; all from ADI Instruments, Castle Hill, Australia) was applied to detect changes in the perfusion pressure (PP; mmHg). The vascular reactivity was determined for phenylephrine (Phe; 0.1, 0.3, and 1 nmol; 10–30 μL), sodium nitroprusside (SNP; 1, 3, and 10 pmol; 10–30 μL), and acetylcholine (ACh; 1, 3, and 10 pmol; 10–30 μL).

2.4.10. Relative Weight and Histopathological Analysis of the Heart and Left Ventricle Morphometry

After euthanasia, removal of the heart was performed, and subsequently it was longitudinally sectioned and cleaned. The relative weight of the heart was determined by formula WT% = absolute organ weight × 100/body weight. The cardiac tissue (a part) was also placed in 10% buffered formalin. Tissue sections (5 mm) were acquired, stained with hematoxylin and eosin, and analyzed by a light microscope (Olympus CX 31, Tokyo, Japan). Motic Images plus 2.0 software was applied to image data acquisition and analyses.

2.4.11. Cardiac and Vascular Redox Status

After euthanasia, parts of the tissue heart, aorta, and right kidney were removed and homogenized in K+ phosphate buffer (0.1 M, pH 6.5). Superoxide dismutase (SOD) was evaluated according to Gao et al. [22]. Lipid peroxidation (LPO) was measured according to Jiang et al. [23]. Catalase (Cat) was measured according to Beers and Sizer [24]. The results were expressed by the amount of protein [25].

2.4.12. Cyclic Guanosine Monophosphate (cGMP) Determination

The role of AERV on cyclic guanosine monophosphate (cGMP) levels was evaluated according to Estancial et al. [26]. Aortic rings from 2K1C rats (2–3 mm; n = 5) were removed and placed in an organ bath with Krebs–Henseleit solution (composition in mm: 4.7 KCl, 117 NaCl, 1.2 MgSO4, 2.5 CaCl2, 1.2 KH2PO4, 25 NaHCO3, and 11 glucose) at 37 °C with 95% O2 and 5% CO2. Aortic rings were incubated with SNP (10 μm), or AERV at the concentrations of 0.001, 0.003, and 0.01 mg/mL for 15 min in the presence or absence of ODQ (100 μm, 30 min). From tissues samples the supernatants were collected after their removal and homogenization. The intracellular cGMP levels were determined as described by the manufacturer (Cayman Chemical Cyclic GMP EIA kit, Ann Arbor, MI, USA). All experiments were performed in triplicate.

2.5. Statistical Analyses

Data were analyzed for normal distribution and homogeneity of variance. For the statistical analysis, one-way analysis of variance (ANOVA) and Bonferroni post hoc test were applied. The significance level was set at 95% (p < 0.05) and results were expressed as mean ± standard error of the mean (S.E.M.).

3. Results

3.1. Chemical Constituents from AERV

LC-DAD-MS was applied to analyze the aqueous extract from R. viburnoides (AERV) and its constituents were annotated and summarized on Figure 1 and Table 1. The annotation of compounds was based on spectral data (UV, MS, and MS/MS) compared with published data. Further, some compounds were confirmed by the injection of authentic standard.
Peaks 1, 2, and 3 presented deprotonated ions at m/z 191.0534, 341.1095, and 191.0209. They were compatible to molecular formulae C7H12O6, C12H22O11, and C6H8O7, and they were putatively annotated as quinic acid (1), di-O-hexoside (2), and citric acid (3), respectively. Compounds 5 and 7 showed UV spectra similar to the observed for caffeic acid chromophores (λmax ≈ 299 and 325 nm) [27]. The fragment ions at m/z 191 and 179 were relative to quinic acid and caffeic acid, and the relative abundance of ion m/z 179 was used to suggest the esterification position of quinic acid [28]. Thus, the metabolites 5 and 7 were identified as 3-O-E-caffeoyl quinic acid and 5-O-E-caffeoyl quinic acid and they were confirmed by injection of authentic standards.
Peaks 6 and 8 did not present absorption on UV and revealed deprotonated ions at m/z 431.1195 (C18H24O12) and 413.1084 (C18H22O11). The losses of hexosyl (162 u) and subsequently of a water molecule (18 u), as well as the losses of a cetene (C2H2O, 42 u) and carbon dioxide (CO2, 44 u), suggested for both compounds the presence of hexosyl, acetyl, and carboxylic acid groups in the structures of 6 and 8, for example, the fragment ions m/z 251 [M-H-hexosyl-H2O], 165 [M-H-hexosyl-H2O-C2H2O-CO], and 191 [M-H-hexosyl-H2O-C2H2O]. They were putatively annotated as the iridoids asperulosidic acid and asperuloside, which showed similar spectral data reported for them and they were already identified in Rubiaceae family [29,30,31].
The characteristic UV absorption bands of 9 (265 and 355 nm) and 11 (265 and 346 nm) suggested that these compounds are flavonols [27]. Compounds 9 and 11 displayed the deprotonated ion at m/z 609.1472 and 593.1521, indicating molecular formulas of C27H30O16 and C27H30O15, respectively. Both compounds showed a loss of 308 u that is relative to hexosyl and deoxyhexosyl substituents, and its aglycones showed m/z 301 (9) and 285 (11). In this way, 9 and 11 were putatively identified as O-hexosyl-deoxyhexosyl quercetin and O-hexosyl-deoxyhexosyl kaempferol [32].
The isomers 12 and 13 showed ions at m/z 681.3823 and 681.3832 [M-H] and suggested the molecular formula of C36H58O12. The fragmentation pattern of these compounds was similar; the product ion m/z 519 was yielded from the loss of a hexosyl group (162 u). The ions with m/z 407 and 207 are relative to a retro Diels–Alder (RDA) cleavage (double bound on C12, ring C), followed by dehydration. The ion m/z 407 is relative to rings D and E moiety O-linked to the H group, while the m/z 207 represents the rings A and B. In this way, 12 and 13 were identified as trachelosperosides B-1 or E-1 [33,34]. These compounds were already reported from R. viburnoides by Young et al. [13].
Finally, compounds 15 and 16 were annotated as triterpenoid saponins. Compound 16 (m/z 955.4914 [M-H], C48H76O19) showed sequential losses of 162 and 176 u, suggesting the substituents hexosyl and glucuronyl, and these losses yielded the fragment ion m/z 455 (C30H47O3) relative to aglycone. Compound 15 (m/z 1087.5303 [M-H], C53H84O23) presented similar to 16, but with an additional substituent O-pentosyl and the data suggested that 15 and 16 are bisdesmosidic saponins [35].

3.2. Toxicological Evaluations

No changes in behavior nor deaths were observed in the animals during the observation period (14 days). However, the treatment with AERV (all doses) showed a significant reduction on feed consumption and body weight gain in the animals. Regarding the relative organ weight, notable differences were not observed for the rats treated with AERV compared to the control animals. The heart, lung, liver, ovaries, uterus, spleen, and kidneys were analyzed, and no significant changes were observed, as well as no histopathological changes in heart, liver, or kidneys (Supplementary Material).

3.3. Effects on Urinary Volume and Renal Electrolyte Excretion

None of the experimental groups had significant differences in urinary volume excreted on the first day of treatment (Table 2), although a remarkable reduction in renal excretion of Na+, Ca2+, and Cl were observed for the animals of negative control and treated with AERV 30 and 100 mg/kg compared to Sham-operated animals. Interestingly, the animals treated with AERV (300 mg/kg) or MPL revealed urinary Na+, Ca2+, and Cl values similar to those observed for Sham-operated animals. In addition, the urinary density for the negative control group was lower than the observed for the Sham-operated group. All other parameters evaluated were not changed by any of the treatments performed.
The effects of the AERV treatment on the renal function on the seventh day of treatment are described in Table 3. A decrease in urinary excretion was observed for the negative control group and AERV-treated rats (30, 100, and 300 mg/kg) compared to the Sham-operated animals. In addition, an increase in urinary density was observed for the negative control and AERV 30 and 100 mg/kg groups. On the other hand, an important reduction in urinary density was determined for the animals treated with MPL or AERV at 300 mg/kg compared to the negative control group. The elimination of electrolytes or the urinary pH were not significantly changed from the evaluated treatments.
The urinary volume and renal excretion of Na+, Ca2+, and Cl were reduced in negative control animals on the fourteenth day of treatment. The renal elimination of electrolytes and the urinary volume for the AERV treatment at doses of 30 and 100 mg/kg were similar to the negative control (Table 4). At the highest dose (300 mg/kg) of AERV treatment, no significant changes in urine elimination, nor Cl, Ca2+, and Na+ urinary levels were observed when compared to the Sham group, but significant reductions in urinary levels of Cl and Ca2+ were observed for the MPL-treated group (Table 4).
The effects of prolonged AERV treatment (on the twenty-first day) on the different urinary parameters are summarized in Table 5. On that day, the animals of the negative control group showed the lowest urinary volume and electrolyte excretion levels (K+ and Ca2+). The animals treated with MPL also exhibited reduction in urinary volume and renal excretion of Ca2+ and Cl levels. In addition, the AERV treatments at doses of 30 and 100 mg/kg significantly reduced the urinary volume compared with animals of the Sham-operated group. Otherwise, the renal function was preserved in hypertensive rats treated with AERV (300 mg/kg), and these effects were similar with those observed by Sham-operated animals. The urinary density observed for the negative control rats, MPL, or AERV (30 and 100 mg/kg) were significantly higher than the animals of the Sham or AERV (300 mg/kg) groups.
The values of the different urinary parameters on the 28th day of treatment were summarized in Table 6. The urinary excretion was reduced in negative control group, as well as the levels of Cl, Ca2+, and Na+. The MPL treatment also showed an impaired urinary volume, and lower urinary Ca2+, and Cl levels than rats in the Sham group. The urinary volume and renal elimination of Ca2+, accompanied by normalization of urinary elimination of Na+, K+, and Cl, were reduced with the AERV treatment at 30 and 100 mg/kg (Table 6). Nonetheless, the animals treated with AERV (300 mg/mL) revealed a urinary volume and electrolyte excretion similar to those observed for Sham-operated rats. Additionally, the urinary density remained significantly increased for the negative control or AERV at dose of 30 mg/kg groups (Table 6).

3.4. Effects on Electrical Cardiac Activity

Figure 2A–J shows quantitative electrocardiography data for Sham-operated and 2K1C-hypertensive rats treated with AERV (30, 100, and 300 mg/kg), MPL (20 mg/kg), or vehicle. We did not observe any significant changes in electrocardiographic characteristics of amplitude of the Q, R, S, and T waves, or the P, PR, QRS, and QTC segments in any of the experimental groups. However, the hypertensive rats, treated only with the vehicle, presented electrocardiographic changes, including significant P wave shortening and prolongation of the QT segment (Figure 2A–J). However, these alterations were prevented by AERV treatment (mainly at doses of 100 and 300 mg/kg) and MPL. The values of all parameters of that were evaluated AERV or MPL treatments were statistically similar to Sham-operated rats.

3.5. Effects on Blood Pressure and Heart Rate

Figure 3 shows the effects of prolonged treatment with AERV or MPL on different hemodynamic parameters. Hypertensive animals treated only with the vehicle showed a significant increase in MAP, SBP, DBP, and HR levels. Prolonged oral treatments with AERV (at doses of 100 and 300 mg/kg) reduced MAP, SBP, DBP, and HR values compared to negative control group. Additionally, a reduction of the HR was confirmed in the MPL treatment compared to the Sham-operated animals.

3.6. Effects on Serum Parameters

A significant increase in urea and creatinine levels were observed in the negative control rats, as well as with ARV-treatment at dose 30 mg/kg when compared with Sham-operated animals. Further, the AERV treatment with doses of 100 and 300 mg/kg, and MPL prevented an increase in serum urea and creatinine levels, revealing similar values for the Sham-operated group (Table 7), although the serum levels of Na+ and K+ were similar in all experimental groups (Table 7).
After 28 days of treatment with vehicle (negative control) or AERV at 30 mg/kg, all 2K1C hypertensive rats showed that the plasma ACE activity increased. Otherwise, 2K1C-hypertensive rats treated with AERV at 100 and 300 mg/kg or MPL exhibited an ACE activity reduced, showing values close to the Sham-operated group (Table 7).

3.7. Effects on MVBs Reactivity

In the negative control group, Phe administration induced a vasoconstrictive effect in the MVBs lower (~50%) compared to Sham-operated rats (Figure 4A). The negative control group also showed a lower vasodilatory response to ACh and SNP than normotensive rats (Figure 4B,C). The prolonged treatment with AERV (at all doses) prevented all changes, and the pattern of SNP-response was remarkable higher when compared to Sham-operated animals. Furthermore, the response with the AERV-treatment was significantly higher than MPL treatment.

3.8. Effects on Cardiac Morphology

The relative weight of the heart (WT%) and morphometric measures of the right ventricle (RV), left ventricle (LV), and interventricular septum (IV) are shown in Figure 5A–D. The LV posterior wall thickness (1.45 ± 0.20 vs. 2.46 ± 0.23 mm) was increased in the negative control group compared with Sham-operated animals. However, the thickness of the LV in 2K1C-hypertensive rats were reduced with the AER and MPL treatments, showing similar values observed for normotensive animals.

3.9. Effects on Cardiac and Vascular Redox Status

The effects on tissue redox status from the treatments were evaluated and the results are summarized in Table 8. The lipid peroxidation contents were increased in renovascular hypertension at approximately 60% and 30% in the heart and aorta samples, respectively, when compared to Sham-operated group. Besides, in negative control rats, the Cat and SOD activities were decreased, while in AERV-treatment (100 and 300 mg/kg) the SOD and Cat activities were increased. Additionally, the lipid peroxidation was prevented in all evaluated tissues, but AERV and MPL treatment were not reversed the changes in heart and vascular tissues.

3.10. Effects on Intracellular cGMP Levels

After the incubation of AERV (0.01 and 0.03 mg/mL) with the aortic rings of 2K1C-hypertensive rats, it was observed an increased the cGMP levels of approximately 39% and 81%, respectively, compared with basal levels. Although its co-incubation with ODQ (100 μm) abolished this effect. The cGMP levels were increased at circa 106% by NO-donor SNP, but the co-incubation with ODQ blocked the SNP-mediated increases in cGMP (Figure 6).

4. Discussion

A renovascular hypertension (RH) model was applied in our study, which was developed by Goldblatt [36]—i.e., 2K1C-model. This pathology is commonly produced by stenosis of the renal artery, which leads to the hypoperfusion of juxtaglomerular cells with sustained activation of the renin-angiotensin system (RAS). This problem accounts for only 1–2% of cases of hypertension in the adult population, but it is important in the secondary causes of hypertension in young people. Furthermore, this disease is common in patient with atherosclerosis and appears to be frequent in certain high-risk populations. The most indicated therapeutic procedures for HR treatment are to control of blood pressure levels, preventing ischemic nephropathy progression and biochemical and structural (vascular and cardiac) changes that lead to high morbidity and mortality rates [37].
Firstly, a progressive reduction of renal function in RH was observed. Progressive renal failure provoked a rise to the cardiorenal syndrome, which leads to heart and renal failures [38]. The volume and urinary electrolyte concentration are significantly reduced, and it is associated with increased serum creatinine levels, indicating a negative prognosis on renal function [39]. Here, 2K1C-hypertensive animals showed a significant time-dependent decline in renal function. At the end of 28 days, the renal function was markedly reduced, and the serum creatinine and urea levels were increased. Prolonged AERV treatment, especially at its highest doses, blocked these changes and produced similar responses to normotensive animals. Despite of the recognized hypotensive effects of MPL, a classic antihypertensive drug, it did not reverse the alterations presented by RH. Thus, MPL showed an inferior effectiveness compared to results of the AERV treatment.
Another important consequence of sustained activation of RAS during RH is vascular functional changes and cardiac remodeling induced by hypertension. Pressure overload induces cardiac remodeling, consisting of diastolic dysfunction and concentric left ventricular hypertrophy. These changes are the most common cardiac complications of hypertension, and a dilated cardiomyopathy is established with diastolic dysfunction and reduced ejection fraction [39]. These complications can be determined and diagnosed by electrocardiographic evaluation, measurement of the ventricular wall, or by atrial and ventricular hemodynamic parameters [40]. We observed electrocardiographic changes in the 2K1C-hypertensive rats, which are compatible to classic cardiac dysfunctions induced by hypertension. All the no-treated hypertensive rats revealed a significant P wave flattening, and QT prolongation. The changes in P-wave amplitude typically reflect atrial overload, hypertrophy or dilation, that is a frequent alteration in hypertension and stroke [41]. However, the QT interval is inversely proportional to the heart rate, this parameter is measured from the beginning of the QRS complex at the end of the T wave. In addition, the QT interval measured should be divided by the square root of the preceding RR interval for the correction of heart rate, and so this corrected measure is referred to the QTc interval. Although the QTc interval was normal, the animals were tachycardic, indicating they are more leaning to arrhythmias as a result from the prolonged QT interval [42]. These alterations are generally observed in hypertensive patients, especially if they show considerable morphological changes. The QT interval can be increased in severe concentric, and eccentric left ventricular hypertrophy [43]. If we look at our results, we see that animals with electrocardiographic abnormalities also present a significant thickening of the posterior ventricular wall, a fact that indicates an important correlation between hypertension, ventricular remodeling, and cardiac electrical changes. In the meantime, the efficacy of AERV was surprising, since in addition to reducing blood pressure levels and heart rate, it also prevented cardiac morphological and electrocardiographic changes 2K1C-hypertensive animals.
The relationship between hypertension and endothelial function is now well established [44]. Thus, the severity of hypertension can be positively associated with the degree of impairment of endothelial function [45]. Besides, it has been correlated to a complex and potentially bidirectional relationship between hypertension and endothelial dysfunction [46]. In fact, oxidative stress and vascular inflammation are central features of endothelial dysfunction. The changes in reactive oxygen species (ROS) production from mitochondrial NADPH oxidase seem to be one of the main issues involved in hypertensive patients with high levels of angiotensin II [47]. Hypertensive stimuli, such as high salt and angiotensin II, promote the ROS-production in the heart, kidney, and vasculature, and they contribute to endothelial dysfunction or others cardiovascular changes [48]. The RH model used in this study induced important changes in vascular redox status, leading to profound alterations in vascular reactivity of 2K1C-hypertensive rats.
The reduction of oxidative stress and vascular inflammation have been related to reverse hypertension-induced endothelial dysfunction [49]. An emerging question that arose after the analysis of the abovementioned data was how much the cardiorenal protection induced by AERV is a consequence of a direct ROS-reduction or in an indirect way via RAS inhibition. The indirect effects were evident after concluding that AERV has a significant inhibitory effect on plasma ACE. Classic ACE inhibitors or drugs that indirectly inhibit RAS—such as MPL, a beta-blocker—may have hypotensive and antioxidant effects [50,51]. Actually, we found an important reduction of lipoperoxides (LPO) in cardiac and vascular tissues of 2K1C-hypertensive rats. AERV was also able to effectively modulate the activity of SOD and CAT, two important enzymes that constitute the first line of antioxidant tissue defense.
We decided to investigate the direct activation of the NO/cGMP pathway by AERV, and thus clarifying if there was any antioxidant and cardioprotective effects induced by the extract independently of RAS inhibition. Interestingly, a notable increase was observed after exposure to AERV in intracellular levels of cGMP from the aortic smooth muscle cells of 2K1C-hypertensive rats that suggested an independent activation of the NO/cGMP pathway. The antioxidant and cardioprotective effects of NO are already well known and reported. Several drugs and natural products with antioxidant effects can attenuate NO inactivation by superoxide and other reactive oxygen species [52,53]. In these cases, the production of NO can be induced independently of eNOS-activity and this production may also be formed from nitrite, as reported for the administration of some natural products [53]. Nitrite has shown antihypertensive effects in 2K1C-hypertensive rats by inhibition of vascular NADPH oxidase with consequent reduction of ROS production [54].
A limitation of our study was not to show if there is any interrelation between ACE inhibitions by AERV with NO/cGMP pathway activation, but the modulation of the tissue redox state appears to be an important point of convergence. Furthermore, it has not been clear to us if there is any hierarchy of response between the different secondary metabolites found in the AERV. Our chemical study showed that AERV presents in its composition polyphenolic compounds (glycosylated flavonols and chlorogenic acids), as well as triterpenoid saponins, glycosylated triterpenes and glycosylated iridoids.
The polyphenol-rich plants have been reported as antihypertensive effects and these properties can occur via the NO-cGMP pathway and ACE inhibition [55]. Flavonoids, polyphenols widely found in plants, are recognized by their antioxidant, vasorelaxant, and antihypertensive properties, as well as benefits in cardiovascular diseases with cardio and nephroprotective effects [56,57,58,59]. Thus, these polyphenols have been commonly related to antihypertensive effects from vegetal extracts, as other polyphenols, such as chlorogenic acids [60,61]. Additionally, saponins have been reported as bioactive compounds from extracts, which have shown diuretic properties and action to reduce the arterial blood pressure [62,63].

5. Conclusions

Our study showed that prolonged treatment with AERV presents a significant cardiorenal protective effect in rats with renovascular hypertension, preserving the urine excretion and electrolyte levels and reducing the blood pressure and heart rates. The data obtained suggest the role of the NO/cGMP pathway activation associated with the inhibition of the angiotensin-converting enzyme. Thus, these results support the traditional uses of R. viburnoides.

Supplementary Materials

The following are available online at https://0-www-mdpi-com.brum.beds.ac.uk/article/10.3390/pharmaceutics13101579/s1, Figure S1: Representative cross-sections of the heart, liver, and kidney in the control and AERV-treated rats. H&E stain. 40 X, Table S1: Effects of acute administration of the AERV (30, 300, and 2000 mg/kg) on body weight and food and water consumption at 14th day.

Author Contributions

All authors participated in the design, interpretation of the studies, analysis of the data and review of the manuscript. F.V.P., R.A.C.P., B.R.L., L.P.G., C.A.S.T. and P.V.M.R. conducted the experiments; L.P.G. was involved with tissue antioxidant system analysis; F.V.P., A.L.M. and D.B.S. was involved with the preparation and chemical analysis of extract; A.G.J. and D.B.S. were responsible for data discussion and manuscript corrections. All authors have read and agreed to the published version of the manuscript.

Funding

This research was funded by Fundação de Apoio ao Desenvolvimento do Ensino, Ciência e Tecnologia do Estado de Mato Grosso do Sul (FUNDECT, Brazil, 59/300.046/2015), Conselho Nacional de Desenvolvimento Científico e Tecnológico (CNPq, Brazil, 449464/2014-8 and 309054/2016-8), and Coordenação de Aperfeiçoamento de Pessoal de Nível Superior (CAPES, Brasil).

Institutional Review Board Statement

The study was conducted in accordance with the guidelines of the Declaration of Helsinki, and approved by the Institutional Ethics Committee of Universidade Federal de Mato Grosso do Sul (protocol code 947/2018).

Informed Consent Statement

Not applicable.

Data Availability Statement

Data presented in this study are included within the article.

Acknowledgments

The authors are grateful to the University Hospital of the Federal University of Grande Dourados for some biochemical analyses. The authors would also like to thank FUNDECT (Fundação de Apoio ao Desenvolvimento do Ensino, Ciência e Tecnologia do Estado de Mato Grosso do Sul), CNPq (Conselho Nacional de Desenvolvimento Científico e Tecnológico) (process number 313047/2020-0), CAPES (Coordenação de Aperfeiçoamento de Pessoal de Nível Superior), and INAU (Instituto Nacional de Áreas Úmidas).

Conflicts of Interest

The authors declare no conflict of interest.

References

  1. WHO (World Health Organization). High Blood Pressure: A Public Health Priority, World Health Day, Geneva; WHO: Geneva, Switzerland, 2013; pp. 1–13. [Google Scholar]
  2. Brown, M.J.; Cruickshank, J.K.; Dominiczak, A.; MacGregor, G.A.; Poulter, N.R.; Russell, G.I.; Thom, S.; Williams, B. Better blood pressure control: How to combine drugs. J. Hum. Hypertens. 2003, 17, 81–86. [Google Scholar] [CrossRef] [PubMed] [Green Version]
  3. De Oliveira, G.M.M.; Mendes, M.; Malachias, M.V.B.; Morais, J.; Filho, O.M.; Coelho, A.S.; Capingana, D.P.; Azevedo, V.; Soares, I.; Menete, A.; et al. 2017 Guidelines for Arterial Hypertension Management in Primary Health Care in Portuguese Language Countries. Arq. Bras. Cardiol. 2017, 109, 389–396. [Google Scholar] [CrossRef] [PubMed]
  4. Lopatowska, P.; Mlodawska, E.; Tomaszuk-Kazberuk, A.; Banach, M.; Malyszko, J. Adhering to the principles of clinical pharmacology—The correct fixed combinations of antihypertensive drugs. Expert Rev. Clin. Pharmacol. 2017, 11, 165–170. [Google Scholar] [CrossRef] [PubMed]
  5. Balogun, F.O.; Ashafa, A.O.T. A Review of Plants Used in South African Traditional Medicine for the Management and Treatment of Hypertension. Planta Medica 2019, 85, 312–334. [Google Scholar] [CrossRef] [PubMed] [Green Version]
  6. de Moura, R.S.; Resende, Â.C. Cardiovascular and Metabolic Effects of Açaí, an Amazon Plant. J. Cardiovasc. Pharmacol. 2016, 68, 19–26. [Google Scholar] [CrossRef]
  7. Da Silva, C.S.P.; Proença, C.E.B. Uso e disponibilidade de recursos medicinais no município de Ouro Verde de Goiás, GO, Brasil. Acta Bot. Bras. 2008, 22, 481–492. [Google Scholar] [CrossRef]
  8. Alves, R.; Stehmann, J.; Isaias, R.; Brandão, M. Caracterização botânica e química de Rudgea viburnoides (Cham) Benth., (Rubiaceae). Rev. Bras. Farm. 2004, 14, 49–56. [Google Scholar] [CrossRef] [Green Version]
  9. Nunes, G.; Da Silva, M.; Resende, U.; De Siqueira, J. Plantas medicinais comercializadas por raizeiros no Centro de Campo Grande, Mato Grosso do Sul. Rev. Bras. Farm. 2003, 13, 83–92. [Google Scholar] [CrossRef]
  10. Galdino, P.M.; Alexandre, L.N.; Pacheco, L.F.; Junior, R.D.S.L.; de Paula, J.R.; Pedrino, G.R.; Xavier, C.; Ferreira, P.M. Nephroprotective effect of Rudgea viburnoides (Cham.) Benth leaves on gentamicin-induced nephrotoxicity in rats. J. Ethnopharmacol. 2017, 201, 100–107. [Google Scholar] [CrossRef]
  11. Pucci, L.L.; Cunha, L.C.; Tresvenzol, L.M.; Paula, J.R.D.; Bozinis, M.C.; Freitas, P.C. Avaliação da toxicidade aguda oral e da atividade diurética da Rudgea viburnoides. Lat. Am. J. Pharm. 2010, 29, 30–37. [Google Scholar]
  12. Almeida, J.M.; Ferreira, A.V.; Oliveira, V.B.; Oliveira, M.; Teixeira, M.M.; Brandão, M.G. Effects of Rudgea viburnoides (Cham.) Benth. (Rubiaceae) Leaves on Metabolic and Inflammatory Dysfunction Induced by High Refined Carbohydrate-Containing Diet in Mice. J. Med. Food 2018, 21, 1266–1275. [Google Scholar] [CrossRef] [PubMed]
  13. Young, M.C.M.; Araujo, A.R.; da Silva, C.A.; Lopes, M.N.; Trevisan, L.M.V.; Bolzani, V. Triterpenes and Saponins from Rudgea viburnioides. J. Nat. Prod. 1998, 61, 936–938. [Google Scholar] [CrossRef] [PubMed]
  14. Younis, W.; Schini-Kerth, V.; da Silva, D.B.; Junior, A.G.; Bukhari, I.A.; Assiri, A.M. Role of the NO/cGMP pathway and renin-angiotensin system in the hypotensive and diuretic effects of aqueous soluble fraction from Crataegus songarica K. Koch. J. Ethnopharmacol. 2020, 249, 112400. [Google Scholar] [CrossRef] [PubMed]
  15. National Research Council (US) Committee for the Update of the Guide for the Care and Use of Laboratory Animals. In Guide for the Care and Use of Laboratory Animals, 8th ed.; National Academies Press: Washington, DC, USA, 2011.
  16. OECD (Organization for Economic Co-operation and Development). Guidelines for Testing of Chemical, Guideline 425. In Acute Oral Toxicity—Up-and-Down-Procedure (UDP); OECD Publishing: Paris, France, 2007; pp. 1–8. [Google Scholar]
  17. Malone, M.H.; Robichaud, R.C. A hippocratic screen for pure or crude drug materials. Lloydia 1962, 25, 320–332. [Google Scholar]
  18. Umar, A.; Imam, G.; Yimin, W.; Kerim, P.; Tohti, I.; Berke, B.; Moore, N. Antihypertensive effects of Ocimum basilicum L. (OBL) on blood pressure in renovascular hypertensive rats. Hypertens. Res. 2010, 33, 727–730. [Google Scholar] [CrossRef] [Green Version]
  19. Gasparotto-Junior, A.; Boffo, M.A.; Lourenço, E.L.B.; Stefanello, M.E.A.; Kassuya, C.A.L.; Marques, M.C.A. Natriuretic and diuretic effects of Tropaeolum majus (Tropaeolaceae) in rats. J. Ethnopharmacol. 2009, 122, 517–522. [Google Scholar] [CrossRef]
  20. Santos, R.; Krieger, E.M.; Greene, L.J. An improved fluorometric assay of rat serum and plasma converting enzyme. Hypertension 1985, 7, 244–252. [Google Scholar] [CrossRef] [Green Version]
  21. McGregor, D.D. The effect of sympathetic nerve stimulation on vasoconstrictor responses in perfused mesenteric blood vessels of the rat. J. Physiol. 1965, 177, 21–30. [Google Scholar] [CrossRef]
  22. Gao, R.; Yuan, Z.; Zhao, Z.; Gao, X. Mechanism of pyrogallol autoxidation and determination of superoxide dismutase enzyme activity. Bioelectrochem. Bioenerg. 1998, 45, 41–45. [Google Scholar] [CrossRef]
  23. Jiang, Z.-Y.; Hunt, J.V.; Wolff, S.P. Ferrous ion oxidation in the presence of xylenol orange for detection of lipid hydroperoxide in low density lipoprotein. Anal. Biochem. 1992, 202, 384–389. [Google Scholar] [CrossRef]
  24. Beers, R.F.; Sizer, I.W. A spectrophotometric method for measuring the breakdown of hydrogen peroxide by catalase. J. Biol. Chem. 1952, 195, 133–140. [Google Scholar] [CrossRef]
  25. Bradford, M.M. A rapid and sensitive method for the quantitation of microgram quantities of protein utilizing the principle of protein-dye binding. Anal. Biochem. 1976, 72, 248–254. [Google Scholar] [CrossRef]
  26. Estancial, C.S.; Rodrigues, R.L.; De Nucci, G.; Antunes, E.; Mónica, F.Z. Pharmacological characterization of the relaxation induced by the soluble guanylate cyclase activator, BAY 60-2770 in rabbit corpus cavernosum. BJU Int. 2015, 116, 657–664. [Google Scholar] [CrossRef] [Green Version]
  27. da Silva, D.; Okano, L.T.; Lopes, N.P.; De Oliveira, D.C. Flavanone glycosides from Bidens gardneri Bak. (Asteraceae). Phytochemistry 2013, 96, 418–422. [Google Scholar] [CrossRef]
  28. Clifford, M.N.; Johnston, K.L.; Knight, S.; Kuhnert, N. Hierarchical Scheme for LC-MSnIdentification of Chlorogenic Acids. J. Agric. Food Chem. 2003, 51, 2900–2911. [Google Scholar] [CrossRef] [PubMed]
  29. Wang, M.; Wang, Q.; Yang, Q.; Yan, X.; Feng, S.; Wang, Z. Comparison of Anthraquinones, Iridoid Glycosides and Triterpenoids in Morinda officinalis and Morinda citrifolia Using UPLC/Q-TOF-MS and Multivariate Statistical Analysis. Molecules 2019, 25, 160. [Google Scholar] [CrossRef] [PubMed] [Green Version]
  30. Zhao, X.; Wei, J.; Yang, M. Simultaneous Analysis of Iridoid Glycosides and Anthraquinones in Morinda officinalis Using UPLC-QqQ-MS/MS and UPLC-Q/TOF-MSE. Molecules 2018, 23, 1070. [Google Scholar] [CrossRef] [PubMed] [Green Version]
  31. Li, C.-M.; Zhang, X.-L.; Xue, X.-Y.; Zhang, F.-F.; Xu, Q.; Liang, X.-M. Structural characterization of iridoid glucosides by ultra-performance liquid chromatography/electrospray ionization quadrupole time-of-flight tandem mass spectrometry. Rapid Commun. Mass Spectrom. 2008, 22, 1941–1954. [Google Scholar] [CrossRef]
  32. de Villiers, A.; Venter, P.; Pasch, H. Recent advances and trends in the liquid-chromatography–mass spectrometry analysis of flavonoids. J. Chromatogr. A 2016, 1430, 16–78. [Google Scholar] [CrossRef]
  33. Abe, F.; Yamauchi, T. Trachelospermum. IV. Glycosides of 19.ALPHA.-hydroxyoleanane-type triterpenoids from Trachelospermum asiaticum. Chem. Pharm. Bull. 1987, 35, 1833–1838. [Google Scholar] [CrossRef] [Green Version]
  34. Zhao, Z.; He, X.; Zhao, Y.; Sun, Y.; Chen, X.; Cun, Y.; Huang, L.; Bai, Y.; Zheng, X. Phytochemistry, Pharmacology and Traditional Uses of Plants from the Genus Trachelospermum L. Molecules 2017, 22, 1406. [Google Scholar] [CrossRef]
  35. Kanwal, N.; Siddiqui, A.J.; Haq, F.U.; El-Seedi, H.R.; Musharraf, S.G. Two-stage mass spectrometry approach for the analysis of triterpenoid glycosides in Fagonia indica. RSC Adv. 2018, 8, 41023–41031. [Google Scholar] [CrossRef] [Green Version]
  36. Goldblatt, H. Studies on experimental hypertension: III. The production of persistent hypertension in monkeys (macaque) by renal ischemia. J. Exp. Med. 1937, 65, 671–675. [Google Scholar] [CrossRef] [Green Version]
  37. Samadian, F.; Dalili, N.; Jamalian, A. New Insights into Pathophysiology, Diagnosis, and Treatment of Renovascular Hypertension. Iran. J. Kidney Dis. 2017, 11, 79–89. [Google Scholar]
  38. Messerli, F.H.; Rimoldi, S.F.; Bangalore, S. The Transition from Hypertension to Heart Failure: Contemporary update. JACC Heart Fail. 2017, 5, 543–551. [Google Scholar] [CrossRef]
  39. Bastard, J.-P.; Fellahi, S.; Regeniter, A.; Capeau, J.; Ronco, P.; Plaisier, E. Aside from acute renal failure cases, are urinary markers of glomerular and tubular function useful in clinical practice? Clin. Biochem. 2019, 65, 1–6. [Google Scholar] [CrossRef] [PubMed]
  40. Ponikowski, P.; Voors, A.A.; Anker, S.D.; Bueno, H.; Cleland, J.G.F.; Coats, A.J.S.; Falk, V.; González-Juanatey, J.R.; Harjola, V.-P.; Jankowska, E.A.; et al. 2016 ESC Guidelines for the diagnosis and treatment of acute and chronic heart failure: The Task Force for the diagnosis and treatment of acute and chronic heart failure of the European Society of Cardiology (ESC)Developed with the special contribution of the Heart Failure Association (HFA) of the ESC. Eur. Heart J. 2016, 37, 2129–2200. [Google Scholar] [CrossRef] [PubMed]
  41. He, J.; Tse, G.; Korantzopoulos, P.; Letsas, K.P.; Ali-Hasan-Al-Saegh, S.; Kamel, H.; Li, G.; Lip, G.Y.; Liu, T. P-Wave Indices and Risk of Ischemic Stroke: A Systematic Review and Meta-Analysis. Stroke 2017, 48, 2066–2072. [Google Scholar] [CrossRef] [PubMed] [Green Version]
  42. Postema, P.G.; Wilde, A.A.M. The Measurement of the QT Interval. Curr. Cardiol. Rev. 2014, 10, 287–294. [Google Scholar] [CrossRef]
  43. Kunisek, J.; Zaputović, L.; Cubranic, Z.; Kunisek, L.; Butorac, M.Z.; Lukin-Eskinja, K.; Karlavaris, R. Influence of the left ventricular types on QT intervals in hypertensive patients. Anatol. J. Cardiol. 2015, 15, 33–39. [Google Scholar] [CrossRef]
  44. Panza, J.A.; Quyyumi, A.A.; Brush, J.E.; Epstein, S.E. Abnormal Endothelium-Dependent Vascular Relaxation in Patients with Essential Hypertension. N. Engl. J. Med. 1990, 323, 22–27. [Google Scholar] [CrossRef]
  45. Panza, J.A.; García, C.E.; Kilcoyne, C.M.; Quyyumi, A.A.; Cannon, R.O. Impaired Endothelium-Dependent Vasodilation in Patients with Essential Hypertension: Evidence that nitric oxide abnormality is not localized to a single signal transduction pathway. Circulation 1995, 91, 1732–1738. [Google Scholar] [CrossRef] [PubMed]
  46. Sander, M.; Chavoshan, B.; Victor, R.G. A Large Blood Pressure–Raising Effect of Nitric Oxide Synthase Inhibition in Humans. Hypertension 1999, 33, 937–942. [Google Scholar] [CrossRef] [PubMed] [Green Version]
  47. Doughan, A.K.; Harrison, D.G.; Dikalov, S.I. Molecular Mechanisms of Angiotensin II–Mediated Mitochondrial dysfunction: Linking mitochondrial oxidative damage and vascular endothelial dysfunction. Circ. Res. 2008, 102, 488–496. [Google Scholar] [CrossRef] [Green Version]
  48. Harrison, D.G.; Gongora, M.C. Oxidative Stress and Hypertension. Med. Clin. N. Am. 2009, 93, 621–635. [Google Scholar] [CrossRef] [PubMed]
  49. Widlansky, M.; Gokce, N.; Keaney, J.; Vita, J. The clinical implications of endothelial dysfunction. J. Am. Coll. Cardiol. 2003, 42, 1149–1160. [Google Scholar] [CrossRef] [Green Version]
  50. Hanif, K.; Bid, H.K.; Konwar, R. Reinventing the ACE inhibitors: Some old and new implications of ACE inhibition. Hypertens. Res. 2009, 33, 11–21. [Google Scholar] [CrossRef] [PubMed] [Green Version]
  51. Hocht, C.; Bertera, F.M.; Del Mauro, J.S.; Plantamura, Y.S.; Taira, C.A.; Polizio, A.H. What is the Real Efficacy of Beta-Blockers for the Treatment of Essential Hypertension? Curr. Pharm. Des. 2017, 23, 4658–4677. [Google Scholar] [CrossRef] [PubMed]
  52. Bondonno, C.P.; Croft, K.D.; Ward, N.; Considine, M.J.; Hodgson, J.M. Dietary flavonoids and nitrate: Effects on nitric oxide and vascular function. Nutr. Rev. 2015, 73, 216–235. [Google Scholar] [CrossRef]
  53. Pinheiro, L.C.; Tanus-Santos, J.E.; Castro, M.M. The potential of stimulating nitric oxide formation in the treatment of hypertension. Expert Opin. Ther. Targets 2017, 21, 543–556. [Google Scholar] [CrossRef]
  54. Montenegro, M.F.; Amaral, J.H.; Pinheiro, L.C.; Sakamoto, E.K.; Ferreira, G.C.; Reis, R.I.; Marçal, D.M.; Pereira, R.P.; Tanus-Santos, J.E. Sodium nitrite downregulates vascular NADPH oxidase and exerts antihypertensive effects in hypertension. Free. Radic. Biol. Med. 2011, 51, 144–152. [Google Scholar] [CrossRef] [Green Version]
  55. Hügel, H.M.; Jackson, N.; May, B.; Zhang, A.L.; Xue, C.C. Polyphenol protection and treatment of hypertension. Phytomedicine 2016, 23, 220–231. [Google Scholar] [CrossRef]
  56. Siasos, G.; Tousoulis, D.; Tsigkou, V.; Kokkou, E.; Oikonomou, E.; Vavuranakis, M.; Basdra, E.; Papavassiliou, A.; Stefanadis, C. Flavonoids in Atherosclerosis: An Overview of Their Mechanisms of Action. Curr. Med. Chem. 2013, 20, 2641–2660. [Google Scholar] [CrossRef]
  57. Khoo, N.K.; White, C.R.; Pozzo-Miller, L.; Zhou, F.; Constance, C.; Inoue, T.; Patel, R.; Parks, D.A. Dietary flavonoid quercetin stimulates vasorelaxation in aortic vessels. Free. Radic. Biol. Med. 2010, 49, 339–347. [Google Scholar] [CrossRef] [Green Version]
  58. Yao, L.H.; Jiang, Y.M.; Shi, J.; Datta, N.; Singanusong, R.; Chen, S.S. Flavonoids in Food and Their Health Benefits. Plant Foods Hum. Nutr. 2004, 59, 113–122. [Google Scholar] [CrossRef]
  59. Chaudhry, M.A.; Mushtaq, M.N.; Bukhari, I.A.; Assiri, A.M. Ipomoea hederacea Jacq.: A plant with promising antihypertensive and cardio-protective effects. J. Ethnopharmacol. 2021, 268, 113584. [Google Scholar] [CrossRef]
  60. Wang, C.; Pan, Y.; Zhang, Q.-Y.; Wang, F.-M.; Kong, L.-D. Quercetin and Allopurinol Ameliorate Kidney Injury in STZ-Treated Rats with Regulation of Renal NLRP3 Inflammasome Activation and Lipid Accumulation. PLoS ONE 2012, 7, e38285. [Google Scholar] [CrossRef] [PubMed] [Green Version]
  61. Naveed, M.; Hejazi, V.; Abbas, M.; Kamboh, A.A.; Khan, G.J.; Shumzaid, M.; Ahmad, F.; Babazadeh, D.; FangFang, X.; Modarresi-Ghazani, F.; et al. Chlorogenic acid (CGA): A pharmacological review and call for further research. Biomed. Pharmacother. 2018, 97, 67–74. [Google Scholar] [CrossRef]
  62. Hiwatashi, K.; Shirakawa, H.; Hori, K.; Yoshiki, Y.; Suzuki, N.; Hokari, M.; Komai, M.; Takahashi, S. Reduction of Blood Pressure by Soybean Saponins, Renin Inhibitors from Soybean, in Spontaneously Hypertensive Rats. Biosci. Biotechnol. Biochem. 2010, 74, 2310–2312. [Google Scholar] [CrossRef] [PubMed] [Green Version]
  63. Rhiouani, H.; Settaf, A.; Lyoussi, B.; Cherrah, Y.; Lacaille-Dubois, M.-A.; Hassar, M. Effects of saponins from Herniaria glabra on blood pressure and renal function in spontaneously hypertensive rats. Therapie 2000, 54, 735–739. [Google Scholar]
Figure 1. Base peak chromatograms from leaves aqueous extract of Rudgea viburnoides (AERV) obtained in positive (a) and negative ion modes (b).
Pharmaceutics 13 01579 g001
Figure 2. Electrocardiographic quantitative data from Sham (S) or 2K1C-hypertensive rats treated with AERV (30, 100, and 300 mg/kg), MPL (20 mg/kg), or vehicle (NC). P (A), Q (B), R (C), S (D), and T-wave amplitudes (E) and P (F), PR (G), QRS (H), QT (I), and QTC-segments (J) are shown. The values are expressed as mean ± S.E.M. In each group, 8 to 10 animals were used, and the comparisons were performed with the negative control (NC, a p < 0.05) or Sham-operated rats (b p < 0.05) applying one-way ANOVA followed by Bonferroni’s test. AERV: aqueous extract from Rudgea viburnoides; MPL: metoprolol; NC: negative control.
Pharmaceutics 13 01579 g002
Figure 3. Prolonged oral administration of AERV obtained from Rudgea viburnoides reverses changes in blood pressure and heart rate induced by 2K1C hypertensive rats. SBP (A), DBP (B), MAP (C), and HR (D) are shown. The values are expressed as mean ± S.E.M. In each group, 8 to 10 animals were used, and the comparison between negative control (NC, a p < 0.05) or Sham-operated rats (b p < 0.05) were performed applying one-way ANOVA followed by Bonferroni’s test. AERV: aqueous extract from Rudgea viburnoides; MPL: metoprolol; NC: negative control; S: Sham-operated group.
Pharmaceutics 13 01579 g003
Figure 4. Effects of the prolonged oral administration of AERV obtained from Rudgea viburnoides on mesenteric vascular reactivity of 2K1C-hypertensive rats. Effects of phenylephrine (A), acetylcholine (B), and sodium nitroprusside (C) are shown. The values are expressed as mean ± S.E.M. In each group, 8 to 10 animals were used, and the comparison between negative control (NC, a p < 0.05) or Sham-operated rats (b p < 0.05) were performed applying one-way ANOVA followed by Bonferroni’s test. ACh: acetylcholine; AERV: aqueous extract from R. viburnoides; MPL: metoprolol; NC: negative control; Phe: phenylephrine; PP: perfusion pressure; SNP: sodium nitroprusside.
Pharmaceutics 13 01579 g004
Figure 5. Effects of the AERV treatment on heart histopathological changes induced by 2K1C-hypertensive rats. WT% of the heart (A), and morphometric data of right ventricle posterior wall (B), left ventricle posterior wall (C), and interventricular septum (D) are shown. The values are expressed as mean ± S.E.M. In each group, 8 to 10 animals were used, and the comparison between negative control (NC, a p < 0.05) or Sham-operated rats (b p < 0.05) were performed applying one-way ANOVA followed by Bonferroni’s test. AERV: aqueous extract from Rudgea viburnoides; MPL: metoprolol; NC: negative control; S: Sham-operated group.
Pharmaceutics 13 01579 g005
Figure 6. Vascular effects of AERV obtained from Rudgea viburnoides and the role of NO/cGMP pathway. In the absence and in presence of ODQ (100 μm), the intracellular cGMP levels from 2K1C-hypertensive rat aortic rings incubated with AERV (0.003, 0.01, and 0.03 mg/mL) or sodium nitroprusside (SNP) are expressed. The values are expressed as mean ± S.E.M. applying 8 to 10 preparations per group. (p < 0.05 vs. a control (C) or after incubation with b ODQ).
Pharmaceutics 13 01579 g006
Table 1. Compounds annotated from aqueous extract of Rudgea viburnoides (AERV) by LC-DAD-MS/MS.
PeakRT (min)UV(nm)MFPositive Ion Mode (m/z)Negative Ion Mode (m/z)CompoundMetabolite Class%
MS [M+H]+MS [M-H]MS/MS
11.1-C7H12O6193.0696191.0534191 (bp), 173Quinic acidCarboxylic acid18.34
21.1-C12H22O11-341.1095191(bp)di-O-hexosidePrimary metabolite4.36
31.5-C6H8O7193.0367191.0209-Citric acidCarboxylic acid1.31
42.7-C16H20O10373.1113371.0991191, 173 (bp)Glycosylated iridoidIridoid0.31
55.9295 sh, 325C16H18O9355.1006353.0873191 (bp), 1793-O-E-caffeoylquinic acid stChlorogenic acid3.66
69.9-C18H24O12-431.1195251, 165 (bp)Asperulosidic acidIridoid4.67
710.5295 sh, 325C16H18O9355.1021353.0873191 (bp), 1795-O-E-caffeoylquinic acid stChlorogenic acid2.48
811.3-C18H22O11415.1223413.1084191, 147 (bp)AsperulosideIridoid11.98
918.7265, 355C27H30O16611.1595609.1472300 (bp), 301, 271, 255, 243O-hexosyl-deoxyhexosyl quercetinFlavonol3.87
1020.0-C24H42O11507.2822505.2655191 (bp)Unknown-1.81
1120.8265, 346C27H30O15595.1644593.1521327, 285 (bp), 284, 255, 277, 162O-hexosyl-deoxyhexosyl kaempferolFlavonol9.26
1225.0-C36H58O12683.3967681.3823519 (bp), 501, 407, 207Trachelosperoside B-1 or E-1Glycosylated triterpene14.40
1325.1-C36H58O12683.3981681.3832519 (bp), 501, 489, 457, 407, 207Trachelosperoside B-1 or E-1Glycosylated triterpene12.84
1426.6-C36H58O12667.4027665.3757503 (bp), 441, 409Glycosylated triterpene (Arjunoglucoside I)Glycosylated triterpene 2.25
1532.1-C53H84O231089.52981087.5303925 (bp), 793, 631, 613, 569, 469, 455, 353, 161O-glucoronyl-hexosyl-pentosyl O-hexosyl triterpeneTriperpenoid saponin2.09
1632.2-C48H76O19957.5026955.4914793 (bp), 749, 731, 631, 613, 569, 551, 455, 337, 179O-glucoronyl-hexosyl O-hexosyl triterpeneTriperpenoid saponin6.37
MF: molecular formula; RT: retention time; sh: shoulder; bp: base peak; st: confirmed by injection of authentic standard; %: relative percentage of area obtained in negative ion mode.
Table 2. Effects on urinary volume and electrolyte excretion, pH, and density of AERV obtained from Rudgea viburnoides on first day of treatment.
GroupUrinary Volume (mL/100 g/8 h)ElNa+
(µEq/min/100 g)
Elk+
(µEq/min/100 g)
ElCa2+
(µEq/min/100 g)
ElCl−
(µEq/min/100 g)
pHDensity
Sham3.771 ± 0.1881.694 ± 0.1080.571 ± 0.0290.021 ± 0.0011.902 ± 0.1138.5 ± 0.041015 ± 0.84
C-4.517 ± 0.2190.826 ± 0.006 b0.546 ± 0.0100.012 ± 0.002 b0.981± 0.016 b8.3 ± 0.021010 ± 0.28 b
AERV 30 (mg/kg)3.665 ± 0.0210.887 ± 0.087 b0.615 ± 0.0320.007 ± 0.001 b1.021 ± 0.029 b8.7 ± 0.131015 ± 0.42
AERV (100 mg/kg)3.831 ± 0.4450.878 ± 0.057 b0.614 ± 0.0450.012 ± 0.001 b1.026 ± 0.074 b8.7 ± 0.151015 ± 0.42
AERV (300 mg/kg)3.279 ± 0.1291.473 ± 0.054 a0.554 ±0.0180.029 ± 0.001 a1.653 ± 0.025 a8.6 ± 0.051016 ± 1.52
MPL (25 mg/kg)4.378 ± 0.2231.651 ± 0.082 a0.520 ± 0.0690.022 ± 0.003 a1.791 ± 0.038 a8.1 ± 0.171014 ± 1.15
The values are expressed as mean ± S.E.M. In each group, 8 to 10 animals were used, and the comparisons were performed with the negative control (C-; a p < 0.05) or Sham-operated group (b p < 0.05) applying one-way ANOVA followed by Bonferroni’s test. El: excreted load; MPL: metoprolol.
Table 3. Effects on urinary volume and electrolyte excretion, pH and density of AERV obtained from Rudgea viburnoides on seventh day of treatment.
GroupUrinary Volume (mL/100 g/8 h)ElNa+
(µEq/min/100 g)
Elk+
(µEq/min/100 g)
ElCa2+
(µEq/min/100 g)
ElCl−
(µEq/min/100 g)
pHDensity
Sham5.272 ± 0.2241.207 ± 0.0870.591 ± 0.0310.011 ± 0.0011.348 ± 0.1947.8 ± 0.061007 ± 0.42
C-3.862 ± 0.613 b1.261 ± 0.1240.597 ± 0.0340.013 ± 0.0031.344 ± 0.1277.7 ± 0.051013 ± 0.57 b
AERV 30 (mg/kg)3.661 ± 0.208 b1.178 ± 0.0260.570 ± 0.0110.009 ± 0.0011.319 ± 0.1227.8 ± 0.071017 ± 1.11 b
AERV (100 mg/kg)2.939 ± 0.396 b0.906 ± 0.0960.438 ± 0.0220.009 ± 0.0010.971 ± 0.1067.8 ± 0.111017 ± 1.83 b
AERV (300 mg/kg)3.513 ± 0.334 b0.702 ± 0.2680.396 ± 0.0990.008 ± 0.0040.803 ± 0.3147.6 ± 0.141006 ± 2.30 a
MPL (25 mg/kg)4.043 ± 0.3331.181 ± 0.1400.540 ± 0.0780.009 ± 0.0061.295 ± 0.1827.7 ± 0.021008 ± 0.57 a
The values are expressed as mean ± S.E.M. In each group, 8 to 10 animals were used, and the comparisons were performed with the negative control (C-; a p < 0.05) or Sham-operated group (b p < 0.05) applying one-way ANOVA followed by Bonferroni’s test. El: excreted load; MPL: metoprolol.
Table 4. Effects on urinary volume and electrolyte excretion, pH, and density of AERV obtained from Rudgea viburnoides on fourteenth day of treatment.
GroupUrinary Volume (mL/100 g/8 h)ElNa+
(µEq/min/100 g)
Elk+
(µEq/min/100 g)
ElCa2+
(µEq/min/100 g)
ElCl−
(µEq/min/100 g)
pHDensity
Sham4.319 ± 0.3991.363 ± 0.1010.635 ± 0.0570.034 ± 0.0021.853 ± 0.1247.8 ± 0.021016 ± 0.96
C-3.389 ± 0.032 b0.846 ± 0.049 b0.809 ± 0.1010.017 ± 0.003 b1.376 ± 0.096 b7.8 ± 0.141018 ± 0.80
AERV 30 (mg/kg)3.139 ± 0.186 b0.893 ± 0.028 b0.641 ± 0.0490.018 ± 0.002 b1.340 ± 0.016 b7.7 ± 0.201018 ± 1.23
AERV (100 mg/kg)2.794 ± 0.407 b1.193 ± 0.1410.658 ± 0.0760.012 ± 0.002 b1.003 ± 0.153 b7.6 ± 0.161015 ± 0.73
AERV (300 mg/kg)4.350 ± 0.164 a1.319 ± 0.023 a0.796 ± 0.1290.040 ± 0.009 a1.807 ± 0.082 a7.7 ± 0.021016 ± 0.28
MPL (25 mg/kg)3.975 ± 0.050 a1.169 ± 0.1180.652 ± 0.0090.009 ± 0.002 b1.190 ± 0.134 b7.6 ± 0.081017 ± 1.15
The values are expressed as mean ± S.E.M. In each group, 8 to 10 animals were used, and the comparisons were performed with the negative control (C-; a p < 0.05) or Sham-operated group (b p < 0.05) applying one-way ANOVA followed by Bonferroni’s test. El: excreted load; MPL: metoprolol.
Table 5. Effects on urinary volume and electrolyte excretion, pH, and density of AERV obtained from Rudgea viburnoides on twenty-first day of treatment.
GroupUrinary Volume (mL/100 g/8 h)ElNa+
(µEq/min/100 g)
Elk+
(µEq/min/100 g)
ElCa2+
(µEq/min/100g)
ElCl−
(µEq/min/100 g)
pHDensity
Sham5.111 ± 0.1171.319 ± 0.1440.667 ± 0.0300.020 ± 0.0011.486 ± 0.0417.2 ± 0.121012 ± 0.55
C-3.209 ± 0.422 b1.157 ± 0.1820.419 ± 0.069 b0.007 ± 0.004 b1.279 ± 0.1967.3 ± 0.121018 ± 1.15 b
AERV 30 (mg/kg)3.143 ± 0.040 b1.192 ± 0.0110.523 ± 0.0150.027 ± 0.001 a1.422 ± 0.0157.6 ± 0.171022 ± 0.73 b
AERV (100 mg/kg)3.712 ± 0.099 b1.295 ± 0.0280.565 ± 0.0130.018 ± 0.002 a1.417 ± 0.0527.6 ± 0.191017 ± 1.11 b
AERV (300 mg/kg)4.387 ± 0.264 a0.899 ± 0.1690.781 ± 0.013 a0.041 ± 0.002 a1.344 ± 0.0607.3 ± 0.111012 ± 1.73 a
MPL (25 mg/kg)3.062 ± 0.022 b0.880 ± 0.1820.495 ± 0.0990.009 ± 0.003 b0.892 ± 0.213 b7.3 ± 0.341019 ± 0.28 b
The values are expressed as mean ± S.E.M. In each group, 8 to 10 animals were used, and the comparisons were performed with the negative control (C-; a p < 0.05) or Sham-operated group (b p < 0.05) applying one-way ANOVA followed by Bonferroni’s test. El: Excreted load; MPL: Metoprolol.
Table 6. Effects on urinary volume and electrolyte excretion, pH, and density of AERV obtained from Rudgea viburnoides on twenty-eighth day of treatment.
GroupUrinary Volume (mL/100 g/8 h)ElNa+
(µEq/min/100 g)
Elk+
(µEq/min/100 g)
ElCa2+
(µEq/min/100 g)
ElCl−
(µEq/min/100 g)
pHDensity
Sham4.196 ± 0.0981.348 ± 0.0860.639 ± 0.0260.063 ± 0.0051.532 ± 0.0817.4 ± 0.171015 ± 0.91
C-3.350 ± 0.064 b0.860 ± 0.022 b0.680 ± 0.0100.020 ± 0.001 b1.039 ± 0.027 b7.6 ± 0.181019 ± 0.57 b
AERV 30 (mg/kg)3.504 ± 0.142 b1.311 ± 0.1020.681 ± 0.0450.022 ± 0.003 b1.527 ± 0.085 a7.7 ± 0.171018 ± 0.42 b
AERV (100 mg/kg)3.449 ± 0.125 b1.296 ± 0.0710.608 ± 0.0010.015 ± 0.001 b1.413 ± 0.077 a7.6 ± 0.141014 ± 0.55 a
AERV (300 mg/kg)3.927 ± 0.192 a1.289 ± 0.0790.667 ± 0.0260.037 ± 0.0161.465 ± 0.098 a7.5 ± 0.12 a1015 ± 0.57 a
MPL (25 mg/kg)3.433 ± 0.215 b1.274 ± 0.1590.678 ± 0.1060.016 ± 0.003 b1.165 ± 0.1717.3 ± 0.111017 ± 2.30
The values are expressed as mean ± S.E.M. In each group, 8 to 10 animals were used, and the comparisons were performed with the negative control (C-; a p < 0.05) or Sham-operated group (b p < 0.05) applying one-way ANOVA followed by Bonferroni’s test. El: excreted load; MPL: metoprolol.
Table 7. Effects on serum Na+, K+, urea, creatinine, and plasmatic ACE activity of AERV obtained from Rudgea viburnoides on twenty-eighth day of treatment.
GroupNa+
(mmol/L)
K+
(mmol/L)
Urea (mg/dL)Creatinine (mg/dL)ACE Activity (mmol/min/mL)
Sham126.5 ± 1.215.81 ± 0.2257.32 ± 0.930.32 ± 0.0285 ± 10.10
C-130.2 ± 1.866.15 ± 0.3585.80 ± 2.75 b0.67 ± 0.03 b155 ± 13.22 b
AERV (30 mg/kg)131.7 ± 1.996.22 ± 0.1277.08 ± 1.56 b0.59 ± 0.02 b121 ± 9.11 b
AERV (100 mg/kg)129.9 ± 1.236.13 ± 0.5156.63 ± 1.170.33 ± 0.0198 ± 10.24 a
AERV (300 mg/kg)126.0 ± 2.035.77 ± 0.2257.36 ± 1.230.35 ± 0.0390 ± 12.11 a
MPL (25 mg/kg)129.1 ± 1.925.41 ± 0.2158.22 ± 3.210.37 ± 0.05100 ± 11.08 a
The values are expressed as mean ± S.E.M. In each group, 8 to 10 animals were used, and the comparisons were performed with the negative control (C-; a p < 0.05) or Sham-operated group (b p < 0.05) applying one-way ANOVA followed by Bonferroni’s test. El: excreted load; MPL: metoprolol.
Table 8. Effects on tissue redox status of AERV obtained from Rudgea viburnoides.
ParameterShamC-AERV
(30 mg/kg)
AERV
(100 mg/kg)
AERV
(300 mg/kg)
MPL
(25 mg/kg)
Heart
SOD40.57 ± 1.6130.54 ± 0.61 b34.89 ± 1.49 b38.03 ± 1.23 a40.46 ± 1.40 a34.84 ± 1.84 b
Cat45.10 ± 4.3325 ± 5.15 b52 ± 6.68 a45 ± 3.61 a55 ± 9.21 a28 ± 75.35 b
LPO16.48 ± 0.9725.17 ± 0.35 b18.10 ± 0.6517.99 ± 0.7317.42 ± 0.59 a17.93 ± 0.37
Aorta
SOD71.73 ± 5.0062.37 ± 2.5567.48 ± 1.3668.61 ± 1.3769.64 ± 1.7362.83 ± 1.53
Cat61 ± 3.7941 ± 4.58 b52 ± 5.7958 ± 4.38 a77 ± 4.25 a49 ± 4.31 b
LPO6.90 ± 0.538.54 ± 0.38 b7.61 ± 0.417.29 ± 0.416.91 ± 0.47 a7.22 ± 0.33
The values are expressed as mean ± S.E.M. In each group, 8 to 10 animals were used, and the comparisons were performed with the negative control (C-; a p < 0.05) or Sham-operated group (b p < 0.05) applying one-way ANOVA followed by Bonferroni’s test. MPL: metoprolol. SOD: superoxide dismutase (Unit of SOD/mg of protein); Cat: catalase (unit of SOD/mg of protein); LPO: lipoperoxides (nmol hydroperoxides/mg of protein).
Publisher’s Note: MDPI stays neutral with regard to jurisdictional claims in published maps and institutional affiliations.

