
PL1 Peptide Engages Acidic Surfaces on Tumor-Associated Fibronectin and Tenascin Isoforms to Trigger Cellular Uptake

 , , , , and
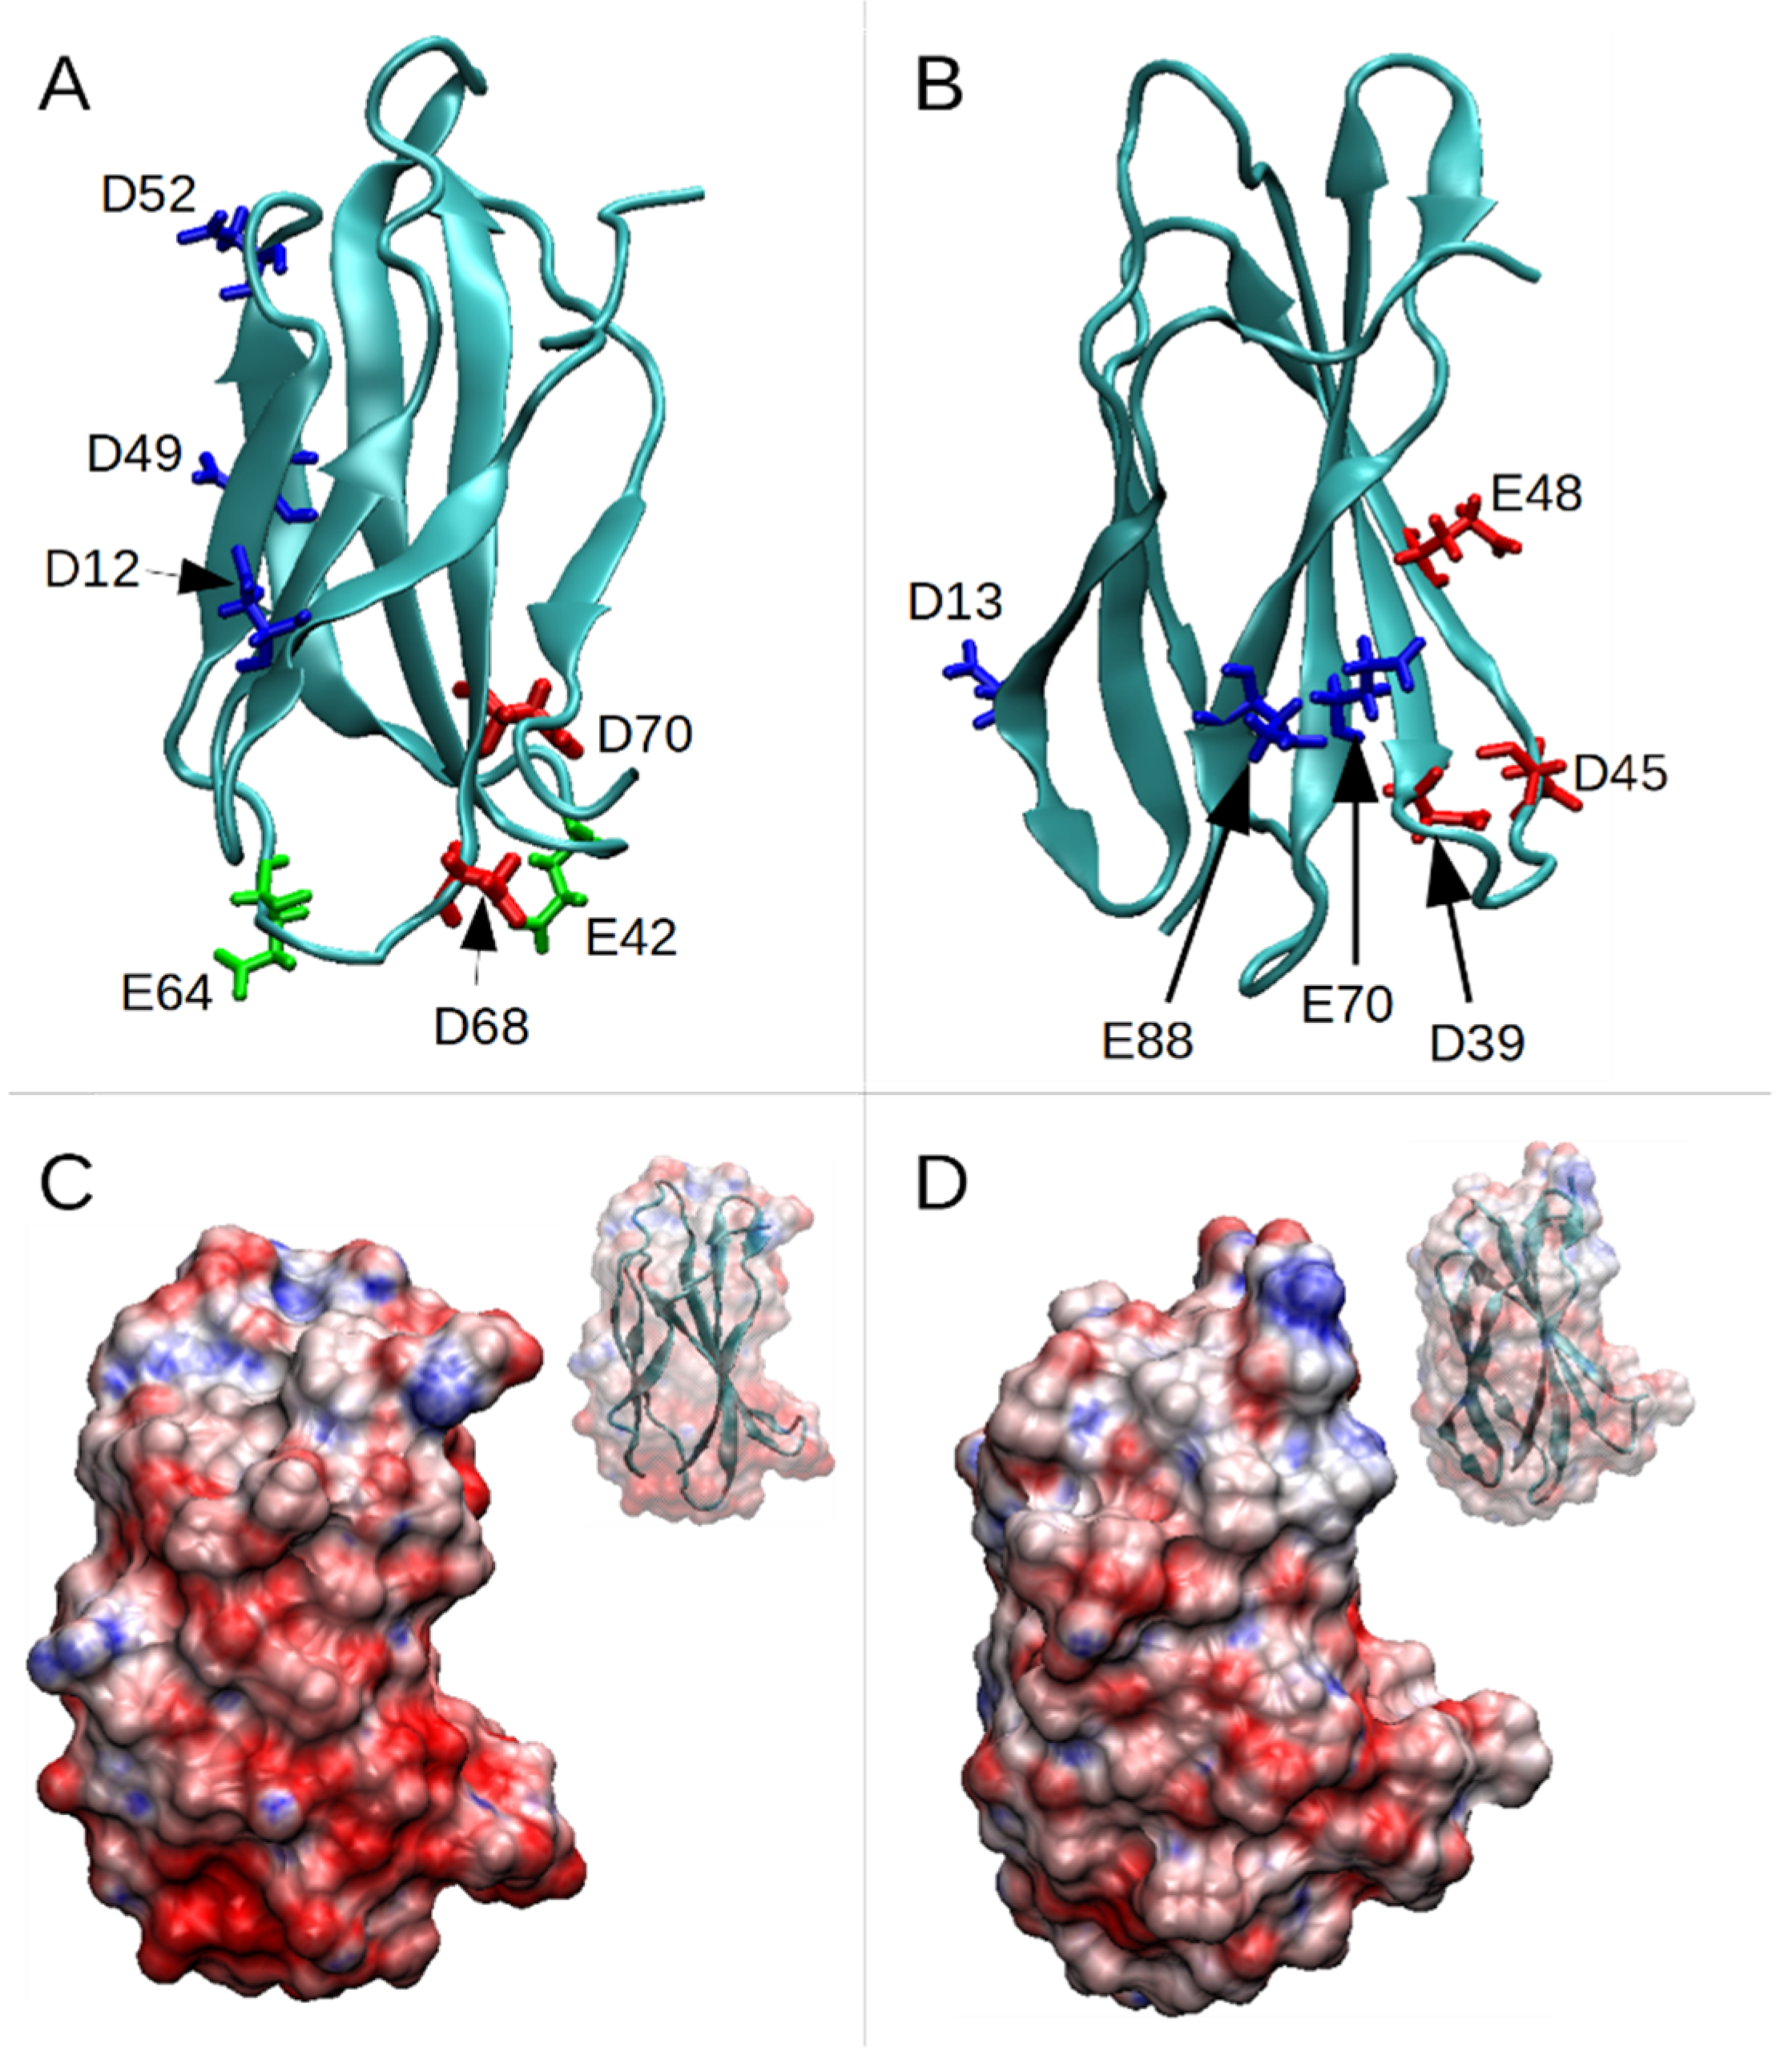
Abstract
:1. Introduction
2. Materials and Methods
2.1. Materials
2.2. Computational Modeling and Molecular Dynamics Simulations
2.3. Recombinant Protein Expression and Purification
2.4. PL1 Phage Binding Assay
2.5. Binding of PL1 Nanoworms to Recombinant Proteins
2.6. Assessment of Binding Affinity by Fluorescence Anisotropy in a Multiwell Microplate
2.7. Cellular Binding and Uptake of PL1-AgNPs in Glioma Cells
2.8. Statistical Analysis
3. Results
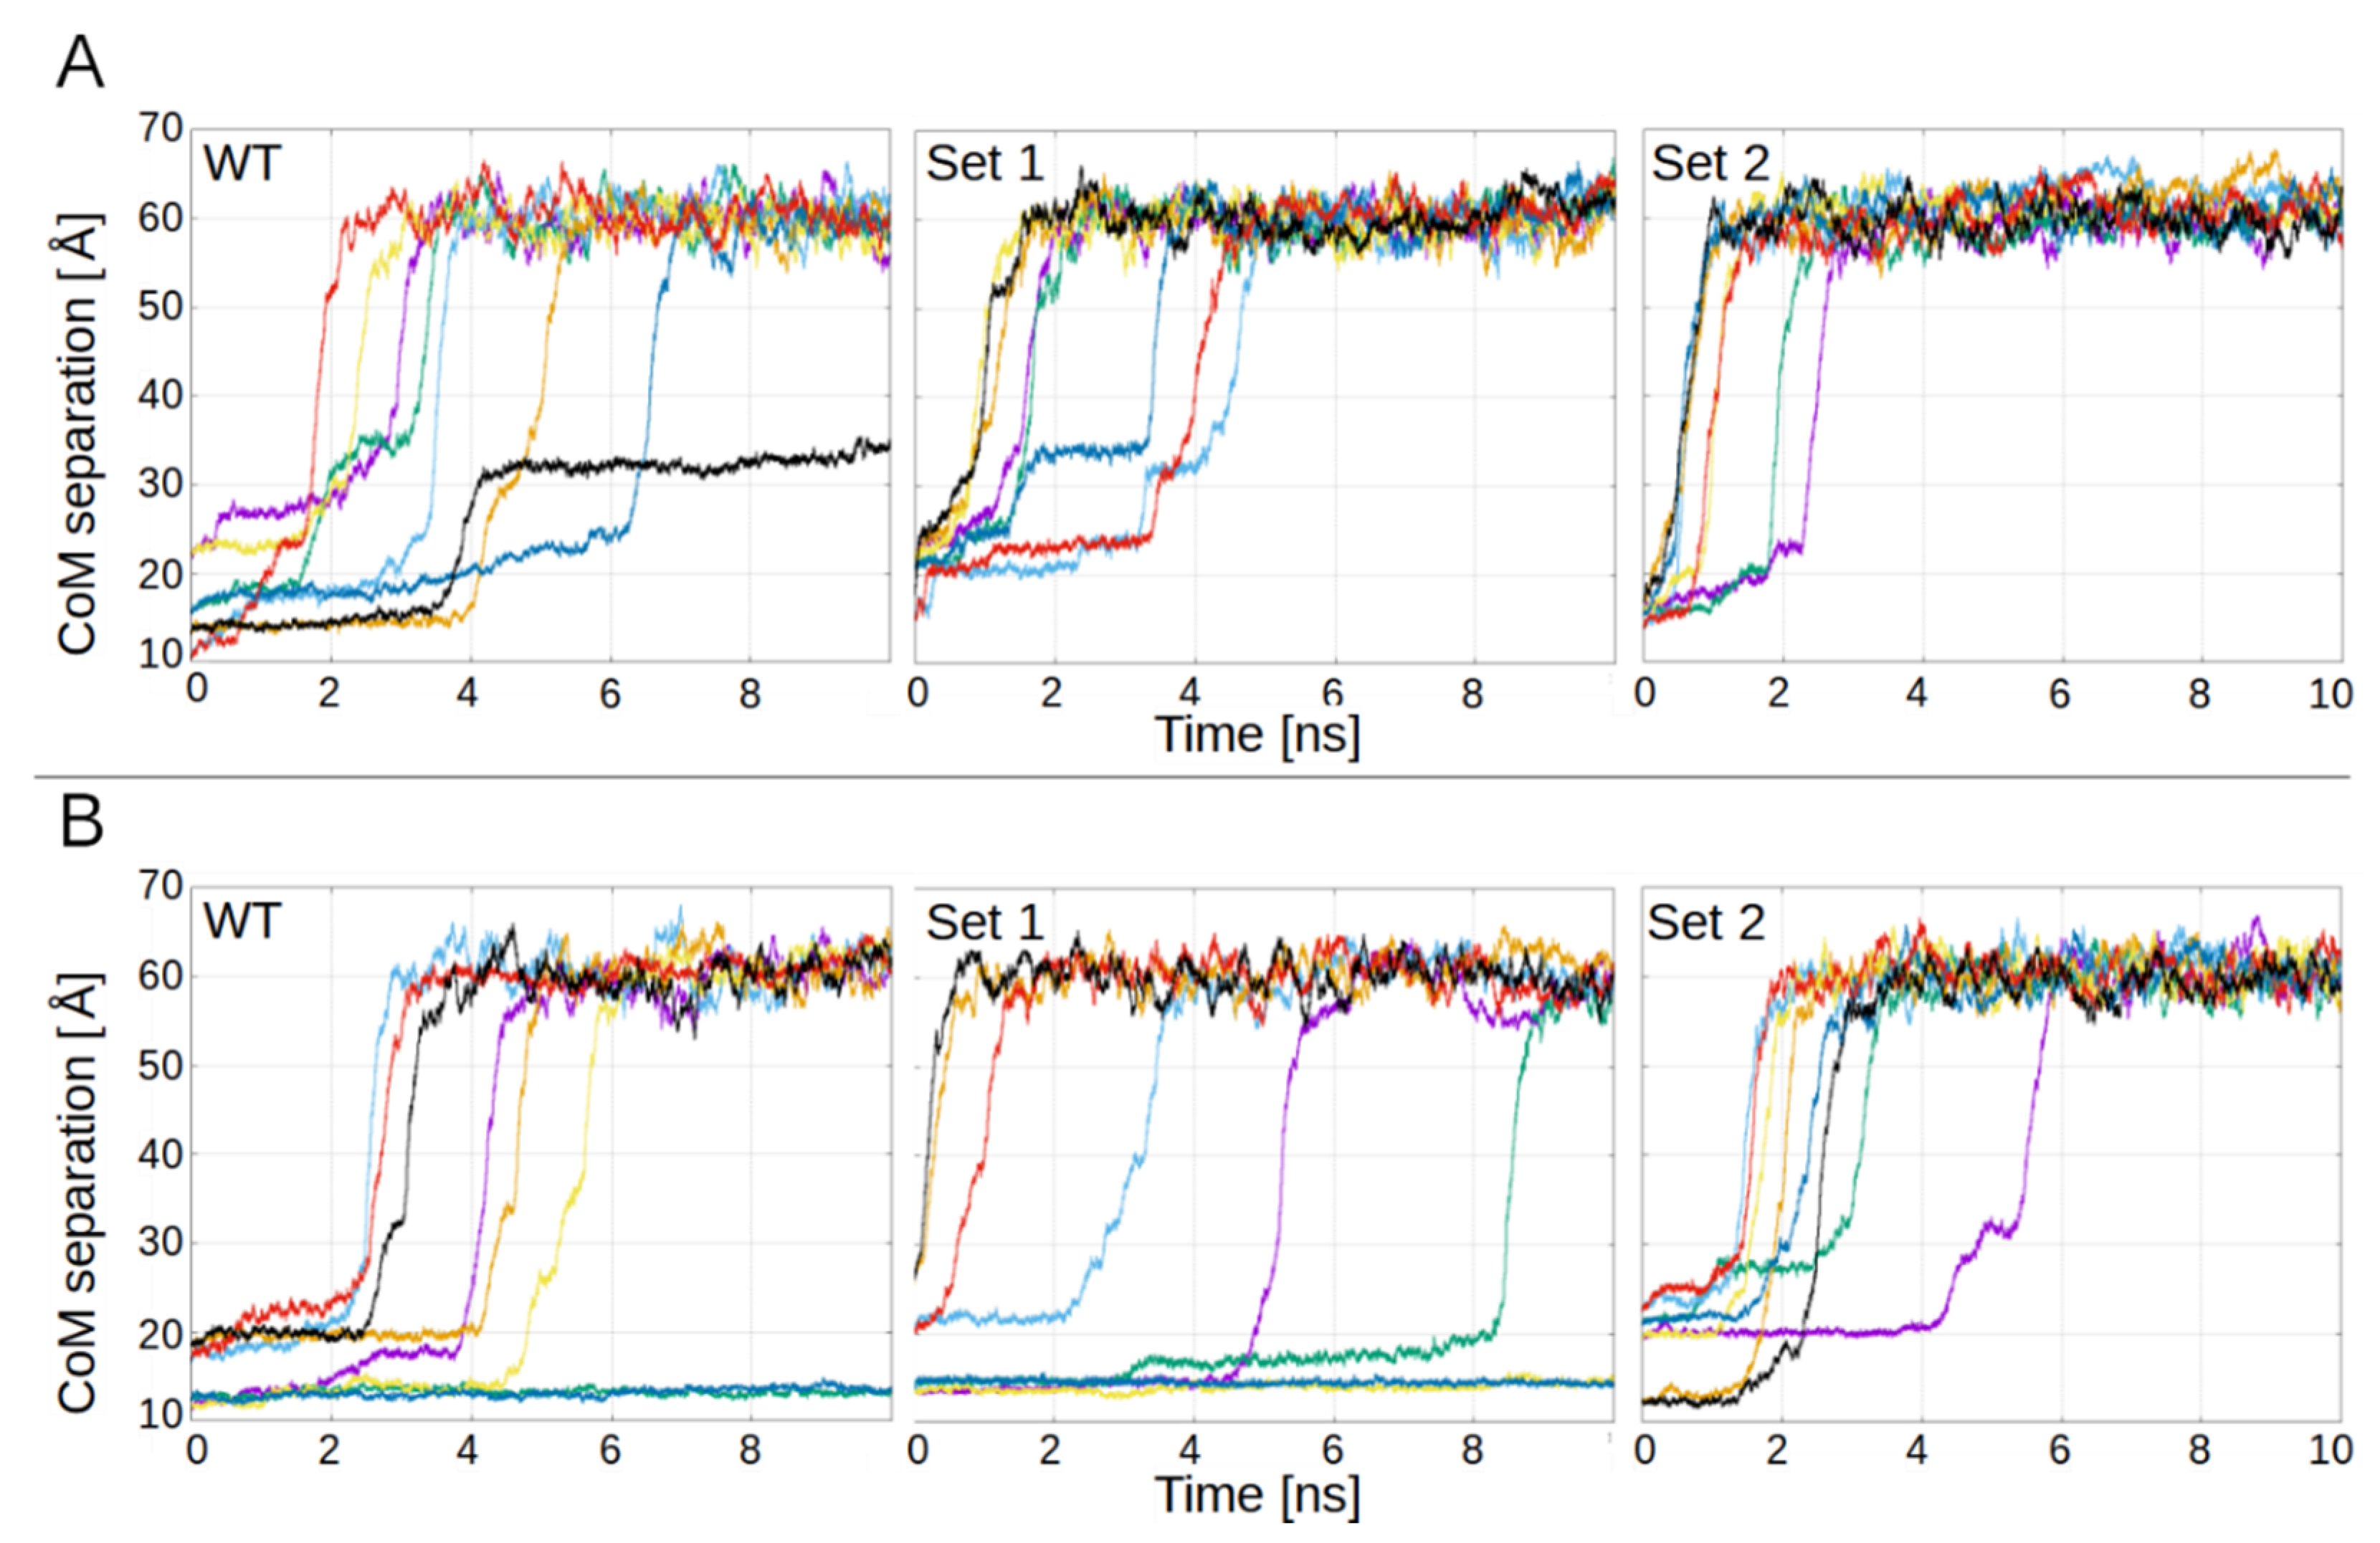
3.1. PL1 Binding to FN-EDB and TNC-C Is Electrostatically Driven
- Wild-type (WT);
- Mutations D12N, D49N, D52N (Set 1);
- Mutations D12N, D49N, D52N and D68N, D70N (Set 2);
- Wild-type (WT);
- Mutations D13N, E70Q, E88Q (Set 1);
- Mutations D13N, E70Q, E88Q and D39N, D45N (Set 2).
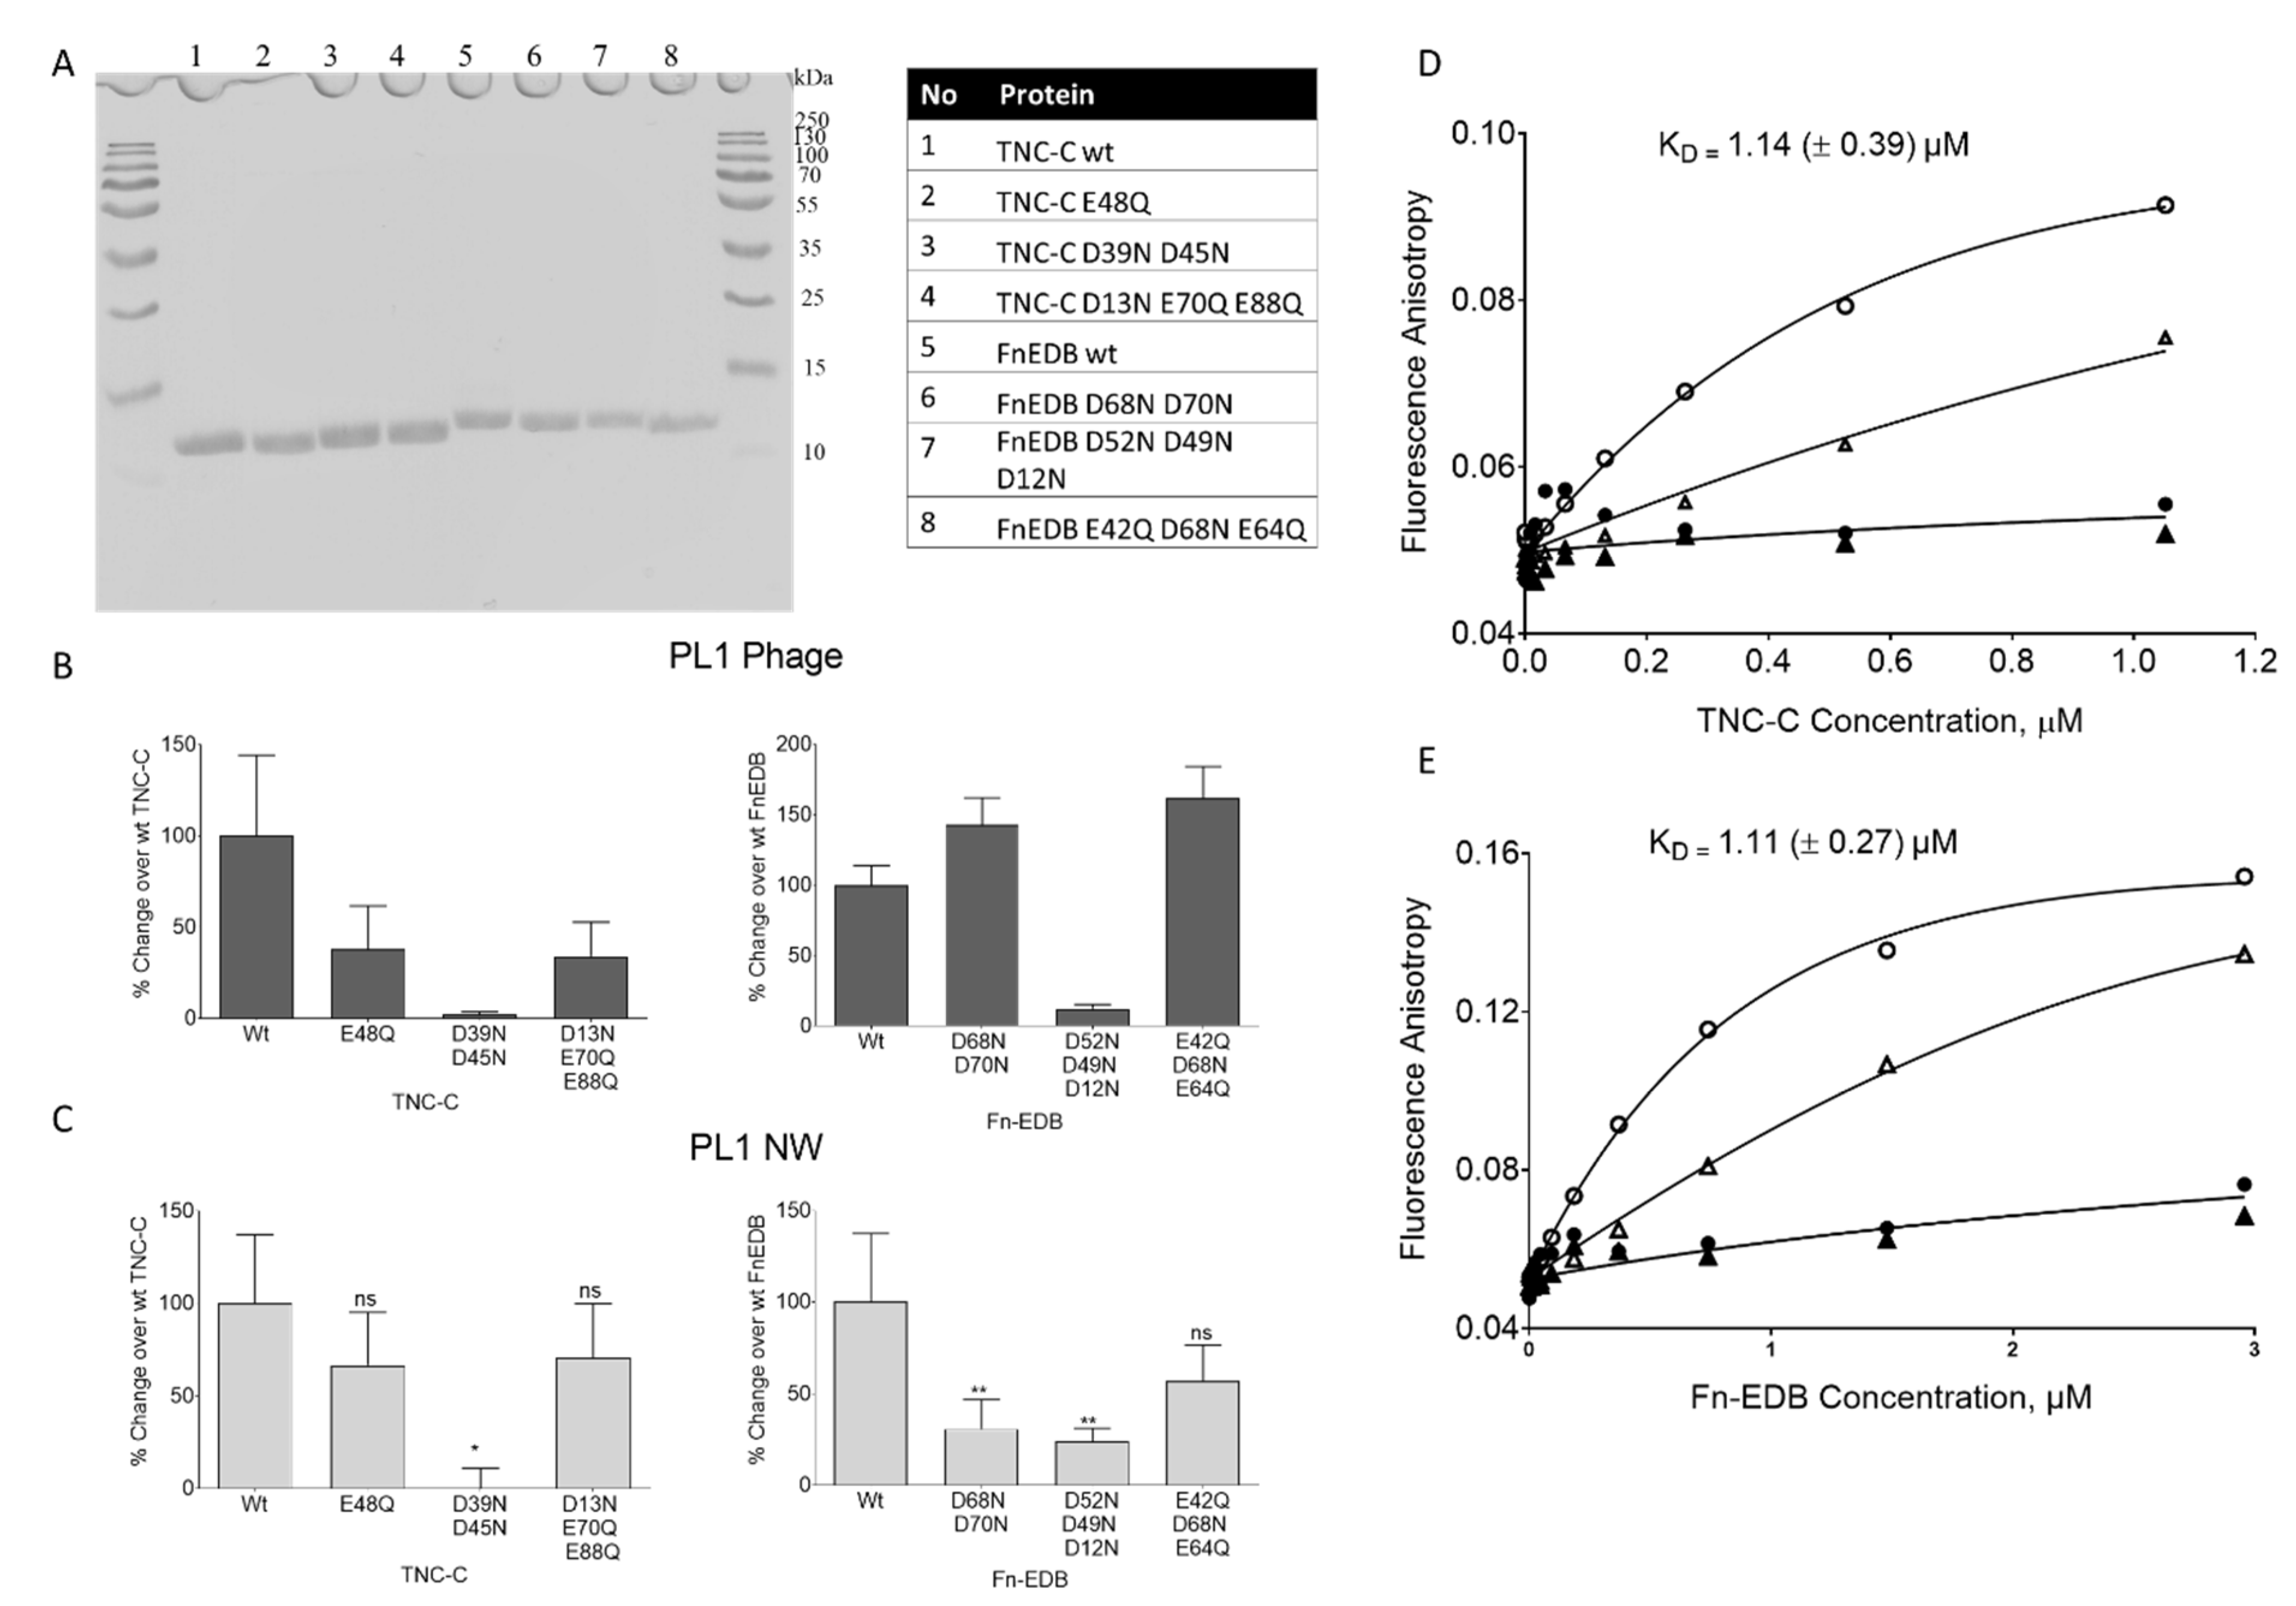
3.2. Under Cell-Free Conditions, PL1 Peptide Engages Acidic Binding Sites on TNC-C and FN-EDB
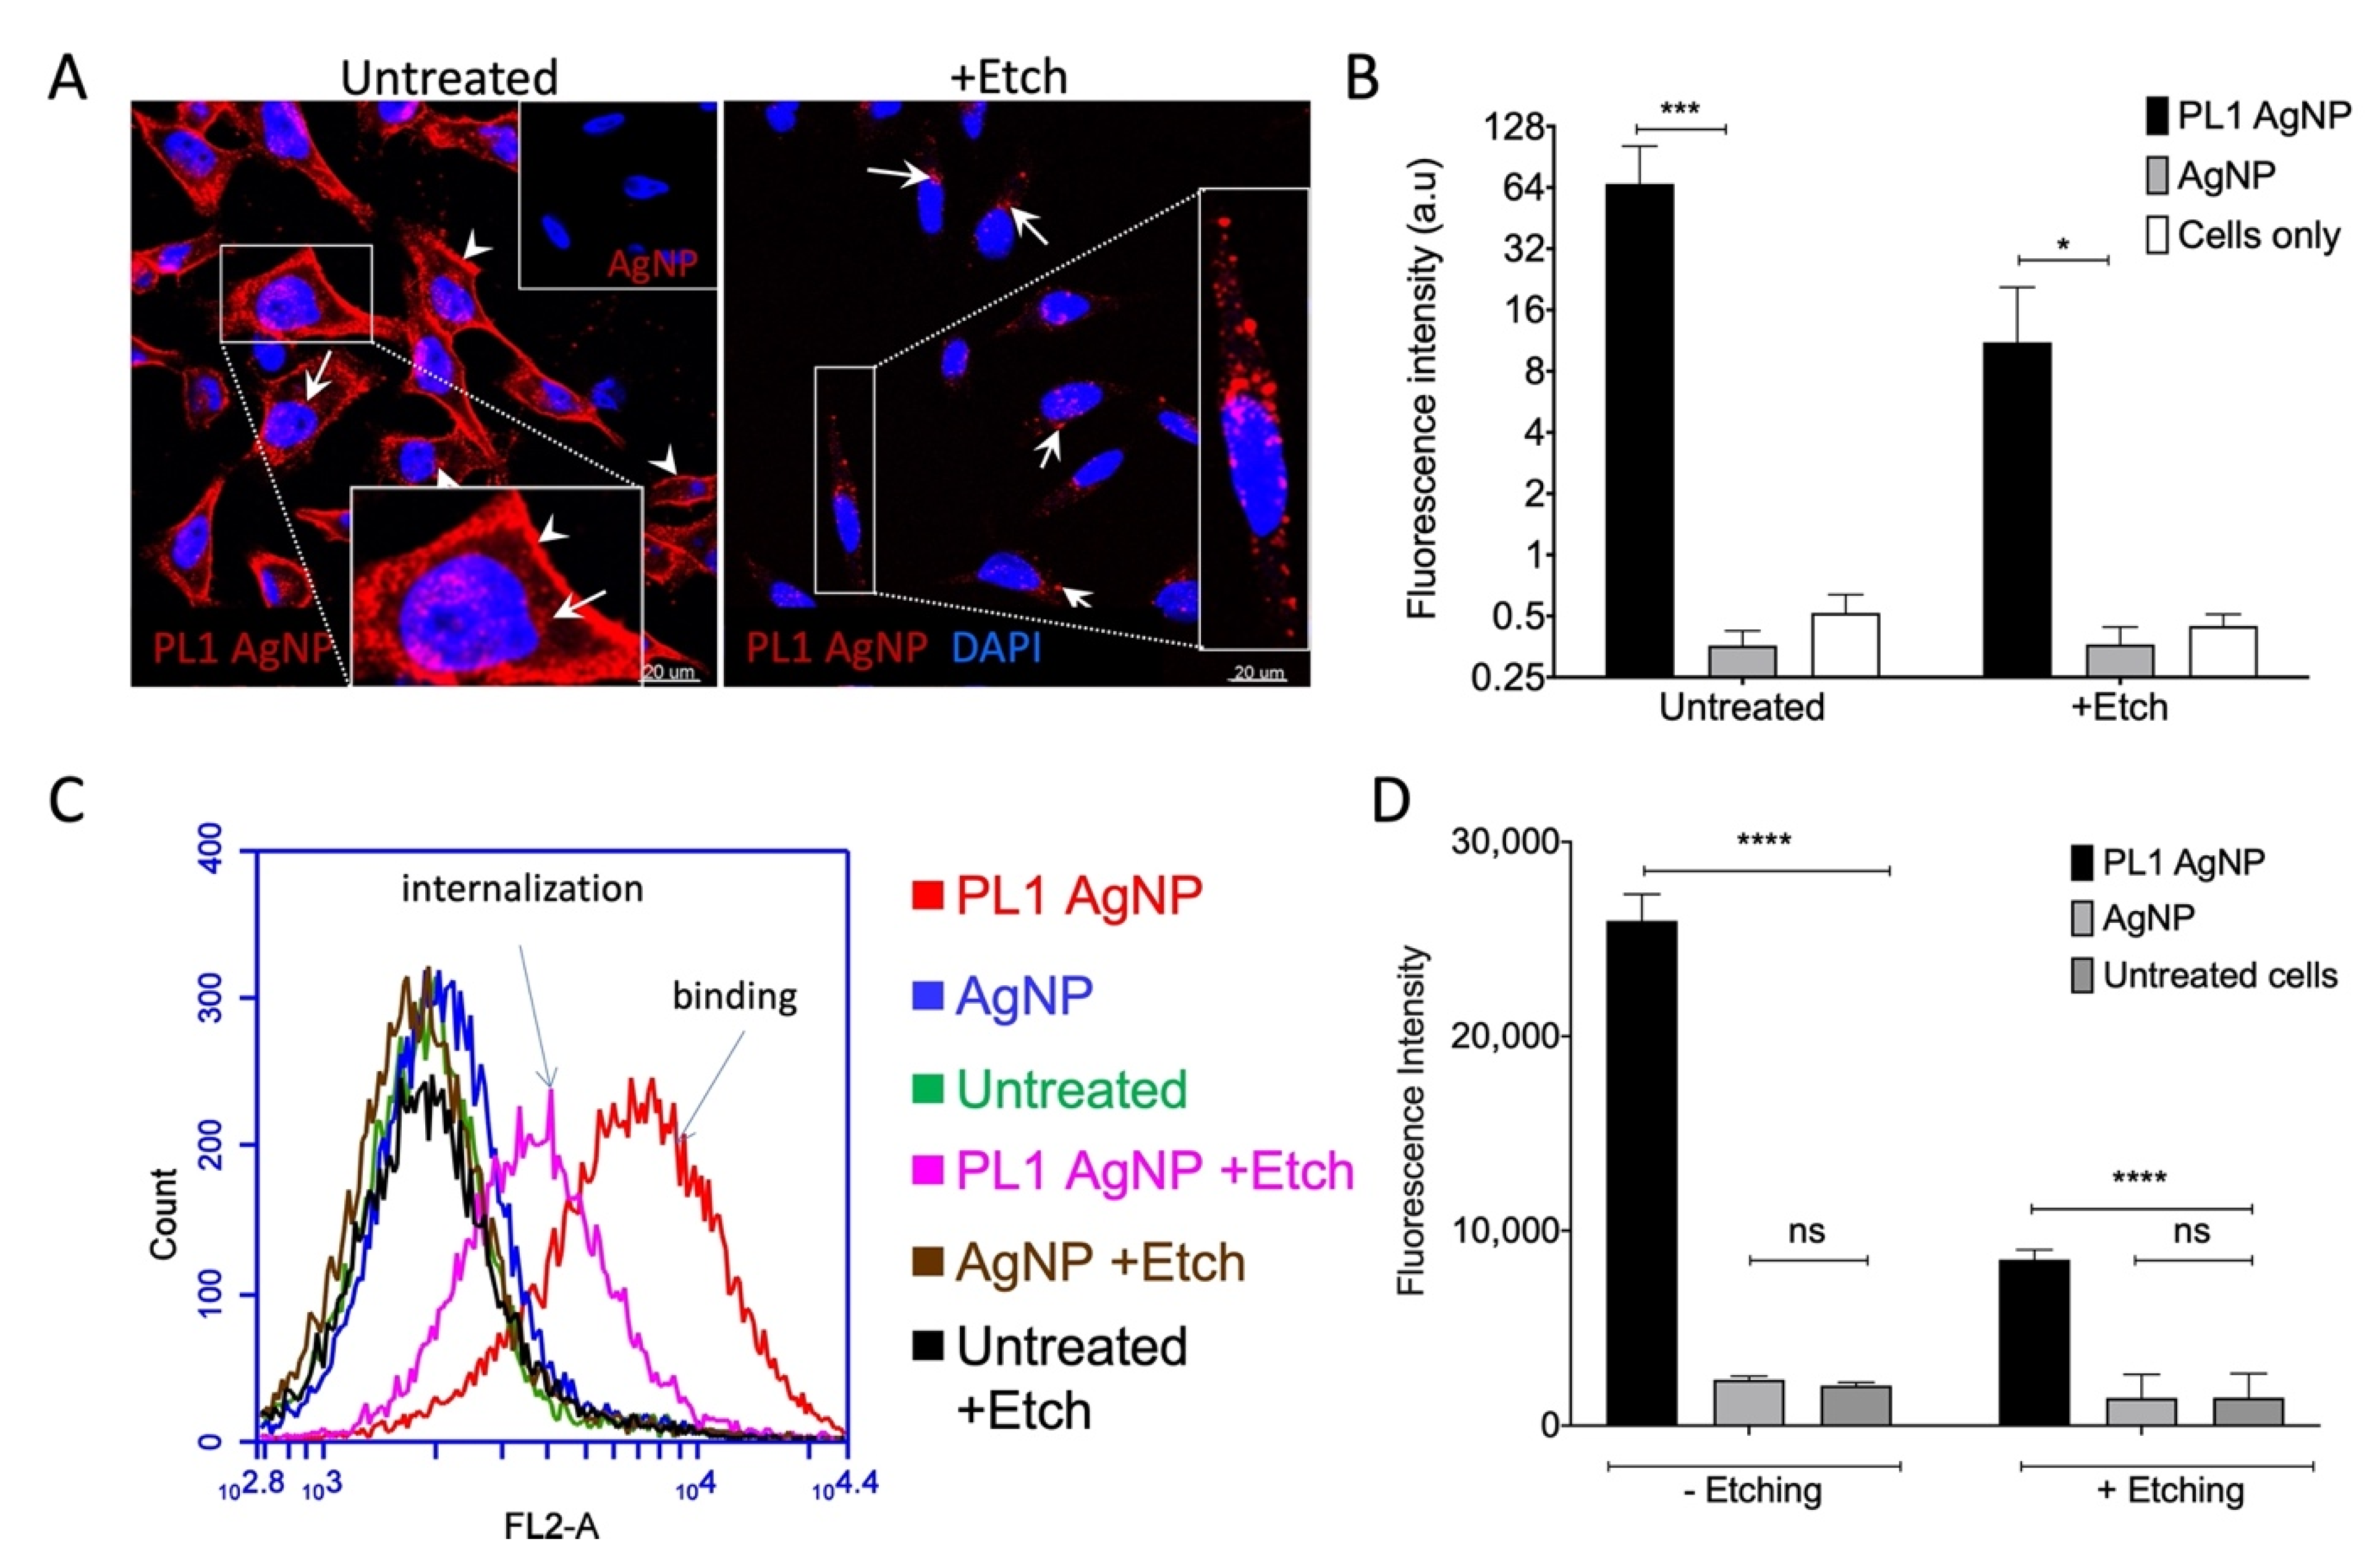
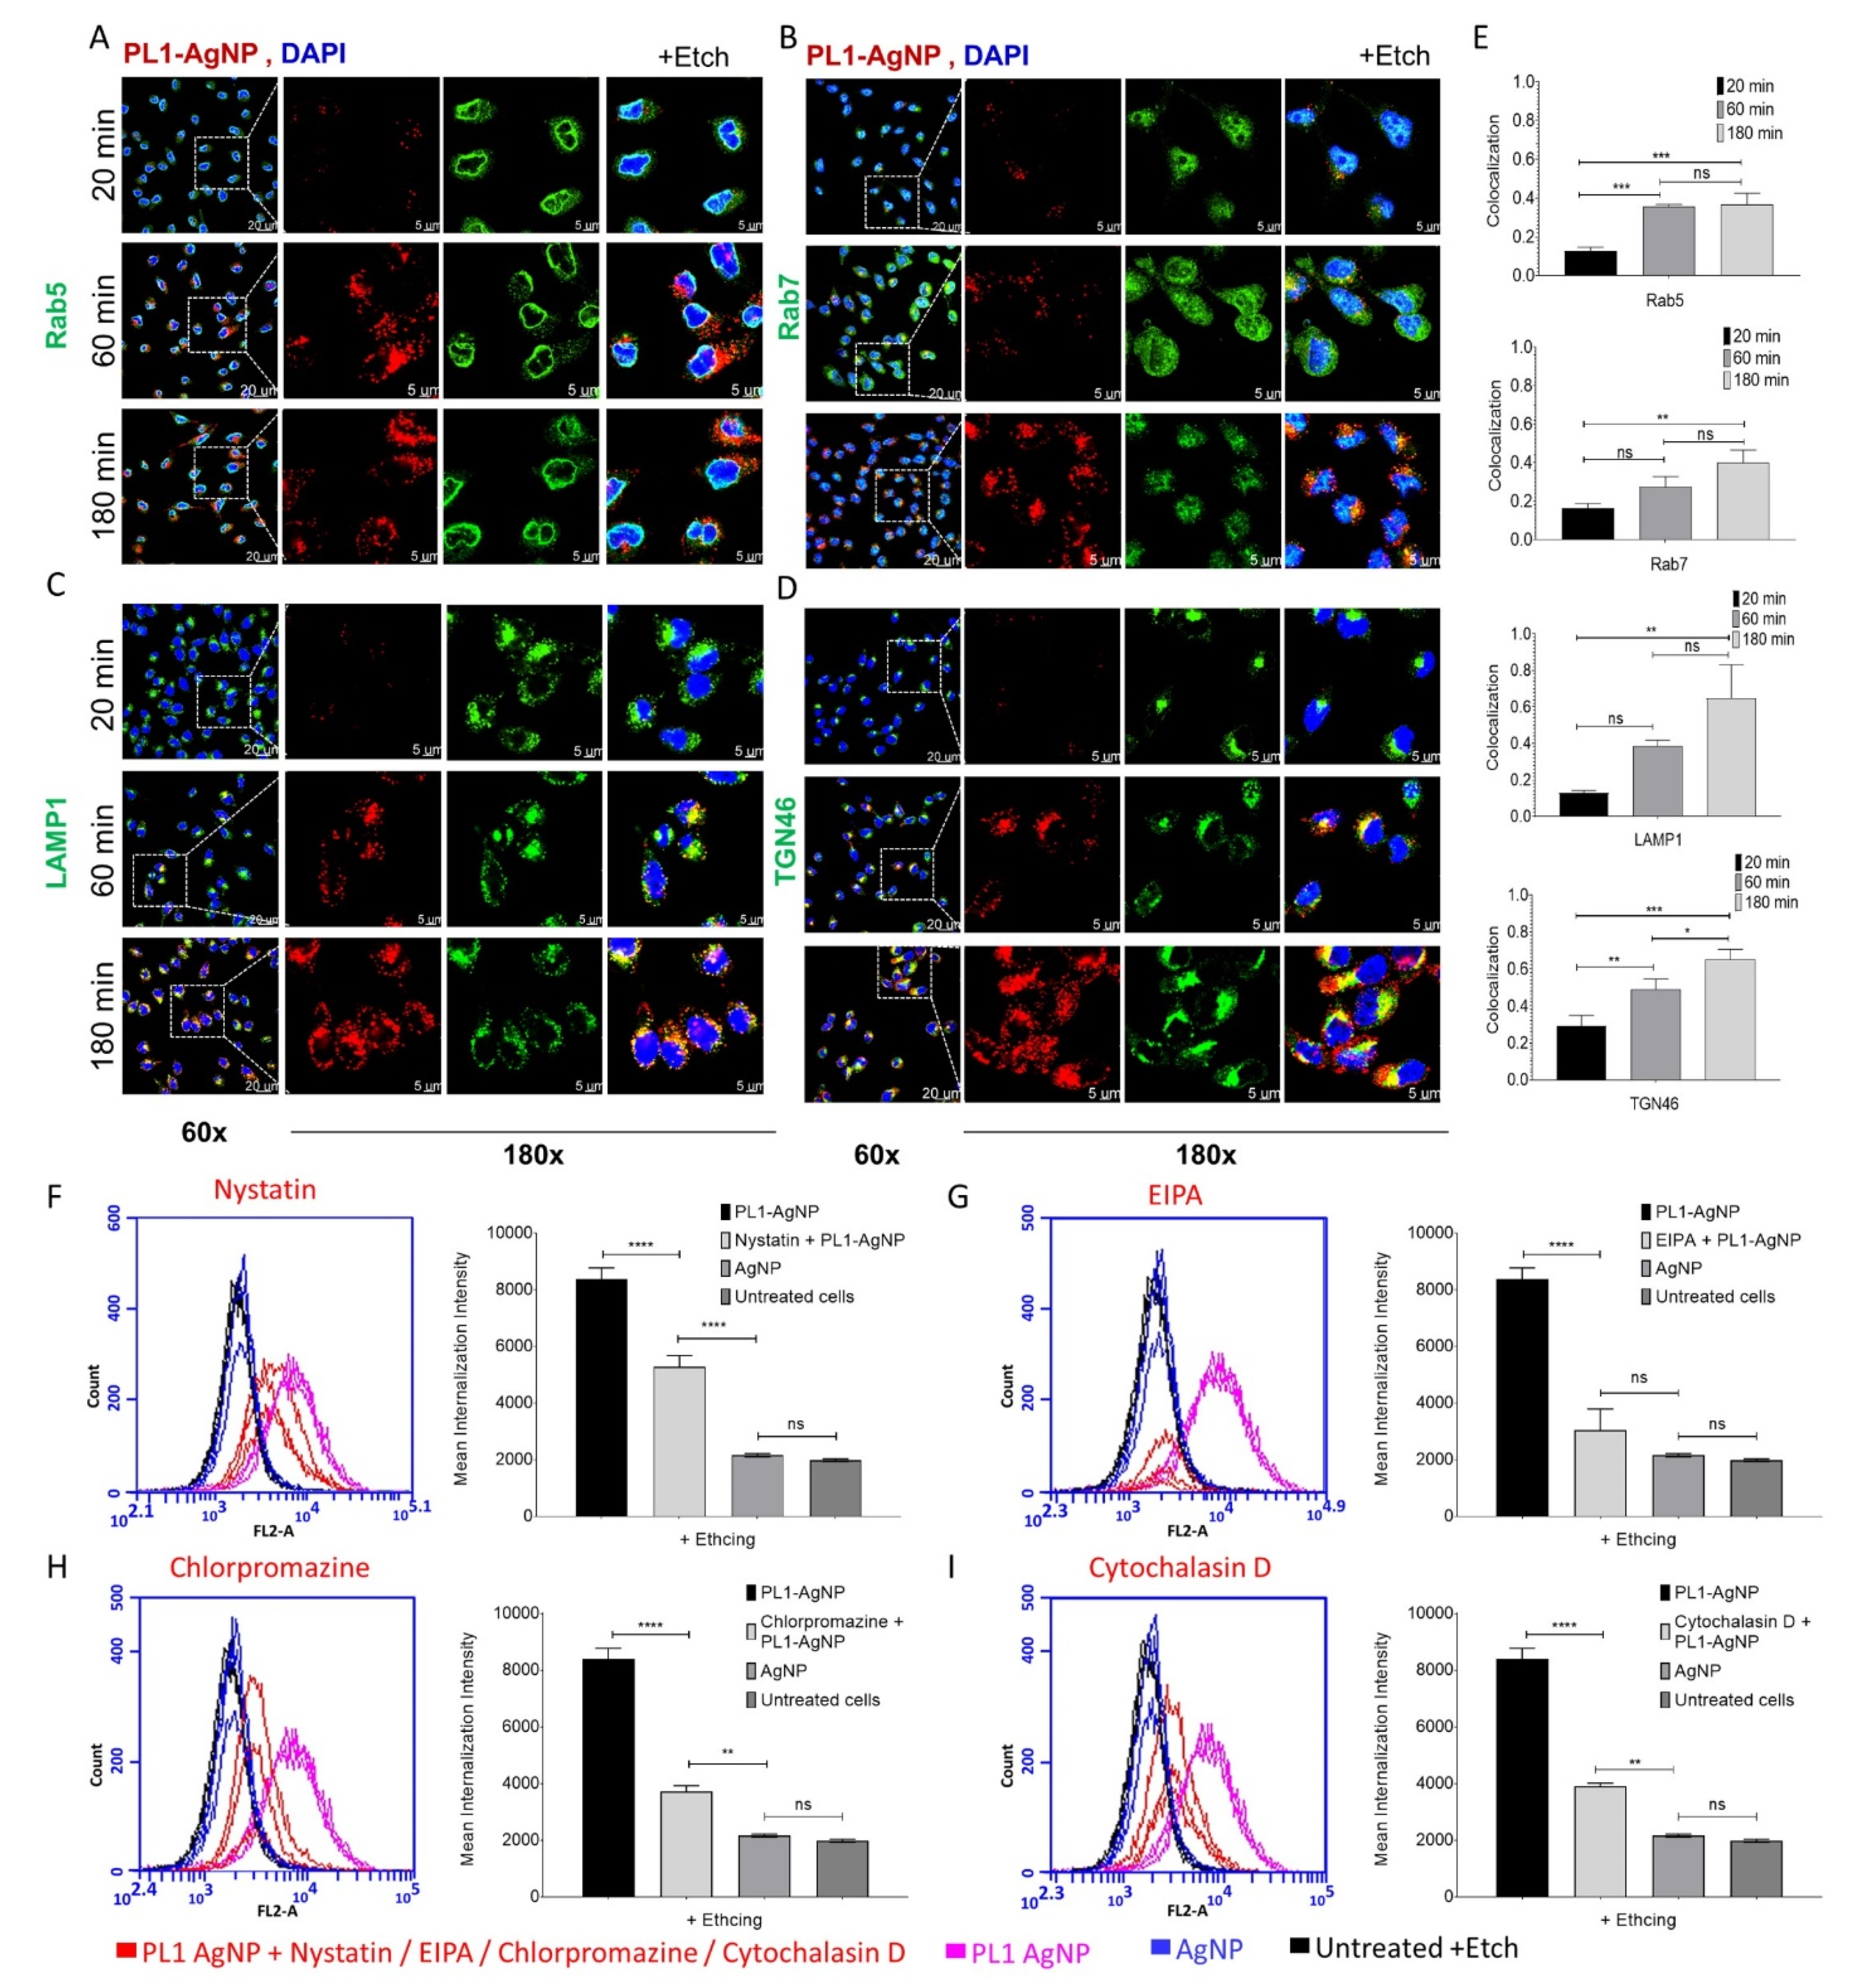
3.3. PL1 Peptide NPs Are Internalized in Glioma Cells via the Macropinocytosis Pathway
4. Discussion
Supplementary Materials
Author Contributions
Funding
Institutional Review Board Statement
Informed Consent Statement
Data Availability Statement
Acknowledgments
Conflicts of Interest
References
- Järveläinen, H.; Sainio, A.; Koulu, M.; Wight, T.N.; Penttinen, R. Extracellular matrix molecules: Potential targets in pharmacotherapy. Pharmacol. Rev. 2009, 61, 198–223. [Google Scholar] [CrossRef] [Green Version]
- Lingasamy, P.; Laarmann, A.-H.; Teesalu, T. Tumor Penetrating Peptide-Functionalized Tenascin-C Antibody for Glioblastoma Targeting. Curr. Cancer Drug Targets 2021, 21, 70–79. [Google Scholar] [CrossRef]
- Lingasamy, P.; Tobi, A.; Haugas, M.; Hunt, H.; Paiste, P.; Asser, T.; Rätsep, T.; Kotamraju, V.R.; Bjerkvig, R.; Teesalu, T. Bi-specific tenascin-C and fibronectin targeted peptide for solid tumor delivery. Biomaterials 2019, 219, 119373. [Google Scholar] [CrossRef] [PubMed]
- Silacci, M.; Brack, S.S.; Späth, N.; Buck, A.; Hillinger, S.; Arni, S.; Weder, W.; Zardi, L.; Neri, D. Human monoclonal antibodies to domain C of tenascin-C selectively target solid tumors in vivo. Protein Eng. Des. Sel. 2006, 19, 471–478. [Google Scholar] [CrossRef] [PubMed] [Green Version]
- Quail, D.F.; Joyce, J.A. Microenvironmental regulation of tumor progression and metastasis. Nat. Med. 2013, 19, 1423–1437. [Google Scholar] [CrossRef] [PubMed]
- Rak, J.; Yu, J.L.; Kerbel, R.S.; Coomber, B.L. What do oncogenic mutations have to do with angiogenesis/vascular dependence of tumors? Cancer Res. 2002, 62, 1931–1934. [Google Scholar] [PubMed]
- Schliemann, C.; Neri, D. Antibody-based targeting of the tumor vasculature. Biochim. Biophys. Acta Rev. Cancer. 2007, 1776, 175–192. [Google Scholar] [CrossRef]
- Lingasamy, P.; Tobi, A.; Kurm, K.; Kopanchuk, S.; Sudakov, A.; Salumäe, M.; Rätsep, T.; Asser, T.; Bjerkvig, R.; Teesalu, T. Tumor-penetrating peptide for systemic targeting of Tenascin-C. Sci. Rep. 2020, 10, 5809. [Google Scholar] [CrossRef] [Green Version]
- Rupp, T.; Langlois, B.; Radwanska, A.; Koczorowska, M.M.; Zhen, S.; Hussenet, T.; Lefebvre, O.; Murdamoothoo, D.; Arnold, A.; Klein, A.; et al. Tenascin-C orchestrates glioblastoma angiogenesis by modulation of pro and anti angiogenic signalling. Cell Rep. 2016, 17, 2607–2619. [Google Scholar] [CrossRef] [PubMed] [Green Version]
- Kaspar, M.; Zardi, L.; Neri, D. Fibronectin as target for tumor therapy. Int. J. Cancer 2006, 118, 1331–1339. [Google Scholar] [CrossRef]
- Han, Z.; Lu, Z.R. Targeting Fibronectin for Cancer Imaging and Therapy. J. Mater. Chem. B 2017, 5, 639–654. [Google Scholar] [CrossRef] [Green Version]
- Carnemolla, B.; Castellani, P.; Ponassi, M.; Borsi, L.; Urbini, S.; Nicolo, G.; Dorcaratto, A.; Viale, G.; Winter, G.; Neri, D.; et al. Identification of a glioblastoma-associated tenascin-C isoform by a high affinity recombinant antibody. Am. J. Pathol. 1999, 154, 1345–1352. [Google Scholar] [CrossRef] [Green Version]
- Nilsson, F.; Kosmehl, H.; Zardi, L.; Neri, D. Targeted delivery of tissue factor to the ED-B domain of fibronectin, a marker of angiogenesis, mediates the infarction of solid tumors in mice. Cancer Res. 2001, 61, 711–716. [Google Scholar]
- Kim, S.; Kim, D.; Jung, H.H.; Lee, I.H.; Kim, J.I.; Suh, J.Y.; Jon, S. Bio-inspired design and potential biomedical applications of a novel class of high-affinity peptides. Angew. Chem. Int. Ed. 2012, 51, 1890–1894. [Google Scholar] [CrossRef]
- Han, Z.; Zhou, Z.; Shi, X.; Wang, J.; Wu, X.; Sun, D.; Chen, Y.; Zhu, H.; Magi-Galluzzi, C.; Lu, Z.R. EDB fibronectin specific peptide for prostate cancer targeting. Bioconjug. Chem. 2015, 26, 830–838. [Google Scholar] [CrossRef] [PubMed]
- Daniels, D.A.; Chen, H.; Hicke, B.J.; Swiderek, K.M.; Gold, L. A tenascin-C aptamer identified by tumor cell SELEX: Systematic evolution of ligands by exponential enrichment. Proc. Natl. Acad. Sci. USA 2003, 100, 15416–15421. [Google Scholar] [CrossRef] [Green Version]
- Kim, M.Y.; Kim, O.R.; Choi, Y.S.; Lee, H.; Park, K.; Lee, C.T.; Kang, K.W.; Jeong, S. Selection and characterization of tenascin C targeting peptide. Mol. Cells. 2012, 33, 71–77. [Google Scholar] [CrossRef] [PubMed]
- Akabani, G.; Reardon, D.A.; Coleman, R.E.; Wong, T.Z.; Metzler, S.D.; Bowsher, J.E.; Barboriak, D.P.; Provenzale, J.M.; Greer, K.L.; DeLong, D.; et al. Dosimetry and radiographic analysis of 131I-labeled anti-tenascin 81C6 murine monoclonal antibody in newly diagnosed patients with malignant gliomas: A phase II study. J. Nucl. Med. 2005, 46, 1042–1051. Available online: http://0-www-ncbi-nlm-nih-gov.brum.beds.ac.uk/pubmed/15937318 (accessed on 17 April 2017).
- Kumra, H.; Reinhardt, D.P. Fibronectin-targeted drug delivery in cancer. Adv. Drug Deliv. Rev. 2016, 97, 101–110. [Google Scholar] [CrossRef] [PubMed]
- Spenlé, C.; Saupe, F.; Midwood, K.; Burckel, H.; Noel, G.; Orend, G. Tenascin-C: Exploitation and collateral damage in cancer management. Cell Adhes. Migr. 2015, 9, 141–153. [Google Scholar] [CrossRef] [Green Version]
- Lingasamy, P. Development of Multitargeted Tumor Penetrating Peptides. Ph.D. Thesis, University of Tartu, Tartu, Estonia, 2021. Available online: http://hdl.handle.net/10062/70738 (accessed on 15 November 2021).
- Säälik, P.; Lingasamy, P.; Toome, K.; Mastandrea, I.; Rousso-Noori, L.; Tobi, A.; Simón-Gracia, L.; Hunt, H.; Paiste, P.; Kotamraju, V.R.; et al. Peptide-guided nanoparticles for glioblastoma targeting. J. Control. Release 2019, 308, 109–118. [Google Scholar] [CrossRef] [PubMed]
- Tobi, A.; Willmore, A.M.A.; Kilk, K.; Sidorenko, V.; Braun, G.B.; Soomets, U.; Sugahara, K.N.; Ruoslahti, E.; Teesalu, T. Silver Nanocarriers Targeted with a CendR Peptide Potentiate the Cytotoxic Activity of an Anticancer Drug. Adv. Ther. 2021, 4, 2000097. [Google Scholar] [CrossRef]
- Fattorusso, R.; Pellecchia, M.; Viti, F.; Neri, P.; Neri, D.; Wüthrich, K. NMR structure of the human oncofoetal fibronectin ED-B domain, a specific marker for angiogenesis. Structure 1999, 7, 381–390. [Google Scholar] [CrossRef] [Green Version]
- Roy, A.; Kucukural, A.; Zhang, Y. I-TASSER: A unified platform for automated protein structure and function prediction. Nat. Protoc. 2010, 5, 725–738. [Google Scholar] [CrossRef] [PubMed] [Green Version]
- Baker, N.A.; Sept, D.; Joseph, S.; Holst, M.J.; McCammon, J.A. Electrostatics of nanosystems: Application to microtubules and the ribosome. Proc. Natl. Acad. Sci. USA 2001, 98, 10037–10041. [Google Scholar] [CrossRef] [PubMed] [Green Version]
- Case, D.A.; Ben-Shalom, I.Y.; Brozell, S.R.; Cerutti, D.S.; Cheatham, T.E.; Darden, T.A.V.W.D.C., III; Duke, R.E.; Ghoreishi, D.; Gilson, M.K.; Gohlke, H.; et al. Amber18, Univ. California, San Fr. 2018, pp. 1–923. Available online: http://ambermd.org/contributors.html (accessed on 15 November 2021).
- Maier, J.A.; Martinez, C.; Kasavajhala, K.; Wickstrom, L.; Hauser, K.E.; Simmerling, C. ff14SB: Improving the Accuracy of Protein Side Chain and Backbone Parameters from ff99SB. J. Chem. Theory Comput. 2015, 11, 3696–3713. [Google Scholar] [CrossRef] [Green Version]
- Darden, T.; Perera, L.; Li, L.; Lee, P. New tricks for modelers from the crystallography toolkit: The particle mesh Ewald algorithm and its use in nucleic acid simulations. Structure 1999, 7, R55–R60. [Google Scholar] [CrossRef] [Green Version]
- Veiksina, S.; Kopanchuk, S.; Mazina, O.; Link, R.; Lille, A.; Rinken, A. Homogeneous fluorescence anisotropy-based assay for characterization of ligand binding dynamics to GPCRs in budded baculoviruses: The case of Cy3B-NDP-α-MSH binding to MC4 receptors. In G Protein-Coupled Receptor Screening Assays; Springer: New York, NY, USA, 2015; pp. 37–50. [Google Scholar] [CrossRef]
- Veiksina, S.; Tahk, M.-J.; Laasfeld, T.; Link, R.; Kopanchuk, S.; Rinken, A. Fluorescence anisotropy-based assay for characterization of ligand binding dynamics to GPCRs. The case of Cy3B-labelled ligands binding to MC4 receptors in budded baculoviruses. In G Protein-Coupled Receptor Screening Assays; Springer: New York, NY, USA, 2021; pp. 119–136. [Google Scholar] [CrossRef]
- Veiksina, S.; Kopanchuk, S.; Rinken, A. Budded baculoviruses as a tool for a homogeneous fluorescence anisotropy-based assay of ligand binding to G protein-coupled receptors: The case of melanocortin 4 receptors. Biochim. Biophys. Acta Biomembr. 2014, 1838, 372–381. [Google Scholar] [CrossRef] [Green Version]
- De Vries, S.J.; Rey, J.; Schindler, C.E.M.; Zacharias, M.; Tuffery, P. The pepATTRACT web server for blind, large-scale peptide-protein docking. Nucleic Acids Res. 2017, 45, W361–W364. [Google Scholar] [CrossRef]
- Asciutto, E.K.; Pantano, S.; General, I.J. Physical interactions driving the activation/inhibition of calcium/calmodulin dependent protein kinase II. J. Mol. Graph. Model. 2021, 105, 107875. [Google Scholar] [CrossRef] [PubMed]
- Teesalu, T.; Lingasamy, P. Bi-Specific Extracellular Matrix Binding Peptides and Methods of Use Thereof. PCT Patent No. WO2020161602A1, 2020. Available online: https://patentscope.wipo.int/search/en/detail.jsf?docId=WO2020161602 (accessed on 15 November 2021).
- Rinken, A.; Lavogina, D.; Kopanchuk, S. Assays with Detection of Fluorescence Anisotropy: Challenges and Possibilities for Characterizing Ligand Binding to GPCRs. Trends Pharmacol. Sci. 2018, 39, 187–199. [Google Scholar] [CrossRef] [PubMed]
- Dankovich, T.M.; Kaushik, R.; Petersen, G.C.; Giro, P.E.; Hadi, H.A.; Bao, G.; Beuermann, S.; Cooper, B.H.; Dityatev, A.; Rizzoli, S.O. Extracellular matrix remodeling through endocytosis and resurfacing of Tenascin-R. BioRxiv 2020. [Google Scholar] [CrossRef]
- Carreras-Badosa, G.; Maslovskaja, J.; Periyasamy, K.; Urgard, E.; Padari, K.; Vaher, H.; Tserel, L.; Gestin, M.; Kisand, K.; Arukuusk, P.; et al. NickFect type of cell-penetrating peptides present enhanced efficiency for microRNA-146a delivery into dendritic cells and during skin inflammation. Biomaterials 2020, 262, 120316. [Google Scholar] [CrossRef]
- Evans, B.C.; Fletcher, R.B.; Kilchrist, K.V.; Dailing, E.A.; Mukalel, A.J.; Colazo, J.M.; Oliver, M.; Cheung-Flynn, J.; Brophy, C.M.; Tierney, J.W.; et al. An anionic, endosome-escaping polymer to potentiate intracellular delivery of cationic peptides, biomacromolecules, and nanoparticles. Nat. Commun. 2019, 10, 1–19. [Google Scholar] [CrossRef]
- Teesalu, T.; Sugahara, K.N.; Kotamraju, V.R.; Ruoslahti, E. C-end rule peptides mediate neuropilin-1-dependent cell, vascular, and tissue penetration. Proc. Natl. Acad. Sci. USA 2009, 106, 16157–16162. [Google Scholar] [CrossRef] [Green Version]
- Paasonen, L.; Sharma, S.; Braun, G.B.; Kotamraju, V.R.; Chung, T.D.Y.; She, Z.G.; Sugahara, K.N.; Yliperttula, M.; Wu, B.; Pellecchia, M.; et al. New p32/gC1qR Ligands for Targeted Tumor Drug Delivery. ChemBioChem 2016, 17, 570–575. [Google Scholar] [CrossRef]
- Agemy, L.; Sugahara, K.N.; Kotamraju, V.R.; Gujraty, K.; Girard, O.M.; Kono, Y.; Mattrey, R.F.; Park, J.H.; Sailor, M.J.; Jimenez, A.I.; et al. Nanoparticle-induced vascular blockade in human prostate cancer. Blood 2010, 116, 2847–2856. [Google Scholar] [CrossRef] [Green Version]
- Corso, A.D.; Cazzamalli, S.; Gébleux, R.; Mattarella, M.; Neri, D. Protease-Cleavable Linkers Modulate the Anticancer Activity of Noninternalizing Antibody-Drug Conjugates. Bioconjug. Chem. 2017, 28, 1826–1833. [Google Scholar] [CrossRef]
- Corso, A.D.; Gébleux, R.; Murer, P.; Soltermann, A.; Neri, D. A non-internalizing antibody-drug conjugate based on an anthracycline payload displays potent therapeutic activity in vivo. J. Control. Release 2017, 264, 211–218. [Google Scholar] [CrossRef]
- Gu, Z.; Noss, E.H.; Hsu, V.W.; Brenner, M.B. Integrins traffic rapidly via circular dorsal ruffles and macropinocytosis during stimulated cell migration. J. Cell Biol. 2011, 193, 61–70. [Google Scholar] [CrossRef] [PubMed]
- Shi, F.; Sottile, J. MT1-MMP regulates the turnover and endocytosis of extracellular matrix fibronectin. J. Cell Sci. 2011, 124, 4039–4050. [Google Scholar] [CrossRef] [PubMed] [Green Version]


Publisher’s Note: MDPI stays neutral with regard to jurisdictional claims in published maps and institutional affiliations. |
© 2021 by the authors. Licensee MDPI, Basel, Switzerland. This article is an open access article distributed under the terms and conditions of the Creative Commons Attribution (CC BY) license (https://creativecommons.org/licenses/by/4.0/).
Share and Cite
Lingasamy, P.; Põšnograjeva, K.; Kopanchuk, S.; Tobi, A.; Rinken, A.; General, I.J.; Asciutto, E.K.; Teesalu, T. PL1 Peptide Engages Acidic Surfaces on Tumor-Associated Fibronectin and Tenascin Isoforms to Trigger Cellular Uptake. Pharmaceutics 2021, 13, 1998. https://0-doi-org.brum.beds.ac.uk/10.3390/pharmaceutics13121998
Lingasamy P, Põšnograjeva K, Kopanchuk S, Tobi A, Rinken A, General IJ, Asciutto EK, Teesalu T. PL1 Peptide Engages Acidic Surfaces on Tumor-Associated Fibronectin and Tenascin Isoforms to Trigger Cellular Uptake. Pharmaceutics. 2021; 13(12):1998. https://0-doi-org.brum.beds.ac.uk/10.3390/pharmaceutics13121998
Chicago/Turabian StyleLingasamy, Prakash, Kristina Põšnograjeva, Sergei Kopanchuk, Allan Tobi, Ago Rinken, Ignacio J. General, Eliana K. Asciutto, and Tambet Teesalu. 2021. "PL1 Peptide Engages Acidic Surfaces on Tumor-Associated Fibronectin and Tenascin Isoforms to Trigger Cellular Uptake" Pharmaceutics 13, no. 12: 1998. https://0-doi-org.brum.beds.ac.uk/10.3390/pharmaceutics13121998