
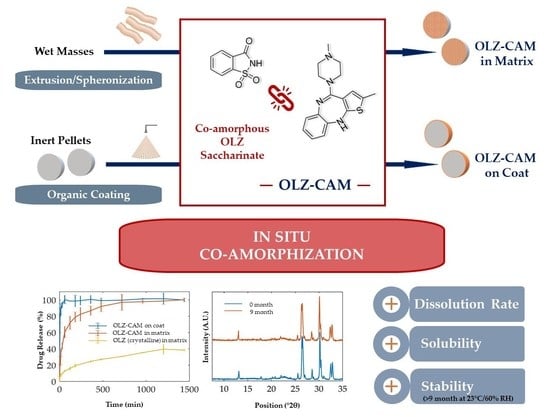
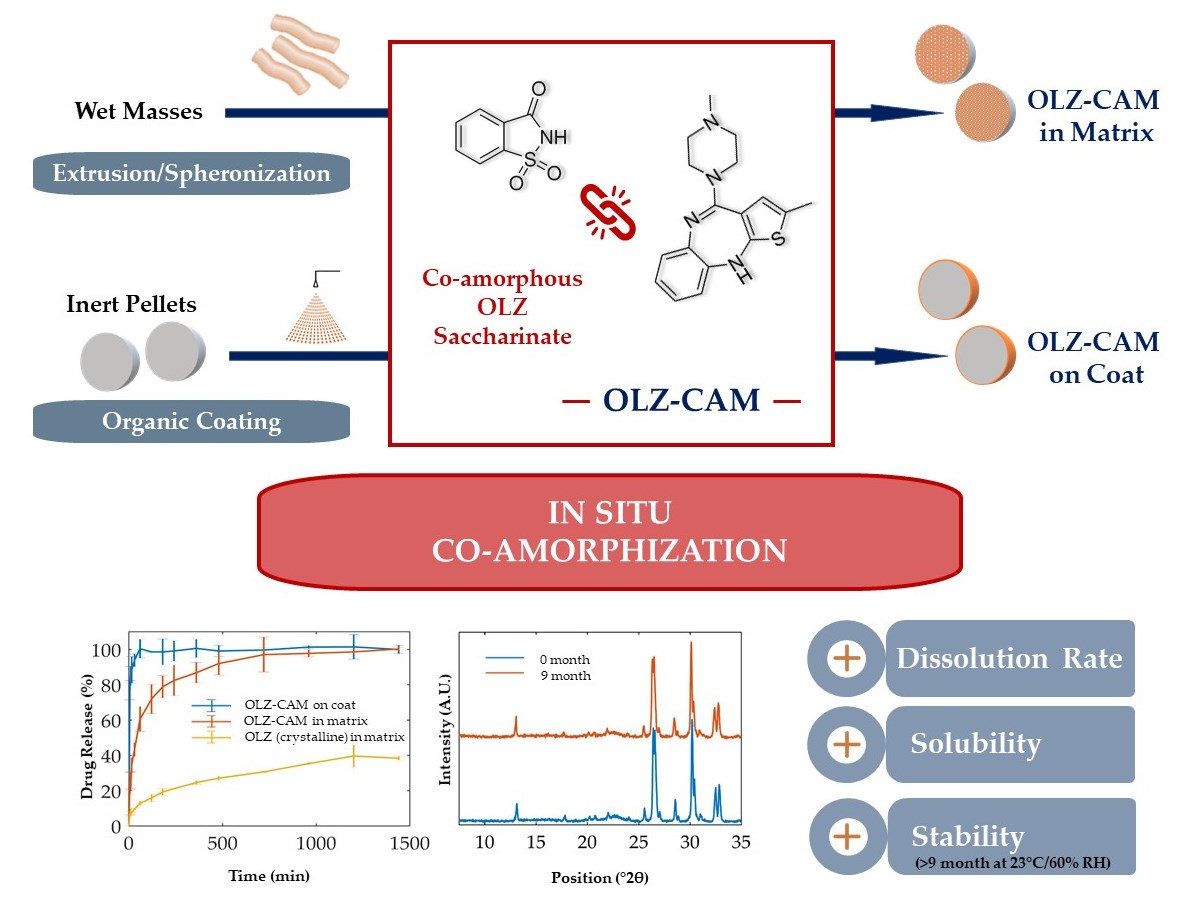
In Situ Co-Amorphization of Olanzapine in the Matrix and on the Coat of Pellets
 ,
,  , ,
, ,  and
and
Abstract
:
1. Introduction
2. Materials and Methods
2.1. Materials
2.2. Methods
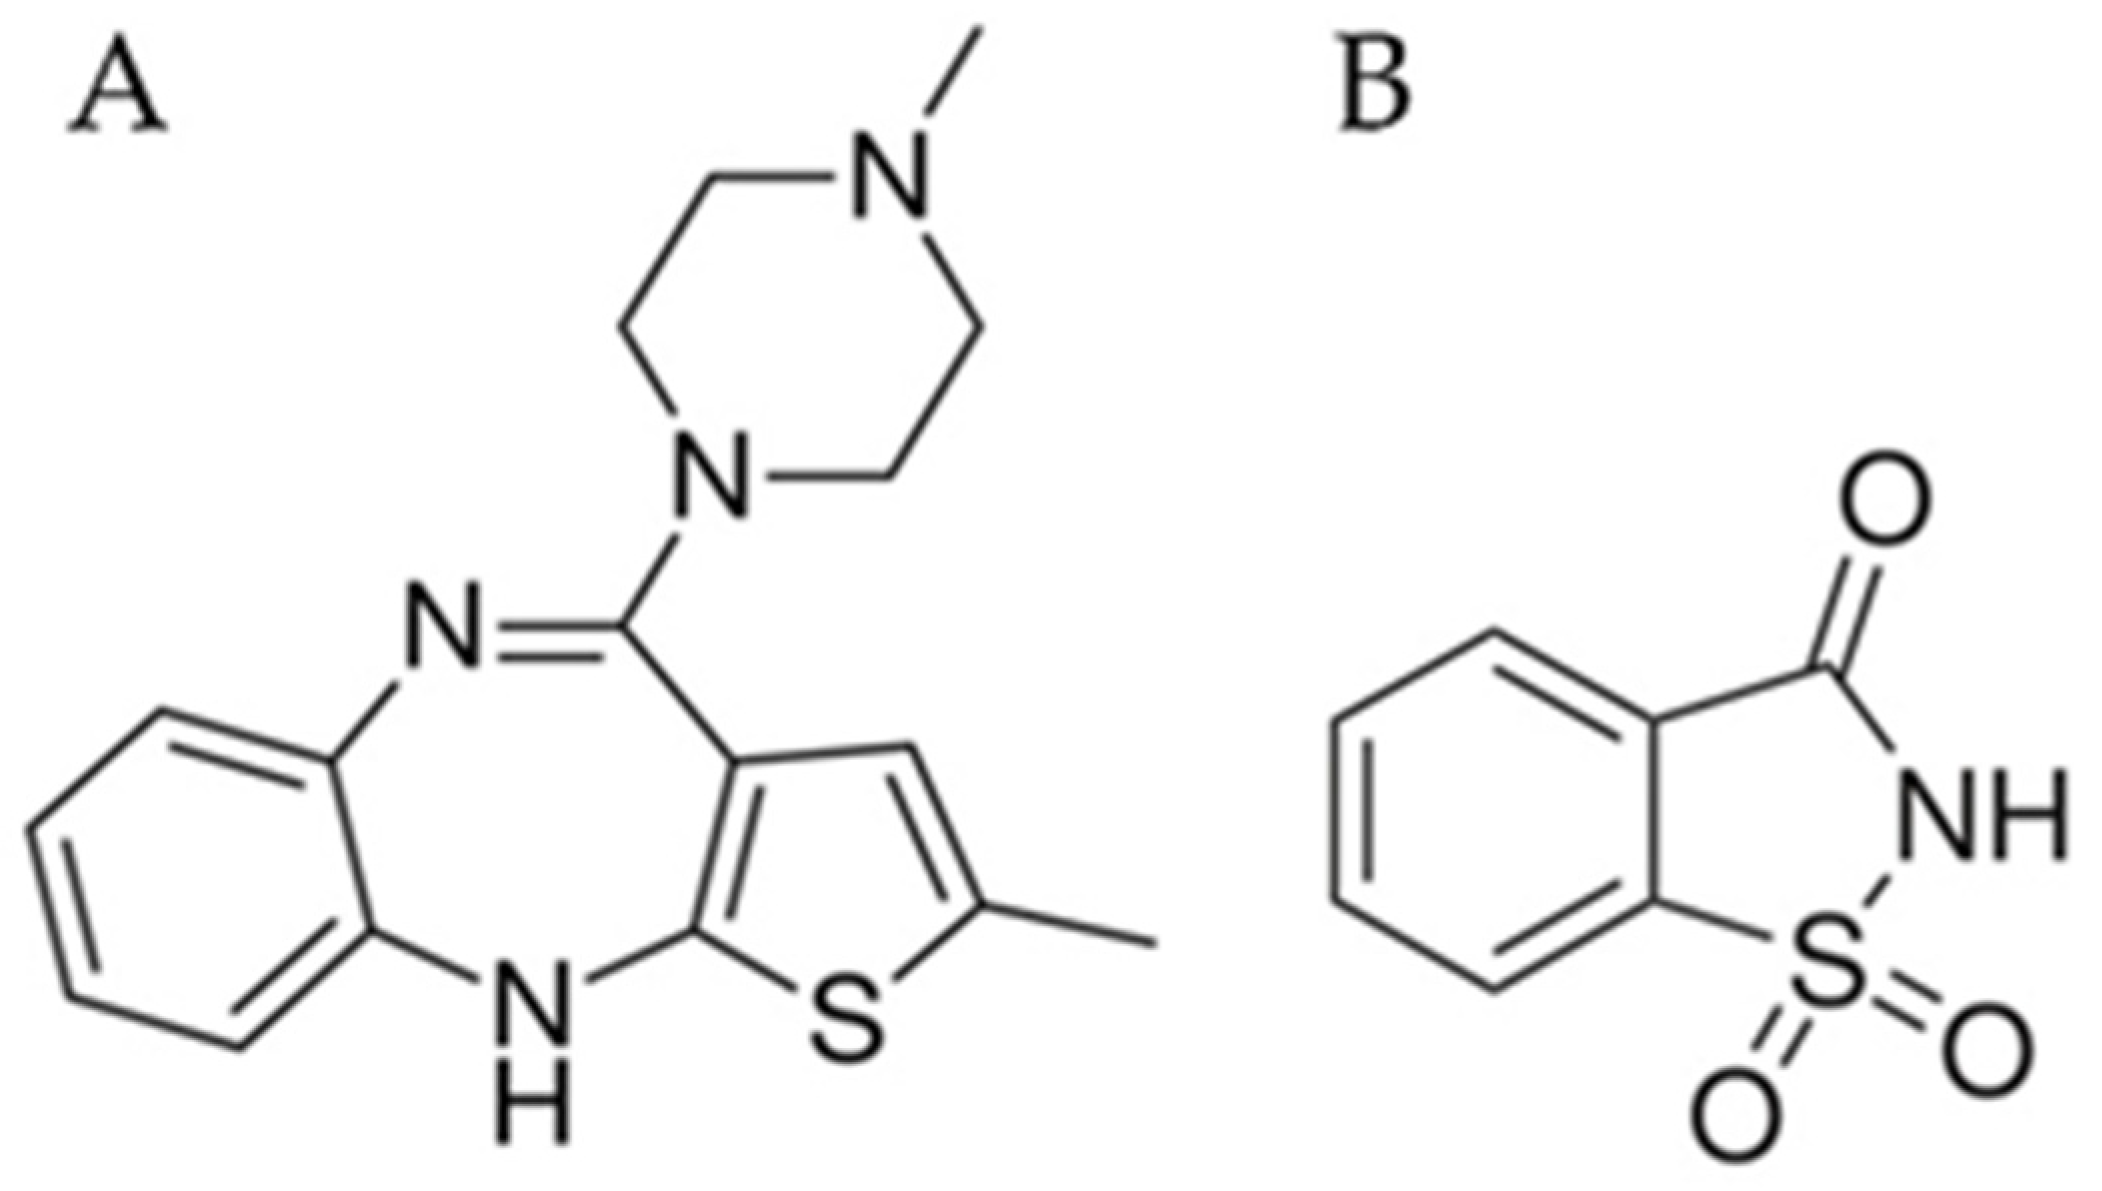
2.2.1. Preparation of Powdered Co-Amorphous Olanzapine: Saccharin
2.2.2. Characterization of Powdered Co-Amorphous Olanzapine: Saccharin
2.2.3. Production of Pellets via Extrusion-Spheronization
2.2.4. Coating of Pellets
2.2.5. Characterization of Pellets
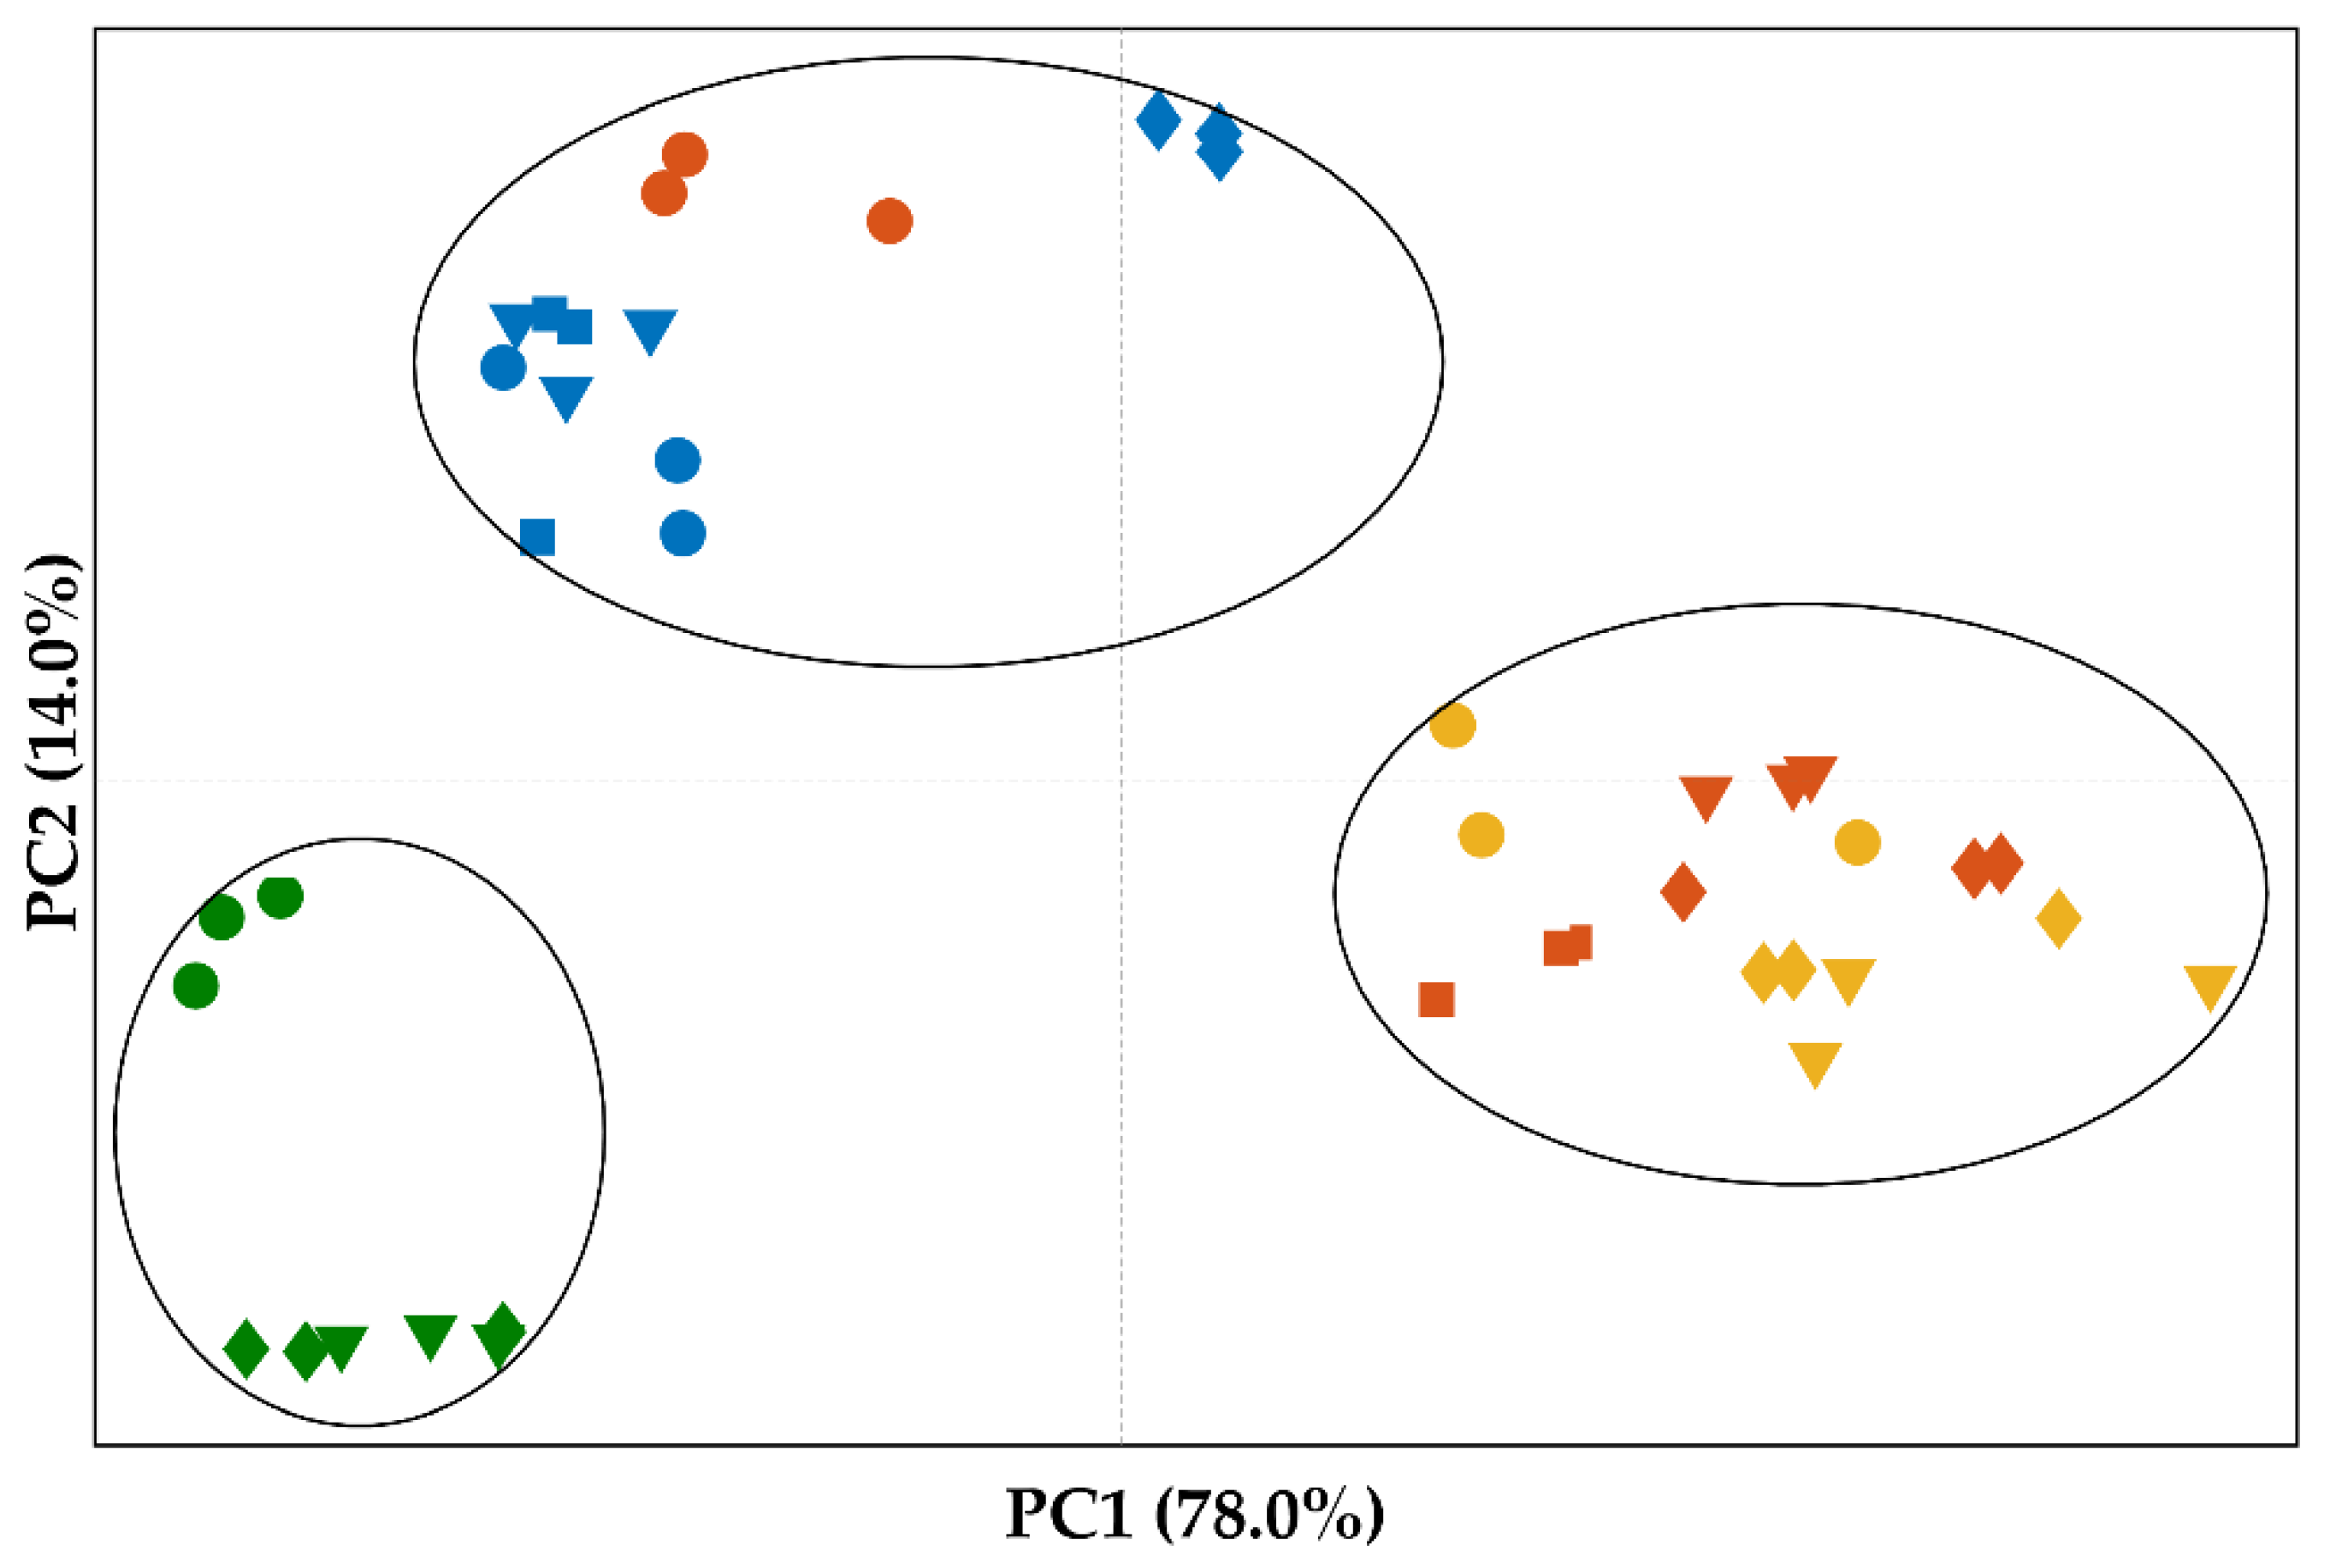
2.2.6. Principal Component Analysis
2.2.7. Statistical Analysis
2.2.8. Stability Studies
3. Results
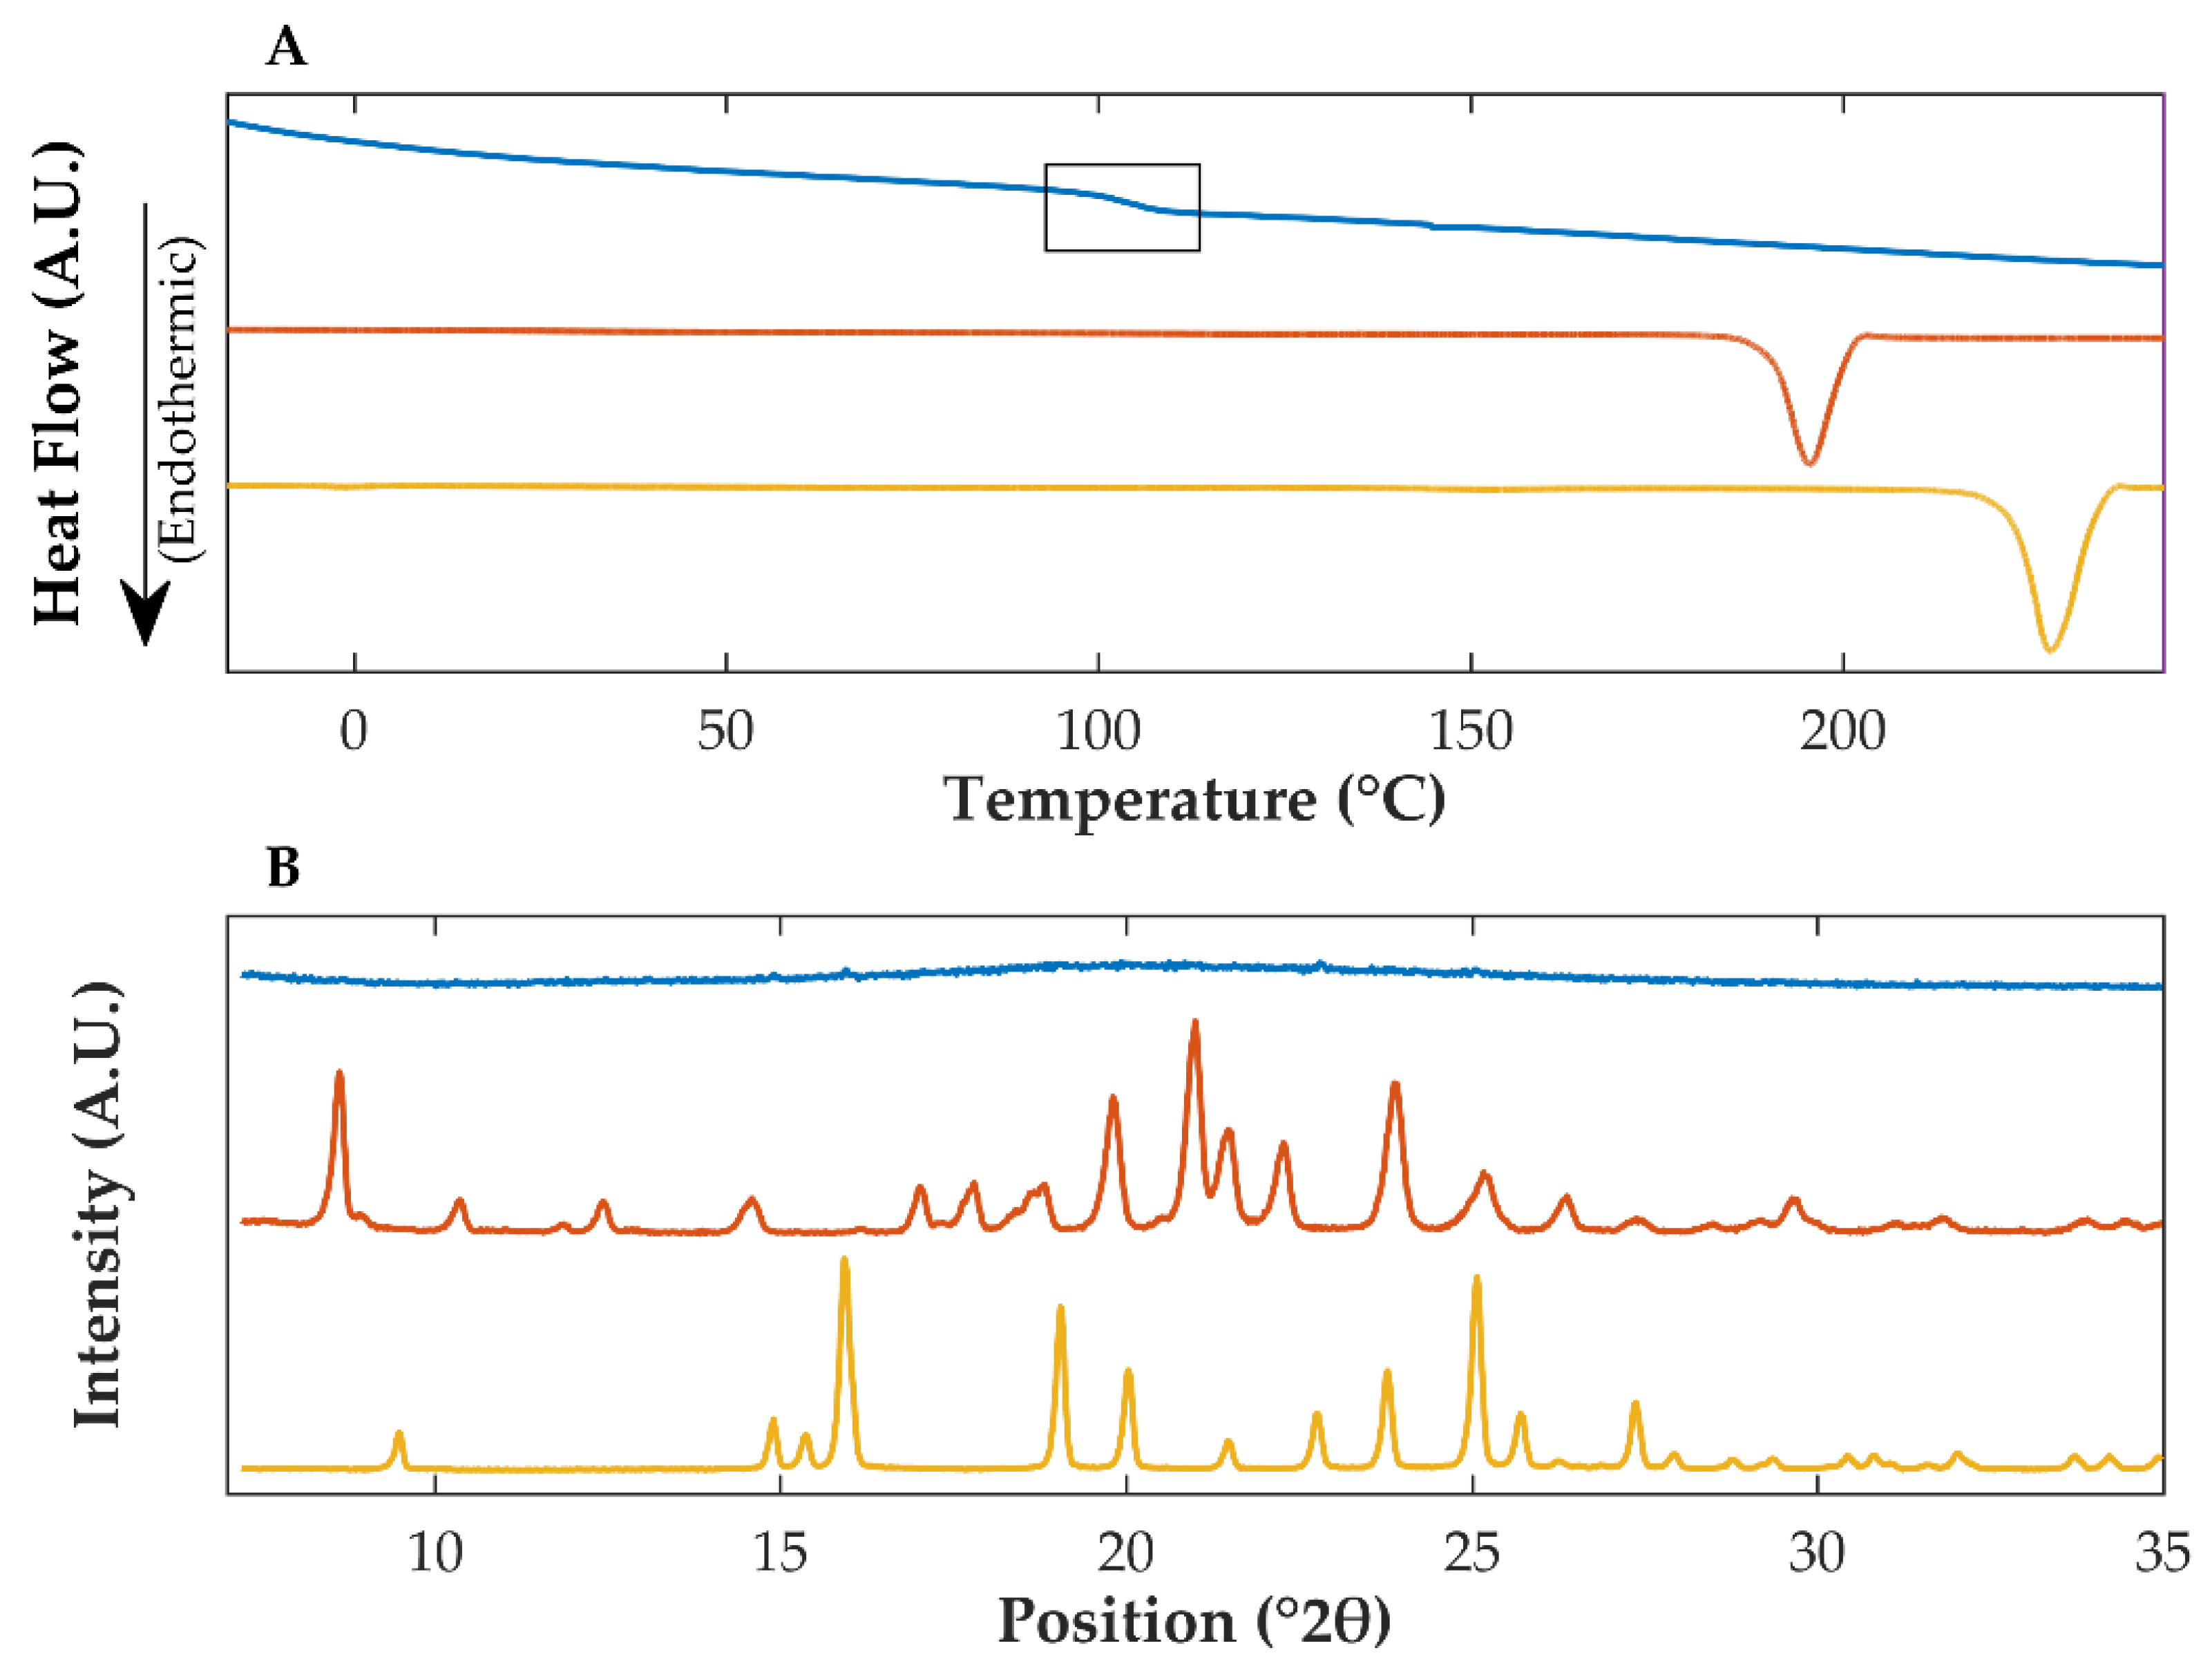
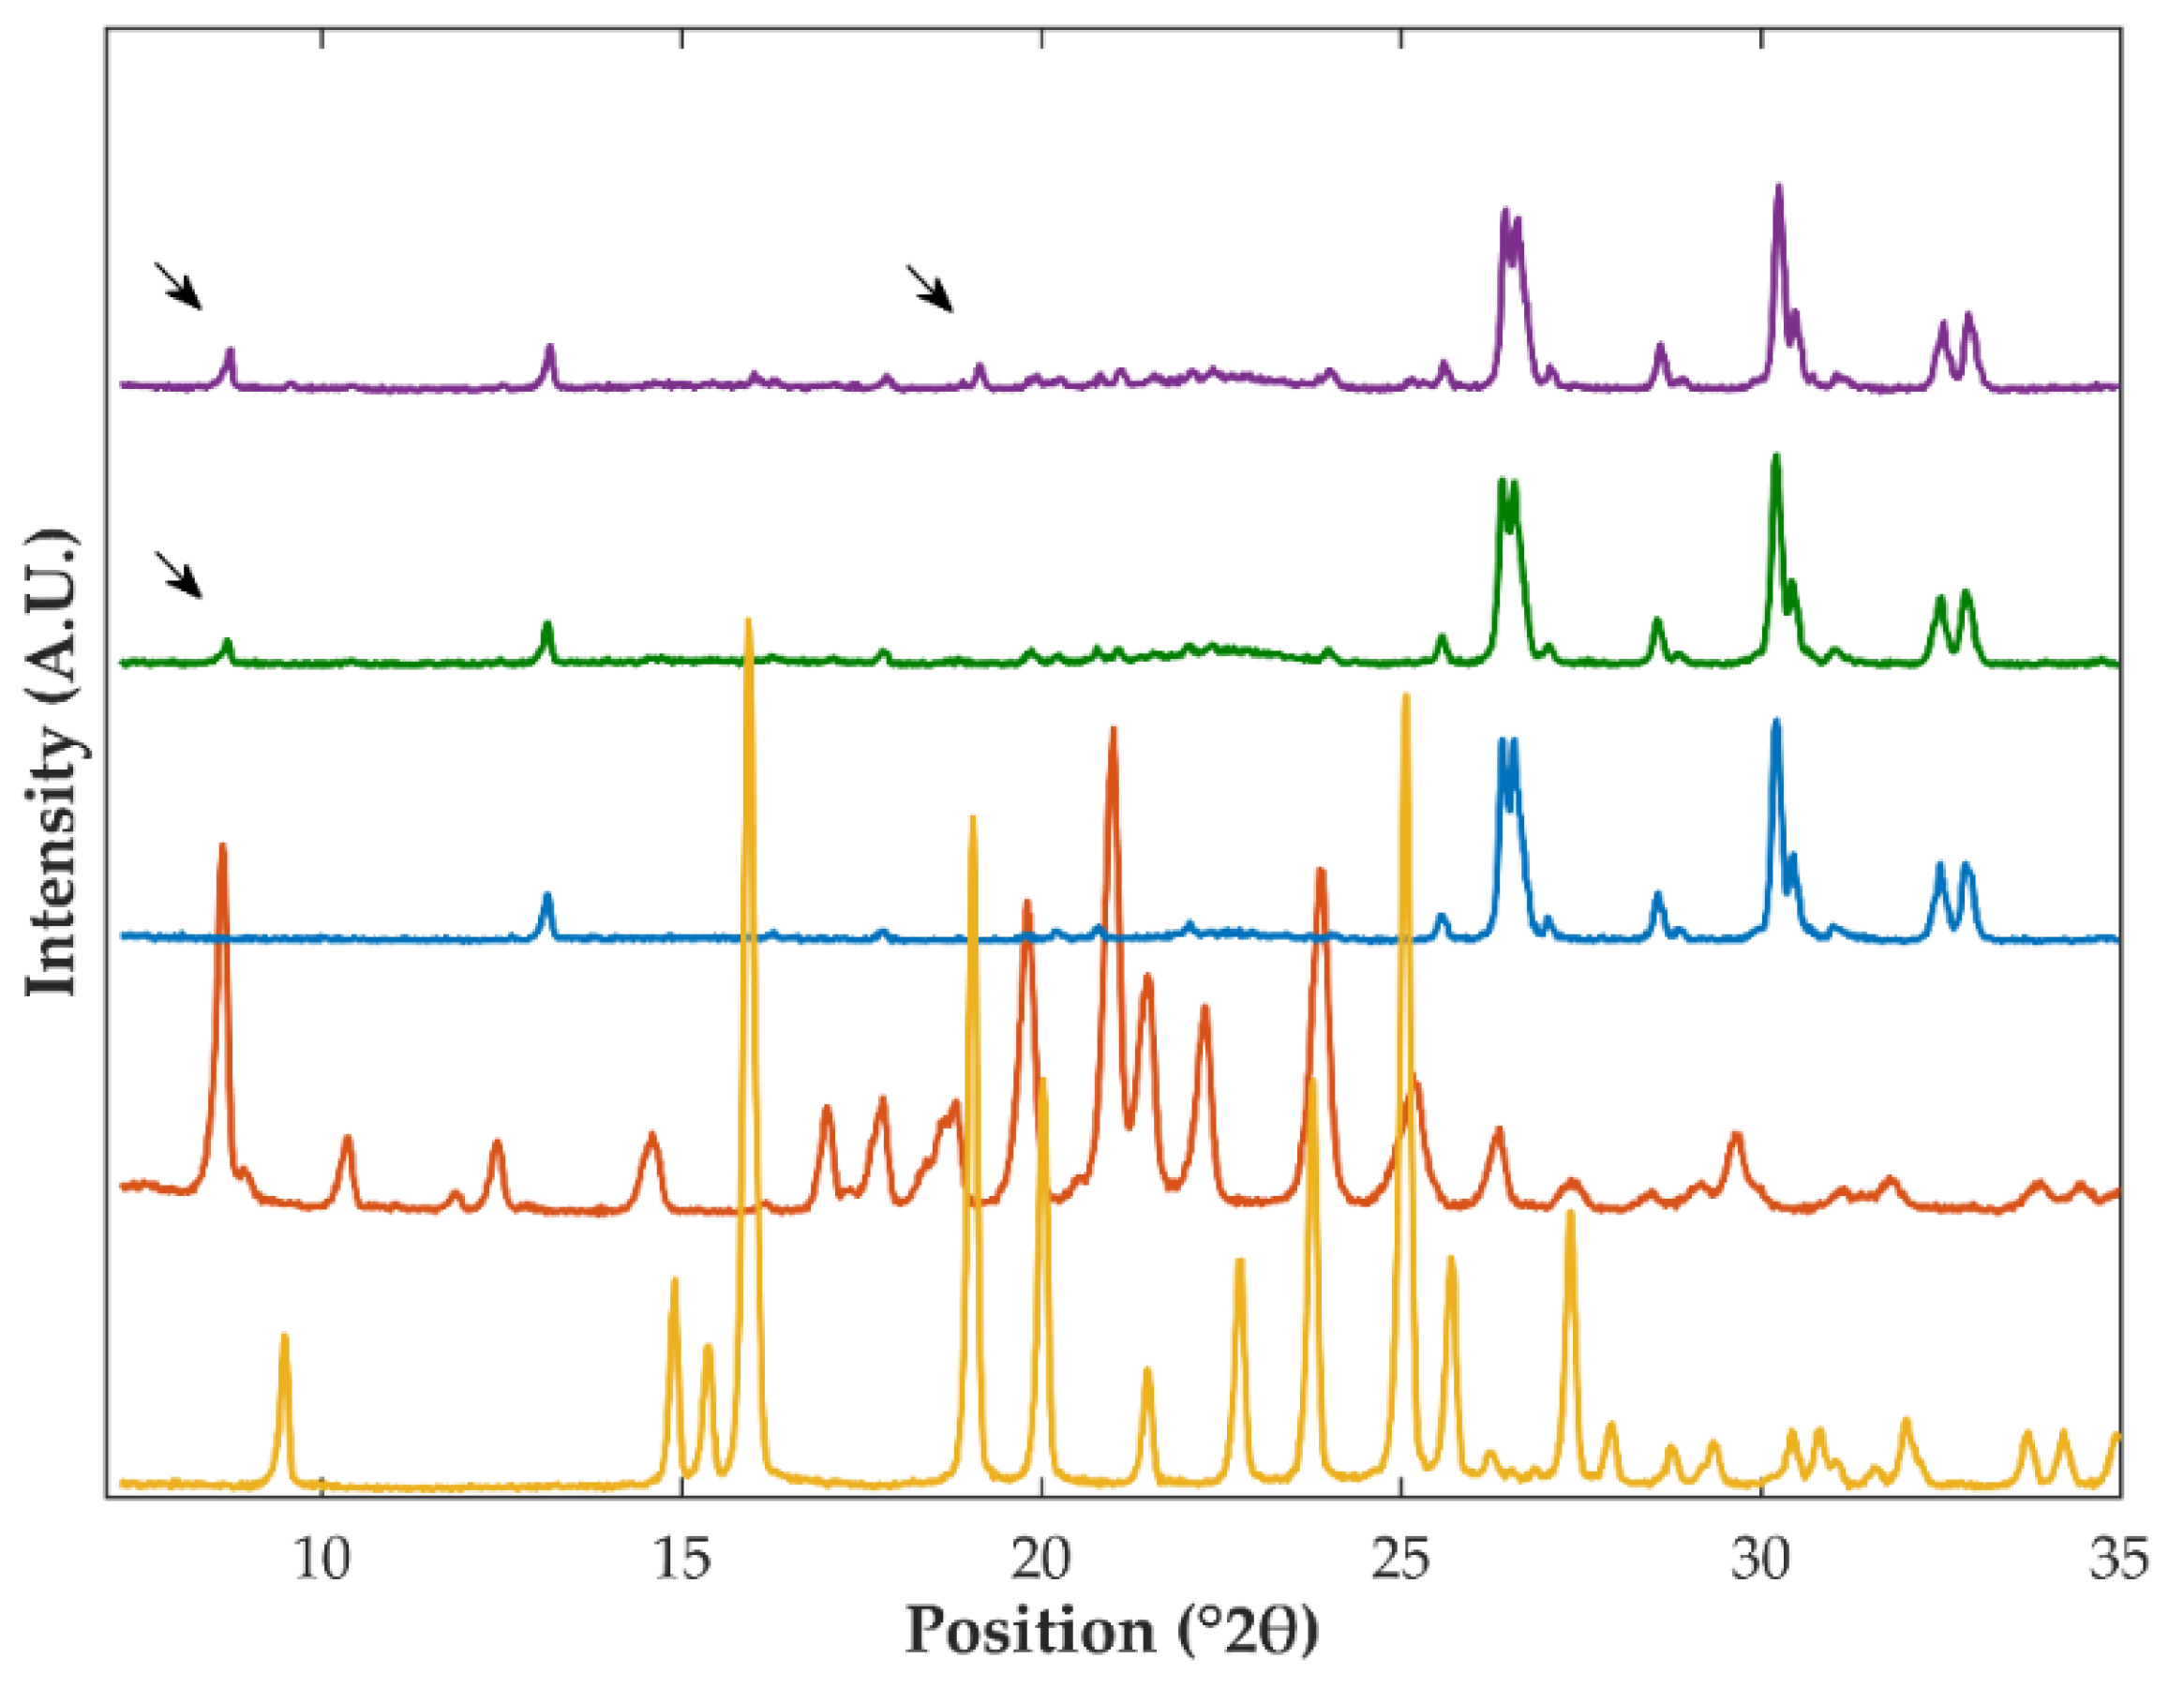
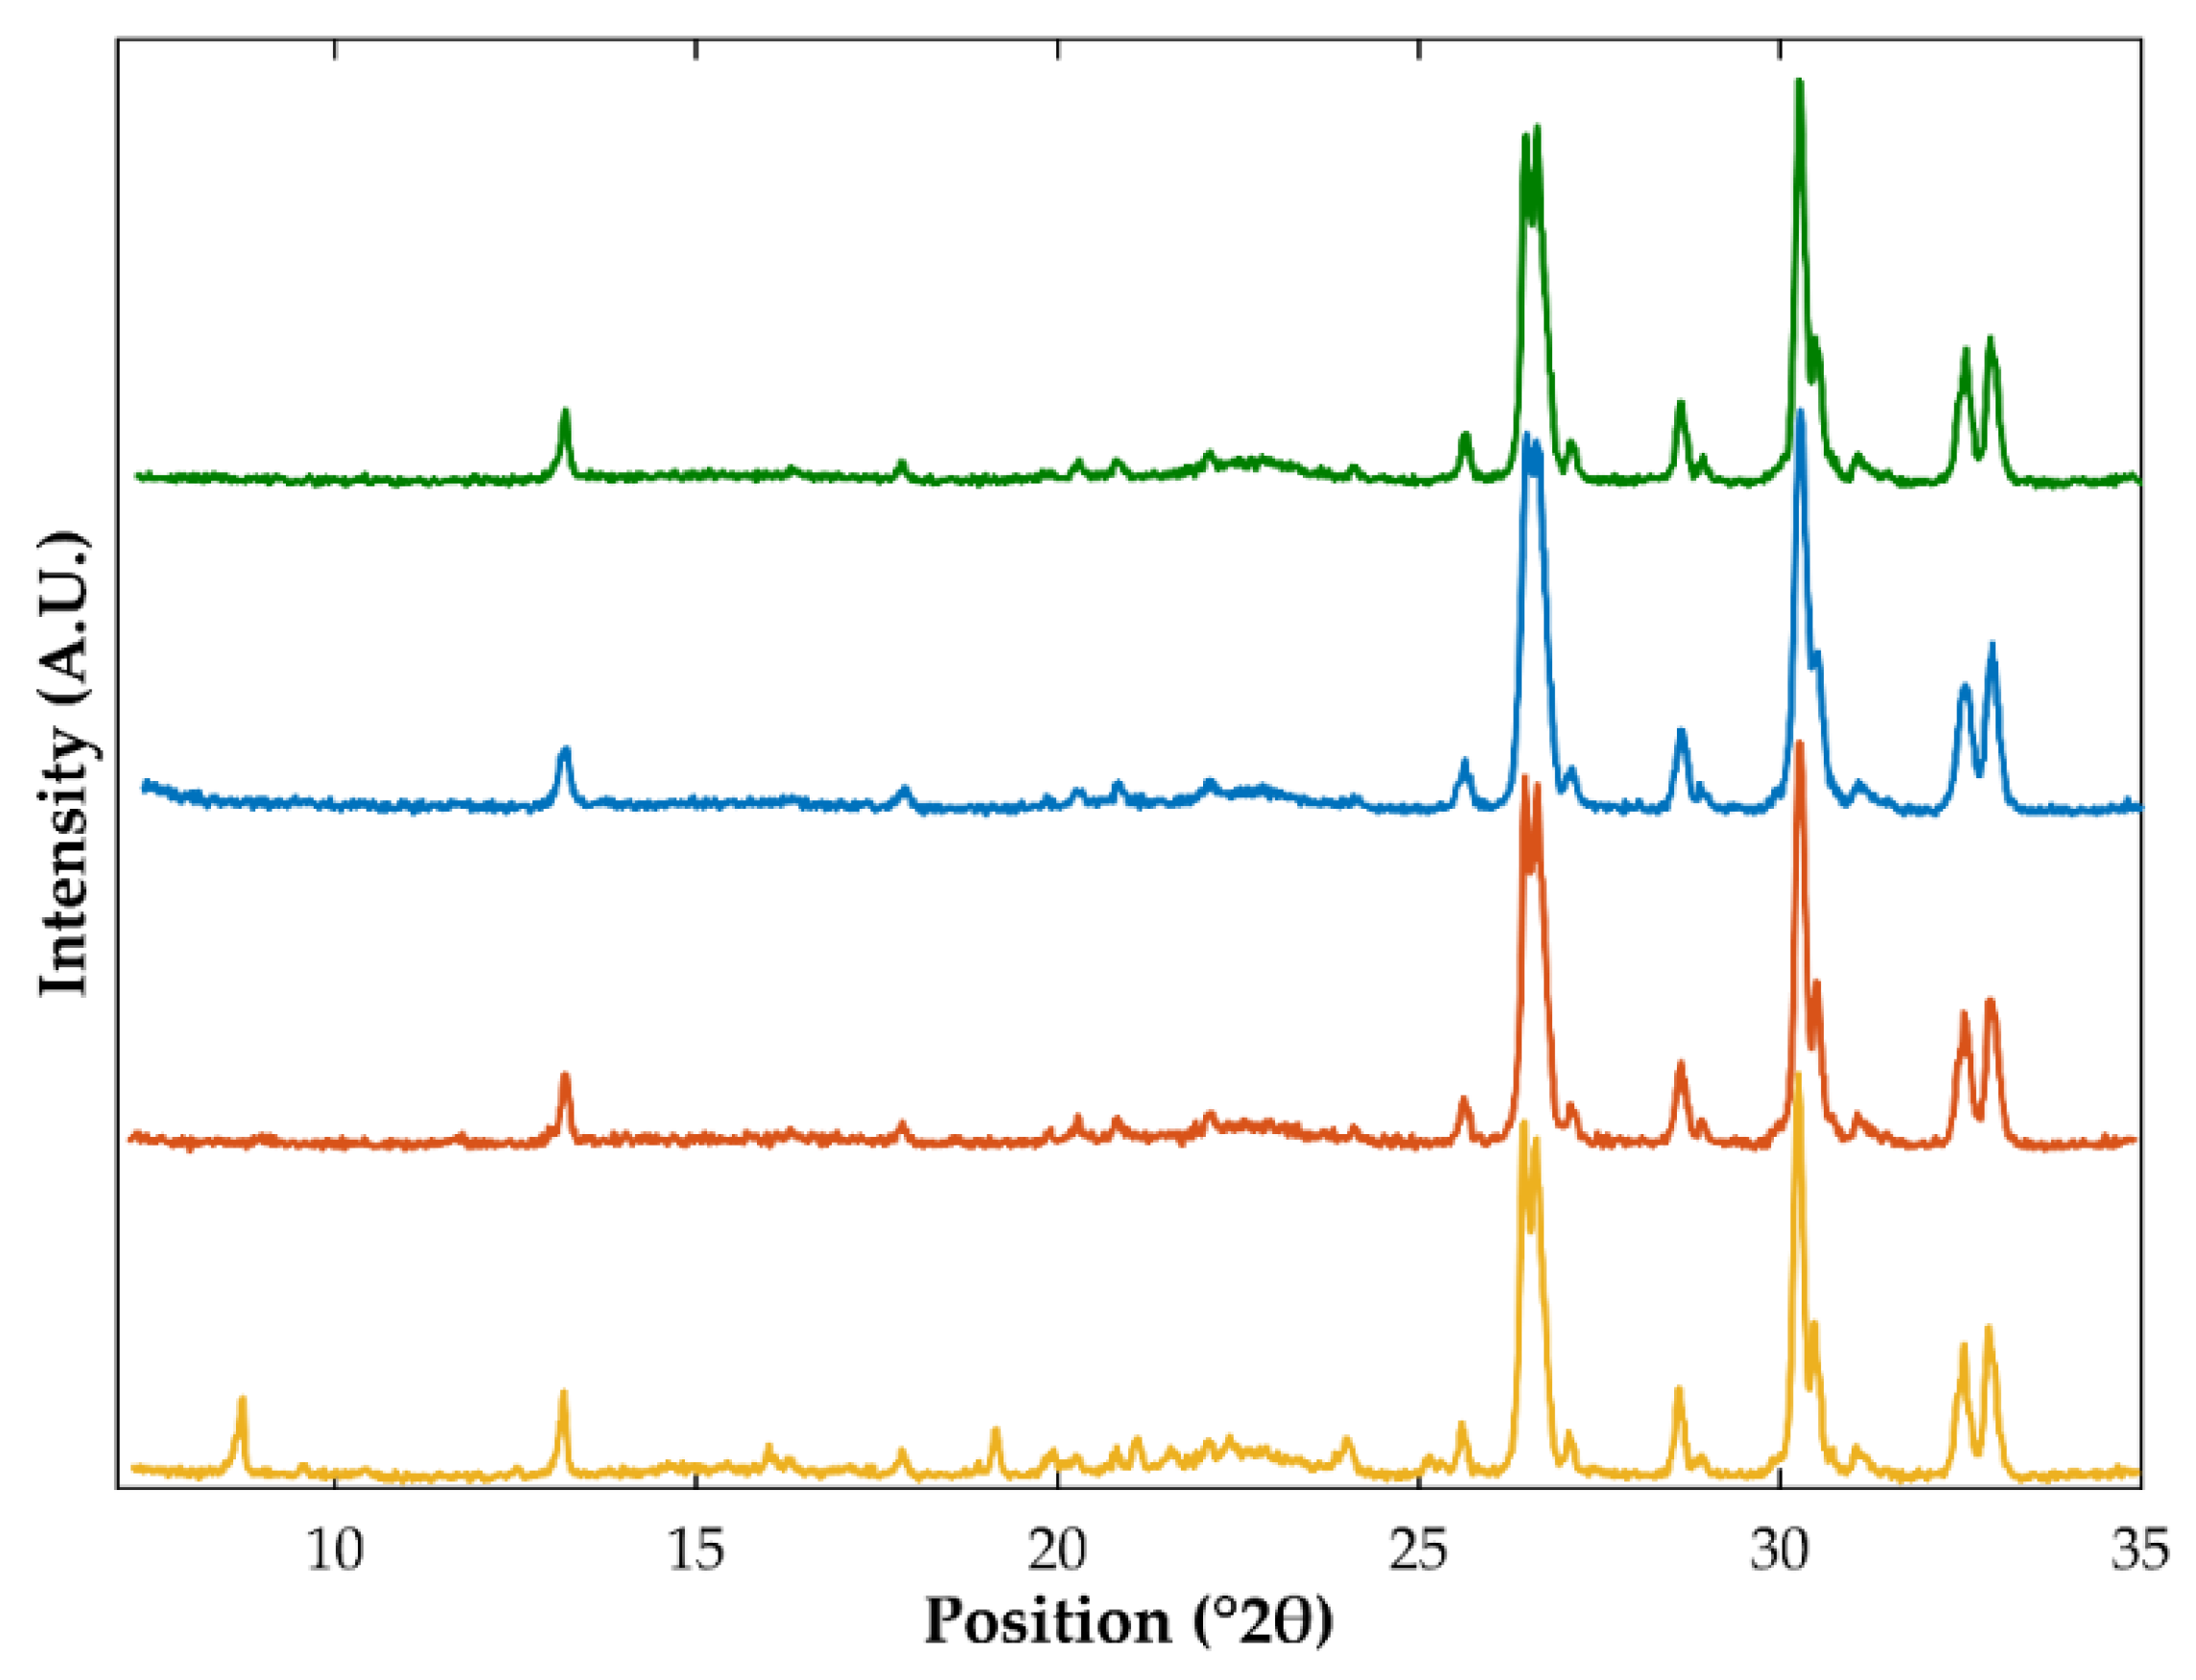
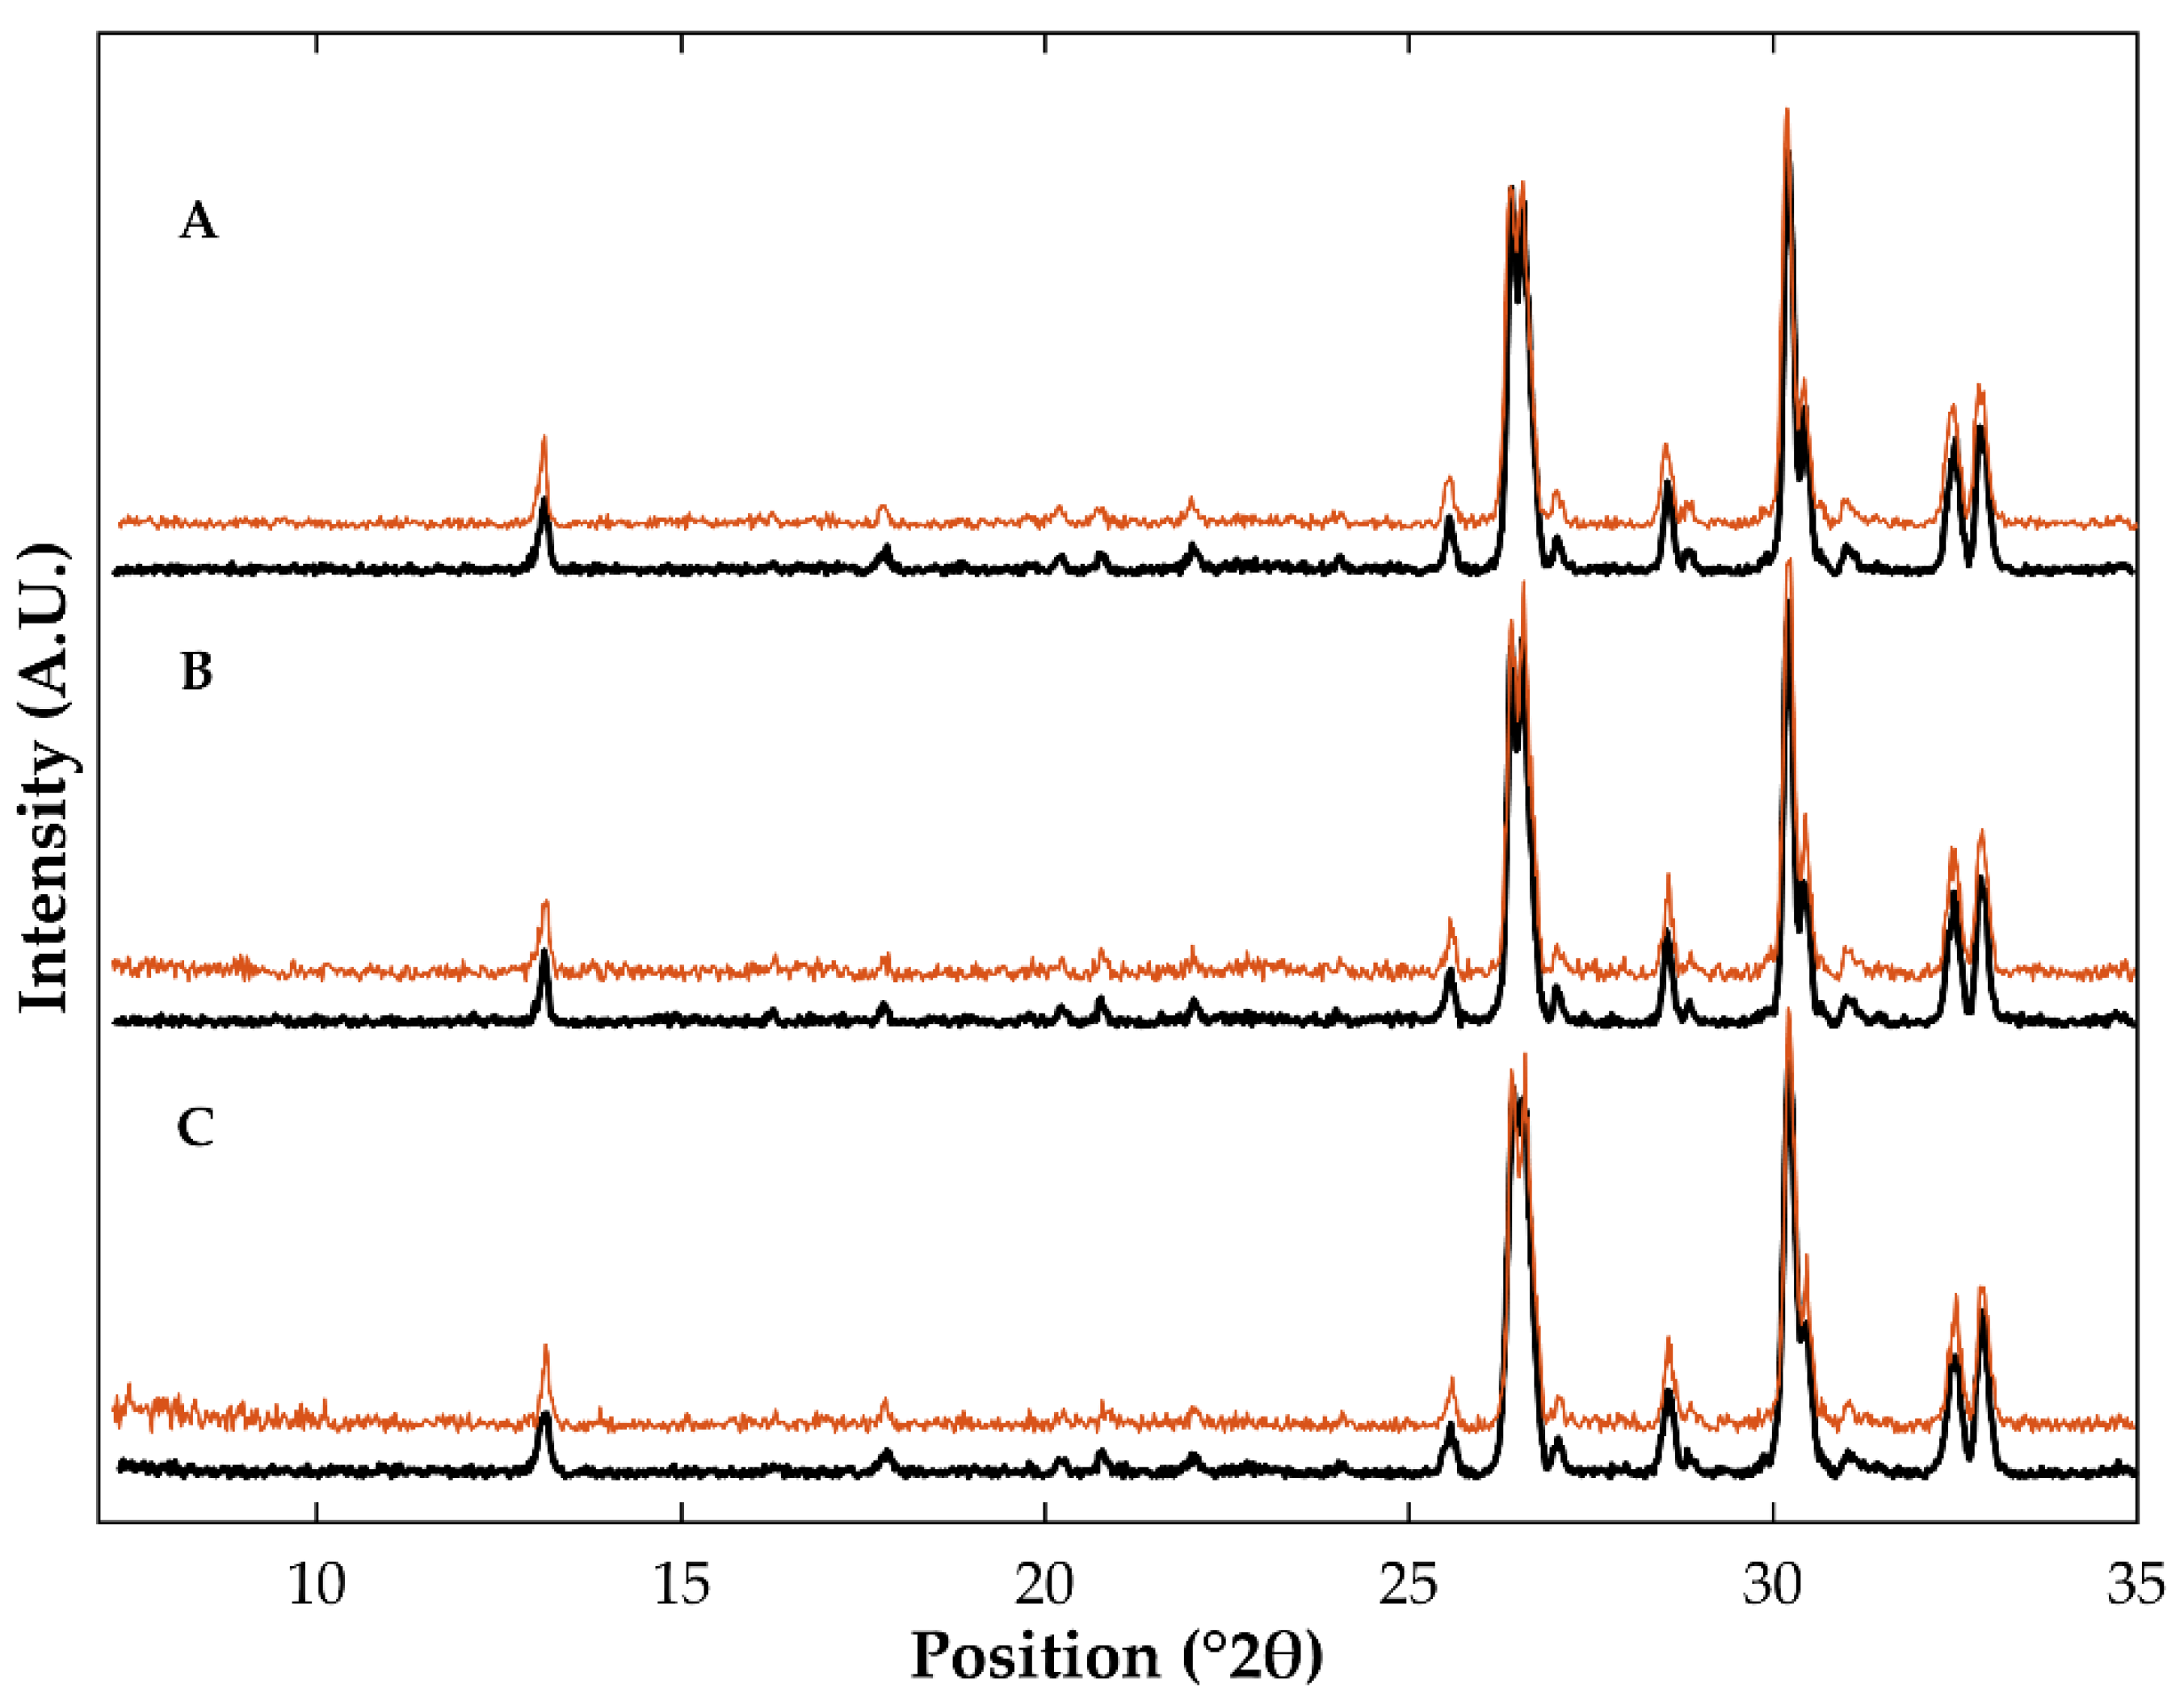
3.1. Differential Scanning Calorimetry and X-ray Powder Diffraction
3.2. Fourier-Transform Infrared Spectroscopy
3.3. Manufacture of Pellets Containing Olanzapine
3.3.1. Preparation of Pellets Containing Olanzapine in the Matrix
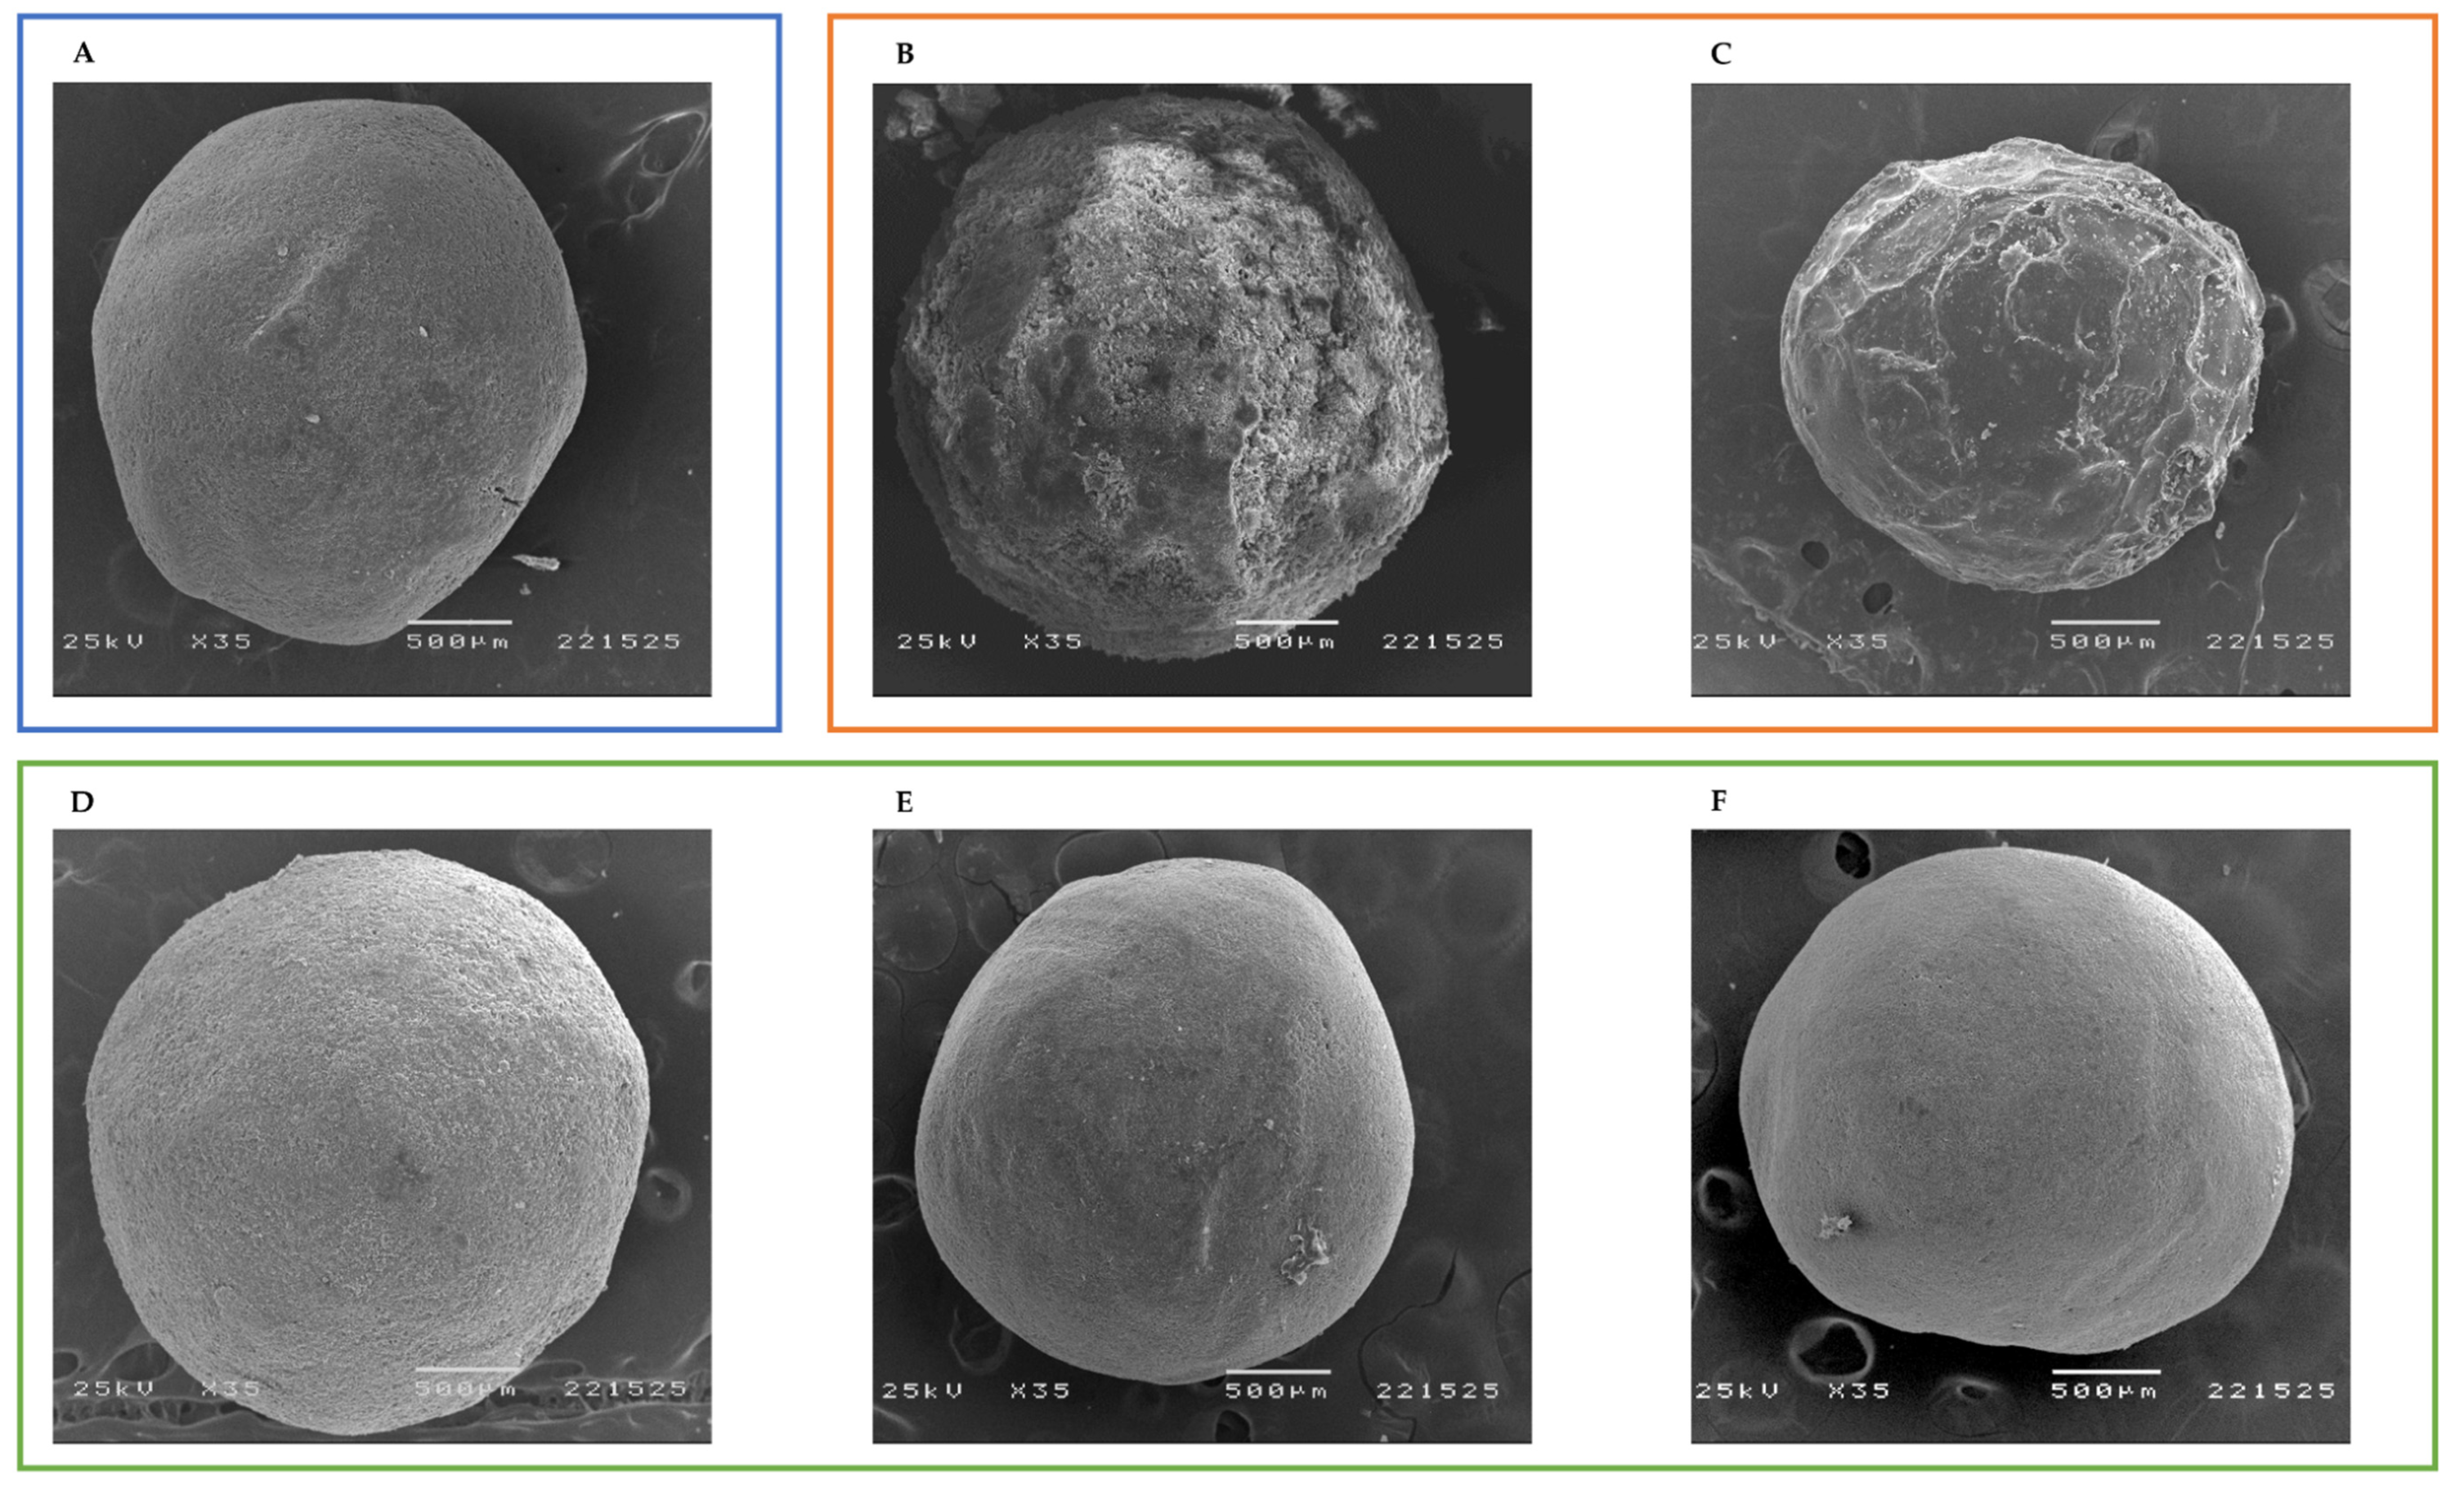
3.3.2. Preparation and Characterization of Pellets Containing Olanzapine on the Surface
3.4. Evaluation of the Stability of Co-Amorphous Olanzapine in Pellets
4. Conclusions
Supplementary Materials
Author Contributions
Funding
Data Availability Statement
Acknowledgments
Conflicts of Interest
References
- Liu, J.; Grohganz, H.; Löbmann, K.; Rades, T.; Hempel, N.-J.J. Co-Amorphous Drug Formulations in Numbers: Recent Advances in Co-Amorphous Drug Formulations with Focus on Co-Formability, Molar Ratio, Preparation Methods, Physical Stability, In Vitro and In Vivo Performance, and New Formulation Strategies. Pharmaceutics 2021, 13, 389. [Google Scholar] [CrossRef] [PubMed]
- Chen, X.; Li, D.; Zhang, H.; Duan, Y.; Huang, Y. Co-amorphous systems of sinomenine with nonsteroidal anti-inflammatory drugs: A strategy for solubility improvement, sustained release, and drug combination therapy against rheumatoid arthritis. Int. J. Pharm. 2021, 606, 120894. [Google Scholar] [CrossRef] [PubMed]
- Karimi-Jafari, M.; Padrela, L.; Walker, G.M.; Croker, D.M. Creating cocrystals: A review of pharmaceutical cocrystal preparation routes and applications. Cryst. Growth Des. 2018, 18, 6370–6387. [Google Scholar] [CrossRef] [Green Version]
- Batisai, E. Solubility Enhancement of Antidiabetic Drugs Using a Co-Crystallization Approach. ChemistryOpen 2021, 10, 1260–1268. [Google Scholar] [CrossRef] [PubMed]
- Wilson, V.R.; Lou, X.; Osterling, D.J.; Stolarik, D.A.F.; Jenkins, G.J.; Nichols, B.L.B.; Dong, Y.; Edgar, K.J.; Zhang, G.G.Z.; Taylor, L.S. Amorphous solid dispersions of enzalutamide and novel polysaccharide derivatives: Investigation of relationships between polymer structure and performance. Sci. Rep. 2020, 10, 18535. [Google Scholar] [CrossRef]
- Löbmann, K.; Grohganz, H.; Laitinen, R.; Strachan, C.; Rades, T. Amino acids as co-amorphous stabilizers for poorly water soluble drugs—Part 1: Preparation, stability and dissolution enhancement. Eur. J. Pharm. Biopharm. 2013, 85, 873–881. [Google Scholar] [CrossRef]
- Gao, Y.; Liao, J.; Qi, X.; Zhang, J. Coamorphous repaglinide—Saccharin with enhanced dissolution. Int. J. Pharm. 2013, 450, 290–295. [Google Scholar] [CrossRef]
- Zhang, M.; Xiong, X.; Suo, Z.; Hou, Q.; Gan, N.; Tang, P.; Ding, X.; Li, H. Co-amorphous palbociclib-organic acid systems with increased dissolution rate, enhanced physical stability and equivalent biosafety. RSC Adv. 2019, 9, 3946–3955. [Google Scholar] [CrossRef] [Green Version]
- Lino, P.; Henriques, J. Amorphous Solid Dispersions-Increasing Solubility from API to Tablets. Available online: https://drug-dev.com/amorphous-solid-dispersions-increasing-solubility-from-api-to-tablets/ (accessed on 6 July 2022).
- Karagianni, A.; Kachrimanis, K.; Nikolakakis, I. Co-Amorphous Solid Dispersions for Solubility and Absorption Improvement of Drugs: Composition, Preparation, Characterization and Formulations for Oral Delivery. Pharmaceutics 2018, 10, 98. [Google Scholar] [CrossRef] [Green Version]
- Han, J.; Wei, Y.; Lu, Y.; Wang, R.; Zhang, J.; Gao, Y.; Qian, S. Co-amorphous systems for the delivery of poorly water-soluble drugs: Recent advances and an update. Expert Opin. Drug Deliv. 2020, 17, 1411–1435. [Google Scholar] [CrossRef]
- Chavan, R.B.; Thipparaboina, R.; Kumar, D.; Shastri, N.R. Co amorphous systems: A product development perspective. Int. J. Pharm. 2016, 515, 403–415. [Google Scholar] [CrossRef] [PubMed]
- Fini, A.; Cavallari, C.; Ceschel, G.; Rabasco, A.M. Bimodal Release of Olanzapine from Lipid Microspheres. J. Pharm. Sci. 2010, 99, 4251–4260. [Google Scholar] [CrossRef] [PubMed]
- Balbão, M.S.; Hallak, J.E.C.; Nunes, E.A.; de Mello, M.H.; Triffoni-Melo, A.T.; Ferreira, F.I.S.; Chaves, C.; Durão, A.M.S.; Ramos, A.P.P.; Crippa, J.A.S.; et al. Olanzapine, weight change and metabolic effects: A naturalistic 12-month follow up. Ther. Adv. Psychopharmacol. 2014, 4, 30–36. [Google Scholar] [CrossRef] [PubMed] [Green Version]
- da Costa, N.F.; Santos, I.A.; Fernandes, A.I.; Pinto, J.F. Sulfonic acid derivatives in the production of stable co-amorphous systems for solubility enhancement. J. Pharm. Sci. 2022, 111, 3327–3339. [Google Scholar] [CrossRef] [PubMed]
- Aparnathi, K.D. Chemistry and Use of Artificial Intense Sweeteners. Int. J. Curr. Microbiol. Appl. Sci. 2017, 6, 1283–1296. [Google Scholar] [CrossRef]
- Shah, C.R.; Suhagia, B.N.; Shah, N.J.; Patel, D.R.; Patel, N.M. Stability-indicating simultaneous HPTLC method for olanzapine and fluoxetine in combined tablet dosage form. Indian J. Pharm. Sci. 2008, 70, 251–255. [Google Scholar] [CrossRef] [Green Version]
- Mahmood, A.A.R.; Al-Juboori, S.B. A Review: Saccharin Discovery, Synthesis, and Applications. Ibn AL- Haitham J. Pure Appl. Sci. 2020, 33, 43–61. [Google Scholar] [CrossRef]
- Jensen, K.T.; Blaabjerg, L.I.; Lenz, E.; Bohr, A.; Grohganz, H.; Kleinebudde, P.; Rades, T.; Löbmann, K. Preparation and characterization of spray-dried co-amorphous drug-amino acid salts. J. Pharm. Pharmacol. 2016, 68, 615–624. [Google Scholar] [CrossRef]
- Wu, W.; Löbmann, K.; Rades, T.; Grohganz, H. On the role of salt formation and structural similarity of co-formers in co-amorphous drug delivery systems. Int. J. Pharm. 2018, 535, 86–94. [Google Scholar] [CrossRef] [PubMed]
- Narala, S.; Nyavanandi, D.; Srinivasan, P.; Mandati, P.; Bandari, S.; Repka, M.A. Pharmaceutical Co-crystals, Salts, and Co-amorphous Systems: A novel opportunity of hot-melt extrusion. J. Drug Deliv. Sci. Technol. 2021, 61, 102209. [Google Scholar] [CrossRef]
- Allu, S.; Suresh, K.; Bolla, G.; Mannava, M.K.C.; Nangia, A. Role of hydrogen bonding in cocrystals and coamorphous solids: Indapamide as a case study. CrystEngComm 2019, 21, 2043. [Google Scholar] [CrossRef]
- Lenz, E.; Löbmann, K.; Rades, T.; Knop, K.; Kleinebudde, P. Hot Melt Extrusion and Spray Drying of Co-amorphous Indomethacin-Arginine With Polymers. J. Pharm. Sci. 2017, 106, 302–312. [Google Scholar] [CrossRef] [PubMed] [Green Version]
- Wlodarski, K.; Sawicki, W.; Paluch, K.J.; Tajber, L.; Grembecka, M.; Hawelek, L.; Wojnarowska, Z.; Grzybowska, K.; Talik, E.; Paluch, M. The influence of amorphization methods on the apparent solubility and dissolution rate of tadalafil. Eur. J. Pharm. Sci. 2014, 62, 132–140. [Google Scholar] [CrossRef] [PubMed]
- Paudel, A.; Meeus, J.; Mooter, G. Van den Structural Characterization of Amorphous Solid Dispersions. In Amorphous Solid Dispersions; Shah, N., Sandhu, H., Choi, D.S., Chokshi, H., Malick, A.W., Eds.; Springer: New York, NY, USA, 2014; pp. 421–485. ISBN 9781493915989. [Google Scholar]
- Ploeger, K.J.M.; Adack, P.; Sundararajan, P.; Valente, P.C.; Henriques, J.G.; Rosenberg, K.J. Spray drying and amorphous dispersions. In Chemical Engineering in the Pharmaceutical Industry; Ende, D.J.A., Ende, M.T.A., Eds.; John Wiley & Sons, Inc.: Hoboken, NJ, USA, 2019; pp. 267–292. ISBN 9781119600800. [Google Scholar]
- da Costa, N.F.; Pinto, J.F.; Fernandes, A.I. Cohesiveness of Powdered Co-Amorphous Olanzapine and Impact on Tablet Production. Med. Sci. Forum 2021, 5, 2. [Google Scholar] [CrossRef]
- da Costa, N.F.; Daniels, R.; Fernandes, A.I.; Pinto, J.F. Downstream Processing of Amorphous and Co-Amorphous Olanzapine Powder Blends. Pharmaceutics 2022, 14, 1535. [Google Scholar] [CrossRef]
- da Costa, N.F.; Fernandes, A.I.; Pinto, J.F. Measurement of the amorphous fraction of olanzapine incorporated in a co-amorphous formulation. Int. J. Pharm. 2020, 588, 119716. [Google Scholar] [CrossRef] [PubMed]
- Joshi, A.B.; Patel, S.; Kaushal, A.M.; Bansal, A.K. Compaction studies of alternate solid forms of celecoxib. Adv. Powder Technol. 2010, 21, 452–460. [Google Scholar] [CrossRef]
- Démuth, B.; Farkas, A.; Balogh, A.; Bartosiewicz, K.; Kállai-Szabó, B.; Bertels, J.; Vigh, T.; Mensch, J.; Verreck, G.; Van Assche, I.; et al. Lubricant-Induced Crystallization of Itraconazole From Tablets Made of Electrospun Amorphous Solid Dispersion. J. Pharm. Sci. 2016, 105, 2982–2988. [Google Scholar] [CrossRef] [Green Version]
- Thakral, N.K.; Mohapatra, S.; Stephenson, G.A.; Suryanarayanan, R. Compression-induced crystallization of amorphous indomethacin in tablets: Characterization of spatial heterogeneity by two-dimensional X-ray diffractometry. Mol. Pharm. 2015, 12, 253–263. [Google Scholar] [CrossRef]
- Petry, I.; Löbmann, K.; Grohganz, H.; Rades, T.; Leopold, C.S. In situ co-amorphisation of arginine with indomethacin or furosemide during immersion in an acidic medium—A proof of concept study. Eur. J. Pharm. Biopharm. 2018, 133, 151–160. [Google Scholar] [CrossRef]
- Huang, C.; Klinzing, G.; Procopio, A.; Yang, F.; Ren, J.; Burlage, R.; Zhu, L.; Su, Y. Understanding Compression-Induced Amorphization of Crystalline Posaconazole. Mol. Pharm. 2019, 16, 825–833. [Google Scholar] [CrossRef] [PubMed]
- Doreth, M.; Hussein, M.A.; Priemel, P.A.; Grohganz, H.; Holm, R.; de Diego, H.L.; Rades, T.; Löbmann, K. Amorphization within the tablet: Using microwave irradiation to form a glass solution in situ. Int. J. Pharm. 2017, 519, 343–351. [Google Scholar] [CrossRef] [PubMed]
- Petry, I.; Löbmann, K.; Grohganz, H.; Rades, T.; Leopold, C.S. In situ co-amorphisation in coated tablets—The combination of carvedilol with aspartic acid during immersion in an acidic medium. Int. J. Pharm. 2019, 558, 357–366. [Google Scholar] [CrossRef] [PubMed]
- Kim, D.H.; Kim, Y.W.; Tin, Y.Y.; Soe, M.T.P.; Ko, B.H.; Park, S.J.; Lee, J.W. Recent technologies for amorphization of poorly water-soluble drugs. Pharmaceutics 2021, 13, 1318. [Google Scholar] [CrossRef] [PubMed]
- Qiang, W.; Löbmann, K.; McCoy, C.P.; Andrews, G.P.; Zhao, M. Microwave-induced in situ amorphization: A new strategy for tackling the stability issue of amorphous solid dispersions. Pharmaceutics 2020, 12, 655. [Google Scholar] [CrossRef]
- Rowe, R.C.; Sheskey, P.J.; Quinn, M.E.; Hoppu, P. Saccharin. In Handbook of Pharmaceutical Excipients; Rowe, R.C., Sheskey, P.J., Quinn, M.E., Eds.; Pharmaceutical Press: London, UK; the American Pharmacists Association: Chicago, IL, USA, 2009; pp. 605–607. ISBN 9780853697923. [Google Scholar]
- Mainardes, R.M.; Gremião, M.P.D.; Evangelista, R.C. Thermoanalytical study of praziquantel-loaded PLGA nanoparticles. Rev. Bras. Ciencias Farm. J. Pharm. Sci. 2006, 42, 523–530. [Google Scholar] [CrossRef]
- Polla, G.I.; Vega, D.R.; Lanza, H.; Tombari, D.G.; Baggio, R.; Ayala, A.P.; Filho, J.M.; Fernández, D.; Leyva, G.; Dartayet, G. Thermal behaviour and stability in Olanzapine. Int. J. Pharm. 2005, 301, 33–40. [Google Scholar] [CrossRef] [PubMed]
- Basavoju, S.; Boström, D.; Velaga, S.P. Indomethacin-saccharin cocrystal: Design, synthesis and preliminary pharmaceutical characterization. Pharm. Res. 2008, 25, 530–541. [Google Scholar] [CrossRef]
- Ferreira, P.O.; de Moura, A.; de Almeida, A.C.; dos Santos, É.C.; Kogawa, A.C.; Caires, F.J. Mechanochemical synthesis, thermoanalytical study and characterization of new multicomponent solid forms of norfloxacin with saccharin. J. Therm. Anal. Calorim. 2022, 147, 1985–1997. [Google Scholar] [CrossRef]
- Gao, Y.; Zu, H.; Zhang, J. Enhanced dissolution and stability of adefovir dipivoxil by cocrystal formation. J. Pharm. Pharmacol. 2011, 63, 483–490. [Google Scholar] [CrossRef]
- Dengale, S.J.; Grohganz, H.; Rades, T.; Löbmann, K. Recent advances in co-amorphous drug formulations. Adv. Drug Deliv. Rev. 2016, 100, 116–125. [Google Scholar] [CrossRef] [PubMed]
- Erkoboni, D.F. Extrusion/Spheronization. In Pharmaceutical Extrusion Technology; Ghebre-Sellassie, I., Martin, C., Eds.; Marcel Dekker Incorporated: New York, NY, USA, 2003; pp. 249–290. ISBN 9780824755201. [Google Scholar]
- Pinto, J.F.; Buckton, G.; Newton, J.M. The influence of four selected processing and formulation factors on the production of spheres by extrusion and spheronisation. Int. J. Pharm. 1992, 83, 187–196. [Google Scholar] [CrossRef]
- European Directorate for the Quality of Medicines & HealthCare. European Pharmacopoeia, 10th ed.; Council of Europe: Strasbourg, France, 2021. [Google Scholar]
- da Costa, N.F.; Daniels, R.; Fernandes, A.I.; Pinto, J.F. Amorphous and Co-Amorphous Olanzapine Stability in Formulations Intended for Wet Granulation and Pelletization. Int. J. Mol. Sci. 2022, 23, 10234. [Google Scholar] [CrossRef] [PubMed]
- Lenz, E.; Jensen, K.T.; Blaabjerg, L.I.; Knop, K.; Grohganz, H.; Löbmann, K.; Rades, T.; Kleinebudde, P. Solid-state properties and dissolution behaviour of tablets containing co-amorphous indomethacin-arginine. Eur. J. Pharm. Biopharm. 2015, 96, 44–52. [Google Scholar] [CrossRef] [PubMed]
- International Conference on Harmonisation (ICH) Committee for Medicinal Products for Human Use, ICH Harmonized Guideline Q3C (R8) on Impurities: Guideline for Residual Solvents. ICH Expert Work. Gr. 2021, 31. Available online: https://database.ich.org/sites/default/files/ICH_Q3C-R8_Guideline_Step4_2021_0422.pdf (accessed on 17 October 2022).
- Yang, N. Dichloromethane. In Encyclopedia of Toxicology; Wexler, P., Ed.; Elsevier Inc.: London, UK, 2014; pp. 99–101. ISBN 9780123864543. [Google Scholar]


| Formulation | |||
|---|---|---|---|
| Material | P | I | II * |
| OLZ | - | 5 | 5 |
| SAC | - | - | 3 |
| Dibasic calcium phosphate anhydrous | 75 | 71 | 69 |
| Microcrystalline cellulose | 20 | 19 | 18 |
| Polyvinylpyrrolidone | 5 | 5 | 5 |
| Matrix | Surface | ||||
|---|---|---|---|---|---|
| OLZ | OLZ:SAC | CAM | OLZ | OLZ:SAC | |
| OLZ content (% w/w) | 100.19 ± 4.71 | 100.02 ± 6.79 | 99.91 ± 2.22 | 100.48 ± 8.20 | 100.81 ± 7.92 |
| Crushing Strength (N) | 23.97 ± 2.84 ** | 33.61 ± 2.44 ## | 36.38 ± 2.02 ## | 23.76 ± 3.18 ** | 24.67 ± 2.47 ** |
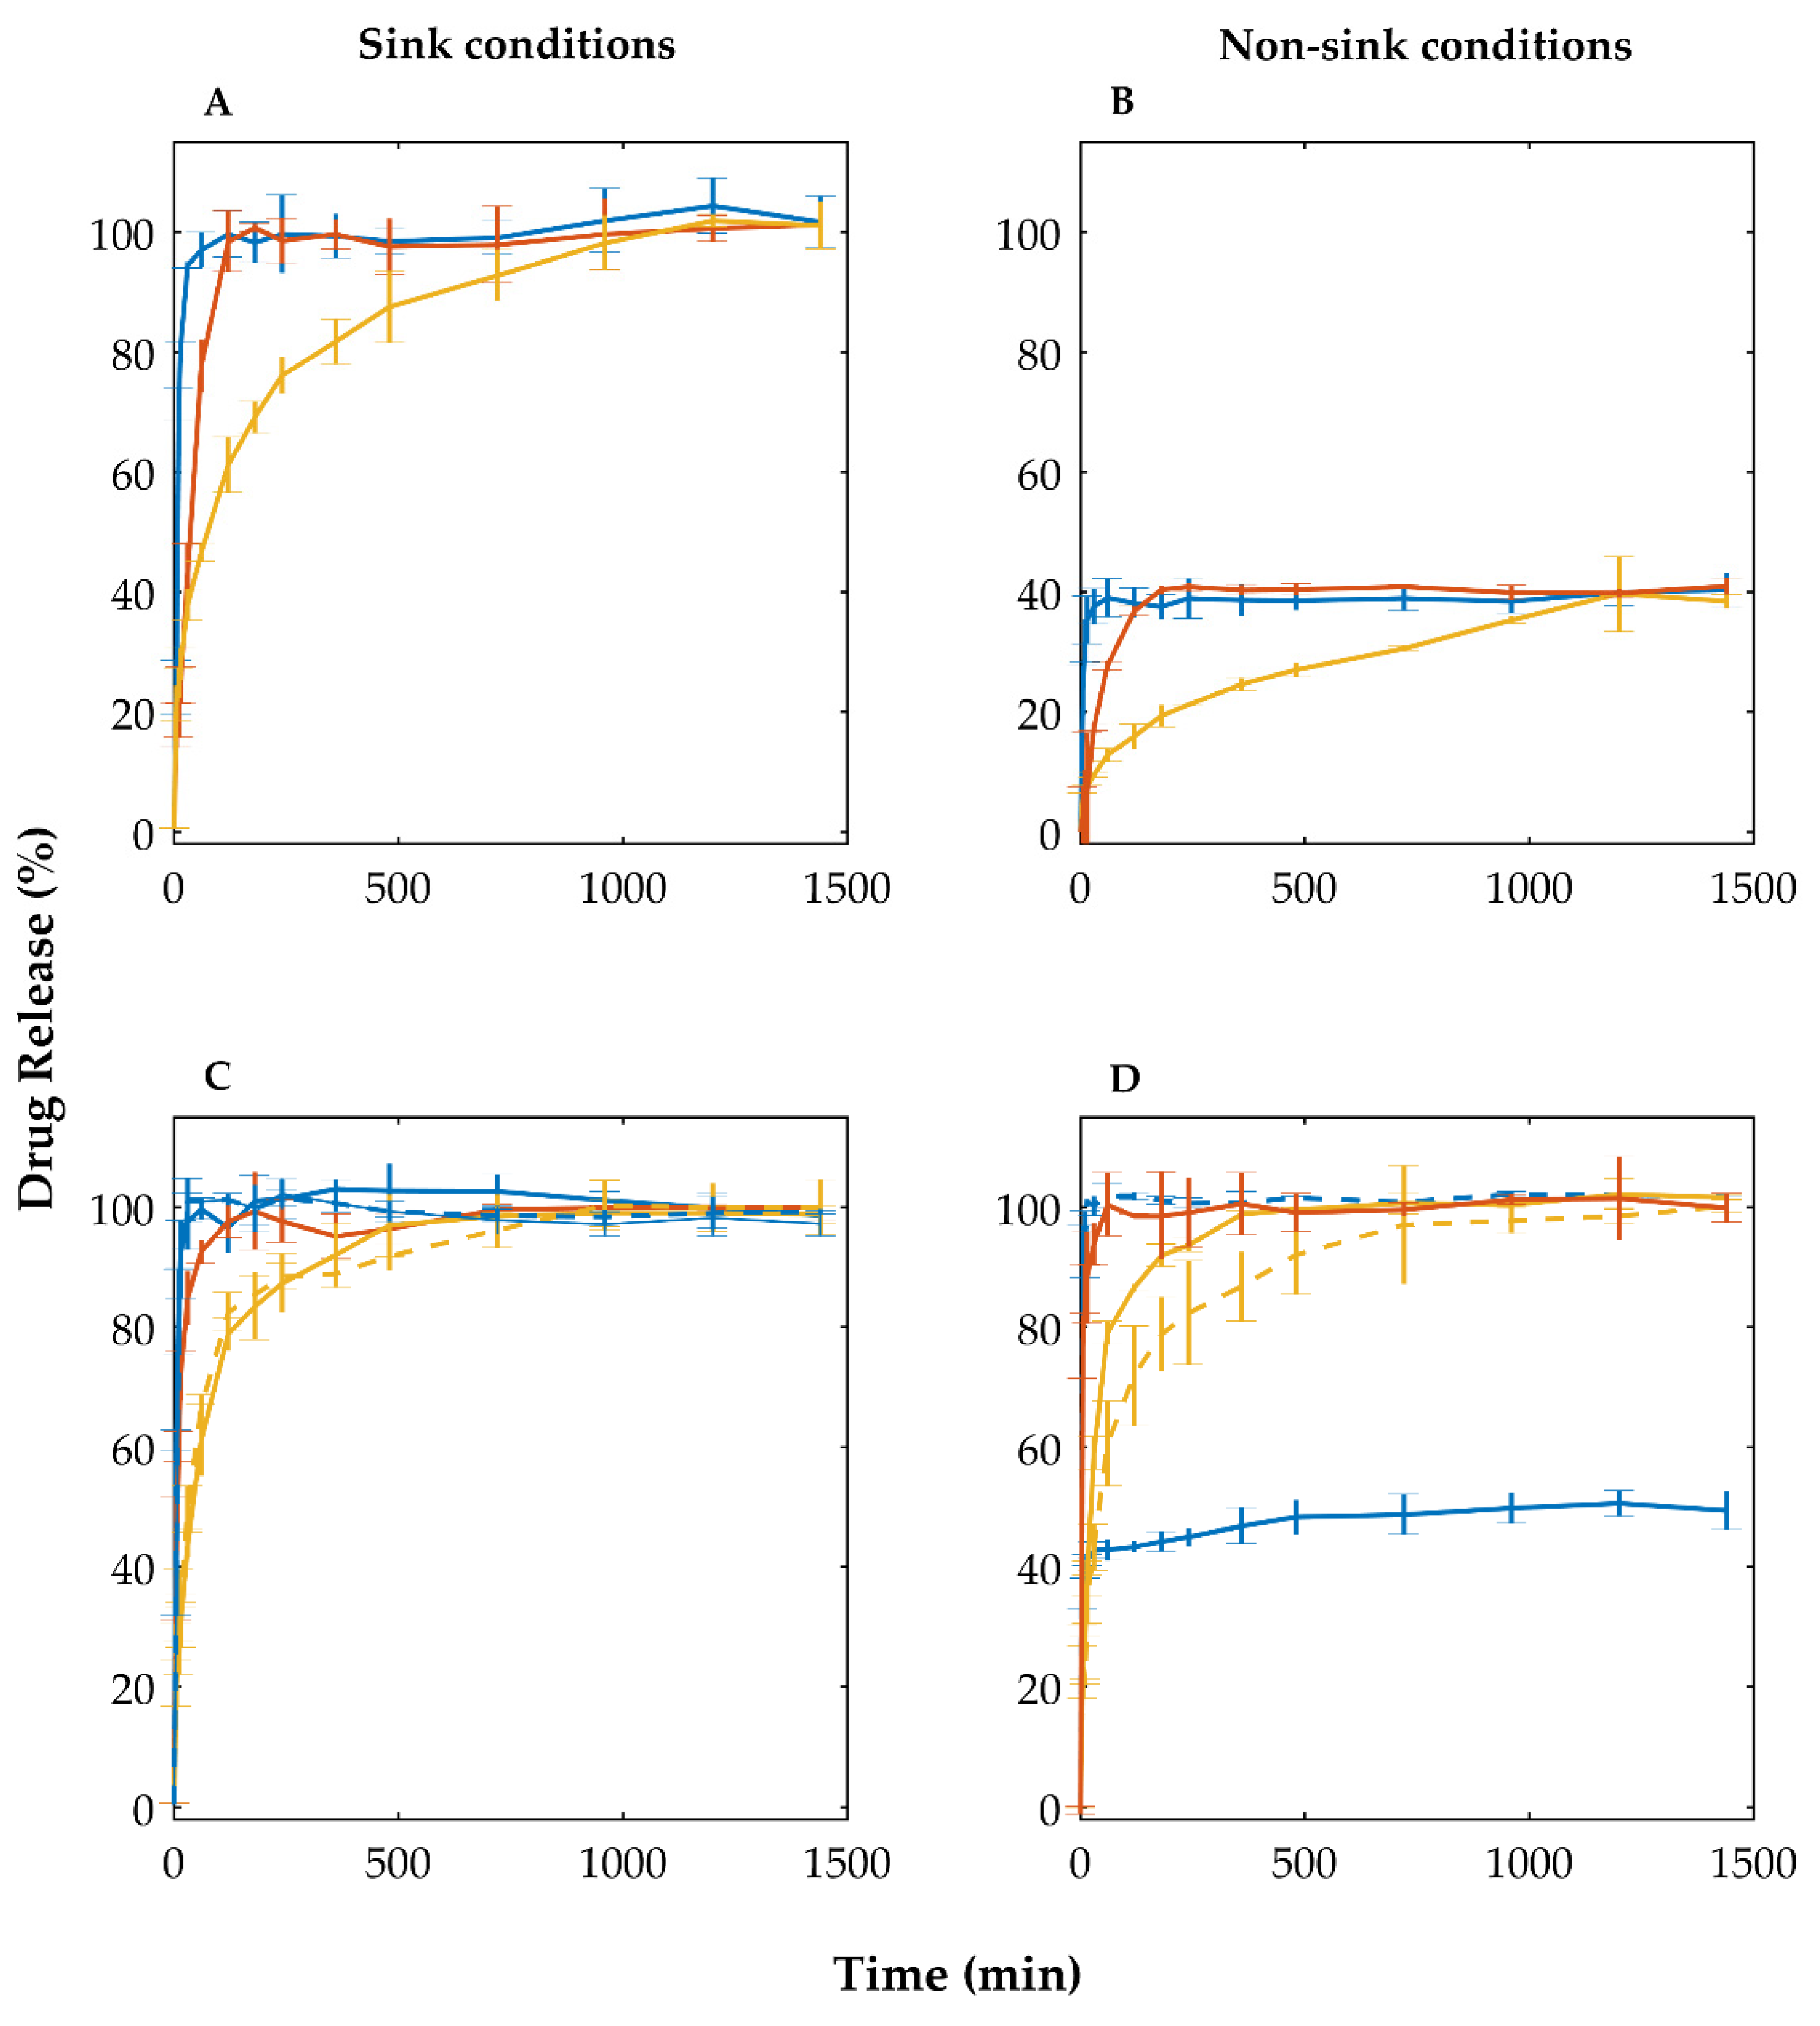
| t50% (min) 1 | 70.71 ± 3.35 ** | 31.36 ± 4.28 ## | 39.25 ± 3.90 ##,* | 35.37 ± 3.30 ## | 6.72 ± 1.78 ##,** |
| t75% (min) 1 | 252.86 ± 22.99 ** | 88.77 ± 8.95 ## | 102.17 ± 10.04 ## | 58.89 ± 4.29 ##,* | 13.96 ± 1.15 ##,** |
Publisher’s Note: MDPI stays neutral with regard to jurisdictional claims in published maps and institutional affiliations. |
© 2022 by the authors. Licensee MDPI, Basel, Switzerland. This article is an open access article distributed under the terms and conditions of the Creative Commons Attribution (CC BY) license (https://creativecommons.org/licenses/by/4.0/).
Share and Cite
da Costa, N.F.; Azevedo, R.F.; Lopes, J.A.; Fernandes, A.I.; Pinto, J.F. In Situ Co-Amorphization of Olanzapine in the Matrix and on the Coat of Pellets. Pharmaceutics 2022, 14, 2587. https://0-doi-org.brum.beds.ac.uk/10.3390/pharmaceutics14122587
da Costa NF, Azevedo RF, Lopes JA, Fernandes AI, Pinto JF. In Situ Co-Amorphization of Olanzapine in the Matrix and on the Coat of Pellets. Pharmaceutics. 2022; 14(12):2587. https://0-doi-org.brum.beds.ac.uk/10.3390/pharmaceutics14122587
Chicago/Turabian Styleda Costa, Nuno F., Raquel F. Azevedo, João A. Lopes, Ana I. Fernandes, and João F. Pinto. 2022. "In Situ Co-Amorphization of Olanzapine in the Matrix and on the Coat of Pellets" Pharmaceutics 14, no. 12: 2587. https://0-doi-org.brum.beds.ac.uk/10.3390/pharmaceutics14122587