
Estimating the Dissolution of Anticancer Drugs in Supercritical Carbon Dioxide with a Stacked Machine Learning Model


 , ,
, ,  , ,
, ,  ,
,
Abstract
:1. Introduction
2. Anticancer Drugs’ Solubility in Supercritical Carbon Dioxide
3. Methods
3.1. Extra Tree
3.2. Gradient Boosting
3.3. Random Forest
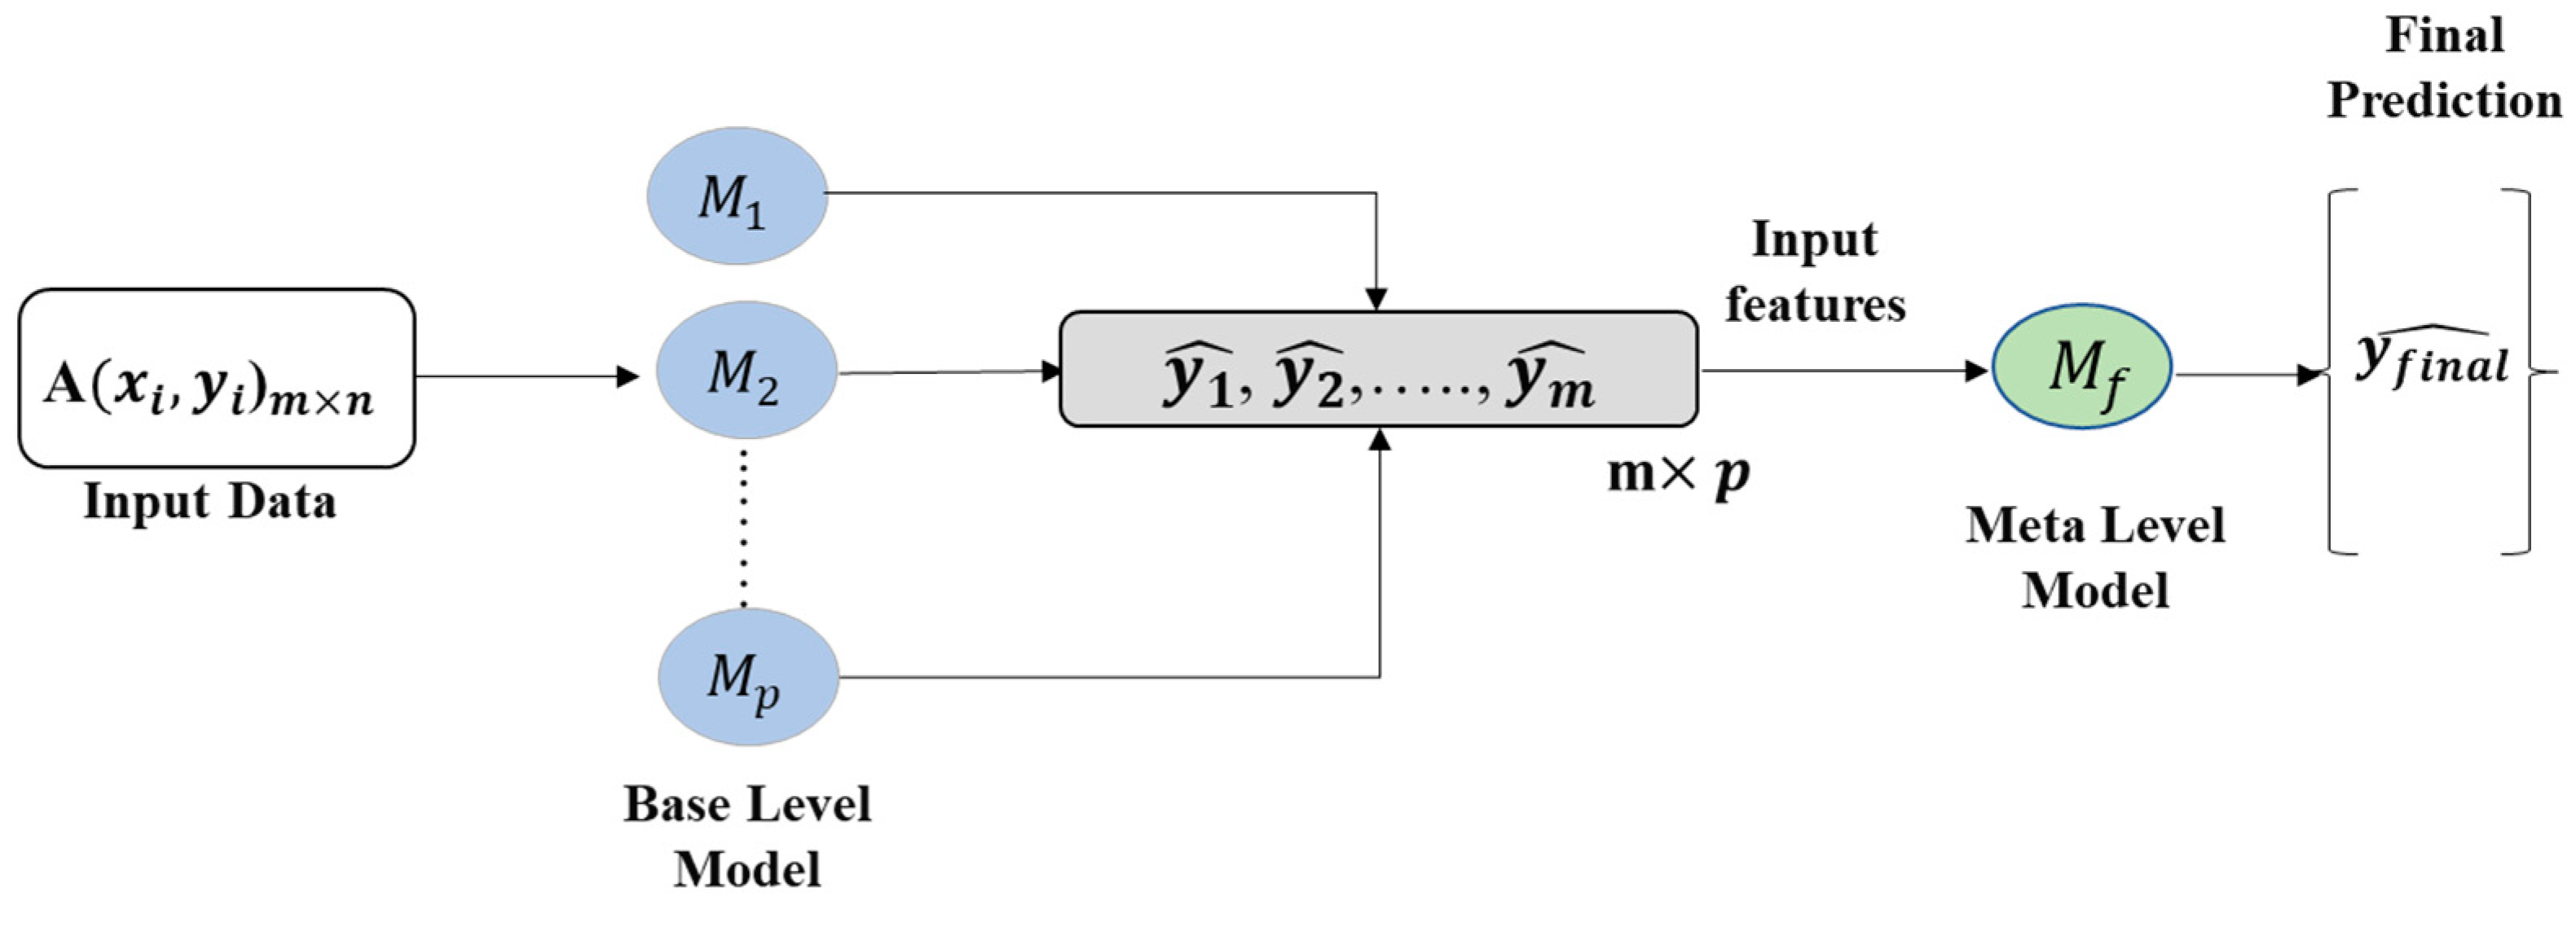
3.4. Stacked Model
| Algorithm 1. The algorithm used for developing the stacked model |
| Input: training data
Output: a stacking regressor 1: Step 1: perform the training of the base-level regressors 2: for t = 1 to T do 3: Train based on database of A 4: end for 5: Step 2: design new database of predictions 6: for i = 1 to m do 7: , where 8: end for 9: Step 3: perform the training of the meta-regressor 10: perform the training of based on 11: return |
3.5. Performance Analysis
4. Results and Discussion
4.1. Developing Base Machine Models
4.2. Designing the Stacked Model
4.3. Comparison with the Other Modeling Scenarios
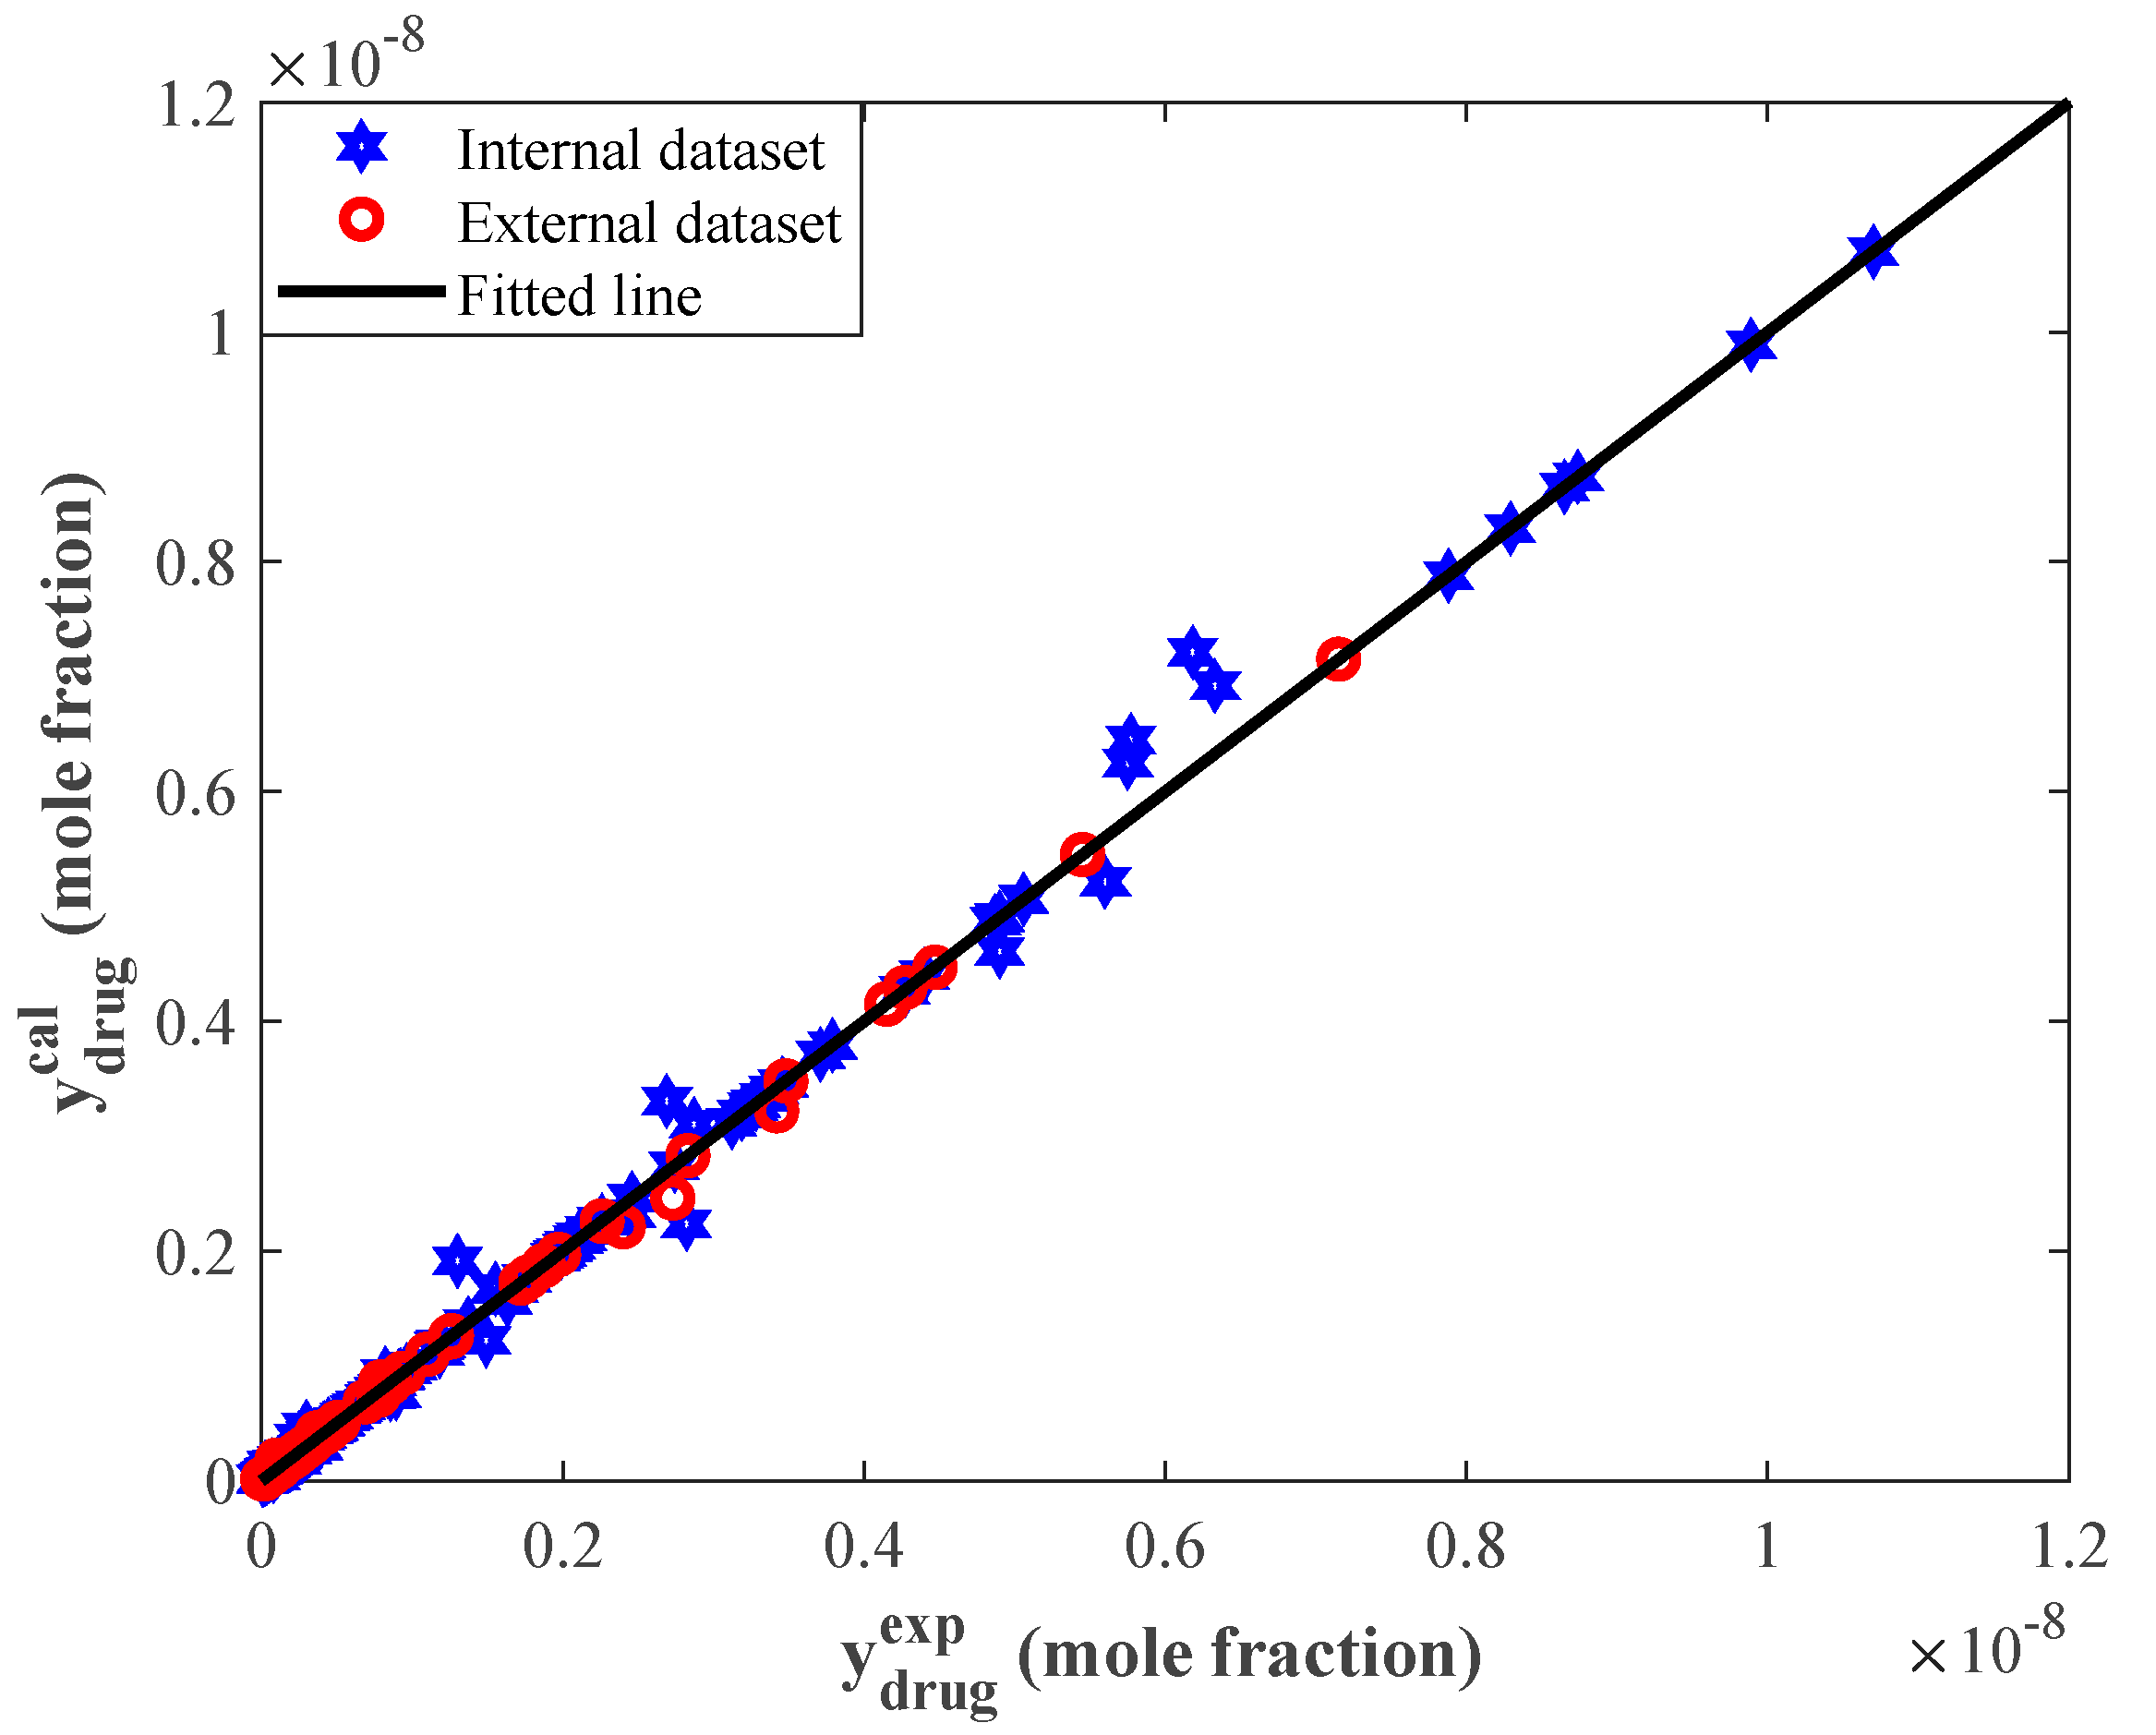
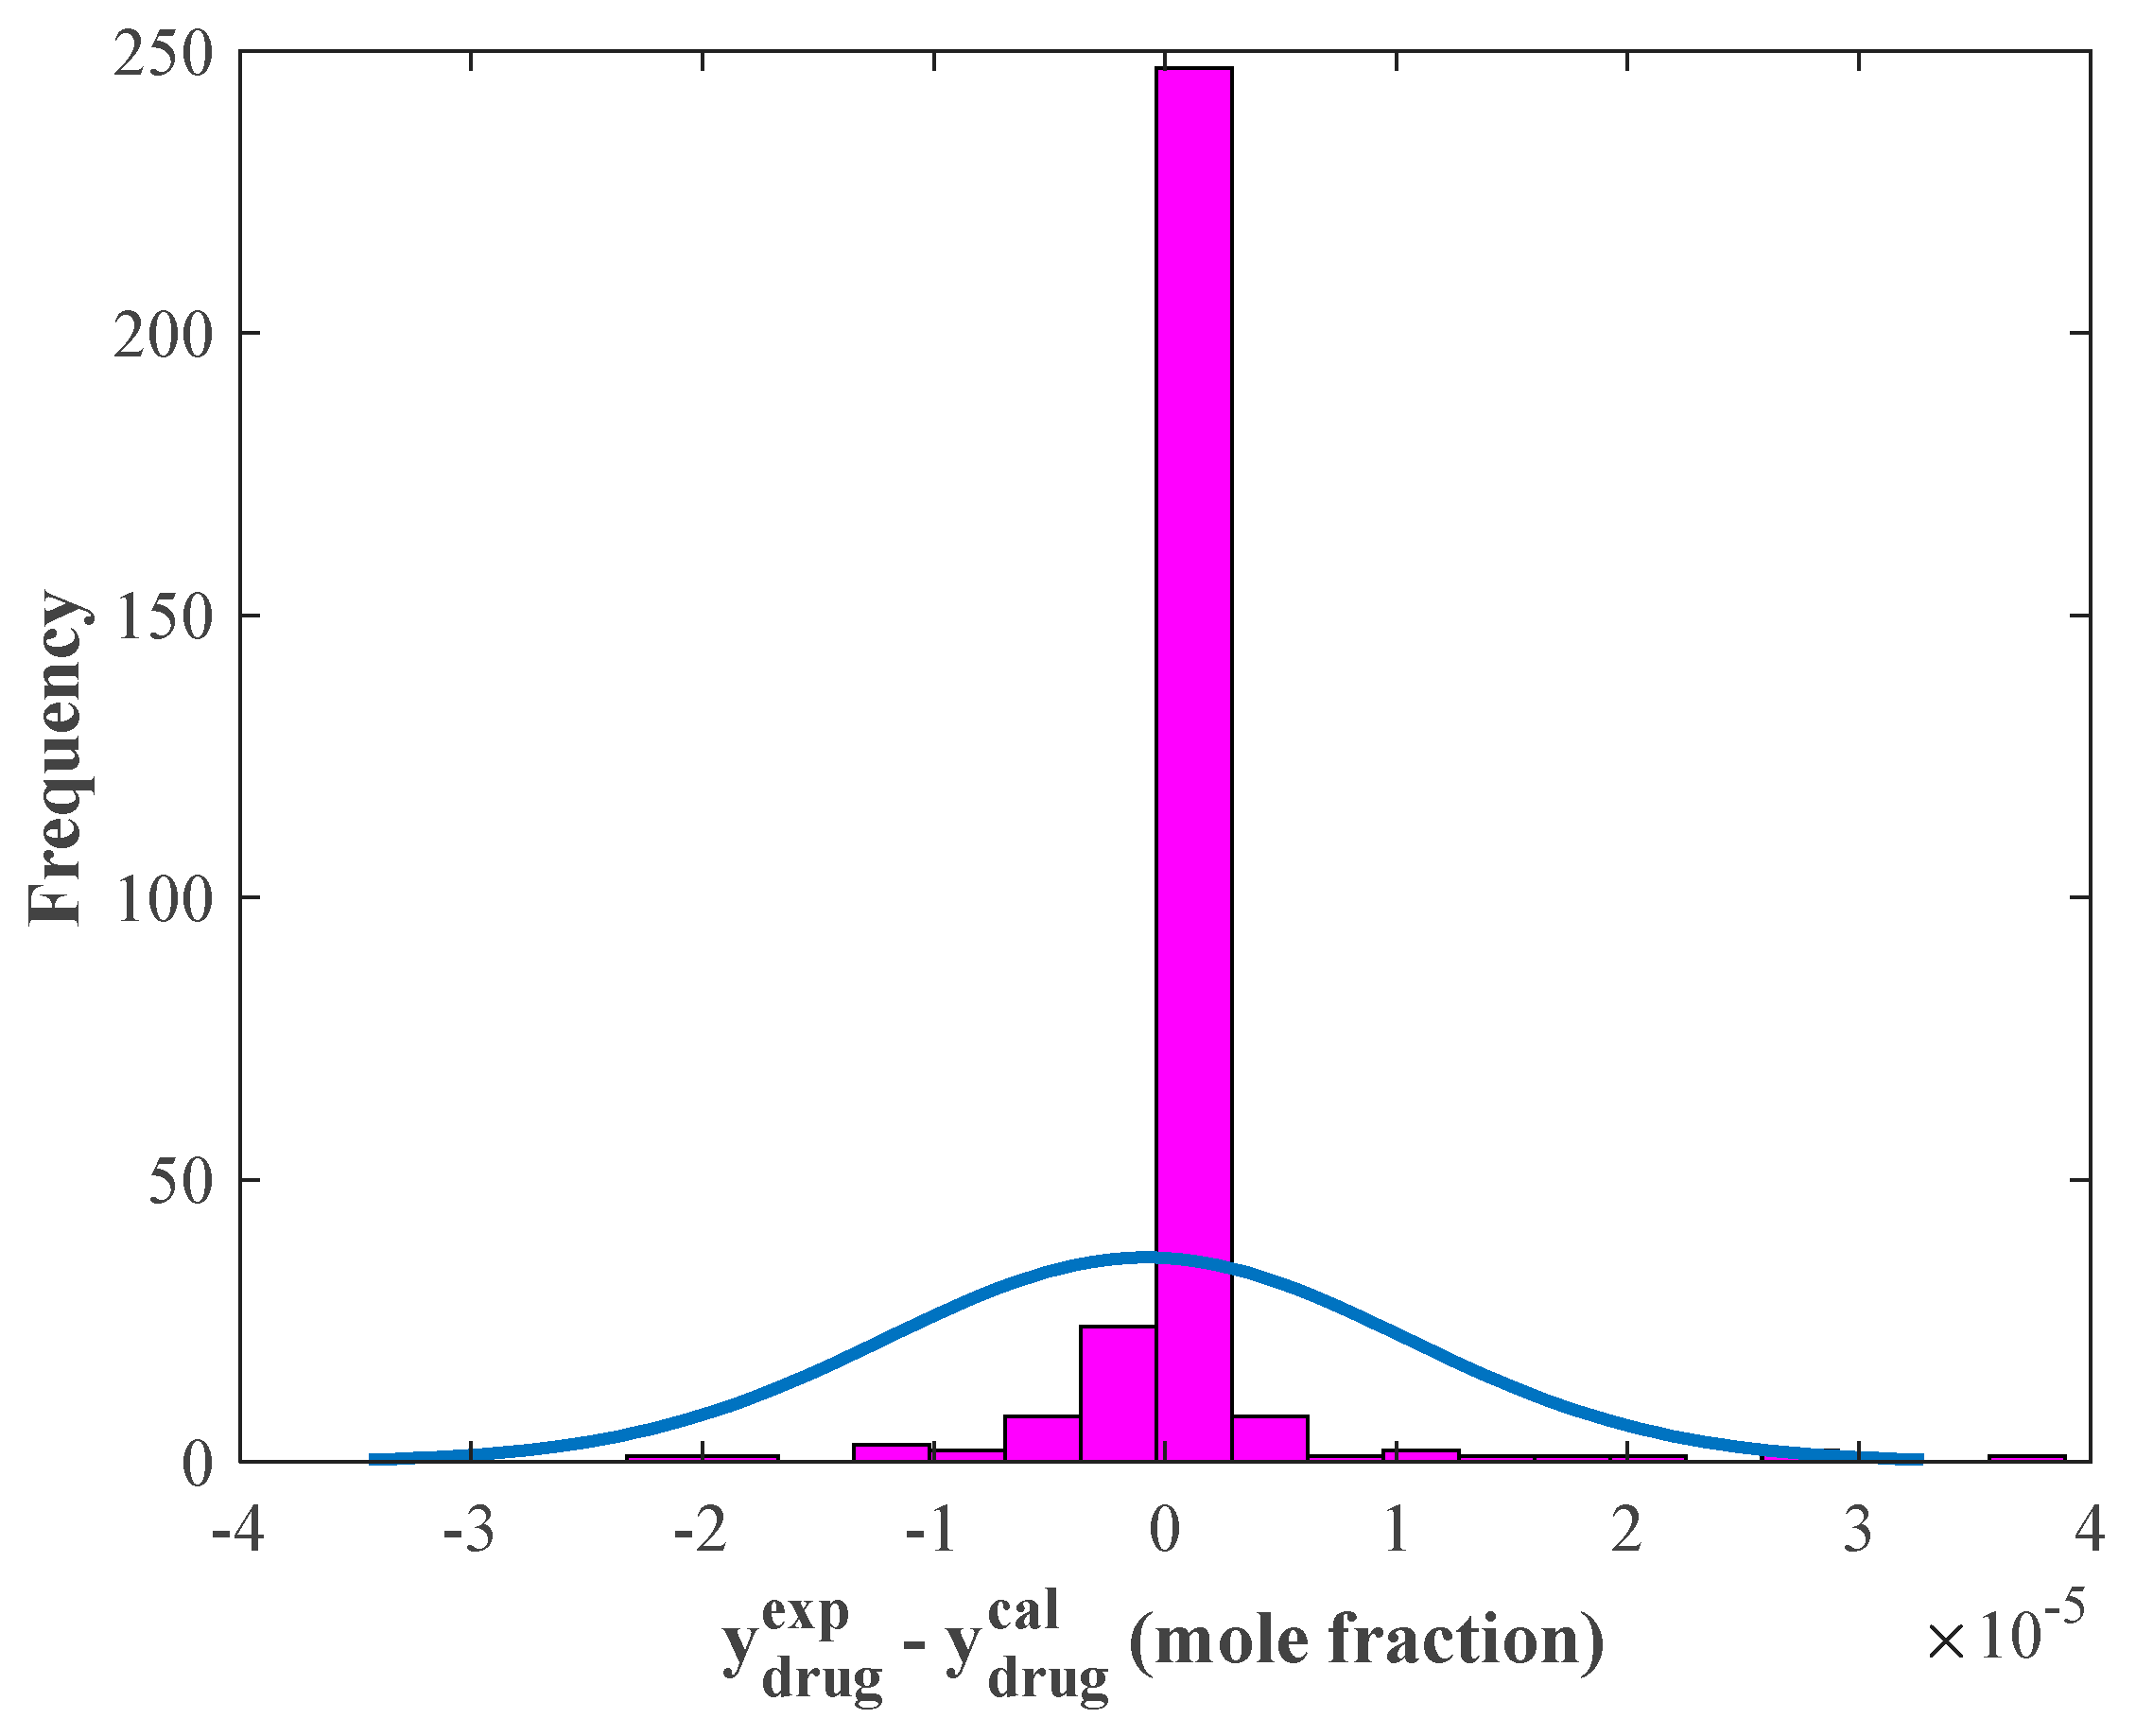
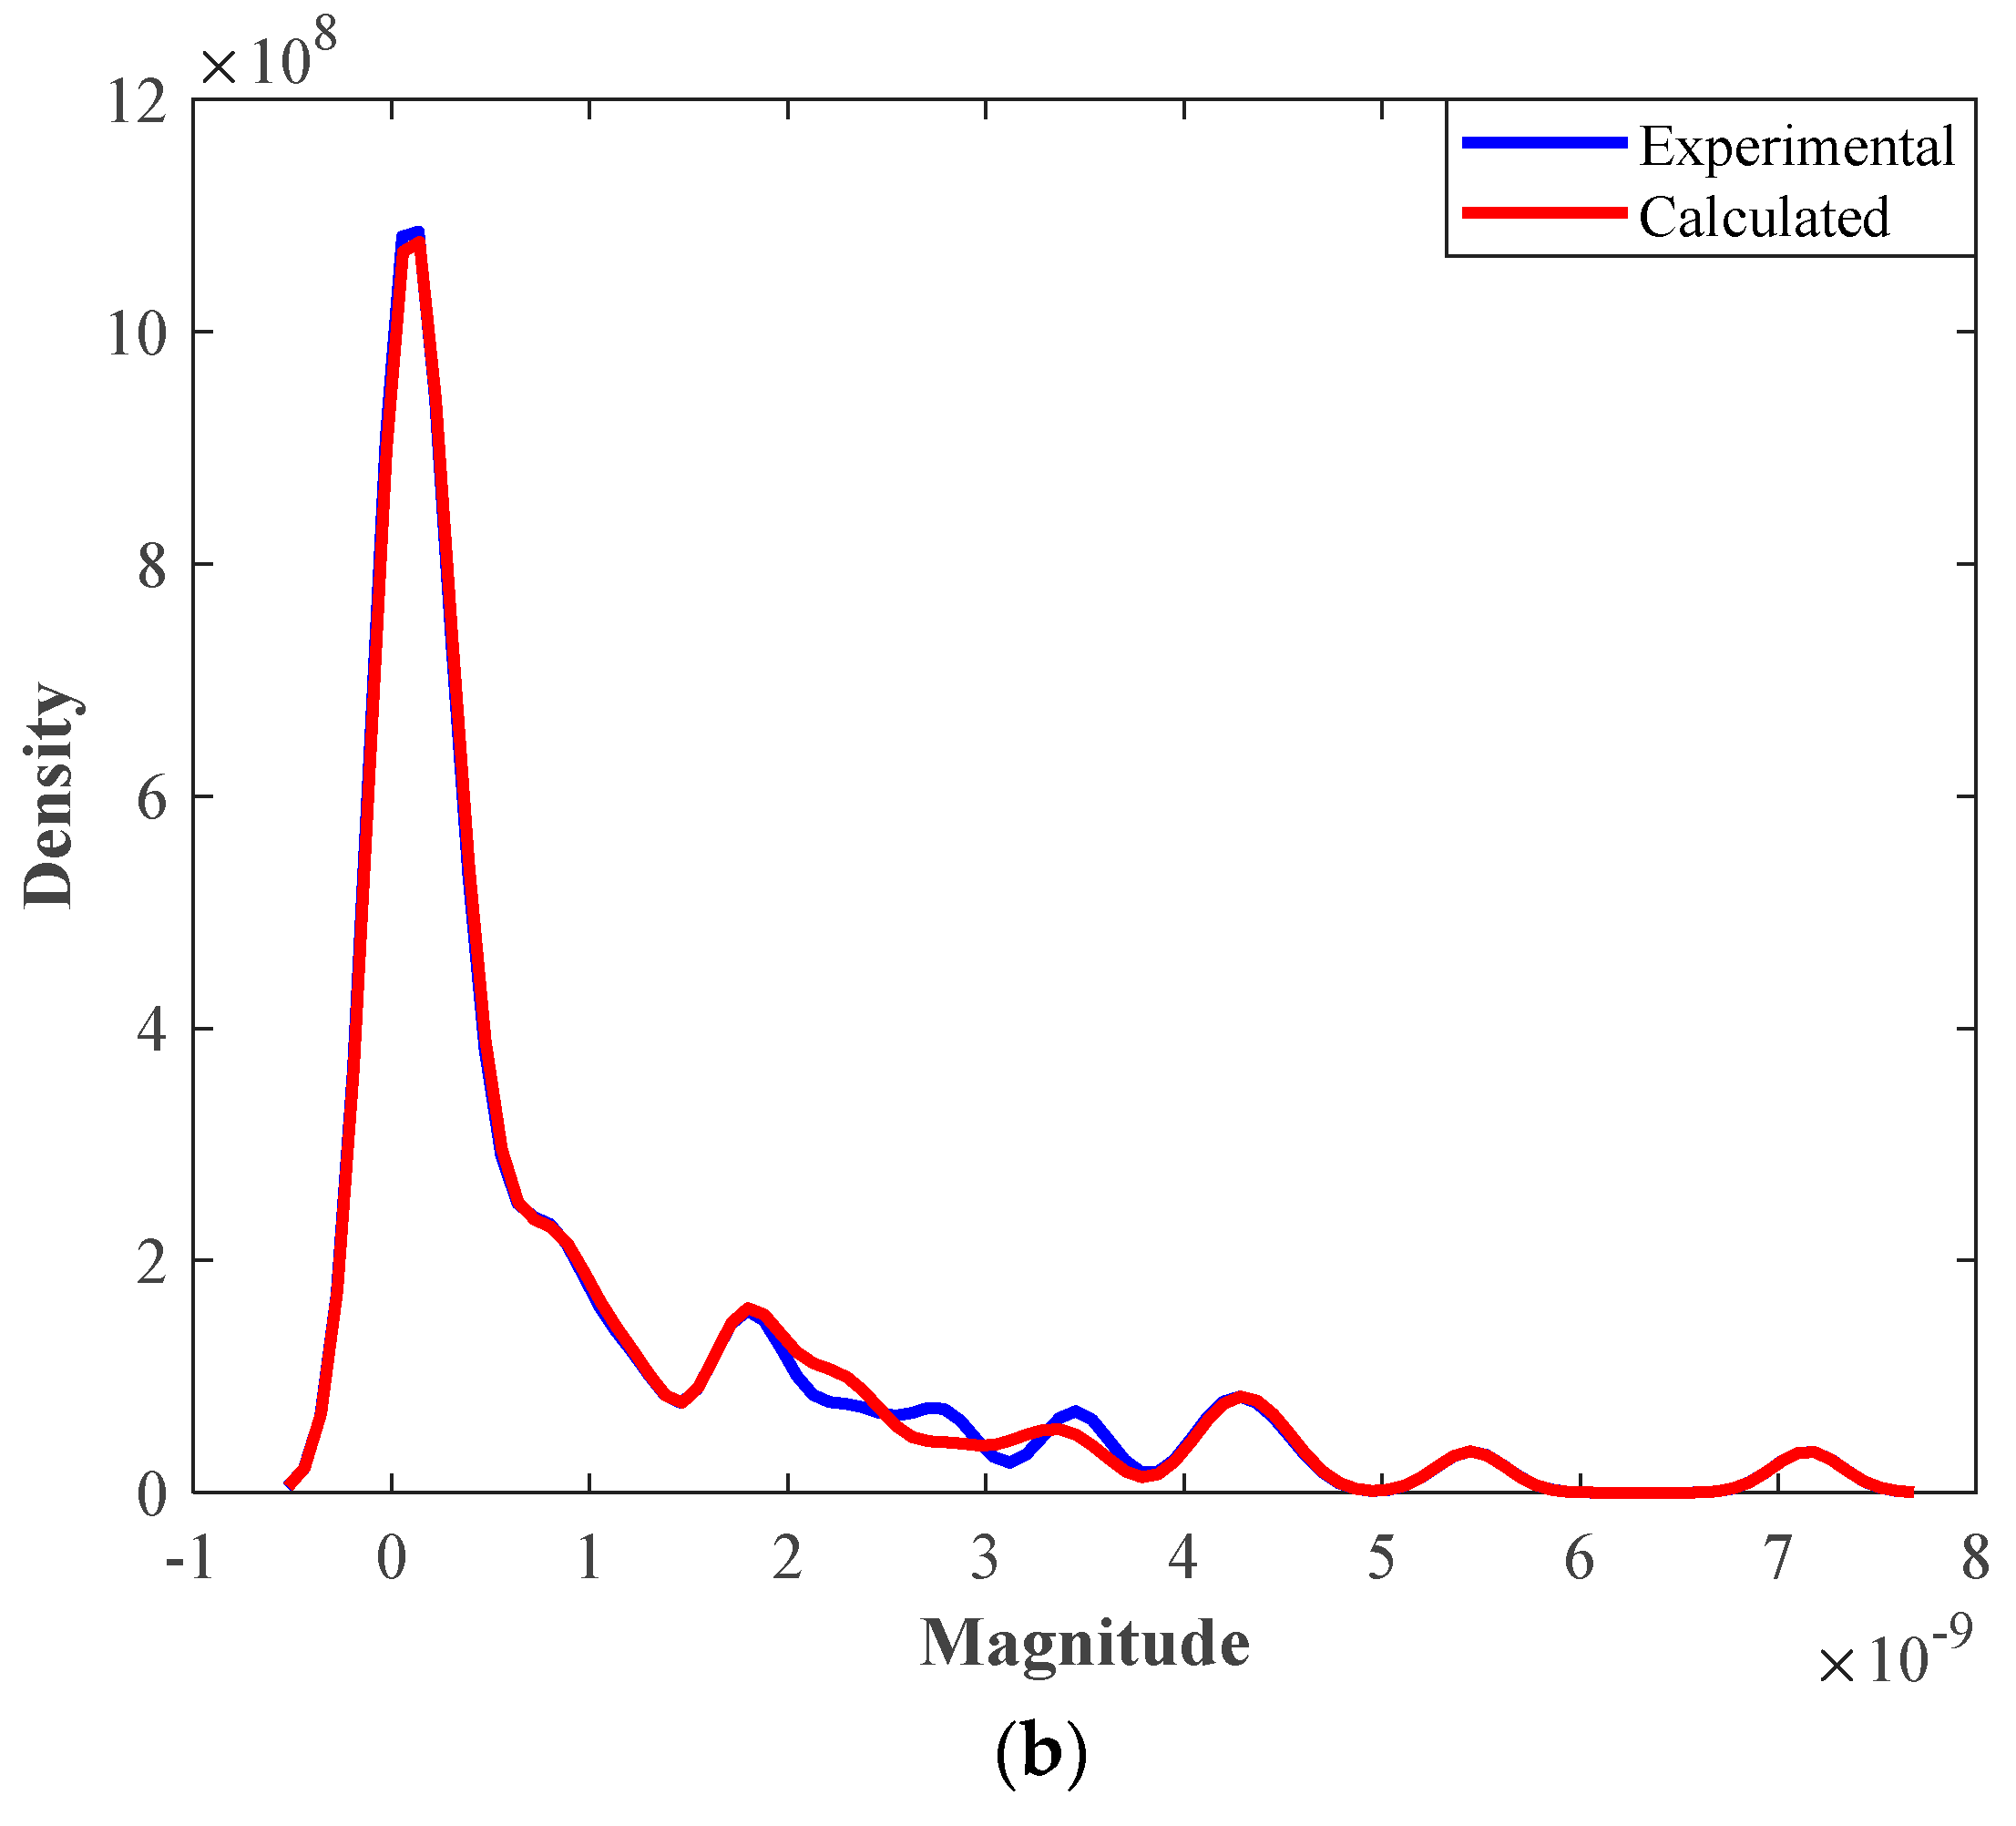
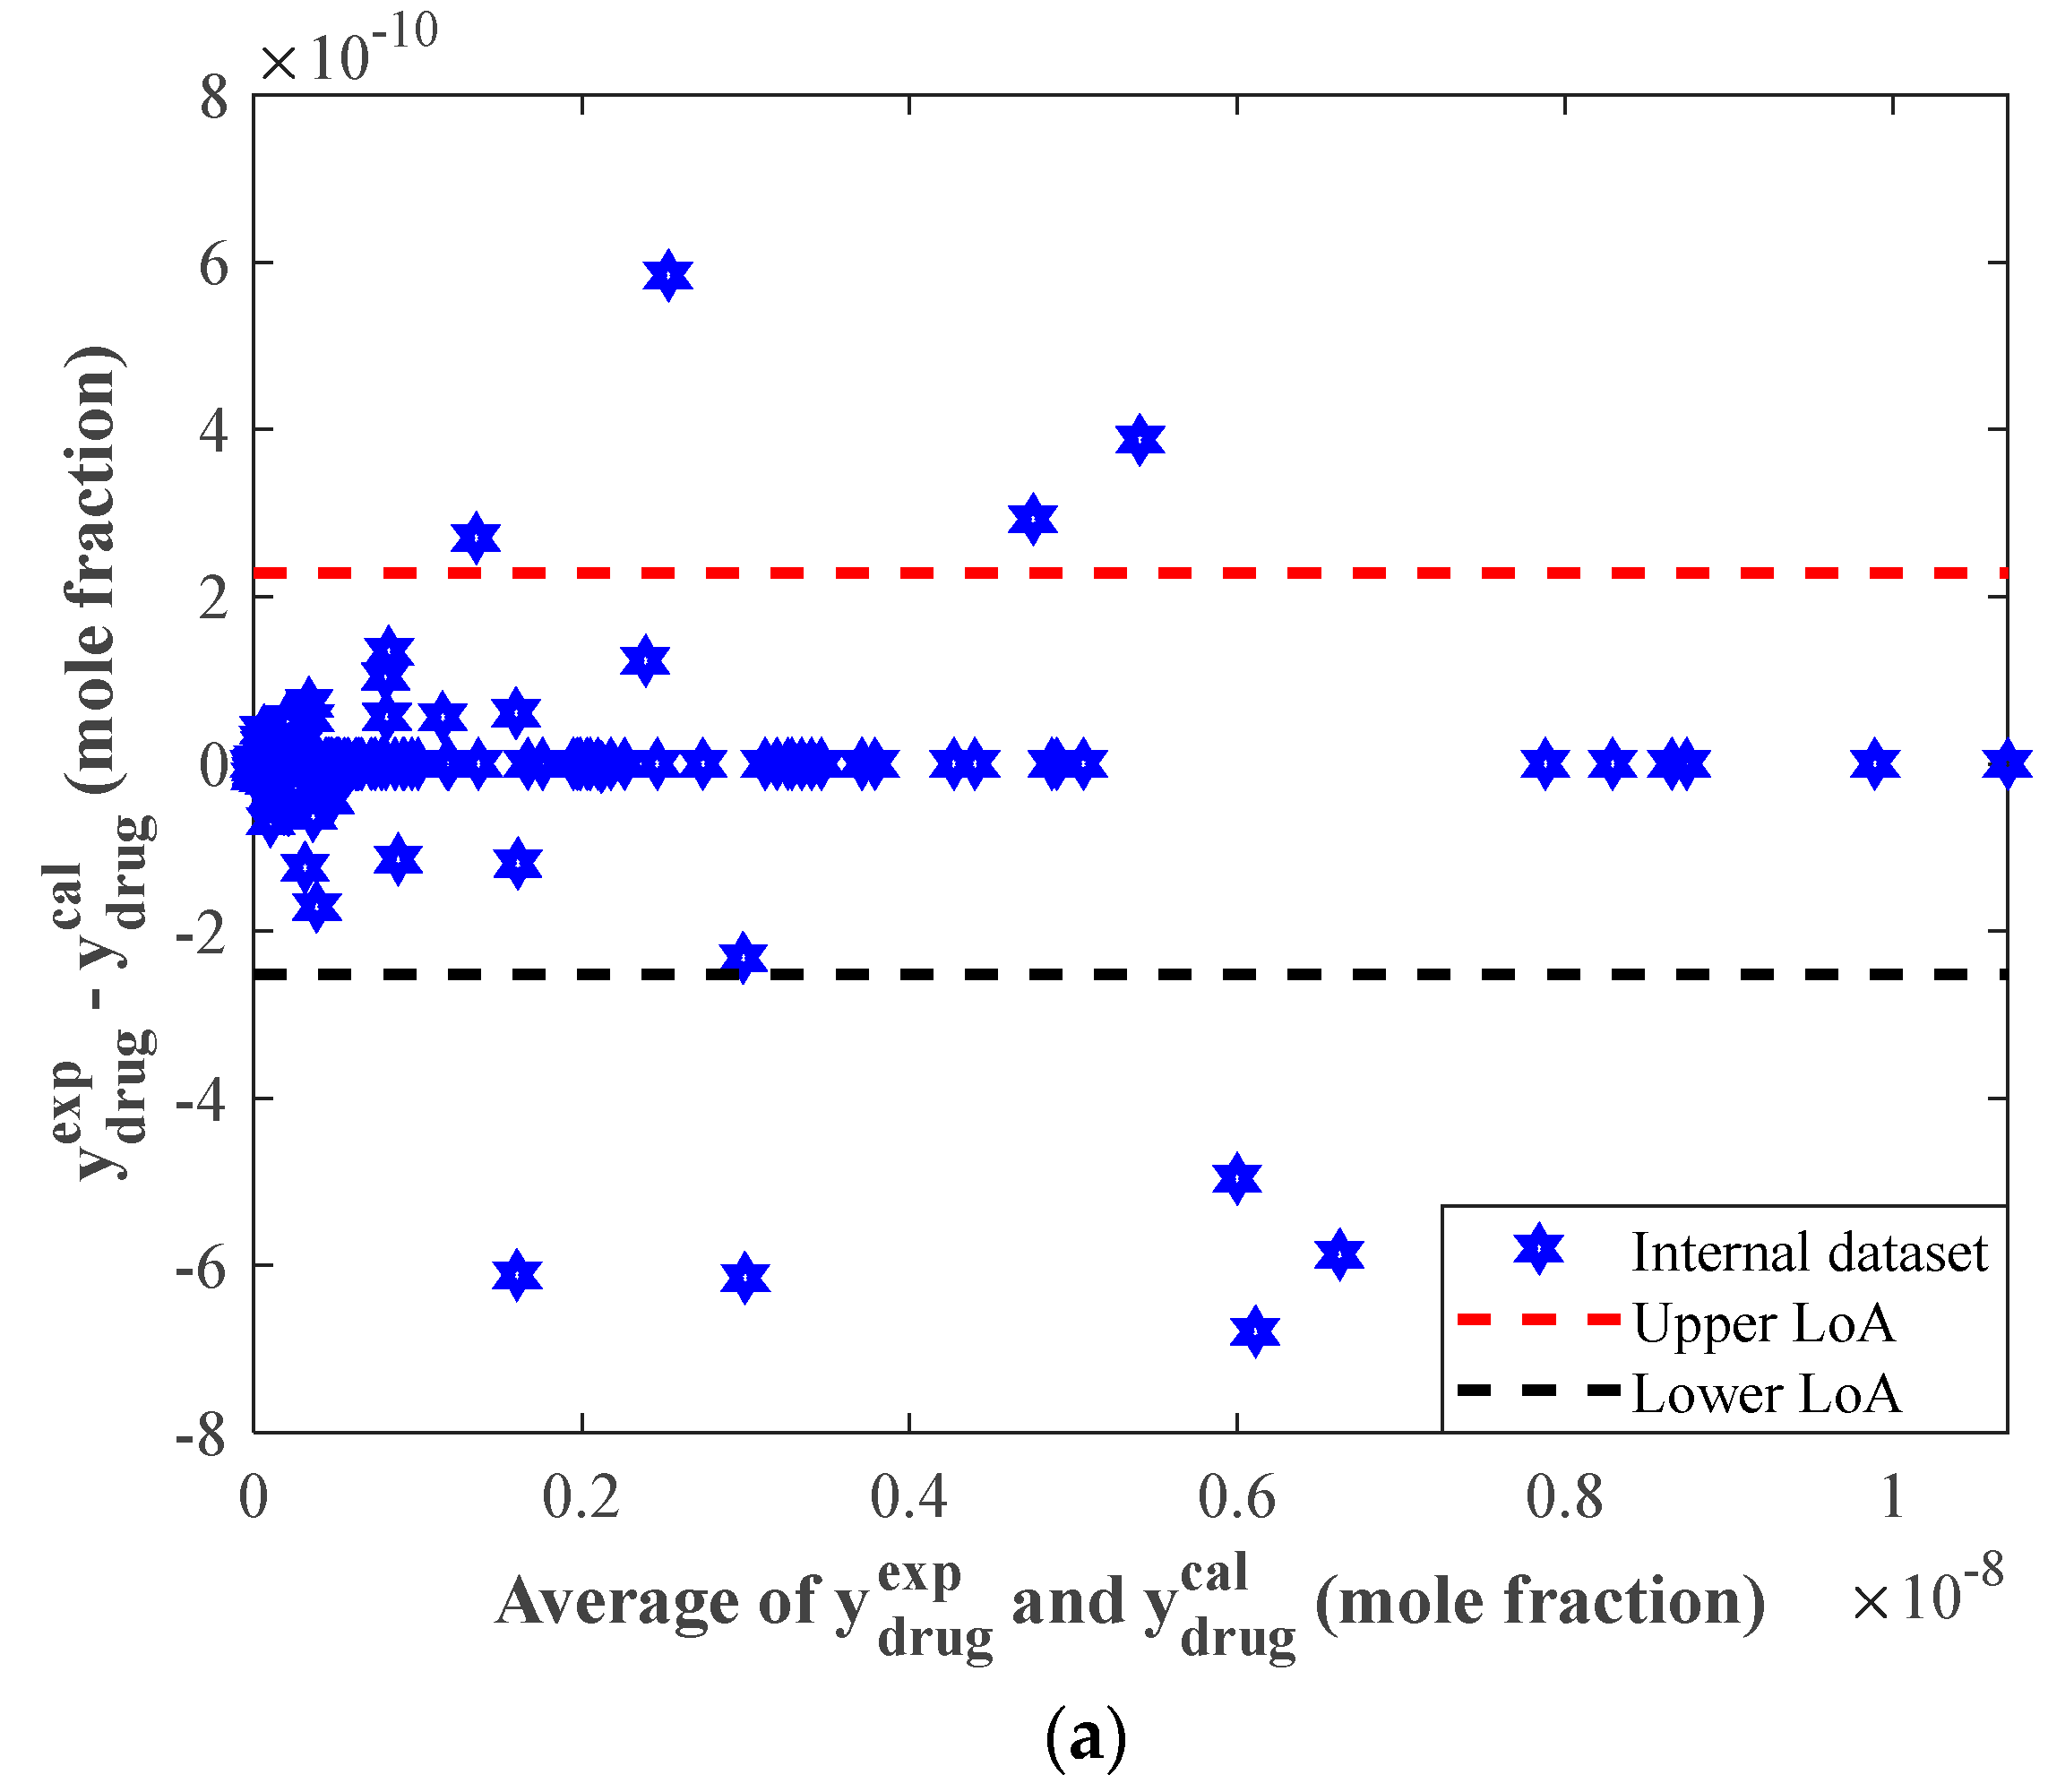
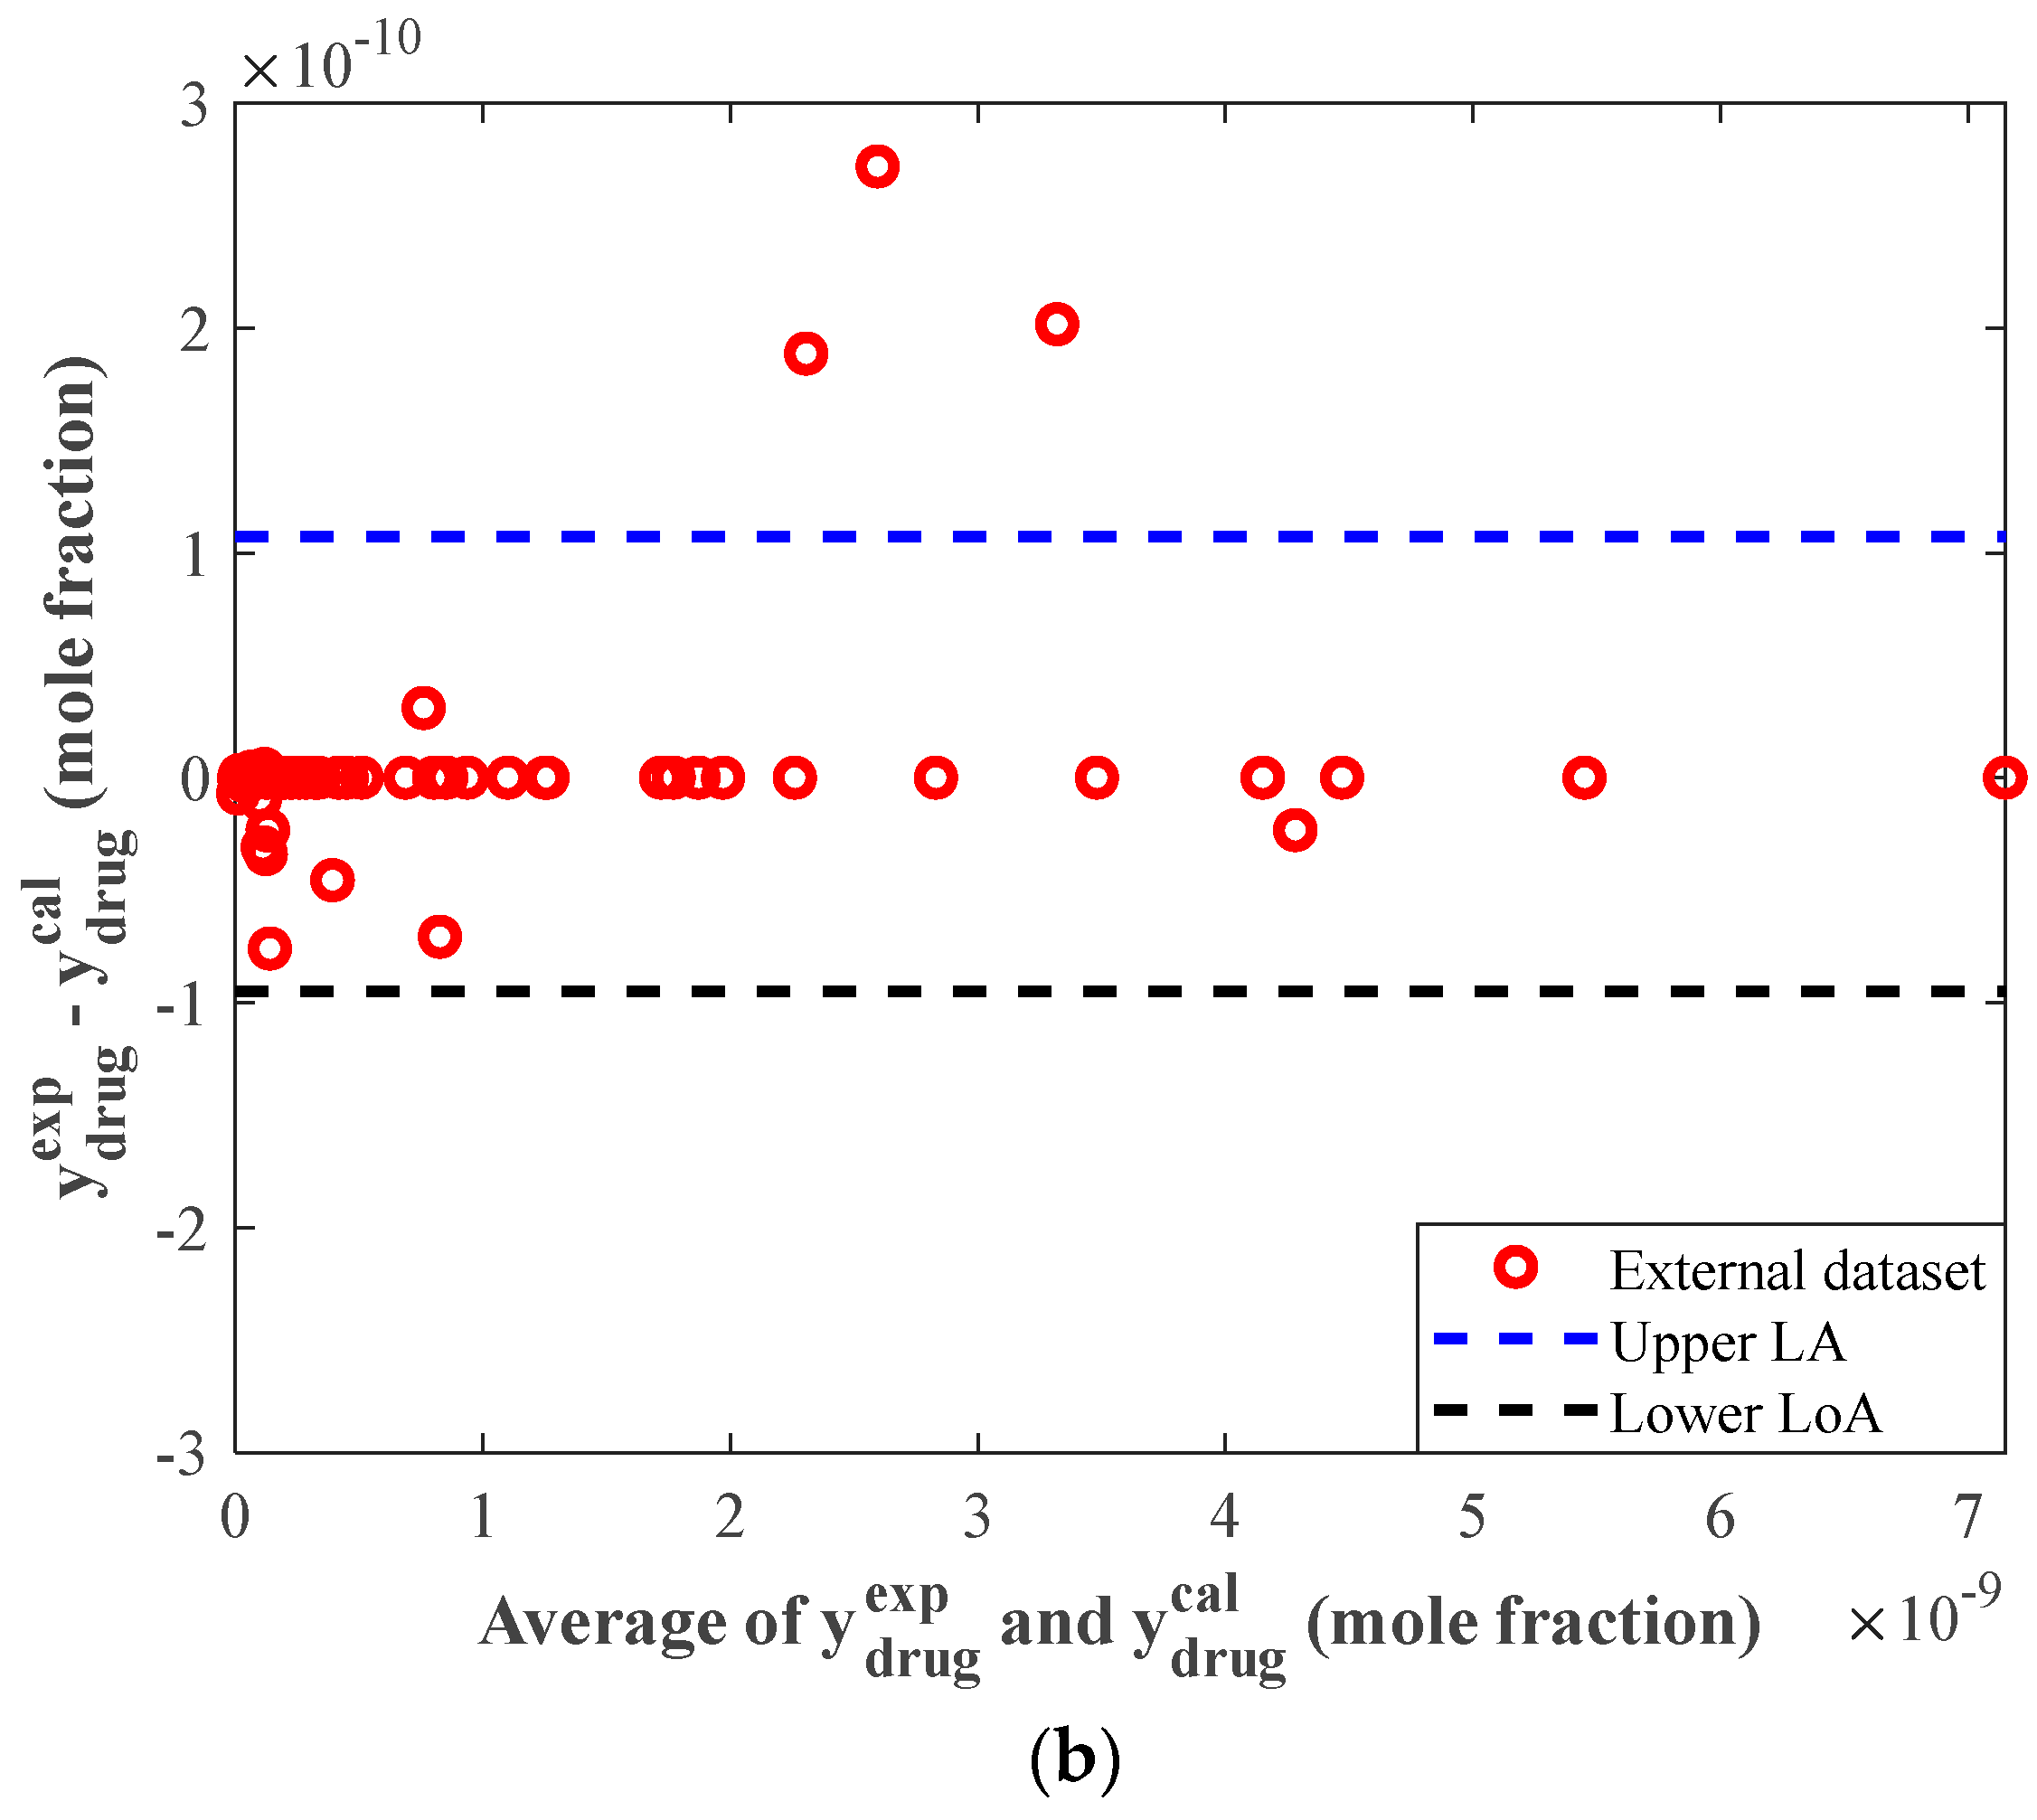
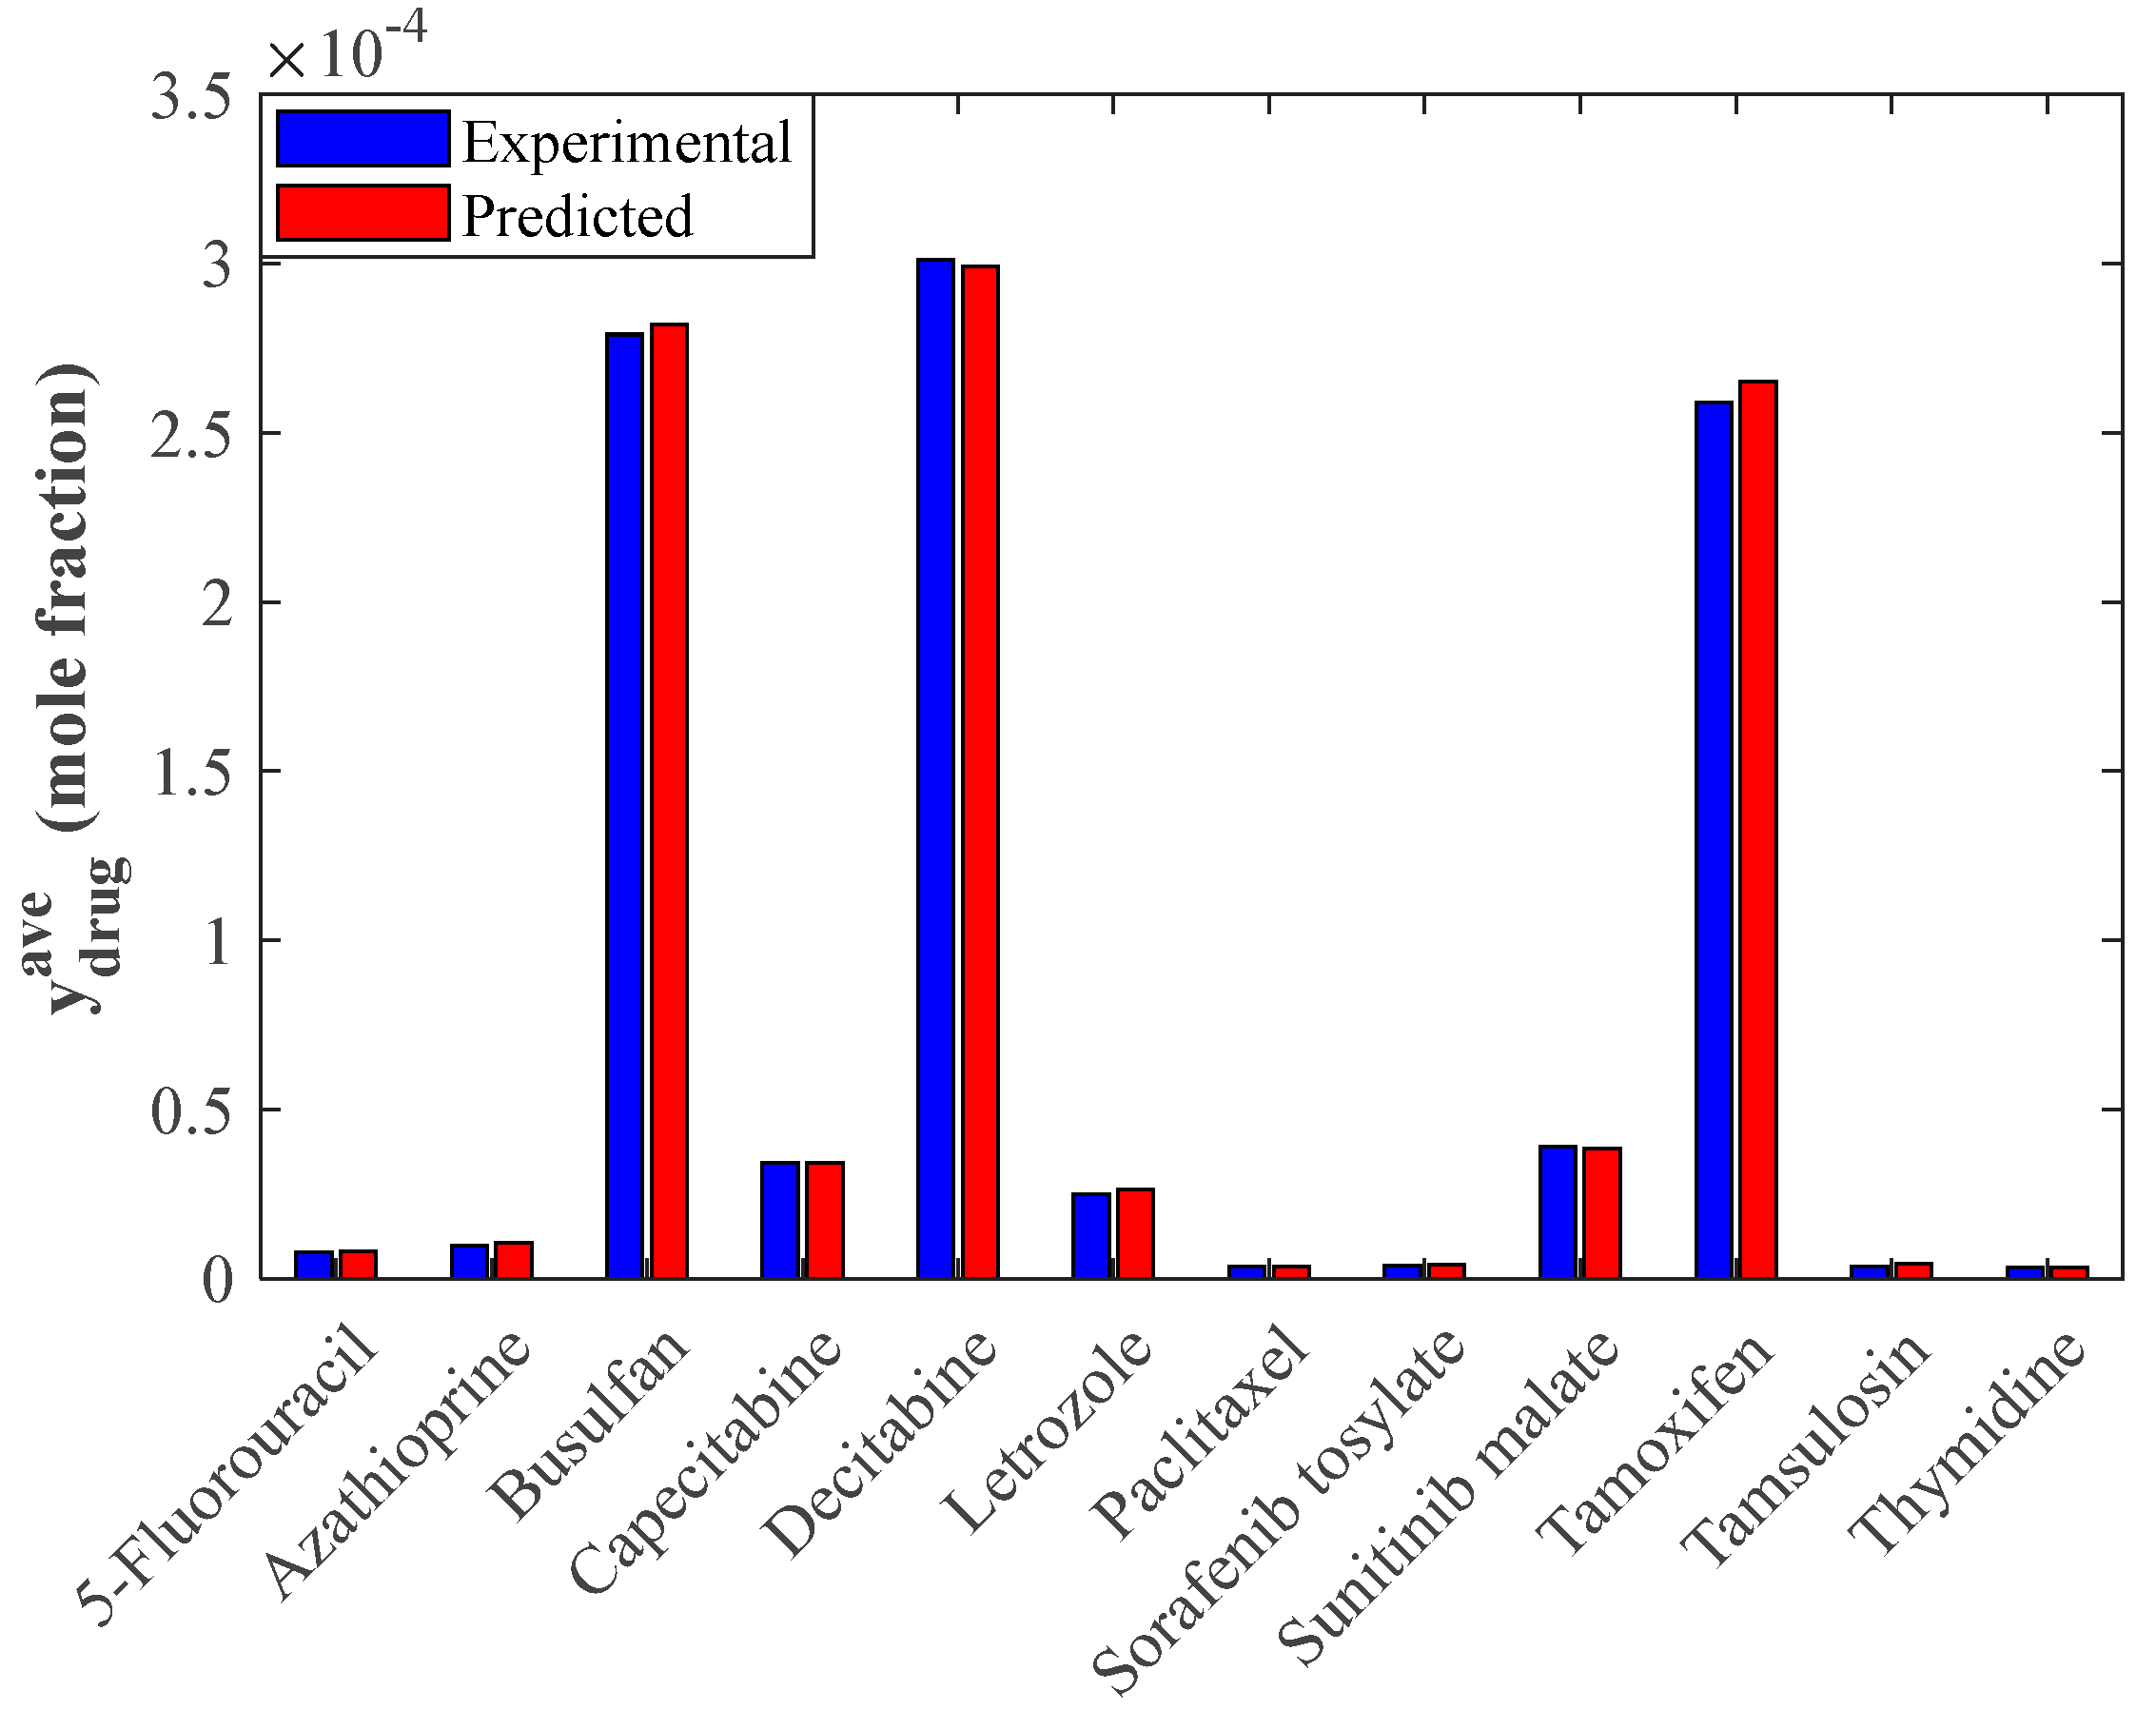
4.4. Evaluating the Performance of the Stacked Model Using Graphical Analyses
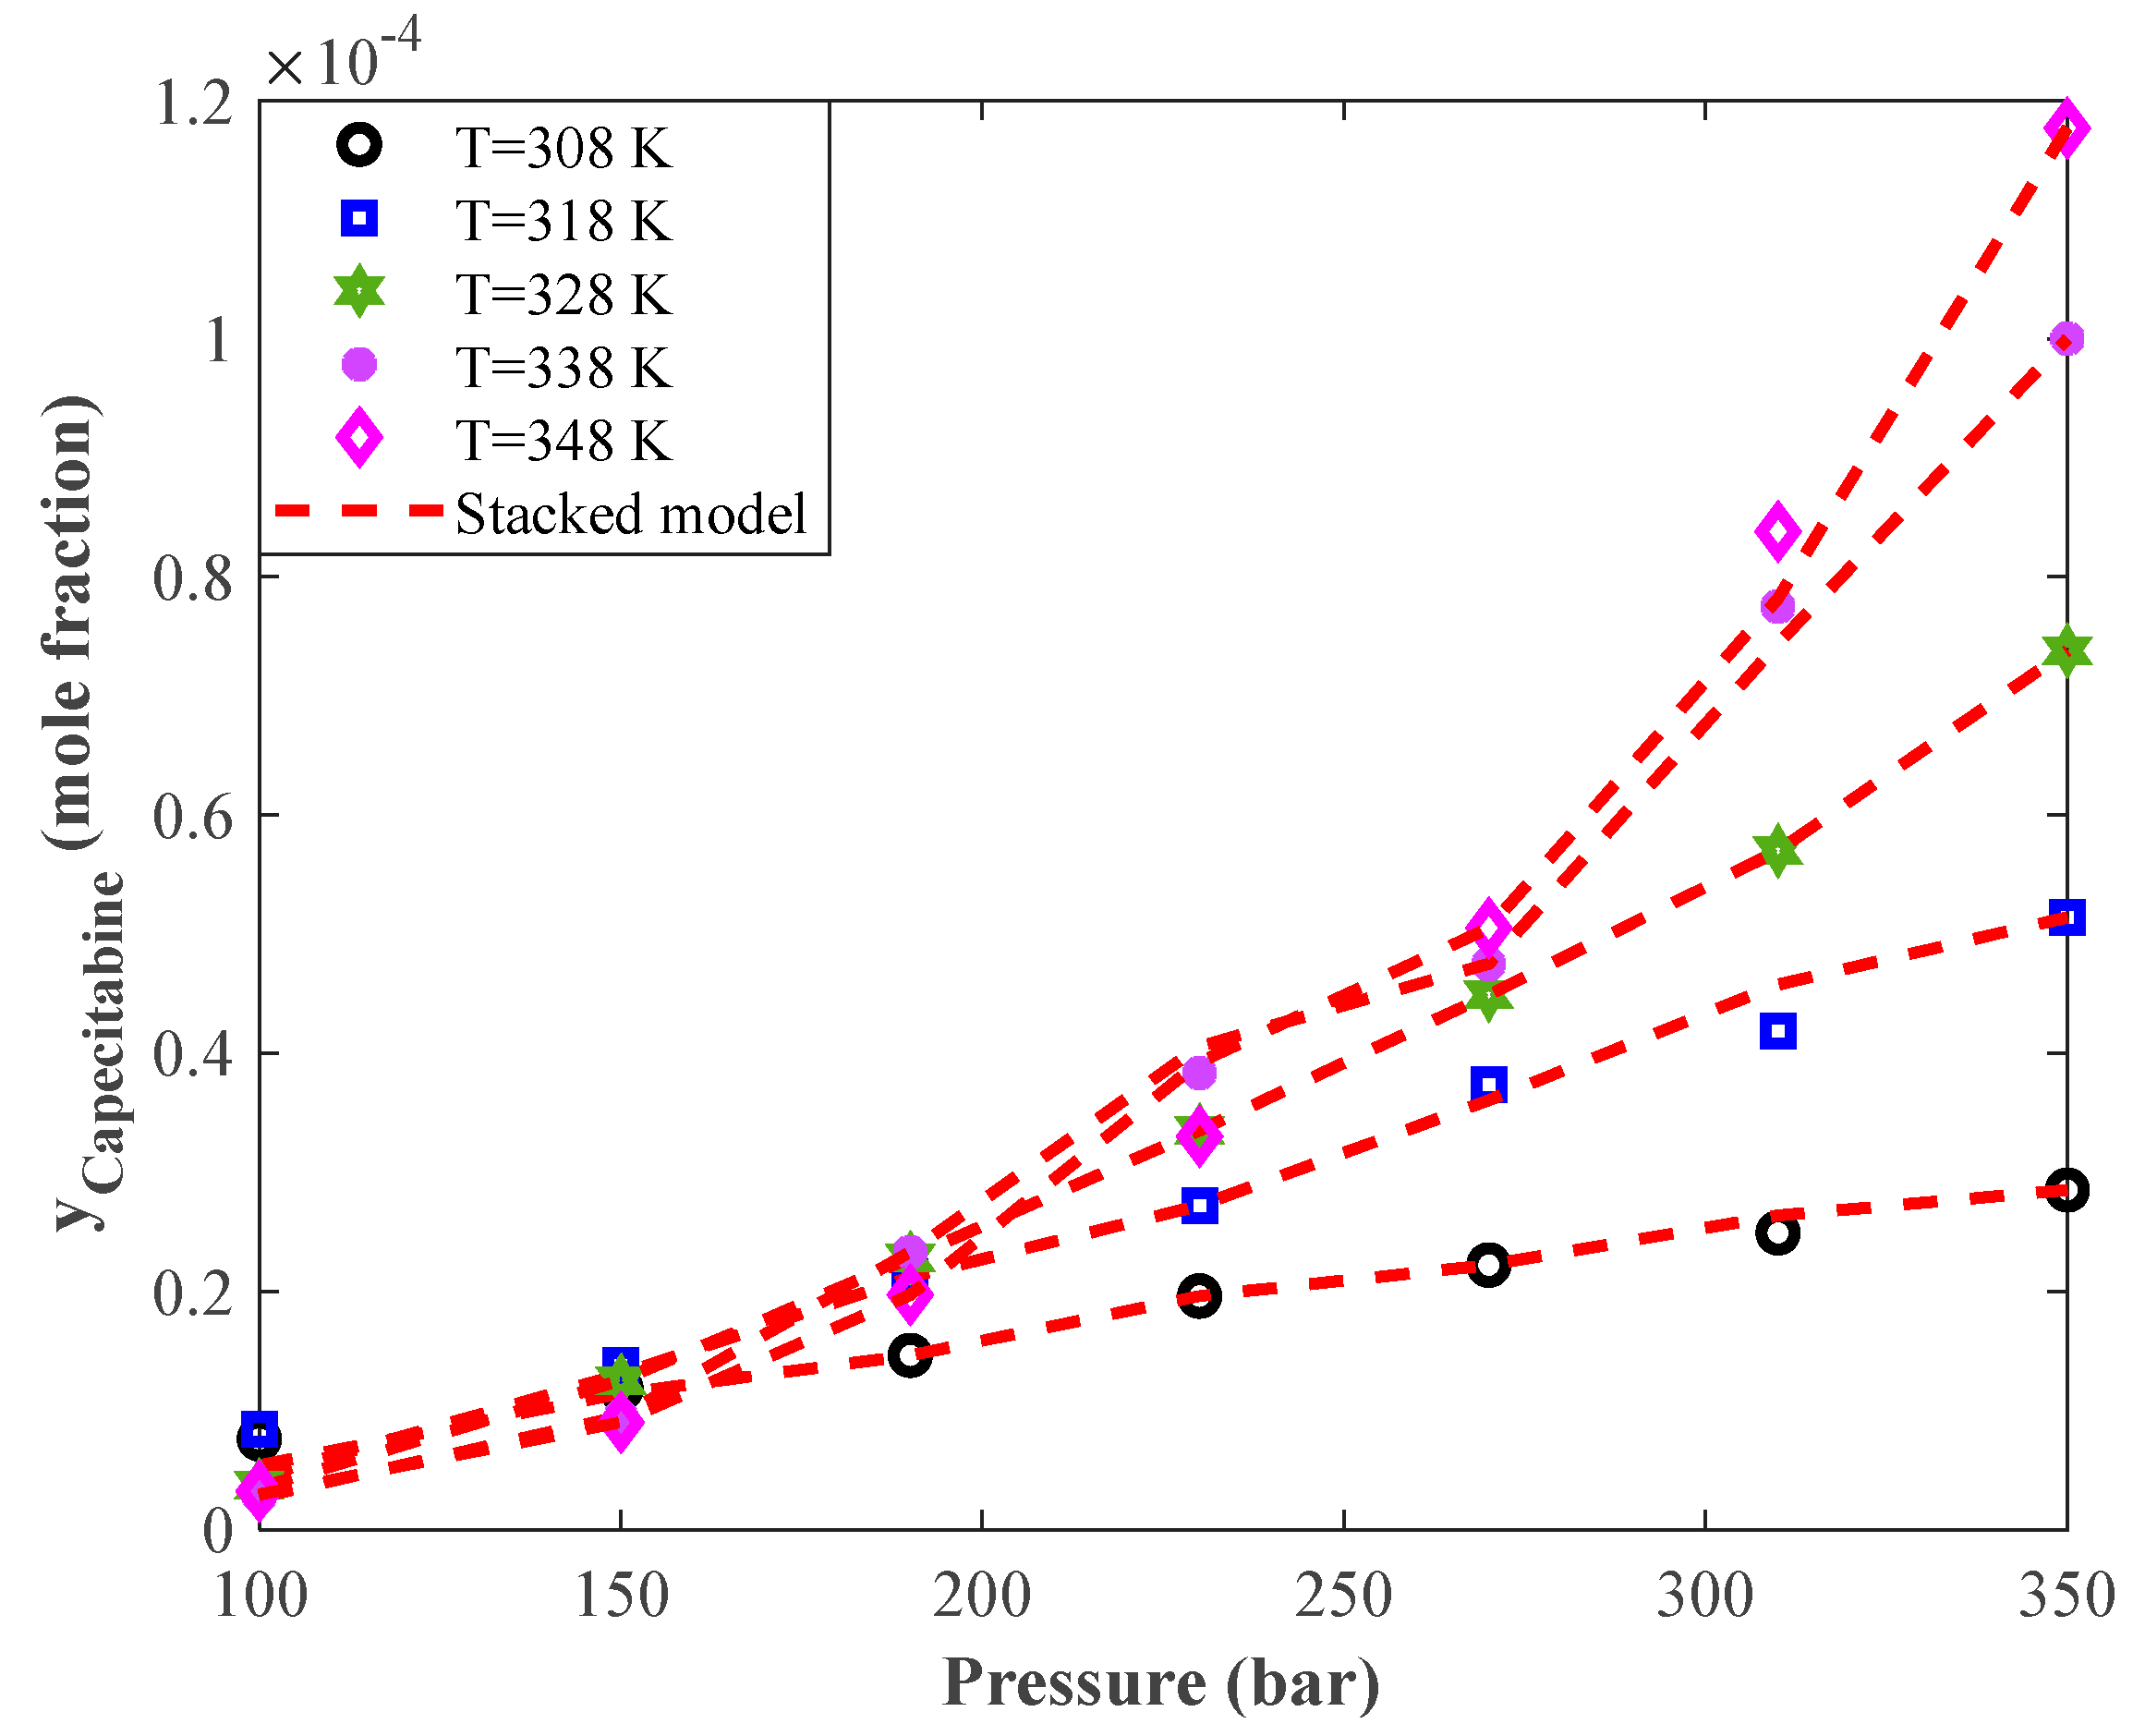
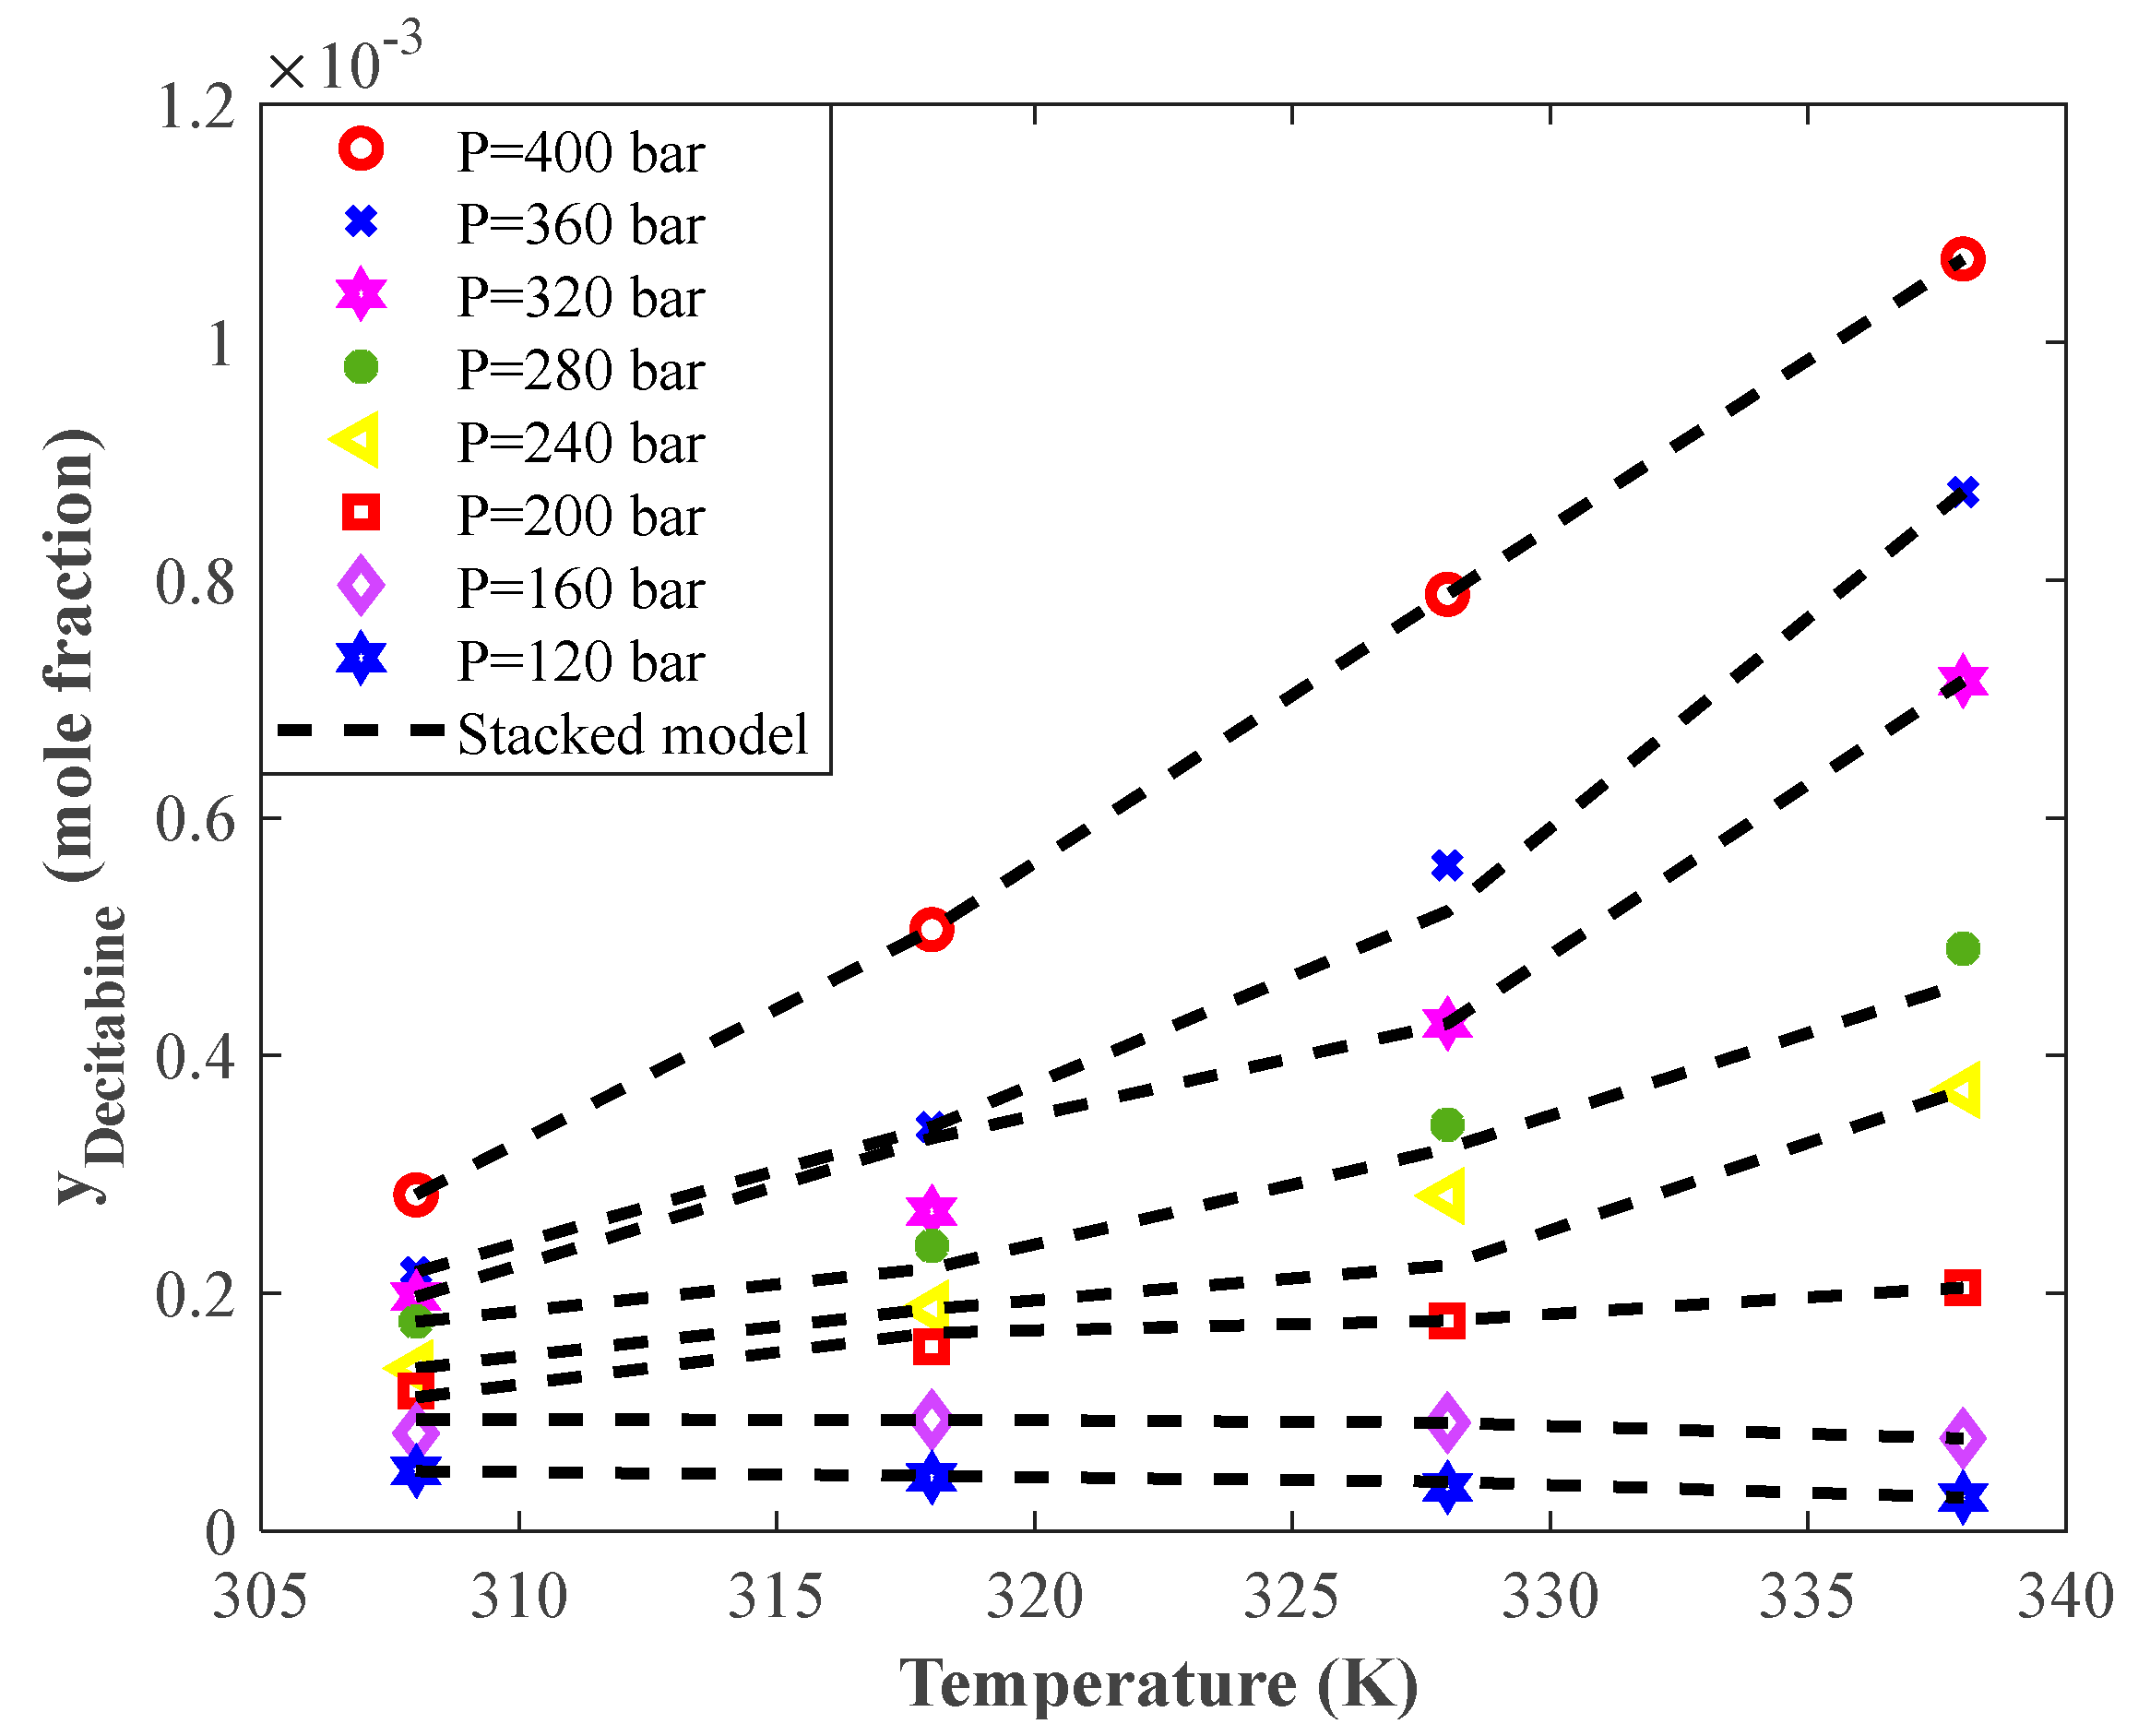
4.5. Trend Analyses
4.6. Importance of Independent Variables
5. Conclusions
Author Contributions
Funding
Institutional Review Board Statement
Informed Consent Statement
Data Availability Statement
Conflicts of Interest
References
- Ahuja, N.; Katare, O.P.; Singh, B. Studies on dissolution enhancement and mathematical modeling of drug release of a poorly water-soluble drug using water-soluble carriers. Eur. J. Pharm. Biopharm. 2007, 65, 26–38. [Google Scholar] [CrossRef] [PubMed]
- Saadati Ardestani, N.; Amani, M.; Yeganeh Majd, N. Determination of the solubility of anticancer drugs in supercritical carbon dioxide using empirical models and artificial neural network. J. Appl. Res. Chem. Eng. 2022, 5, 15–37. [Google Scholar]
- Tomasovic, S.; Lukac, J.K.; Sremec, J.; Klepac, N.; Draganic, P.; Bielen, I. Epidemiology of pharmacological treatment of multiple sclerosis in Croatia. Psychiatr. Danub. 2021, 33, 204–208. [Google Scholar] [PubMed]
- Omeragic, I.; Hasanovic, M. Efficacy of emdr treatment in generalized anxiety disorder after a long-standing pharmacological treatment—A case report. Psychiatr. Danub. 2021, 33, S77–S82. [Google Scholar]
- Kalikin, N.N.; Kurskaya, M.V.; Ivlev, D.V.; Krestyaninov, M.A.; Oparin, R.D.; Kolesnikov, A.L.; Budkov, Y.A.; Idrissi, A.; Kiselev, M.G. Carbamazepine solubility in supercritical CO2: A comprehensive study. J. Mol. Liq. 2020, 311, 113104. [Google Scholar] [CrossRef]
- Lai, W.F.; Tang, R.; Wong, W.T. Ionically crosslinked complex gels loaded with oleic acid-containing vesicles for transdermal drug delivery. Pharmaceutics 2020, 12, 725. [Google Scholar] [CrossRef]
- Lai, W.F.; Gui, D.; Wong, M.; Döring, A.; Rogach, A.L.; He, T.; Wong, W.T. A self-indicating cellulose-based gel with tunable performance for bioactive agent delivery. J. Drug Deliv. Sci. Technol. 2021, 63, 102428. [Google Scholar] [CrossRef]
- Khallaghi, N.; Hanak, D.P.; Manovic, V. Gas-fired chemical looping combustion with supercritical CO2 cycle. Appl. Energy 2019, 249, 237–244. [Google Scholar] [CrossRef]
- Amar, M.N.; Zeraibi, N. Application of hybrid support vector regression artificial bee colony for prediction of MMP in CO2-EOR process. Petroleum 2020, 6, 415–422. [Google Scholar] [CrossRef]
- Mi, H.Y.; Jing, X.; Liu, Y.; Li, L.; Li, H.; Peng, X.F.; Zhou, H. Highly durable superhydrophobic polymer foams fabricated by extrusion and supercritical CO2 foaming for selective oil absorption. ACS Appl. Mater. Interfaces 2019, 11, 7479–7487. [Google Scholar] [CrossRef]
- Li, M.J.; Zhu, H.H.; Guo, J.Q.; Wang, K.; Tao, W.Q. The development technology and applications of supercritical CO2 power cycle in nuclear energy, solar energy and other energy industries. Appl. Therm. Eng. 2017, 126, 255–275. [Google Scholar] [CrossRef]
- Wang, W.; Rao, L.; Wu, X.; Wang, Y.; Zhao, L.; Liao, X. Supercritical Carbon Dioxide Applications in Food Processing. Food Eng. Rev. 2021, 13, 570–591. [Google Scholar] [CrossRef]
- Rezaei, T.; Nazarpour, V.; Shahini, N.; Bahmani, S.; Shahkar, A.; Abdihaji, M.; Ahmadi, S.; Shahdost, F.T. A universal methodology for reliable predicting the non-steroidal anti-inflammatory drug solubility in supercritical carbon dioxide. Sci. Rep. 2022, 12, 1043. [Google Scholar] [CrossRef] [PubMed]
- Tsai, W.C.; Wang, Y. Progress of supercritical fluid technology in polymerization and its applications in biomedical engineering. Prog. Polym. Sci. 2019, 98, 101161. [Google Scholar] [CrossRef]
- Hojjati, M.; Yamini, Y.; Khajeh, M.; Vatanara, A. Solubility of some statin drugs in supercritical carbon dioxide and representing the solute solubility data with several density-based correlations. J. Supercrit. Fluids 2007, 41, 187–194. [Google Scholar] [CrossRef]
- Cao, Y.; Khan, A.; Zabihi, S.; Albadarin, A.B. Neural simulation and experimental investigation of Chloroquine solubility in supercritical solvent. J. Mol. Liq. 2021, 333, 115942. [Google Scholar] [CrossRef]
- Chen, L.; Huang, Y.; Yu, X.; Lu, J.; Jia, W.; Song, J.; Liu, L.; Wang, Y.; Huang, Y.; Xie, J.; et al. Corynoxine protects dopaminergic neurons through inducing autophagy and diminishing neuroinflammation in rotenone-induced animal models of Parkinson’s disease. Front. Pharmacol. 2021, 12, 642900. [Google Scholar] [CrossRef]
- Yamini, Y.; Moradi, M. Measurement and correlation of antifungal drugs solubility in pure supercritical CO2 using semiempirical models. J. Chem. Thermodyn. 2011, 43, 1091–1096. [Google Scholar] [CrossRef]
- Wang, S.W.; Chang, S.Y.; Hsieh, C.M. Measurement and modeling of solubility of gliclazide (hypoglycemic drug) and captopril (antihypertension drug) in supercritical carbon dioxide. J. Supercrit. Fluids 2021, 174, 105244. [Google Scholar] [CrossRef]
- Cuadra, I.A.; Cabañas, A.; Cheda, J.A.R.; Pando, C. Polymorphism in the co-crystallization of the anticonvulsant drug carbamazepine and saccharin using supercritical CO2 as an anti-solvent. J. Supercrit. Fluids 2018, 136, 60–69. [Google Scholar] [CrossRef]
- Asiabi, H.; Yamini, Y.; Latifeh, F.; Vatanara, A. Solubilities of four macrolide antibiotics in supercritical carbon dioxide and their correlations using semi-empirical models. J. Supercrit. Fluids 2015, 104, 62–69. [Google Scholar] [CrossRef]
- Esfandiari, N.; Sajadian, S.A. Experimental and modeling investigation of Glibenclamide solubility in supercritical carbon dioxide. Fluid Phase Equilib. 2022, 556, 113408. [Google Scholar] [CrossRef]
- Sodeifian, G.; Saadati Ardestani, N.; Sajadian, S.A.; Golmohammadi, M.R.; Fazlali, A. Prediction of Solubility of Sodium Valproate in Supercritical Carbon Dioxide: Experimental Study and Thermodynamic Modeling. J. Chem. Eng. Data 2020, 65, 1747–1760. [Google Scholar] [CrossRef]
- Pishnamazi, M.; Zabihi, S.; Jamshidian, S.; Hezaveh, H.Z.; Hezave, A.Z.; Shirazian, S. Measuring solubility of a chemotherapy-anti cancer drug (busulfan) in supercritical carbon dioxide. J. Mol. Liq. 2020, 317, 113954. [Google Scholar] [CrossRef]
- Pavelić, K. Personalized neoantigen vaccine against cancer. Psychiatr. Danub. 2021, 33, 96–100. [Google Scholar] [CrossRef]
- Feng, Y.; Li, F.; Yan, J.; Guo, X.; Wang, F.; Shi, H.; Du, J.; Zhang, H.; Gao, Y.; Li, D.; et al. Pan-cancer analysis and experiments with cell lines reveal that the slightly elevated expression of DLGAP5 is involved in clear cell renal cell carcinoma progression. Life Sci. 2021, 287, 120056. [Google Scholar] [CrossRef] [PubMed]
- Euldji, I.; Si-Moussa, C.; Hamadache, M.; Benkortbi, O. QSPR Modelling of the Solubility of Drug and Drug-like Compounds in Supercritical Carbon Dioxide. In Molecular Informatics; Wiley: Hoboken, NJ, USA, 2022; p. 2200026. [Google Scholar] [CrossRef]
- Hazaveie, S.M.; Sodeifian, G.; Sajadian, S.A. Measurement and thermodynamic modeling of solubility of Tamsulosin drug (anti cancer and anti-prostatic tumor activity) in supercritical carbon dioxide. J. Supercrit. Fluids 2020, 163, 104875. [Google Scholar] [CrossRef]
- Ardestani, N.S.; Majd, N.Y.; Amani, M. Experimental Measurement and Thermodynamic Modeling of Capecitabine (an Anticancer Drug) Solubility in Supercritical Carbon Dioxide in a Ternary System: Effect of Different Cosolvents. J. Chem. Eng. Data 2020, 65, 4762–4779. [Google Scholar] [CrossRef]
- Amooey, A.A. A simple correlation to predict drug solubility in supercritical carbon dioxide. Fluid Phase Equilib. 2014, 375, 332–339. [Google Scholar] [CrossRef]
- Keshmiri, K.; Vatanara, A.; Yamini, Y. Development and evaluation of a new semi-empirical model for correlation of drug solubility in supercritical CO2. Fluid Phase Equilib. 2014, 363, 18–26. [Google Scholar] [CrossRef]
- Su, C.S.; Chen, Y.P. Correlation for the solubilities of pharmaceutical compounds in supercritical carbon dioxide. Fluid Phase Equilib. 2007, 254, 167–173. [Google Scholar] [CrossRef]
- Faress, F.; Yari, A.; Rajabi Kouchi, F.; Safari Nezhad, A.; Hadizadeh, A.; Sharif Bakhtiar, L.; Naserzadeh, Y.; Mahmoudi, N. Developing an accurate empirical correlation for predicting anti-cancer drugs’ dissolution in supercritical carbon dioxide. Sci. Rep. 2022, 12, 9380. [Google Scholar] [CrossRef] [PubMed]
- Zhu, H.; Zhu, L.; Sun, Z.; Khan, A. Machine learning based simulation of an anti-cancer drug (busulfan) solubility in supercritical carbon dioxide: ANFIS model and experimental validation. J. Mol. Liq. 2021, 338, 116731. [Google Scholar] [CrossRef]
- Baghban, A.; Sasanipour, J.; Zhang, Z. A new chemical structure-based model to estimate solid compound solubility in supercritical CO2. J. CO2 Util. 2018, 26, 262–270. [Google Scholar] [CrossRef]
- Nguyen, H.C.; Alamray, F.; Kamal, M.; Diana, T.; Mohamed, A.; Algarni, M.; Su, C.H. Computational prediction of drug solubility in supercritical carbon dioxide: Thermodynamic and artificial intelligence modeling. J. Mol. Liq. 2022, 354, 118888. [Google Scholar] [CrossRef]
- Wang, T.; Su, C.H. Medium Gaussian SVM, Wide Neural Network and stepwise linear method in estimation of Lornoxicam pharmaceutical solubility in supercritical solvent. J. Mol. Liq. 2022, 349, 118120. [Google Scholar] [CrossRef]
- Sadeghi, A.; Su, C.H.; Khan, A.; Rahman, M.L.; Sarjadi, M.S.; Sarkar, S.M. Machine learning simulation of pharmaceutical solubility in supercritical carbon dioxide: Prediction and experimental validation for busulfan drug. Arab. J. Chem. 2022, 15, 103502. [Google Scholar] [CrossRef]
- Gunturi, S.K.; Sarkar, D. Ensemble machine learning models for the detection of energy theft. Electr. Power Syst. Res. 2021, 192, 106904. [Google Scholar] [CrossRef]
- Mosavi, A.; Hosseini, F.S.; Choubin, B.; Abdolshahnejad, M.; Gharechaee, H.; Lahijanzadeh, A.; Dineva, A.A. Susceptibility prediction of groundwater hardness using ensemble machine learning models. Water 2020, 12, 2770. [Google Scholar] [CrossRef]
- Chen, J.; Zou, Q.; Li, J. DeepM6ASeq-EL: Prediction of human N6-methyladenosine (m6A) sites with LSTM and ensemble learning. Front. Comput. Sci. 2022, 16, 1–7. [Google Scholar] [CrossRef]
- Sodeifian, G.; Razmimanesh, F.; Ardestani, N.S.; Sajadian, S.A. Experimental data and thermodynamic modeling of solubility of Azathioprine, as an immunosuppressive and anti-cancer drug, in supercritical carbon dioxide. J. Mol. Liq. 2020, 299, 112179. [Google Scholar] [CrossRef]
- Suleiman, D.; Estévez, L.A.; Pulido, J.C.; García, J.E.; Mojica, C. Solubility of anti-inflammatory, anti-cancer, and anti-HIV drugs in supercritical carbon dioxide. J. Chem. Eng. Data 2005, 50, 1234–1241. [Google Scholar] [CrossRef]
- Yamini, Y.; Hojjati, M.; Kalantarian, P.; Moradi, M.; Esrafili, A.; Vatanara, A. Solubility of capecitabine and docetaxel in supercritical carbon dioxide: Data and the best correlation. Thermochim. Acta 2012, 549, 95–101. [Google Scholar] [CrossRef]
- Pishnamazi, M.; Zabihi, S.; Jamshidian, S.; Borousan, F.; Hezave, A.Z.; Marjani, A.; Shirazian, S. Experimental and thermodynamic modeling decitabine anti cancer drug solubility in supercritical carbon dioxide. Sci. Rep. 2021, 11, 1075. [Google Scholar] [CrossRef] [PubMed]
- Sodeifian, G.; Sajadian, S.A. Solubility measurement and preparation of nanoparticles of an anticancer drug (Letrozole) using rapid expansion of supercritical solutions with solid cosolvent (RESS-SC). J. Supercrit. Fluids 2018, 133, 239–252. [Google Scholar] [CrossRef]
- Sodeifian, G.; Razmimanesh, F.; Sajadian, S.A. Prediction of solubility of sunitinib malate (an anti-cancer drug) in supercritical carbon dioxide (SC–CO2): Experimental correlations and thermodynamic modeling. J. Mol. Liq. 2020, 297, 105998. [Google Scholar] [CrossRef]
- Pishnamazi, M.; Zabihi, S.; Jamshidian, S.; Borousan, F.; Hezave, A.Z.; Shirazian, S. Thermodynamic modelling and experimental validation of pharmaceutical solubility in supercritical solvent. J. Mol. Liq. 2020, 319, 114120. [Google Scholar] [CrossRef]
- Geurts, P.; Ernst, D.; Wehenkel, L. Extremely randomized trees. Mach. Learn. 2006, 63, 3–42. [Google Scholar] [CrossRef] [Green Version]
- Mishra, G.; Sehgal, D.; Valadi, J.K. Quantitative Structure Activity Relationship study of the Anti-Hepatitis Peptides employing Random Forest and Extra Tree regressors. Bioinformation 2017, 13, 60–62. [Google Scholar] [CrossRef] [PubMed] [Green Version]
- Friedman, J.H. Greedy function approximation: A gradient boosting machine. Ann. Stat. 2001, 29, 1189–1232. [Google Scholar] [CrossRef]
- Sharafati, A.; Asadollah, S.B.H.S.; Hosseinzadeh, M. The potential of new ensemble machine learning models for effluent quality parameters prediction and related uncertainty. Process Saf. Environ. Prot. 2020, 140, 68–78. [Google Scholar] [CrossRef]
- Breiman, L. Random forests. Mach. Learn. 2001, 45, 5–32. [Google Scholar] [CrossRef] [Green Version]
- Shafiq, A.; Çolak, A.B.; Sindhu, T.N.; Lone, S.A.; Alsubie, A.; Jarad, F. Comparative study of artificial neural network versus parametric method in COVID-19 data analysis. Results Phys. 2022, 38, 105613. [Google Scholar] [CrossRef] [PubMed]
- Wang, J.; Ayari, M.A.; Khandakar, A.; Chowdhury, M.E.H.; Zaman, S.M.A.U.; Rahman, T.; Vaferi, B. Estimating the Relative Crystallinity of Biodegradable Polylactic Acid and Polyglycolide Polymer Composites by Machine Learning Methodologies. Polymers 2022, 14, 527. [Google Scholar] [CrossRef]
- Shafiq, A.; Çolak, A.B.; Sindhu, T.N.; Al-Mdallal, Q.M.; Abdeljawad, T. Estimation of unsteady hydromagnetic Williamson fluid flow in a radiative surface through numerical and artificial neural network modeling. Sci. Rep. 2021, 11, 14509. [Google Scholar] [CrossRef]
- Akiba, T.; Sano, S.; Yanase, T.; Ohta, T.; Koyama, M. Optuna: A Next-generation Hyperparameter Optimization Framework. In Proceedings of the ACM SIGKDD International Conference on Knowledge Discovery and Data Mining, Anchorage, AK, USA, 4–8 August 2019; pp. 2623–2631. [Google Scholar]
- Zhu, X.; Khosravi, M.; Vaferi, B.; Nait Amar, M.; Ghriga, M.A.; Mohammed, A.H. Application of machine learning methods for estimating and comparing the sulfur dioxide absorption capacity of a variety of deep eutectic solvents. J. Clean. Prod. 2022, 363, 132465. [Google Scholar] [CrossRef]


| Anticancer Drug | Pressure | Temperature | CO2 Density | Drug Solubility | No. of Data | Ref. |
|---|---|---|---|---|---|---|
| bar | °C | kg/m3 | Mole Fraction | |||
| Sunitinib malate | 120–270 | 35–65 | 388–914 | 5.00 × 10⁻⁶–8.56 × 10⁻⁵ | 24 | [23] |
| Busulfan | 120–400 | 35–65 | 383–971 | 3.27 × 10⁻⁵–8.65 × 10⁻⁴ | 32 | [24] |
| Tamsulosin | 120–270 | 35–65 | 384–914 | 1.80 × 10⁻⁷–1.01 × 10⁻⁵ | 24 | [28] |
| Azathioprine | 120–270 | 35–65 | 388–914 | 2.70 × 10⁻⁶–1.83 × 10⁻⁵ | 24 | [42] |
| Paclitaxel | 100–275 | 35–55 | 654–915 | 1.20 × 10⁻⁶–6.20 × 10⁻⁶ | 21 | [43] |
| 5-Fluorouracil | 125–250 | 35–55 | 541–901 | 3.80 × 10⁻⁶–1.46 × 10⁻⁵ | 18 | [43] |
| Thymidine | 100–300 | 35–55 | 325–928 | 1.20 × 10⁻⁶–8.00 × 10⁻⁶ | 25 | [43] |
| Capecitabine | 152–354 | 35–75 | 477–955 | 2.70 × 10⁻⁶–1.59 × 10⁻⁴ | 35 | [44] |
| Decitabine | 120–400 | 35–65 | 383–971 | 2.84 × 10⁻⁵–1.07 × 10⁻³ | 32 | [45] |
| Letrozole | 120–360 | 45–75 | 319–922 | 1.60 × 10⁻⁶–8.51 × 10⁻⁵ | 20 | [46] |
| Sorafenib tosylate | 120–270 | 35–65 | 388–914 | 6.80 × 10⁻⁷–1.26 × 10⁻⁵ | 24 | [47] |
| Tamoxifen | 120–400 | 35–65 | 383–971 | 1.88 × 10⁻⁵–9.89 × 10⁻⁴ | 32 | [48] |
| Anticancer Drug | Molecular Weight | Molecular Structure |
|---|---|---|
| 5-Fluorouracil | 130 |  |
| Azathioprine | 277.26 |  |
| Busulfan | 246.3 |  |
| Capecitabine | 359.35 |  |
| Decitabine | 228.21 |  |
| Letrozole | 285.3 |  |
| Paclitaxel | 854 |  |
| Sorafenib tosylate | 637.03 |  |
| Sunitinib malate | 532.56 |  |
| Tamoxifen | 371.51 |  |
| Tamsulosin | 408.05 |  |
| Thymidine | 242 |  |
| Base Learner Model | Subgroup | AARD% | MAE | RAE% | MSE | R2 |
|---|---|---|---|---|---|---|
| Extra tree | Internal | 11.52 | 9.21 × 10⁻⁶ | 7.71 | 1.19 × 10⁻⁹ | 0.98283 |
| External | 37.44 | 2.58 × 10⁻⁵ | 22.85 | 2.36 × 10⁻⁹ | 0.95534 | |
| All data | 16.77 | 1.26 × 10⁻⁵ | 10.63 | 1.43 × 10⁻⁹ | 0.97838 | |
| Gradient boosting | Internal | 21.04 | 1.57 × 10⁻⁵ | 13.13 | 1.40 × 10⁻⁹ | 0.97898 |
| External | 43.07 | 2.48 × 10⁻⁵ | 21.99 | 1.97 × 10⁻⁹ | 0.95756 | |
| All data | 25.50 | 1.75 × 10⁻⁵ | 14.82 | 1.52 × 10⁻⁹ | 0.97560 | |
| Random forest | Internal | 20.27 | 1.50 × 10⁻⁵ | 12.53 | 1.54 × 10⁻⁹ | 0.98354 |
| External | 44.29 | 2.51 × 10⁻⁵ | 22.20 | 2.51 × 10⁻⁹ | 0.94926 | |
| All data | 25.14 | 1.70 × 10⁻⁵ | 14.38 | 1.73 × 10⁻⁹ | 0.97844 |
| AI Scenario | Subgroup | AARD% | MAE | RAE% | MSE | R2 |
|---|---|---|---|---|---|---|
| Stacked model | Internal | 9.46 | 3.18 × 10⁻¹¹ | 2.66 | 1.51 × 10⁻²⁰ | 0.99791 |
| External | 5.35 | 1.62 × 10⁻¹¹ | 1.44 | 2.66 × 10⁻²¹ | 0.99946 | |
| All data | 8.62 | 2.86 × 10⁻⁶ | 2.42 | 1.26 × 10⁻¹⁰ | 0.99809 |
| Drug | Model | R2 | Reference |
|---|---|---|---|
| Decitabine | Adaptive neuro-fuzzy inference systems | 0.99663 | [36] |
| Stacked model | 0.99508 | This work | |
| Busulfan | Support vector machines | 0.98327 | [38] |
| Stacked model | 0.99054 | This work |
| Information | Dependent–Independent Pairs | |||
|---|---|---|---|---|
| Pearson coefficient | −0.248 | 0.295 | 0.204 | 0.617 |
| Direction of relationship | Indirect | Direct | Direct | Direct |
| Importance | Third | Second | Fourth | First |
Publisher’s Note: MDPI stays neutral with regard to jurisdictional claims in published maps and institutional affiliations. |
© 2022 by the authors. Licensee MDPI, Basel, Switzerland. This article is an open access article distributed under the terms and conditions of the Creative Commons Attribution (CC BY) license (https://creativecommons.org/licenses/by/4.0/).
Share and Cite
Najmi, M.; Ayari, M.A.; Sadeghsalehi, H.; Vaferi, B.; Khandakar, A.; Chowdhury, M.E.H.; Rahman, T.; Jawhar, Z.H. Estimating the Dissolution of Anticancer Drugs in Supercritical Carbon Dioxide with a Stacked Machine Learning Model. Pharmaceutics 2022, 14, 1632. https://0-doi-org.brum.beds.ac.uk/10.3390/pharmaceutics14081632
Najmi M, Ayari MA, Sadeghsalehi H, Vaferi B, Khandakar A, Chowdhury MEH, Rahman T, Jawhar ZH. Estimating the Dissolution of Anticancer Drugs in Supercritical Carbon Dioxide with a Stacked Machine Learning Model. Pharmaceutics. 2022; 14(8):1632. https://0-doi-org.brum.beds.ac.uk/10.3390/pharmaceutics14081632
Chicago/Turabian StyleNajmi, Maryam, Mohamed Arselene Ayari, Hamidreza Sadeghsalehi, Behzad Vaferi, Amith Khandakar, Muhammad E. H. Chowdhury, Tawsifur Rahman, and Zanko Hassan Jawhar. 2022. "Estimating the Dissolution of Anticancer Drugs in Supercritical Carbon Dioxide with a Stacked Machine Learning Model" Pharmaceutics 14, no. 8: 1632. https://0-doi-org.brum.beds.ac.uk/10.3390/pharmaceutics14081632